
Integration of Optical and SAR Data for Burned Area Mapping in Mediterranean Regions


 , , ,
, , ,  ,
,  , and
, and
Abstract
:
1. Introduction
2. Study Area
3. Datasets and Pre-Processing
3.1. Landsat TM Images


| Path/Row | Acquisition Date | Forest Cover (%) |
|---|---|---|
| 203/032 | 8 October 2003 | 28% |
| 203/033 | 9 June 2003 | 43% |
| 203/034 | 24 October 2003 | 26% |
| 204/032 | 12 August 2003 | 19% |
| 204/033 | 12 August 2003 | 28% |
3.2. ENVISAT-ASAR Images
| Frame | Track | Orbit | Name | Acquisition Date | Pass | Cumulated Precipitation * (mm) |
|---|---|---|---|---|---|---|
| 2498 | 452 | 5516 | s1 | 21 March 2003 | Descending | 1.76 |
| 2494 | 452 | 5516 | s2 | 21 March 2003 | Descending | 14.36 |
| 2492 | 316 | 6883 | s3 | 24 June 2003 | Ascending | 0.0 |
| 2493 | 316 | 6883 | s4 | 24 June 2003 | Ascending | 0.0 |
| 2499 | 316 | 6883 | s5 | 24 June 2003 | Ascending | 0.03 |
| 2454 | 452 | 5516 | s6 | 21 March 2003 | Descending | 0.14 |
| 3775 | 180 | 6246 | s7 | 11 May 2003 | Descending | 0.0 |
| 1377 | 87 | 6153 | s8 | 04 May 2003 | Ascending | 0.11 |
| 2497 | 316 | 6883 | s9 | 24 June 2003 | Ascending | 0.0 |
| 2496 | 452 | 9023 | s1 | 21 November 2003 | Descending | 0.15 |
| 2497 | 452 | 9023 | s2 | 21 November 2003 | Descending | 0.28 |
| 2489 | 316 | 9388 | s3 | 16 December 2003 | Ascending | 0.27 |
| 2490 | 316 | 9388 | s4 | 16 December 2003 | Ascending | 0.67 |
| 2491 | 316 | 9388 | s5 | 16 December 2003 | Ascending | 0.68 |
| 2495 | 452 | 9023 | s6 | 21 November 2003 | Descending | 0.31 |
| 3774 | 180 | 7749 | s7 | 24 August 2003 | Descending | 0.06 |
| 1380 | 87 | 8658 | s8 | 16 October 2003 | Ascending | 8.26 |
| 2498 | 316 | 9388 | s9 | 16 December 2003 | Ascending | 0.21 |


3.3. Ancillary Data
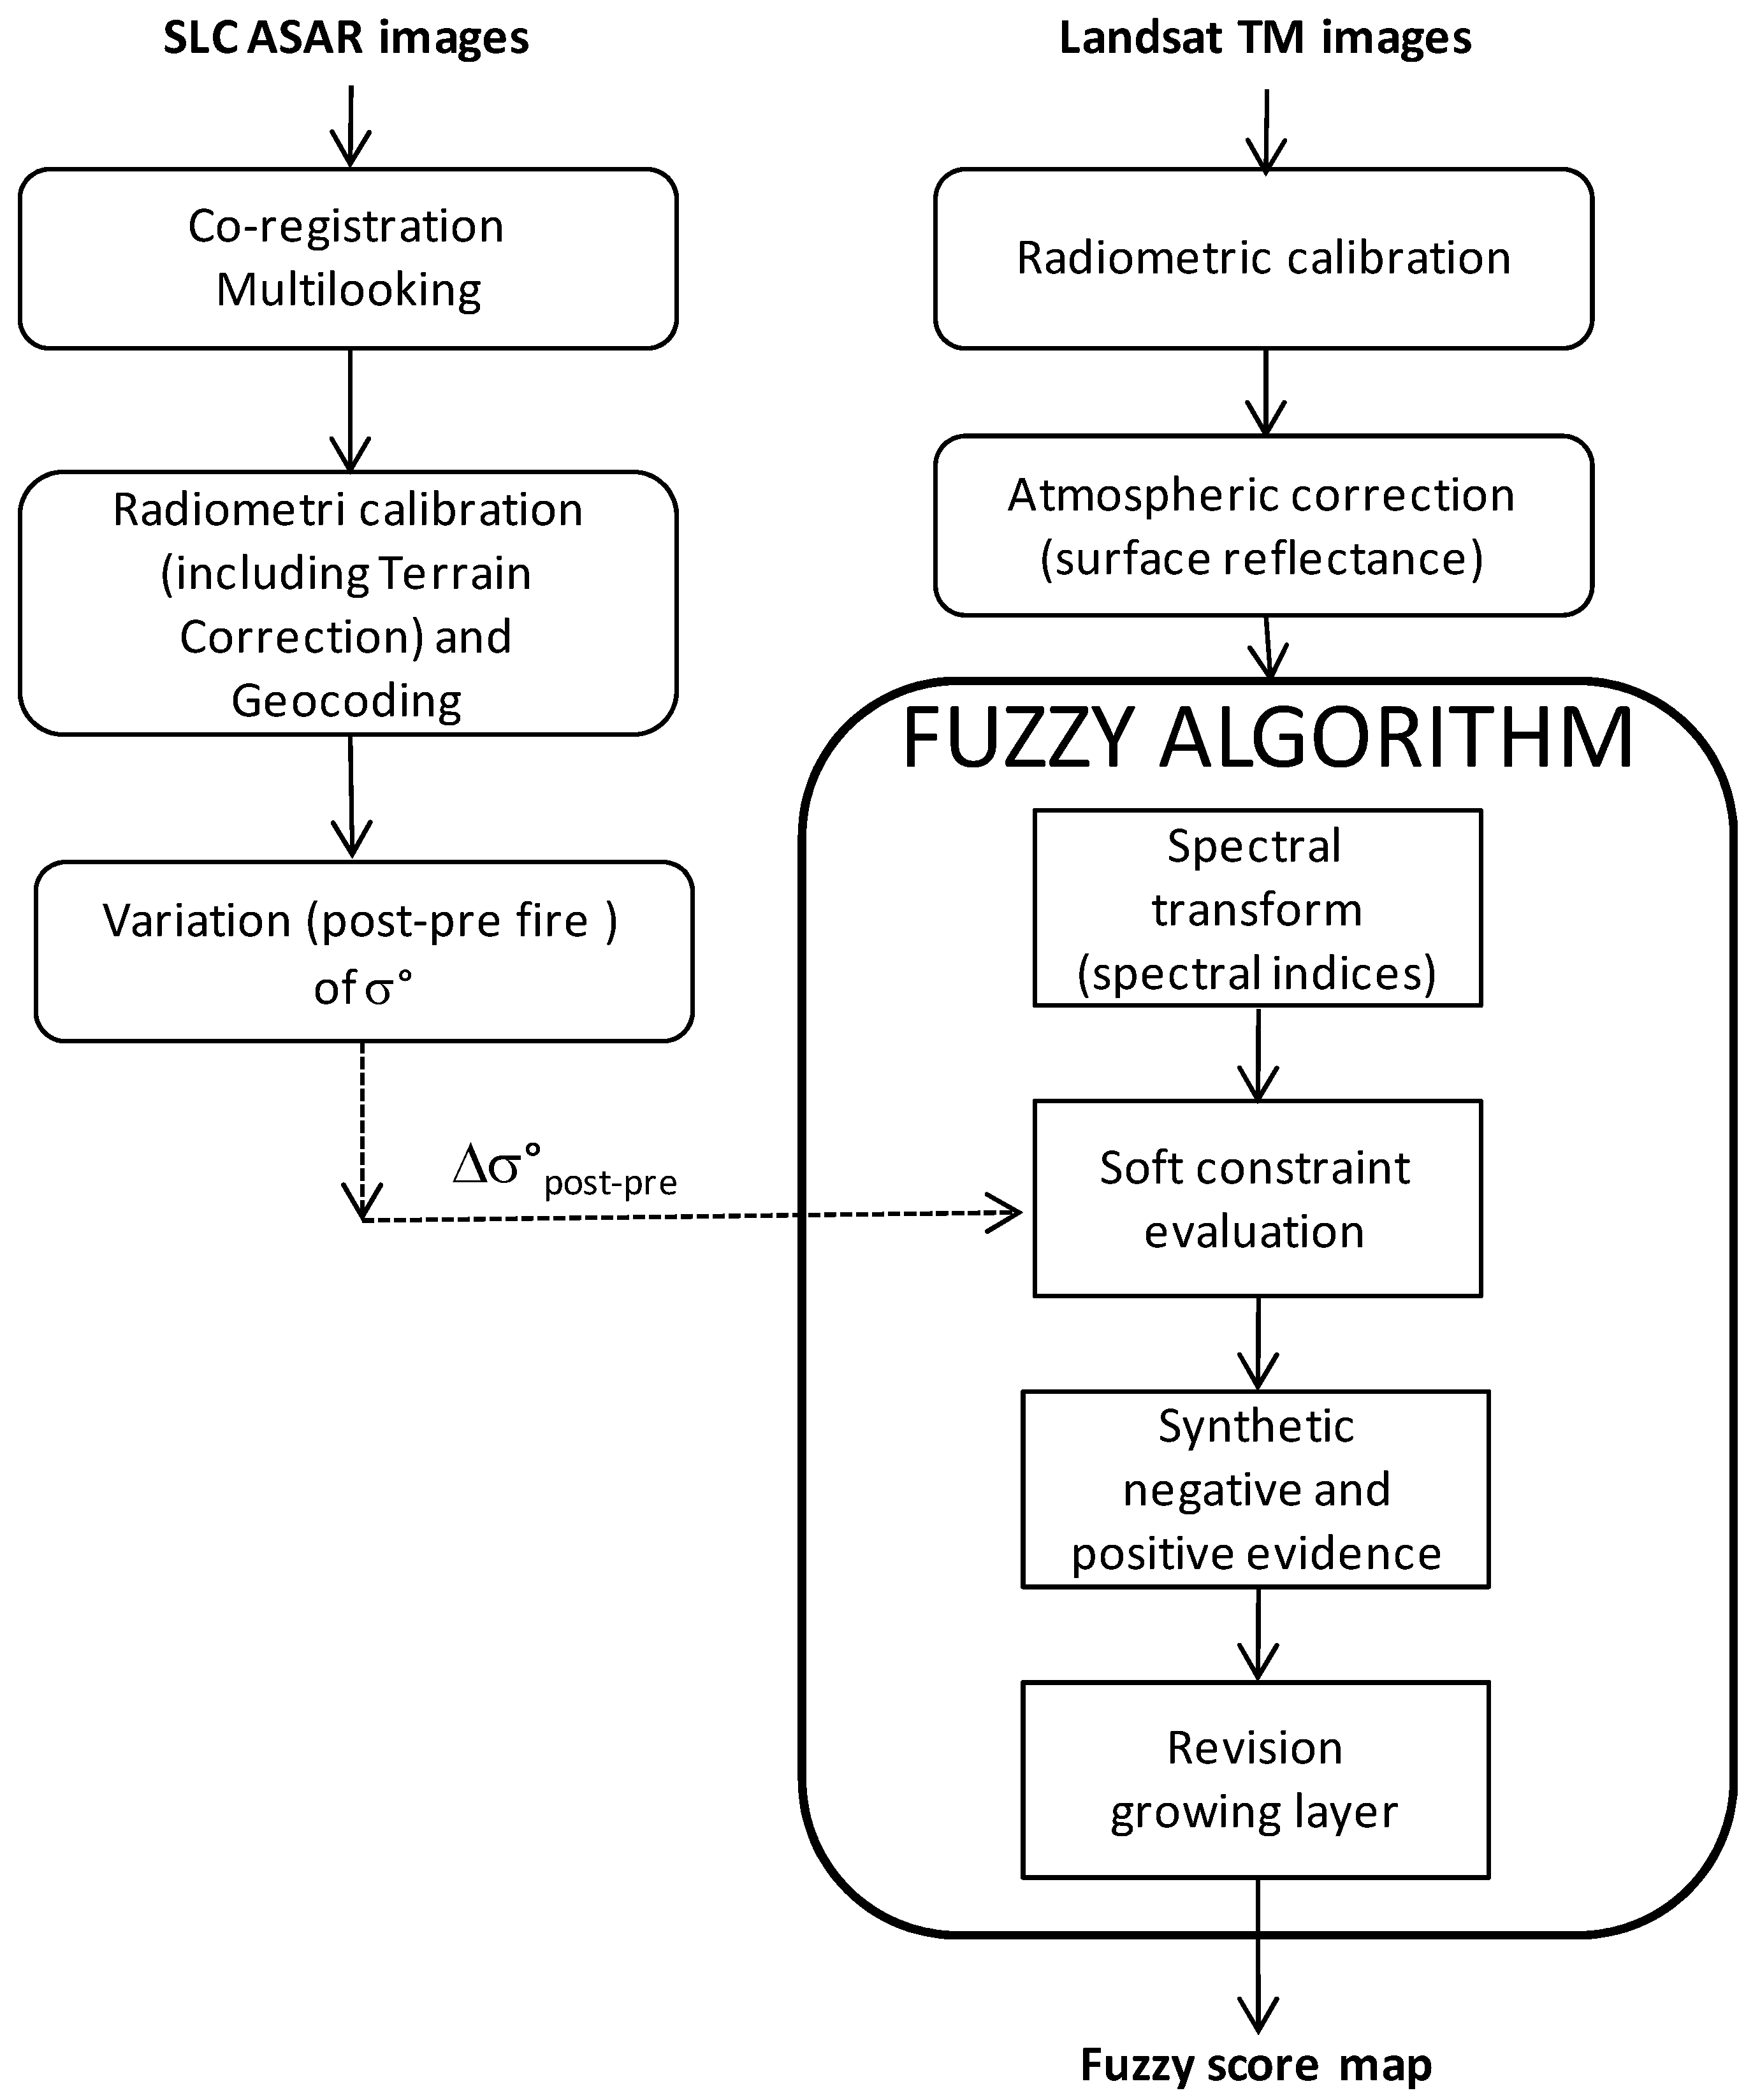
4. Methods
4.1. Membership Function of the Fuzzy Sets for σ° Variation
| Index Name | Formula | Reference |
|---|---|---|
| Char Soil Index | [60] | |
| Enhanced Vegetation Index | [61] | |
| Two-band EVI | [62] | |
| Mid-Infrared Burn Index | [63] | |
| Normalized Burn Ratio | [64] | |
| Normalized Burn Ratio 2 | [64] | |
| Normalized Difference Vegetation Index | [65] | |
| Soil Adjusted Vegetation Index | [66] |
4.2. Integration of the SAR Membership Function of the Fuzzy Sets for ∆σ°
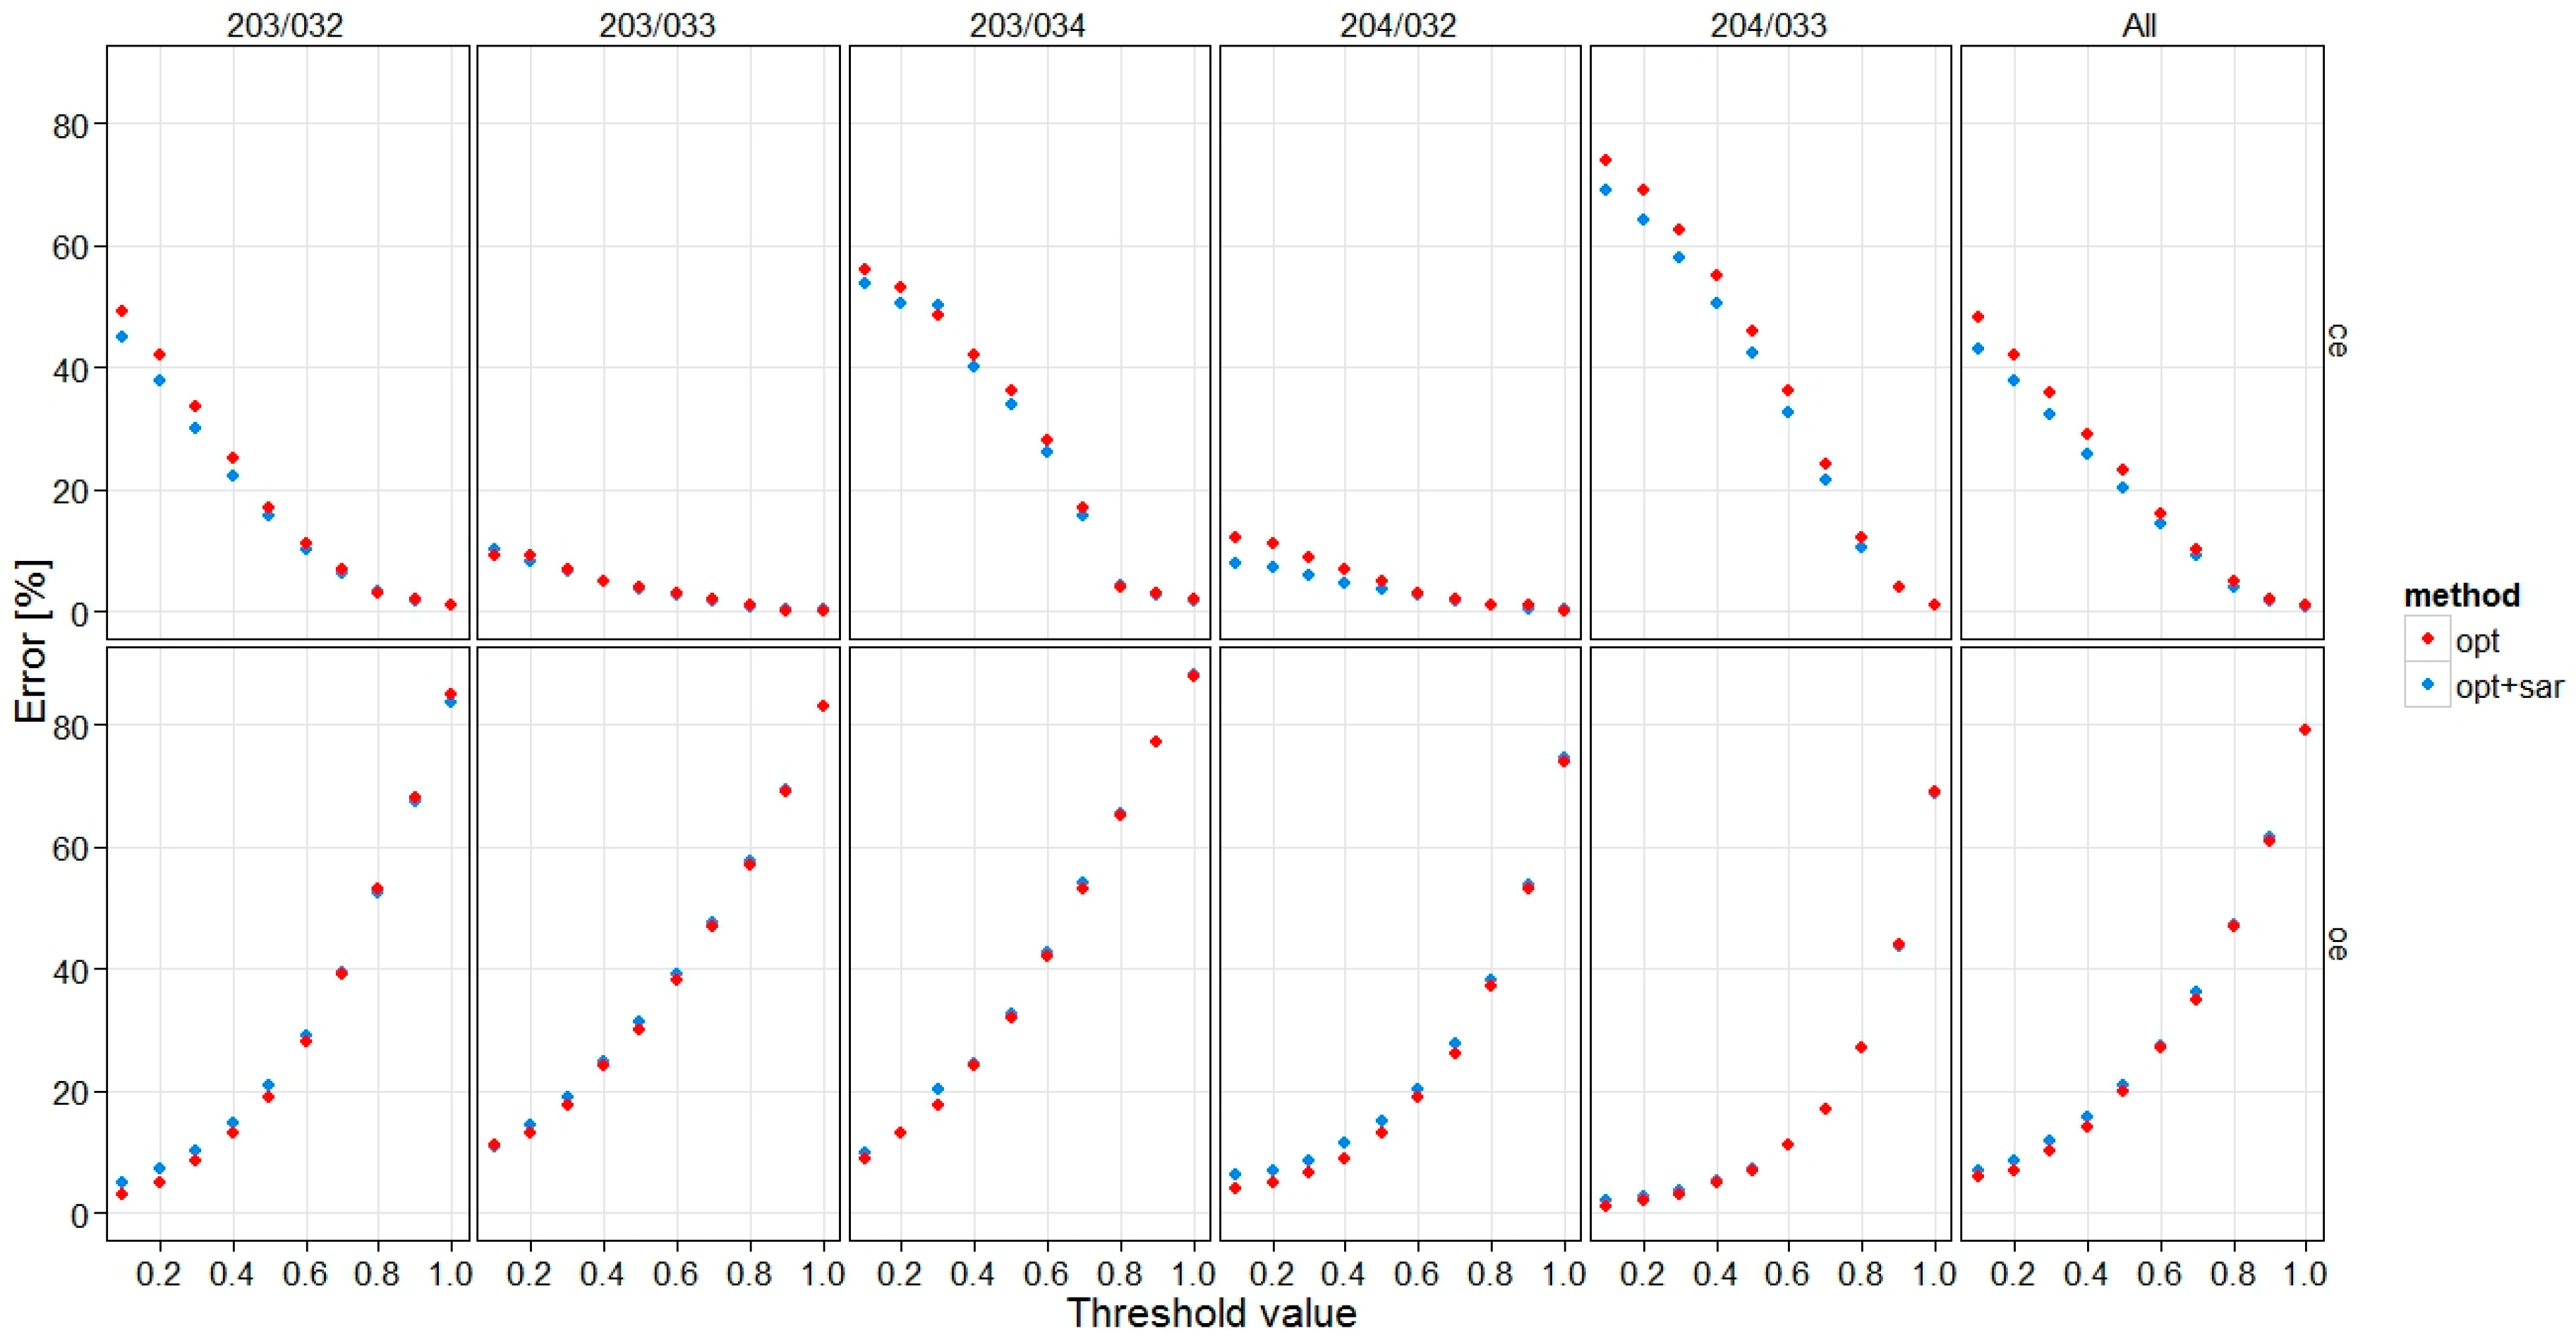
4.3. Accuracy Assessment
5. Results and Discussion
5.1. Backscattering Variation over Unburned and Burned Areas

| Class | s1 | s2 | s3 | s4 | s5 | s6 | s7 | s8 | s9 | Average |
|---|---|---|---|---|---|---|---|---|---|---|
| Soil | 0.59 (320) | 0.79 (376) | 0.56 (812) | 0.97 (752) | 1.16 (782) | 0.90 (866) | 0.45 (404) | 0.20 (614) | 0.06 (1049) | 0.63 |
| Urban | 0.98 (95) | 1.15 (454) | 0.90 (725) | 1.29 (942) | 1.11 (867) | 1.11 (717) | 0.51 (377) | 0.87 (617) | 1.33 (1088) | 1.03 |
| Vegetation | 1.33 (428) | 1.19 (290) | 0.88 (783) | 1.07 (915) | 1.18 (952) | 1.34 (940) | 0.66 (409) | 1.03 (660) | 0.78 (1134) | 1.05 |
| Burned | (1311) | (342) | (830) | (864) | (823) | (941) | (382) | (622) | (1064) | - |

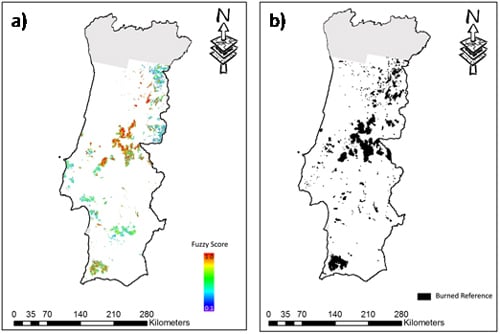
5.2. Fuzzy Burned Area Maps


5.3. The Role of SAR Data within the Integrated Framework


6. Conclusions
Acknowledgments
Author Contributions
Conflicts of Interest
References
- Moreira, F.; Viedma, O.; Arianoutsou, M.; Curt, T.; Koutsias, N.; Rigolot, E.; Barbati, A.; Corona, P.; Vaz, P.; Xanthopoulos, G.; et al. Landscape—Wildfire interactions in southern Europe: Implications for landscape management. J. Environ. Manag. 2011, 92, 2389–2402. [Google Scholar] [CrossRef] [Green Version]
- Kasischke, E.S.; French, N.H.F.; Harrell, P.; Christensen, N.L., Jr.; Ustin, S.L.; Barry, D. Monitoring of wildfires in boreal forests using large area AVHRR NDVI composite image data. Remote Sens. Environ. 1993, 45, 61–71. [Google Scholar] [CrossRef]
- Pereira, J.M.C.; Chuvieco, E.; Karteris, M.; Sousa, A.; Mertìn, P.; Koutsias, N. Burnt area mapping in southern Europe using NOAA_AVHRR 1 km satellite mapping burned areas using SMA 661 imagery. In Proceedings of the 3rd International Conference of Forest Fire Research, Coimbra, Portugal, 16–20 November 1998; Volume I, pp. 2667–2677.
- Barbosa, P.M.; Grégoire, J.-M.; Pereira, J.M.C. An algorithm for extracting burned areas from time series of AVHRR GAC data applied at a continental scale. Remote Sens. Environ. 1999, 69, 253–263. [Google Scholar] [CrossRef]
- Chuvieco, E.; Martín, M.P.; Palacios, A. Assessment of different spectral indices in the red-near-infrared spectral domain for burned land discriminations. Int. J. Remote Sens. 2002, 23, 5103–5110. [Google Scholar] [CrossRef]
- Mitri, G.H.; Gitas, I.Z. A semi-automated object-oriented model for burned area mapping in the Mediterranean region using Landsat-TM imagery. Int. J. Wildland Fire 2004, 13, 367–376. [Google Scholar] [CrossRef]
- Quintano, C.; Fernández-Manso, A.; Fernández-Manso, O.; Shimabukuro, Y.E. Mapping burned areas in Mediterranean countries using spectral mixture analysis from uni-temporal perspective. Int. J. Remote Sens. 2006, 27, 645–662. [Google Scholar] [CrossRef]
- Bastarrika, A.; Chuvieco, E.; Martin, M.P. Mapping burned areas from Landsat TM/ETM+ data with a two-phase algorithm: Balancing omission and commission errors. Remote Sens. Environ. 2011, 115, 1003–1012. [Google Scholar] [CrossRef]
- Tansey, K.; Grégoire, J-M.; Stroppiana, D.; Sousa, A.; Silva, J.; Pereira, J.M.C.; Boschetti, L.; Maggi, M.; Brivio, P.A.; Fraser, R.; et al. Vegetation burning in the year 2000: Global burned area estimates from SPOT vegetation data. J. Geophys. Res. 2004, 109, D14S03. [Google Scholar] [CrossRef]
- Stroppiana, D.; Grégoire, J-M.; Pereira, J.M.C. The use of SPOT VEGETATION data in a classification tree approach for burnt area mapping in Australian savanna. Int. J. Remote Sens. 2003, 24. [Google Scholar] [CrossRef]
- Roy, D.P.; Boschetti, L.; Justice, C.O.; Ju, J. The collection 5 MODIS burned area product—Global evaluation by comparison with the MODIS active fire product. Remote Sens. Environ. 2008, 112, 3690–3707. [Google Scholar] [CrossRef]
- Roberts, G.M.; Wooster, J.; Lagoudakis, E. Annual and diurnal african biomass burning temporal dynamics. Biogeosciences 2006, 6, 849–866. [Google Scholar] [CrossRef]
- Prins, E.; Schmetz, J.; Flynn, L.; Hillger, D.; Feltz, J. Overview of current and future diurnal active fire monitoring using a suite of international geostationary satellites. In Global and Regional Wildfire Monitoring: Current Status and Future Plans; Ahern, F.J., Goldammer, J.G., Justice, C.O., Eds.; SPB Academic Publishing: The Hague, The Netherlands, 2001; pp. 145–170. [Google Scholar]
- Pereira, J.M.C.; Sá, A.C.L.; Sousa, A.M.O.; Silva, J.M.N.; Santos, T.N.; Carreiras, J.M.B. Spectral characterization and discrimination of burnt areas. In Remote Sensing of Large Wildfires in the European Mediterranean Basin; Chuvieco, E., Ed.; Springer-Verlag: Berlin, Germany, 1999; pp. 123–138. [Google Scholar]
- Bourgeau-Chavez, L.L.; Kasischke, E.S.; Brunzell, S.; Mudd, J.P.; Tukman, M. Mapping fire scars in global boreal forests using imaging radar data. Int. J. Remote Sens. 2002, 23, 4211–4234. [Google Scholar]
- Liew, S.C.; Kwoh, L.K.; Padmanabhan, K.; Lim, O.K.; Lim, H. Delineating land/forest fire burnt scars with ERS interferometric synthetic aperture radar. Geophys. Res. Lett. 1999, 26, 2409–2412. [Google Scholar] [CrossRef]
- Siegert, F.; Hoffmann, A.A. The 1998 Forest Fires in East Kalimantan (Indonesia): A quantitative evaluation using high resolution, multitemporal ERS-2 SAR images and NOAA-AVHRR Hotspot data. Remote Sens. Environ. 2000, 72, 64–77. [Google Scholar] [CrossRef]
- Minchella, A.; del Frate, F.; Capogna, F.; Anselmi, S.; Manes, F. Use of multitemporal SAR data for monitoring vegetation recovery of Mediterranean burned areas. Remote Sens. Environ. 2009, 113, 588–597. [Google Scholar] [CrossRef]
- Tanase, M.; de la Riva, J.; Santoro, M.; Pérez-Cabello, F.; Kasischke, E. Sensitivity of SAR data to post-fire forest regrowth in Mediterranean and boreal forests. Remote Sens. Environ. 2011, 115, 2075–2085. [Google Scholar] [CrossRef]
- French, N.H.F.; Kasischke, E.S.; Bourgeau-Chavez, L.L.; Harrell, P.A. Sensitivity of ERS-1 SAR to variations in soil water in fire-disturbed boreal forest ecosystems. Int. J. Remote Sens. 1996, 17, 3037–3053. [Google Scholar] [CrossRef]
- Kasischke, E.S.; Bourgeau-Chavez, L.L.; French, N.H.F. Observations of variations in ERS-1 SAR image intensity associated with forest fires in Alaska. IEEE Trans. Geosci. Remote Sens. 1994, 32, 206–210. [Google Scholar] [CrossRef]
- Kasischke, E.S.; French, N.H.F.; Bourgeau-Chavez, L.L. Monitoring of the effects of fire in North American boreal forests using ERS SAR imagery. In Proceedings of the Third ERS Symposium on Space at the Service of Our Environment, Florence, Italy, 17–21 March 1997; pp. 363–368.
- Gimeno, M.; san-Miguel-Ayanz, J. Evaluating of RADARSAT-1 data for identification of burnt areas in Southern Europe. Remote Sens. Environ. 2004, 92, 370–375. [Google Scholar] [CrossRef]
- Gimeno, M.; san-Miguel-Ayanz, J.; Schmuck, G. Identification of burnt areas in Mediterranean forest environments from ERS-2 SAR time series. Int. J. Remote Sens. 2004, 25, 4873–4888. [Google Scholar] [CrossRef]
- Tanase, M.A.; Santoro, M.; de la Riva, J.; Pérez-Cabello, F.; le Toan, T. Sensitivity of X-, C-, and L-Band SAR backscatter to burn severity in Mediterranean pine forests. IEEE Trans. Geosci. Remote Sens. 2010, 48, 3663–3675. [Google Scholar] [CrossRef]
- Tanase, M.A.; Santoro, M.; Aponte, C.; de la Riva, J. Polarimetric properties of burned forest areas at C- and L-Band. IEEE J. Sel. Top. Appl. Earth Obs. Remote Sens. 2014, 7, 267–276. [Google Scholar] [CrossRef]
- Polychronaki, A.; Gitas, I.Z.; Veraverbeke, S.; Debien, A. Evaluation of ALOS PALSAR imagery for burned area mapping in Greece using object-based classification. Remote Sens. 2013, 5, 5680–5701. [Google Scholar] [CrossRef]
- Bourgeau-Chavez, L.L.; Harrell, P.A.; Kasischke, E.S.; French, N.H.F. The detection and mapping of Alaskan wildfires using a spaceborne imaging radar system. Int. J. Remote Sens. 1997, 18, 355–373. [Google Scholar] [CrossRef]
- French, N.H.F.; Bourgeau-Chavez, L.L.; Wang, Y.; Kasischke, E.S. Initial observations of Radarsat imagery at fire-disturbed sites in interior Alaska. Remote Sens. Environ. 1999, 68, 89–64. [Google Scholar] [CrossRef]
- Ulaby, F.T.; Moore, R.K.; Fung, A.K. Microwave Remote Sensing; Addison-Wesley: Reading, MA, USA, 1982. [Google Scholar]
- Voronovich, A.G. Wave Scattering from Rough Surfaces,Springer Series on Wave Phenomena; Springer: New York, NY, USA, 1994. [Google Scholar]
- Fung, A.K. Microwave Scattering and Emission. Models and Their Application; Artech House: Norwood, MA, USA, 1994. [Google Scholar]
- Tsang, L.; Kong, J.A.; Shin, R.T. Theory of Microwave Remote Sensing; Wiley: New York, NY, USA, 1985. [Google Scholar]
- Bass, F.G.; Fuks, I.M. Wave Scattering from Statistically Rough Surfaces; Oxford: Pergamon, Greek, 1979. [Google Scholar]
- Ishimaru, A. Wave Propagation and Scattering in Random Media; Academic: New York, NY, USA, 1993. [Google Scholar]
- Luckman, A.J. The effects of topography on mechanism of radar backscatter from coniferous forest and upland pasture. IEEE Trans. Geosci. Remote Sens. 1998, 36, 1830–1834. [Google Scholar] [CrossRef]
- Holecz, F.; Wegmuler, U.; Rignot, E.; Wang, Y. Observed radar backscatter from forested areas with terrain variations. In Proceedings of the 1995 Quantitative Remote Sensing for Science and Applications,International Geoscience and Remote Sensing Symposium, Firenze, Italy, 10–14 July 1995; pp. 613–615.
- Bourgeau-Chavez, L.L.; Kasischke, E.S.N.H.; French, F.L.; Szeto, H.; Kherkher, C.M. Using ERS-1 SAR imagery to monitor variations in burn severity in an Alaskan fire-disturbed boreal forest ecosystem. In Proceedings of the 1994 Surface and Atmospheric Remote Sensing: Technologies, Data Analysis and Interpretation, International Geoscience and Remote Sensing Symposium, Pasadena, CA, USA, 8–12 August 1994; Volume 1, pp. 243–245.
- Van Zyl, J.J. The effect of topography on radar scattering from vegetated areas. IEEE Trans. Geosci. Remote Sens. 1993, 31, 153–160. [Google Scholar] [CrossRef]
- O’Grady, D.; Leblanc, M.; Gillieson, D. Relationship of local incidence angle with satellite radar backscatter for different surface conditions. Int. J. Appl. Earth Obs. Geoinf. 2013, 24, 42–53. [Google Scholar] [CrossRef]
- Menges, C.H.; Bartolo, R.E.; Bell, D.; Hill, G.J.E. The effect of savanna fires on SAR backscatter in northern Australia. Int. J. Remote Sens. 2004, 25, 4857–4871. [Google Scholar] [CrossRef]
- Siegert, F.; Ruecker, G. Use of multitemporal ERS-2 SAR images for identification of burned scars in south-east Asian tropical rainforest. Int. J. Remote Sens. 2000, 21, 831–837. [Google Scholar]
- Goodenough, D.G.; Chen, H.; Richardson, A.; Cloude, S.; Hong, W.; Li, Y. Mapping fire scars using Radarsat-2 polarimetric SAR data. Can. J. Remote Sens. 2011, 37, 500–509. [Google Scholar]
- Kalogirou, V.; Ferrazzoli, P.; Della Vecchia, A.; Foumelis, M. On the SAR backscatter of burned forests: A model-based study in C-Band, over burned pine canopies. IEEE Trans. Geosci. Remote Sens. 2014, 52, 6205–6215. [Google Scholar] [CrossRef]
- Bernhard, E.-M.; Twele, A.; Gähler, M. Burnt area mapping in the European-Mediterranean: SAR backscatter change analysis and synergistic use of optical and SAR data. In Proceedings of the 2012 International Geoscience and Remote Sensing Symposium, Munich, Germany, 22–27 July 2012; pp. 2141–2143.
- Boschetti, M.; Stroppiana, D.; Brivio, P.A. Mapping burned areas in a Mediterranean environment using soft integration of Spectral Indices from high-resolution satellite images. Earth Interact. 2010, 14, 1–20. [Google Scholar]
- Stroppiana, D.; Bordogna, G.; Carrara, P.; Boschetti, M.; Boschetti, L.; Brivio, P.A. A method for extracting burned areas from Landsat TM/ETM+ images by soft aggregation of multiple Spectral Indices and a region growing algorithm. ISPRS J. Photogramm. Remote Sens. 2012, 69, 88–102. [Google Scholar] [CrossRef]
- Pereira, M.G.; Trigo, R.M.; da Camara, C.C.; Pereira, J.M.C.; Leite, S.M. Synoptic patterns associated with large summer forest fires in Portugal. Agr. For. Meteorol. 2005, 129, 11–25. [Google Scholar] [CrossRef]
- Costa, L.; Thonicke, K.; Poulter, B.; Badeck, F.W. Sensitivity of Portuguese forest fires to climatic, human, and landscape variables: Subnational differences between fire drivers in extreme fire years and decadal averages. Reg. Environ. Chang. 2011, 11, 543–551. [Google Scholar] [CrossRef]
- Oliveira, S.L.J.; Pereira, J.M.C.; Carreiras, J.M.B. Fire frequency analysis in Portugal (1975–2005), using Landsat-based burnt area maps. Int. J. Wildland Fire 2012, 21, 48–60. [Google Scholar] [CrossRef]
- Pereira, J.M.C.; Carreiras, J.M.B.; Silva, J.M.N.; Vasconcelos, M.J.P. Alguns conceitos básicos sobre os fogos rurais em Portugal. In Em Incêndios Florestais em Portugal: Caracterização, Impactes e Prevenção; Pereira, J.S., Pereira, J.M.C., Rego, F., Silva, J.M.N., Silva, T.P., Eds.; ISA Press: Lisbon, Portugal, 2006; pp. 133–162. [Google Scholar]
- Corine Land Cover Map 2006. Available online: http://www.eea.europa.eu/data-and-maps (accessed on 23 January 2015).
- USGS Glovis Archive. Available online: http://glovis.usgs.gov (accessed on 23 January 2015).
- Vermote, E.F.; el Saleous, N.; Justice, C.O.; Kaufman, Y.J.; Privette, J.L.; Remer, L.; Roger, J.C.; Tanré, D. Atmospheric correction of visible to middle-infrared EOS-MODIS data over land surfaces: Background, operational algorithm, and validation. J. Geophys. Res. 1997, 102, 17131–17141. [Google Scholar] [CrossRef]
- Franceschetti, G.; Lanari, R. Synthetic Aperture Radar Processing; CRC Press: Boca Raton, FL, USA, 1999. [Google Scholar]
- Small, D.; Schubert, A.; Rosich, B.; Meier, E. Geometric and radiometric correction of ESA SAR products. In Proceedings of the ENVISAT Symposium 2007, Montreux, Switzerland, 23–27 April 2007.
- Azar, R.; Stroppiana, D.; Boschetti, M.; Brivio, P.A.; Pepe, A.; Paglia, L.; Calò, F.; Lanari, R. Integration of optical and SAR remotely sensed data for monitoring wildfires in Mediterranean forests. Proc. SPIE 2012. [Google Scholar] [CrossRef]
- Pereira, J.M.C.; Santos, M.T.N. Fire Risk and Burned Area Mapping in Portugal; Direcção-Geral das Florestas: Lisbon, Portugal, 2003. [Google Scholar]
- Stroppiana, D.; Boschetti, M.; Zaffaroni, P.; Brivio, P.A. Analysis and interpretation of spectral indices for soft multi-criteria burned area mapping in Mediterranean regions. IEEE Geosci. Remote Sens. Lett. 2009, 6, 499–503. [Google Scholar] [CrossRef]
- Smith, A.M.S.; Drake, N.A.; Wooster, M.J.; Hudak, A.T.; Holden, Z.A.; Gibbons, C.J. Production of Landsat ETM+ reference imagery of burned areas within Southern Africa savannahs: Comparison of methods and application to MODIS. Int. J. Remote Sens. 2007, 28, 2753–2775. [Google Scholar] [CrossRef]
- Huete, A.; Didan, K.; Miura, T.; Rodriguez, E.P.; Gao, X.; Ferreira, L.G. Overview of the radiometric and biophysical performance of the MODIS vegetation indices. Remote Sens. Environ. 2002, 83, 195–213. [Google Scholar] [CrossRef]
- Jiang, Z.; Heute, A.R.; Didan, K.; Miura, T. Development of a two-band enhanced vegetation index without a blue band. Remote Sens. Environ. 2008, 112, 3833–3845. [Google Scholar] [CrossRef]
- Trigg, S.; Flasse, S. An evaluation of different bi-spectral spaces for discriminating burned shrub savanna. Int. J. Remote Sens. 2001, 22, 2641–2647. [Google Scholar] [CrossRef]
- Key, C.H.; Benson, N.C. Measuring and remote sensing of burn severity: The CBI and NBR. In Proceedings of the 1999 Joint Fire Science Conference and Workshop, Boise, Idaho, 15–17 July 1999.
- Rouse, J.W.; Haas, R.H.; Schell, J.A.; Deering, D.W. Monitoring vegetation systems in the Great Plains with ERTS. In proceedings of the Third ERTS Symposium, Washington, DC, USA, 10–14 December 1973; Volume 1, pp. 309–317.
- Huete, A.R. A soil-adjusted vegetation index (SAVI). Remote Sens. Environ. 1988, 25, 295–309. [Google Scholar] [CrossRef]
- Yager, R.R. On ordered weighted averaging aggregation operators in multicriteria decision making. IEEE Trans. Syst. Man Cyb. 1988, 18, 183–190. [Google Scholar] [CrossRef]
- Bone, C.; Dragicevic, S.; Roberts, A. Integrating high resolution remote sensing, GIS and fuzzy set theory for identifying susceptibility areas of forest insect infestations. Int. J. Remote Sens. 2005, 26, 4809–4828. [Google Scholar] [CrossRef]
- Carrara, P.; Bordogna, G.; Boschetti, M.; Brivio, P.A.; Nelson, A.; Stroppiana, D. A flexible multi-source spatial-data fusion system for environmental status assessment at continental scale. Int. J. Geogr. Inf. Sci. 2008, 22, 781–799. [Google Scholar] [CrossRef]
- Kaufman, Y.J.; Remer, L.A. Detection of forests using mid-IR reflectance: An application for aerosol studies. IEEE Trans. Geosci. Remote Sens. 1994, 32, 672–683. [Google Scholar] [CrossRef]
- Pereira, J.M.C. A comparative evaluation of NOAA/AVHRR vegetation indexes for burned surface detection and mapping. IEEE Trans. Geosci. Remote Sens. 1999, 37, 217–226. [Google Scholar] [CrossRef]
- Stroppiana, D.; Bordogna, G.; Boschetti, M.; Carrara, P.; Boschetti, L.; Brivio, P.A. Positive and negative information for assessing and revising scores of burn evidence. IEEE Geosci. Remote Sens. Lett. 2012, 9, 363–367. [Google Scholar] [CrossRef]
- Cohen, J. A coefficient of agreement for nominal scales. Educ. Psychol. Meas. 1960, 20, 37–46. [Google Scholar] [CrossRef]
- Boschetti, L.; Flasse, S.P.; Brivio, P.A. Analysis of the conflict between omission and commission in low spatial resolution dichotomic thematic products: The Pareto Boundary. Remote Sens. Environ. 2004, 91, 280–292. [Google Scholar] [CrossRef]
© 2015 by the authors; licensee MDPI, Basel, Switzerland. This article is an open access article distributed under the terms and conditions of the Creative Commons Attribution license (http://creativecommons.org/licenses/by/4.0/).
Share and Cite
Stroppiana, D.; Azar, R.; Calò, F.; Pepe, A.; Imperatore, P.; Boschetti, M.; Silva, J.M.N.; Brivio, P.A.; Lanari, R. Integration of Optical and SAR Data for Burned Area Mapping in Mediterranean Regions. Remote Sens. 2015, 7, 1320-1345. https://doi.org/10.3390/rs70201320
Stroppiana D, Azar R, Calò F, Pepe A, Imperatore P, Boschetti M, Silva JMN, Brivio PA, Lanari R. Integration of Optical and SAR Data for Burned Area Mapping in Mediterranean Regions. Remote Sensing. 2015; 7(2):1320-1345. https://doi.org/10.3390/rs70201320
Chicago/Turabian StyleStroppiana, Daniela, Ramin Azar, Fabiana Calò, Antonio Pepe, Pasquale Imperatore, Mirco Boschetti, João M. N. Silva, Pietro A. Brivio, and Riccardo Lanari. 2015. "Integration of Optical and SAR Data for Burned Area Mapping in Mediterranean Regions" Remote Sensing 7, no. 2: 1320-1345. https://doi.org/10.3390/rs70201320
APA StyleStroppiana, D., Azar, R., Calò, F., Pepe, A., Imperatore, P., Boschetti, M., Silva, J. M. N., Brivio, P. A., & Lanari, R. (2015). Integration of Optical and SAR Data for Burned Area Mapping in Mediterranean Regions. Remote Sensing, 7(2), 1320-1345. https://doi.org/10.3390/rs70201320