
Assessment and Comparison of TMPA Satellite Precipitation Products in Varying Climatic and Topographic Regimes in Morocco


Abstract
:
1. Introduction
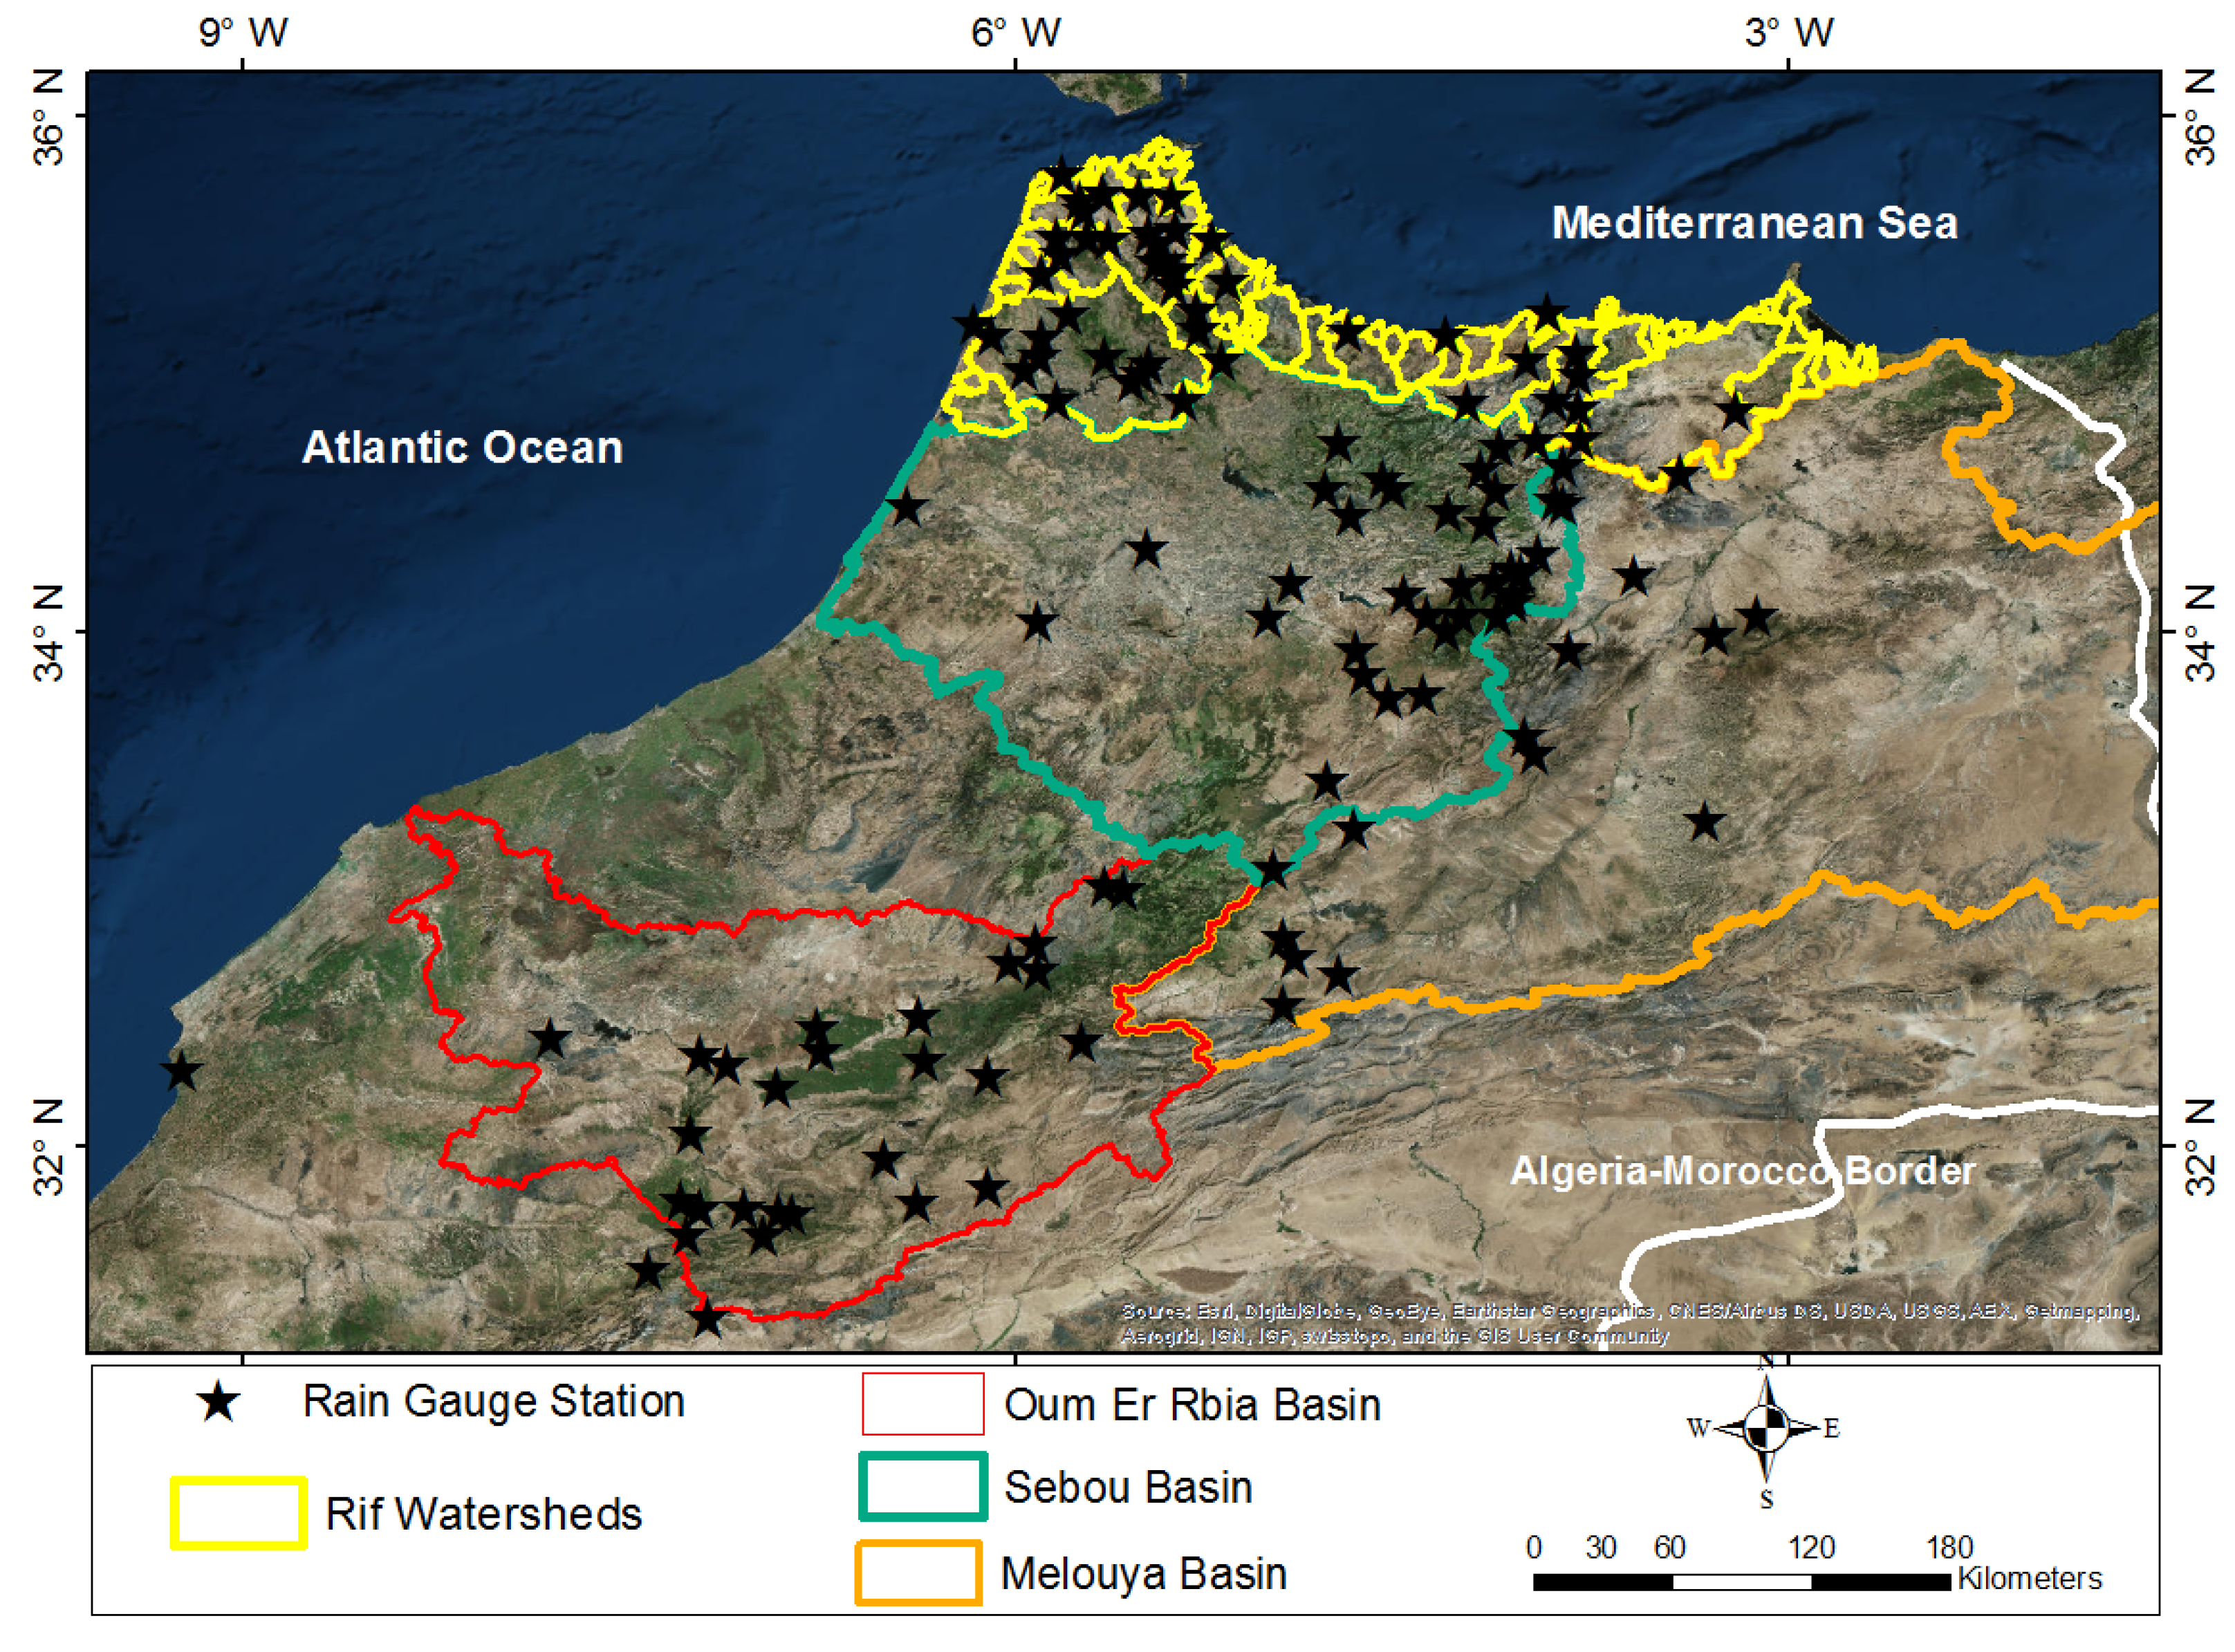
2. Site Description

3. Methodology

Data Acquisition and Processing
Rain Gauge and Satellite Data
Analysis and Comparison of Rainfall Products
4. Results and Discussion
4.1. TMPA Statistical Correlations
4.1.1. Unclassified (Entire) Data
4.1.2. Elevation-Based Classification


| TMPA Product/Classification | NSE | PCC | NRMSE | PBIAS | |
|---|---|---|---|---|---|
| Climate-Based Classification | TMPA 6: Arid | −0.3107 * | 0.5460 | 0.1561 | 14.8306 * |
| TMPA 7temp: Arid | −1.4170 | 0.6810 | 0.1826 | 46.9815 | |
| TMPA 7: Arid | −0.5129 | 0.6970 | 0.1494 | 28.4758 | |
| TMPA RT: Arid | −1.6529 | 0.5620 * | 0.2066 | 38.6636 | |
| TMPA 6: Semi_Arid | −0.0829 | 0.4940 | 0.1448 * | −12.1629 | |
| TMPA 7temp: Semi_Arid | 0.0052 | 0.5490 | 0.1486 | 10.5142 | |
| TMPA 7: Semi_Arid | −0.0248 | 0.5480 | 0.1512 | 5.9406 | |
| TMPA RT: Semi_Arid | −0.4581 | 0.3050 | 0.1806 | 4.6038 * | |
| TMPA 6: Sub_Humid | 0.2747 | 0.7550 | 0.1171 | −23.4304 | |
| TMPA 7temp: Sub_Humid | 0.5764 | 0.7900 | 0.0921 | −8.4049 | |
| TMPA 7: Sub_Humid | 0.6006 | 0.8160 | 0.0902 | −10.4856 | |
| TMPA RT: Sub_Humid | 0.1829 | 0.7280 | 0.1331 | −24.9839 | |
| Elevation−Based Classification | TMPA 6: Low_Elev | 0.6092 | 0.8180 | 0.0910 | −14.0130 |
| TMPA 7temp: Low_Elev | 0.7385 | 0.8620 | 0.0734 | 3.4305 | |
| TMPA 7: Low_Elev | 0.7677 | 0.8790 | 0.0710 | −0.3870 | |
| TMPA RT: Low_Elev | 0.5292 | 0.8020 | 0.1032 | −17.7135 | |
| TMPA 6: Mid_Elev | 0.4465 | 0.8100 | 0.0994 | −27.0902 | |
| TMPA 7temp: Mid_Elev | 0.5874 | 0.8220 | 0.0863 | −10.0360 | |
| TMPA 7: Mid_Elev | 0.5968 | 0.8430 | 0.0909 | −16.5857 | |
| TMPA RT: Mid_Elev | 0.4095 | 0.7180 | 0.1127 | −17.7744 * | |
| TMPA 6: High_Elev | −0.0434 | 0.4420 | 0.1459 | −22.8784 | |
| TMPA 7temp: High_Elev | 0.3306 | 0.5850 | 0.1175 | −1.9493 | |
| TMPA 7: High_Elev | 0.3229 | 0.5980 | 0.1251 | −7.0437 | |
| TMPA RT: High_Elev | −0.7576 | 0.2250 | 0.1742 | 14.2622 * | |
| Unclassified | TMPA 6: All | 0.5664 | 0.8050 | 0.0878 | −17.5836 |
| TMPA 7temp: All | 0.7057 | 0.8400 | 0.0720 | 0.4033 | |
| TMPA 7: All | 0.7295 | 0.8570 | 0.0720 | −3.7902 | |
| TMPA RT: All | 0.4624 | 0.7150 | 0.1038 | −13.2630 * |
4.1.3. Climate-Based Classification

4.2. Temporal Variations of TMPA

4.3. Spatial Variations of TMPA

5. Conclusions and Summary
- (1)
- Generally, the newer and refined satellite products have achieved their intended purpose and outperform previous versions. The TMPA research products (3B42 V6 and V7) performed better than the real-time product (3B42 RT). The PCC (V6: 0.81; V7: 0.86), NSE (V6: 0.57; V7: 0.73), NRMSE (V6: 0.08; V7: 0.07), and PBIAS (V6: −17%; V7: −4%) statistics of the research products outperformed the real-time product (RT—PCC: 0.72; NSE: 0.46; NRMSE: 0.10; PBIAS: −13%). This was also true regardless of the classification scheme as 104 out of 112 statistical analyses demonstrated the V7 products performed better than V6, and V6 outperformed the RT product. It should be noted that the RT version offers near-real-time products, which is an advantage compared to the research products. This validates the efforts and purpose of the recent algorithm developments and is consistent with similar findings [21,24].
- (2)
- A relatively low correlation was found between satellite observations and gauge data in areas receiving less than 500 mm/yr, consistent with recent investigations in other locations [21]. The analyses demonstrate that V7 still has an overestimation bias in arid environments (trend line slope: 1.13), and an underestimation bias in both semi-arid environments (trend line slope: 0.60) and sub-humid environments (trend line slope: 0.68). Results suggest that all versions are consistently better correlated with field gauges in sub-humid environments (PCCs—V6: 0.755; V7temp: 0.790; V7: 0.816; and RT: 0.728) than in semi-arid environments (PCCs—V6: 0.494; V7temp: 0.549, V7: 0.548; and RT: 0.305) or arid environments (PCCs—V6: 0.546; V7temp: 0.681; V7: 0.697; and RT: 0.562). Moreover, the arid environments had negative NS values for every product, suggesting that the mean observed value is a better predictor of observed rainfall than TMPA. Though this is the first TMPA comparison study in North Africa, the difficulty in estimating precipitation in arid environments was still apparent and is attributed to the land surface properties of the desert, which impact the upwelling microwave radiation [81]. These issues should be reduced in the GPM era because of the higher frequency channels on the GPM Microwave Imager (GMI) and Dual-Frequency Precipitation (DPR) sensors.
- (3)
- The elevation of the area contributes to the accuracy and reliability of the satellite observations. The lowest elevation resulted in the highest degree of correlation between all of the products with an average PCC of 0.84 as compared to the mid-elevation (PCC: 0.80) and high-elevation (PCC: 0.45). This study showed a potential altitude threshold exists as the correlation is drastically reduced in the highest elevations (>1000 m), though these were also the low rainfall or snow accumulation areas. In general, TMPA products underestimated the precipitation throughout the different elevation regimes with the mid-elevations showing the worst bias (PBIAS—Low: −9%; Mid: −20%; and High: −12%), though the RT product exhibited an overestimation bias in the high-elevation classification. Similar studies have outlined the low performance of TMPA products in high-altitude environments and identified the possible cause to be the bright band, ground clutter, or the attenuation of the PR reflectivity [21,78,79].
- (4)
- The temporary processing error (V7temp) from June 2012 to January 2013 resulted in a percent bias of ~4% overall between the V7 and V7temp data, though a much larger error (PBIAS: 18%) was seen in arid environments. This is consistent with NASA’s claim of a 5%–8% error, though it underscores the importance of researchers publishing during that time being cautious about the results they found if they were for low-rainfall environments.
Acknowledgments
Author Contributions
Conflicts of Interest
References
- Brunner, P.; Hendricks Franssen, H.J.; Kgotlhang, L.; Bauer-Gottwein, P.; Kinzelbach, W. How can remote sensing contribute in groundwater modeling? Hydrogeol. J. 2007, 15, 5–18. [Google Scholar] [CrossRef]
- Di Paola, F.; Ricciardelli, E.; Cimini, D.; Romano, F.; Viggiano, M.; Cuomo, V. Analysis of catania flash flood case study by using combined microwave and infrared technique. J. Hydrometeorol. 2014, 15, 1989–1998. [Google Scholar] [CrossRef]
- Mugnai, A.; Casella, D.; Cattani, E.; Dietrich, S.; Laviola, S.; Levizzani, V.; Panegrossi, G.; Petracca, M.; Sanò, P.; Paola, F.D. Precipitation products from the hydrology SAF. Nat. Hazards Earth Syst. Sci. 2013, 13, 1959–1981. [Google Scholar] [CrossRef]
- Puca, S.; Porcu, F.; Rinollo, A.; Vulpiani, G.; Baguis, P.; Balabanova, S.; Campione, E.; Ertürk, A.; Gabellani, S.; Iwanski, R.; et al. The validation service of the hydrological SAF geostationary and polar satellite precipitation products. Nat. Hazards Earth Syst. Sci. 2014, 14, 871–889. [Google Scholar]
- Ricciardelli, E.; Cimini, D.; di Paola, F.; Romano, F.; Viggiano, M. A statistical approach for rain intensity differentiation using Meteosat Second Generation—Spinning Enhanced Visible and InfraRed Imager observations. Hydrol. Earth Syst. Sci. 2014, 18, 2559–2576. [Google Scholar] [CrossRef] [Green Version]
- Silliman, S. Development of Reliable Hydrologic Data Sets in Difficult Environments: Case Studies from Benin, West Africa; Darcy Lecturer, NGWA: Baltimore, MA, USA, 2011. [Google Scholar]
- Sophocleous, M. Global and regional water availability and demand: Prospects for the future. Nat. Resourc. Res. 2004, 13, 61–75. [Google Scholar] [CrossRef]
- Vörösmarty, C.J. Global water assessment and potential contributions from earth systems science. Aquat. Sci. 2002, 64, 328–351. [Google Scholar] [CrossRef]
- Casella, D.; Panegrossi, G.; Sano, P.; Dietrich, S.; Mugnai, A.; Smith, E.A.; Tripoli, G.J.; Formenton, M.; di Paola, F.; Leung, W.-Y. Transitioning from CRD to CDRD in Bayesian retrieval of rainfall from satellite passive microwave measurements: Part 2. Overcoming database profile selection ambiguity by consideration of meteorological control on microphysics. IEEE Trans. Geosci. Remote Sens. 2013, 51, 4650–4671. [Google Scholar]
- Hong, Y.; Adler, R.F.; Hossain, F.; Curtis, S.; Huffman, G.J. A first approach to global runoff simulation using satellite rainfall estimation. Water Resour. Res. 2007, 43. [Google Scholar] [CrossRef]
- Milewski, A.; Sultan, M.; Yan, E.; Becker, R.; Abdeldayem, A.; Soliman, F.; Gelil, K.A. A remote sensing solution for estimating runoff and recharge in arid environments. J. Hydrol. 2009, 373, 1–14. [Google Scholar] [CrossRef]
- Mugnai, A.; Smith, E.; Tripoli, G.; Bizzarri, B.; Casella, D.; Dietrich, S.; di Paola, F.; Panegrossi, G.; Sanò, P. CDRD and PNPR satellite passive microwave precipitation retrieval algorithms: Eurotrmm/Eurainsat origins and H-SAF operations. Nat. Hazards Earth Syst. Sci. 2013, 13, 887–912. [Google Scholar] [CrossRef]
- Sahoo, A.K.; Sheffield, J.; Pan, M.; Wood, E.F. Evaluation of the tropical rainfall measuring mission multi-satellite precipitation analysis (TMPA) for assessment of large-scale meteorological drought. Remote Sens. Environ. 2015, 159, 181–193. [Google Scholar] [CrossRef]
- Sanò, P.; Panegrossi, G.; Casella, D.; Di Paola, F.; Milani, L.; Mugnai, A.; Petracca, M.; Dietrich, S. The passive microwave neural network precipitation retrieval (PNPR) algorithm for AMSU/MHS observations: Description and application to European case studies. Atmos. Meas. Tech. Discuss. 2014, 7, 9351–9411. [Google Scholar] [CrossRef]
- Seyyedi, H.; Anagnostou, E.; Beighley, E.; McCollum, J. Satellite-driven downscaling of global reanalysis precipitation products for hydrological applications. Hydrol. Earth Syst. Sci. 2014, 18, 5077–5091. [Google Scholar] [CrossRef]
- Ghajarnia, N.; Liaghat, A.; Daneshkar Arasteh, P. Comparison and evaluation of high resolution precipitation Estimation products in Urmia Basin, Iran. Atmos. Res. 2015, 158–159, 50–65. [Google Scholar]
- Lo Conti, F.; Hsu, K.-L.; Noto, L.V.; Sorooshian, S. Evaluation and comparison of satellite precipitation estimates with reference to a local area in the Mediterranean Sea. Atmos. Res. 2014, 138, 189–204. [Google Scholar] [CrossRef]
- Moazami, S.; Golian, S.; Kavianpour, M.R.; Hong, Y. Comparison of persiann and V7 TRMM multi-satellite precipitation analysis (TMPA) products with rain gauge data over Iran. Int. J. Remote Sens. 2013, 34, 8156–8171. [Google Scholar] [CrossRef]
- Zeng, H.; Li, L.; Li, J. The evaluation of trmm multisatellite precipitation analysis (TMPA) in drought monitoring in the Lancang River Basin. J. Geogr. Sci. 2012, 22, 273–282. [Google Scholar] [CrossRef]
- Huffman, G.J.; Bolvin, D.T.; Nelkin, E.J.; Wolff, D.B.; Adler, R.F.; Gu, G.; Hong, Y.; Bowman, K.P.; Stocker, E.F. The TRMM multisatellite precipitation analysis (TMPA): Quasi-global, multiyear, combined-sensor precipitation estimates at fine scales. J. Hydrometeorol. 2007, 8, 38–55. [Google Scholar] [CrossRef]
- Chen, S.; Hong, Y.; Cao, Q.; Gourley, J.J.; Kirstetter, P.E.; Yong, B.; Tian, Y.; Zhang, Z.; Shen, Y.; Hu, J. Similarity and difference of the two successive V6 and V7 TRMM multisatellite precipitation analysis performance over China. J. Geophys. Res. 2013, 118, 13060–13074. [Google Scholar]
- Chen, S.; Hong, Y.; Gourley, J.J.; Huffman, G.J.; Tian, Y.; Cao, Q.; Yong, B.; Kirstetter, P.E.; Hu, J.; Hardy, J. Evaluation of the successive V6 and V7 TRMM multisatellite precipitation analysis over the continental United States. Water Resour. Res. 2013, 49, 8174–8186. [Google Scholar] [CrossRef]
- Huffman, G.; Adler, R.; Bolvin, D.; Nelkin, E. The TRMM multi-satellite precipitation analysis (TMPA). In Satellite Rainfall Applications for Surface Hydrology; Gebremichael, M., Hossain, F., Eds.; Springer: Dordrecht, The Netherlands, 2010; pp. 3–22. [Google Scholar]
- Yong, B.; Chen, B.; Gourley, J.J.; Ren, L.; Hong, Y.; Chen, X.; Wang, W.; Chen, S.; Gong, L. Intercomparison of the version-6 and version-7 TMPA precipitation products over high and low latitudes basins with independent gauge networks: Is the newer version better in both real-time and post-real-time analysis for water resources and hydrologic extremes? J. Hydrol. 2014, 508, 77–87. [Google Scholar] [CrossRef]
- Yong, B.; Hong, Y.; Ren, L.L.; Gourley, J.J.; Huffman, G.J.; Chen, X.; Wang, W.; Khan, S.I. Assessment of evolving TRMM-based multisatellite real-time precipitation estimation methods and their impacts on hydrologic prediction in a high latitude basin. J. Geophys. Res. 2012, 117. [Google Scholar] [CrossRef]
- Huffman, G.J.; Bolvin, D.T.; Nelkin, E.J.; Adler, R.F. Highlights of version 7 TRMM multi-satellite precipitation analysis (TMPA). In Proceedings of 5th International Precipitation Working Group Workshop, Hamburg, Germany, 11–15 October 2010.
- AghaKouchak, A.; Behrangi, A.; Sorooshian, S.; Hsu, K.; Amitai, E. Evaluation of satellite-retrieved extreme precipitation rates across the central United States. J. Geophys. Res. 2011, 116. [Google Scholar] [CrossRef]
- Demaria, E.; Rodriguez, D.; Ebert, E.; Salio, P.; Su, F.; Valdes, J. Evaluation of mesoscale convective systems in south America using multiple satellite products and an object-based approach. J. Geophys. Res. 2011, 116. [Google Scholar] [CrossRef]
- Adler, R.F.; Kidd, C.; Petty, G.; Morrissey, M.; Goodman, H.M.; Einaudi, F. Intercomparison of global precipitation products: The third precipitation intercomparison project (PIP-3). Bull. Am. Meteor. Soc. 2001, 82, 1377–1396. [Google Scholar] [CrossRef]
- Dinku, T.; Ceccato, P.; Grover-Kopec, E.; Lemma, M.; Connor, S.J.; Ropelewski, C.F. Validation of satellite rainfall products over East Africa’s complex topography. Int. J. Remote Sens. 2007, 28, 1503–1526. [Google Scholar] [CrossRef]
- Krajewski, W.F.; Ciach, G.J.; McCollum, J.R.; Bacotiu, C. Initial validation of the global precipitation climatology project monthly rainfall over the United States. J. Appl. Meteorol. 2000, 39, 1071–1086. [Google Scholar] [CrossRef]
- Morrissey, M.L.; Janowiak, J.E. Sampling-induced conditional biases in satellite climate-scale rainfall estimates. J. Appl. Meteorol. 1996, 35, 541–548. [Google Scholar] [CrossRef]
- Su, F.; Hong, Y.; Lettenmaier, D.P. Evaluation of trmm multisatellite precipitation analysis (TMPA) and its utility in hydrologic prediction in the La Plata basin. J. Hydrometeorol. 2008, 9, 622–640. [Google Scholar] [CrossRef]
- Tang, L.; Hossain, F.; Huffman, G.J. Transfer of satellite rainfall uncertainty from gauged to ungauged regions at regional and seasonal timescales. J. Hydrometeorol. 2010, 11, 1263–1274. [Google Scholar]
- Paola, F.D.; Casella, D.; Dietrich, S.; Mugnai, A.; Ricciardelli, E.; Romano, F.; Sanò, P. Combined MW-IR precipitation evolving technique (PET) of convective rain fields. Nat. Hazards Earth Syst. Sci. 2012, 12, 3557–3570. [Google Scholar] [CrossRef]
- Casella, D.; Dietrich, S.; Paola, F.D.; Formenton, M.; Mugnai, A.; Porcu, F.; Sano, P. PM-GCD—A combined IR–MW satellite technique for frequent retrieval of heavy precipitation. Nat. Hazards Earth Syst. Sci. 2012, 12, 231–240. [Google Scholar] [CrossRef]
- Chokngamwong, R.; Chiu, L.S. Thailand daily rainfall and comparison with TRMM products. J. Hydrometeorol. 2008, 9, 256–266. [Google Scholar] [CrossRef]
- Cimini, D.; Romano, F.; Ricciardelli, E.; di Paola, F.; Viggiano, M.; Marzano, F.; Colaiuda, V.; Picciotti, E.; Vulpiani, G.; Cuomo, V. Validation of satellite opemw precipitation product with ground-based weather radar and rain gauge networks. Atmos. Meas. Tech. 2013, 6, 3181–3196. [Google Scholar] [CrossRef]
- Tian, Y.; Peters-Lidard, C.D.; Eylander, J.B.; Joyce, R.J.; Huffman, G.J.; Adler, R.F.; Hsu, K.l.; Turk, F.J.; Garcia, M.; Zeng, J. Component analysis of errors in satellite-based precipitation estimates. J. Geophys. Res. 2009, 114. [Google Scholar] [CrossRef]
- Abouelmagd, A.; Sultan, M.; Sturchio, N.C.; Soliman, F.; Rashed, M.; Ahmed, M.; Kehew, A.E.; Milewski, A.; Chouinard, K. Paleoclimate record in the Nubian Sandstone Aquifer, Sinai Peninsula, Egypt. Quat. Res. 2014, 81, 158–167. [Google Scholar] [CrossRef]
- Armanios, D.E.; Fisher, J.B. Measuring water availability with limited ground data: Assessing the feasibility of an entirely remote-sensing-based hydrologic budget of the Rufiji Basin, Tanzania, using TRMM, GRACE, MODIS, SRB, and AIRS. Hydrol. Process. 2014, 28, 853–867. [Google Scholar] [CrossRef]
- As-syakur, A.; Adnyana, I.; Mahendra, M.S.; Arthana, I.W.; Merit, I.N.; Kasa, I.W.; Ekayanti, N.W.; Nuarsa, I.W.; Sunarta, I.N. Observation of spatial patterns on the rainfall response to ENSO and IOD over Indonesia using TRMM multisatellite precipitation analysis (TMPA). Int. J. Climatol. 2014, 34, 3825–3839. [Google Scholar] [CrossRef]
- Bin, P.; Shi, J.; ni-Meister, W.; Zhao, T.; Ji, D. Evaluation of TRMM multisatellite precipitation analysis (TMPA) products and their potential hydrological application at an arid and semiarid basin in China. IEEE J. Sel. Top. Appl. Earth Obs. Remote Sens. 2014, 7, 3915–3930. [Google Scholar] [CrossRef]
- Bitew, M.M.; Gebremichael, M. Evaluation of satellite rainfall products through hydrologic simulation in a fully distributed hydrologic model. Water Resour. Res. 2011, 47. [Google Scholar] [CrossRef]
- Bitew, M.M.; Gebremichael, M.; Ghebremichael, L.T.; Bayissa, Y.A. Evaluation of high-resolution satellite rainfall products through streamflow simulation in a hydrological modeling of a small mountainous watershed in Ethiopia. J. Hydrometeorol. 2012, 13, 338–350. [Google Scholar] [CrossRef]
- Getirana, A.; Espinoza, J.; Ronchail, J.; Rotunno Filho, O. Assessment of different precipitation datasets and their impacts on the water balance of the Negro river basin. J. Hydrol. 2011, 404, 304–322. [Google Scholar] [CrossRef]
- Gosset, M.; Viarre, J.; Quantin, G.; Alcoba, M. Evaluation of several rainfall products used for hydrological applications over West Africa using two high-resolution gauge networks. Quart. J. R. Meteorol. Soc. 2013, 139, 923–940. [Google Scholar] [CrossRef]
- Jiang, S.; Ren, L.; Hong, Y.; Yang, X.; Ma, M.; Zhang, Y.; Yuan, F. Improvement of multi-satellite real-time precipitation products for ensemble streamflow simulation in a middle latitude basin in south China. Water Resour. Manag. 2014, 28, 2259–2278. [Google Scholar] [CrossRef]
- Khan, S.I.; Hong, Y.; Gourley, J.J.; Khattak, M.U.K.; Yong, B.; Vergara, H.J. Evaluation of three high-resolution satellite precipitation estimates: Potential for monsoon monitoring over Pakistan. Adv. Space Res. 2014, 54, 670–684. [Google Scholar] [CrossRef]
- Lauri, H.; Räsänen, T.; Kummu, M. Using reanalysis and remotely sensed temperature and precipitation data for hydrological modeling in monsoon climate: Mekong river case study. J. Hydrometeorol. 2014, 15, 1532–1545. [Google Scholar] [CrossRef]
- Lemons, R.; Hewitt, A.; Kharel, G.; New, C.; Kirilenko, A.; Zhang, X. Evaluation of satellite-derived agro-climate variables in the northern great plains of the United States. Geocarto Int. 2012, 27, 613–626. [Google Scholar] [CrossRef]
- Munier, S.; Aires, F.; Schlaffer, S.; Prigent, C.; Papa, F.; Maisongrande, P.; Pan, M. Combining data sets of satellite-retrieved products for basin-scale water balance study: 2. Evaluation on the Mississippi Basin and closure correction model. J. Geophys. Res. 2014, 119, 12100–112116. [Google Scholar]
- Serrat-Capdevila, A.; Valdes, J.B.; Stakhiv, E.Z. Water management applications for satellite precipitation products: Synthesis and recommendations. JAWRA J. Am. Water Resour. Assoc. 2014, 50, 509–525. [Google Scholar] [CrossRef]
- Siddique-E-Akbor, A.; Hossain, F.; Sikder, S.; Shum, C.; Tseng, S.; Yi, Y.; Turk, F.; Limaye, A. Satellite precipitation data-driven hydrological modeling for water resources management in the Ganges, Brahmaputra, and Meghna basins. Earth Interact. 2014, 18, 1–25. [Google Scholar] [CrossRef]
- Tong, K.; Su, F.; Yang, D.; Hao, Z. Evaluation of satellite precipitation retrievals and their potential utilities in hydrologic modeling over the Tibetan Plateau. J. Hydrol. 2014, 519, 423–437. [Google Scholar] [CrossRef]
- Vergara, H.; Hong, Y.; Gourley, J.J.; Anagnostou, E.N.; Maggioni, V.; Stampoulis, D.; Kirstetter, P.-E. Effects of resolution of satellite-based rainfall estimates on hydrologic modeling skill at different scales. J. Hydrometeorol. 2014, 15, 593–613. [Google Scholar] [CrossRef]
- Voisin, N.; Pappenberger, F.; Lettenmaier, D.P.; Buizza, R.; Schaake, J.C. Application of a medium-range global hydrologic probabilistic forecast scheme to the Ohio River Basin. Weather Forecast. 2011, 26, 425–446. [Google Scholar] [CrossRef]
- Wu, H.; Adler, R.F.; Hong, Y.; Tian, Y.; Policelli, F. Evaluation of global flood detection using satellite-based rainfall and a hydrologic model. J. Hydrometeorol. 2012, 13, 1268–1284. [Google Scholar] [CrossRef]
- Zhao, H.; Yang, S.; Wang, Z.; Zhou, X.; Luo, Y.; Wu, L. Evaluating the suitability of TRMM satellite rainfall data for hydrological simulation using a distributed hydrological model in the Weihe river catchment in China. J. Geogr. Sci. 2015, 25, 177–195. [Google Scholar] [CrossRef]
- Berg, W.; L’Ecuyer, T.; Kummerow, C. Rainfall climate regimes: The relationship of regional TRMM rainfall biases to the environment. J. Appl. Meteorol. Climatol. 2006, 45, 434–454. [Google Scholar] [CrossRef]
- Seto, S.; Iguchi, T.; Meneghini, R. Comparison of TRMM PR v6 and v7 focusing heavy rainfall. In Proceedings of the 2011 IEEE International Geoscience and Remote Sensing Symposium (IGARSS), Vancouver, BC, Canada, 24–29 July 2011.
- Pereira, R.; Bovolo, C.I.; Forsythe, N.; Pedentchouk, N.; Parkin, G.; Wagner, T. Seasonal patterns of rainfall and river isotopic chemistry in Northern Amazonia (Guyana): From the headwater to the regional scale. J. South Am. Earth Sci. 2014, 52, 108–118. [Google Scholar] [CrossRef]
- Huffman, G.J.; Bolvin, D.T. Real-Time TRMM Multi-Satellite Precipitation Analysis Data Set Documentation. 2013. Available online: ftp://meso-a.gsfc.nasa.gov/pub/trmmdocs/rt/3B4XRT_doc_V7.pdf (accessed on 20 February 2015). [Google Scholar]
- Shahin, M. Water Resources and Hydrometeorology of the Arab Region; Springer Science & Business Media: Berlin/Heidelberg, Germany, 2007; Volume 59. [Google Scholar]
- Knippertz, P.; Christoph, M.; Speth, P. Long-term precipitation variability in morocco and the link to the large-scale circulation in recent and future climates. Meteorol. Atmos. Phys. 2003, 83, 67–88. [Google Scholar] [CrossRef]
- El Hamly, M.; Sebbari, R. Towards the Seasonal Prediction of Moroccan Precipitation and Its Implications for Water Resources Management. Available online: http://hydrologie.org/redbooks/a252/iahs_252_079.pdf (accessed on 20 February 2015).
- Huebener, H.; Kerschgens, M. Downscaling of current and future rainfall climatologies for Southern Morocco. Part I: Downscaling method and current climatology. Int. J. Climatol. 2007, 27, 1763–1774. [Google Scholar]
- Ward, M.N.; Lamb, P.J.; Portis, D.H.; el Hamly, M.; Sebbari, R. Climate variability in Northern Africa: Understanding droughts in the Sahel and the Maghreb. In Beyond el Niño; Springer: Berlin/Heidelberg, Germany, 1999; pp. 119–140. [Google Scholar]
- Chaponniere, A.; Smakhtin, V. A Review of Climate Change Scenarios and Preliminary Rainfall Trend Analysis in the Oum er Rbia Basin, Morocco; International Water Management Institute (IWMI): Colombo, Sri Lanka, 2006; Volume 110. [Google Scholar]
- Snoussi, M.; Haïda, S.; Imassi, S. Effects of the construction of dams on the water and sediment fluxes of the Moulouya and the Sebou Rivers, Morocco. Reg. Environ. Chang. 2002, 3, 5–12. [Google Scholar] [CrossRef]
- World Meteorological Organisation. Guide to Hydrological Practices: Data Acquisition, and Processing, Analysis, Forecasting and Other Applications; World Meteorological Organisation: Geneva, Switzerland, 1994. [Google Scholar]
- Grove, A.T.; Miles, M.; Worthington, E.; Doggett, H.; Dasgupta, B.; Farmer, B. The geography of semi-arid lands [and discussion]. Philos. Trans. R. Soc. B 1977, 278, 457–475. [Google Scholar] [CrossRef]
- UNEP, N.M.; Thomas, D. World Atlas of Desertification; Edward Arnold: London, UK, 1992. [Google Scholar]
- Gutierrez, M. Geomorphology; CRC Press: Boca Raton, FL, USA, 2012. [Google Scholar]
- Nash, J.E.; Sutcliffe, J.V. River flow forecasting through conceptual models part I—A discussion of principles. J. Hydrol. 1970, 10, 282–290. [Google Scholar] [CrossRef]
- Moriasi, D.N.; Arnold, J.G.; van Liew, M.W.; Bingner, R.L.; Harmel, R.D.; Veith, T.L. Model evaluation guidelines for systematic quantification of accuracy in watershed simulations. Trans. ASABE 2007, 50, 885–900. [Google Scholar] [CrossRef]
- Gupta, H.; Sorooshian, S.; Yapo, P. Status of automatic calibration for hydrologic models: Comparison with multilevel expert calibration. J. Hydrol. Eng. 1999, 4, 135–143. [Google Scholar] [CrossRef]
- Amitai, E.; Llort, X.; Liao, L.; Meneghini, R. A framework for global verification of space-borne radar estimates of precipitation based on rain type classification. In Proceedings of the 2nd TRMM International Science Conference, Nara, Japan, 6–10 September 2004.
- Fu, Y.; Liu, G. Possible misidentification of rain type by TRMM PR over Tibetan Plateau. J. Appl. Meteorol. Climatol. 2007, 46, 667–672. [Google Scholar] [CrossRef]
- Romilly, T.; Gebremichael, M. Evaluation of satellite rainfall estimates over Ethiopian River Basins. Hydrol. Earth Syst. Sci. 2011, 15, 1505–1514. [Google Scholar] [CrossRef]
- Grody, N.C.; Weng, F. Microwave emission and scattering from deserts: Theory compared with satellite measurements. IEEE Trans. Geosci. Remote Sens. 2008, 46, 361–375. [Google Scholar] [CrossRef]
© 2015 by the authors; licensee MDPI, Basel, Switzerland. This article is an open access article distributed under the terms and conditions of the Creative Commons Attribution license (http://creativecommons.org/licenses/by/4.0/).
Share and Cite
Milewski, A.; Elkadiri, R.; Durham, M. Assessment and Comparison of TMPA Satellite Precipitation Products in Varying Climatic and Topographic Regimes in Morocco. Remote Sens. 2015, 7, 5697-5717. https://doi.org/10.3390/rs70505697
Milewski A, Elkadiri R, Durham M. Assessment and Comparison of TMPA Satellite Precipitation Products in Varying Climatic and Topographic Regimes in Morocco. Remote Sensing. 2015; 7(5):5697-5717. https://doi.org/10.3390/rs70505697
Chicago/Turabian StyleMilewski, Adam, Racha Elkadiri, and Michael Durham. 2015. "Assessment and Comparison of TMPA Satellite Precipitation Products in Varying Climatic and Topographic Regimes in Morocco" Remote Sensing 7, no. 5: 5697-5717. https://doi.org/10.3390/rs70505697