
MODIS EVI and LST Temporal Response for Discrimination of Tropical Land Covers


Abstract
:
1. Introduction
2. Methods
2.1. Study Area
2.2. Satellite Imagery

2.3. Method Overview
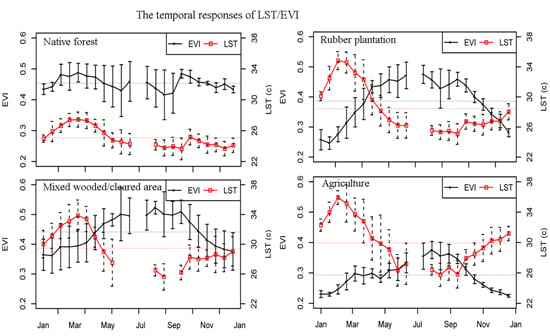
2.3.1. Temporal Response of LST and EVI for Different Land Cover Types

| Class | Description |
|---|---|
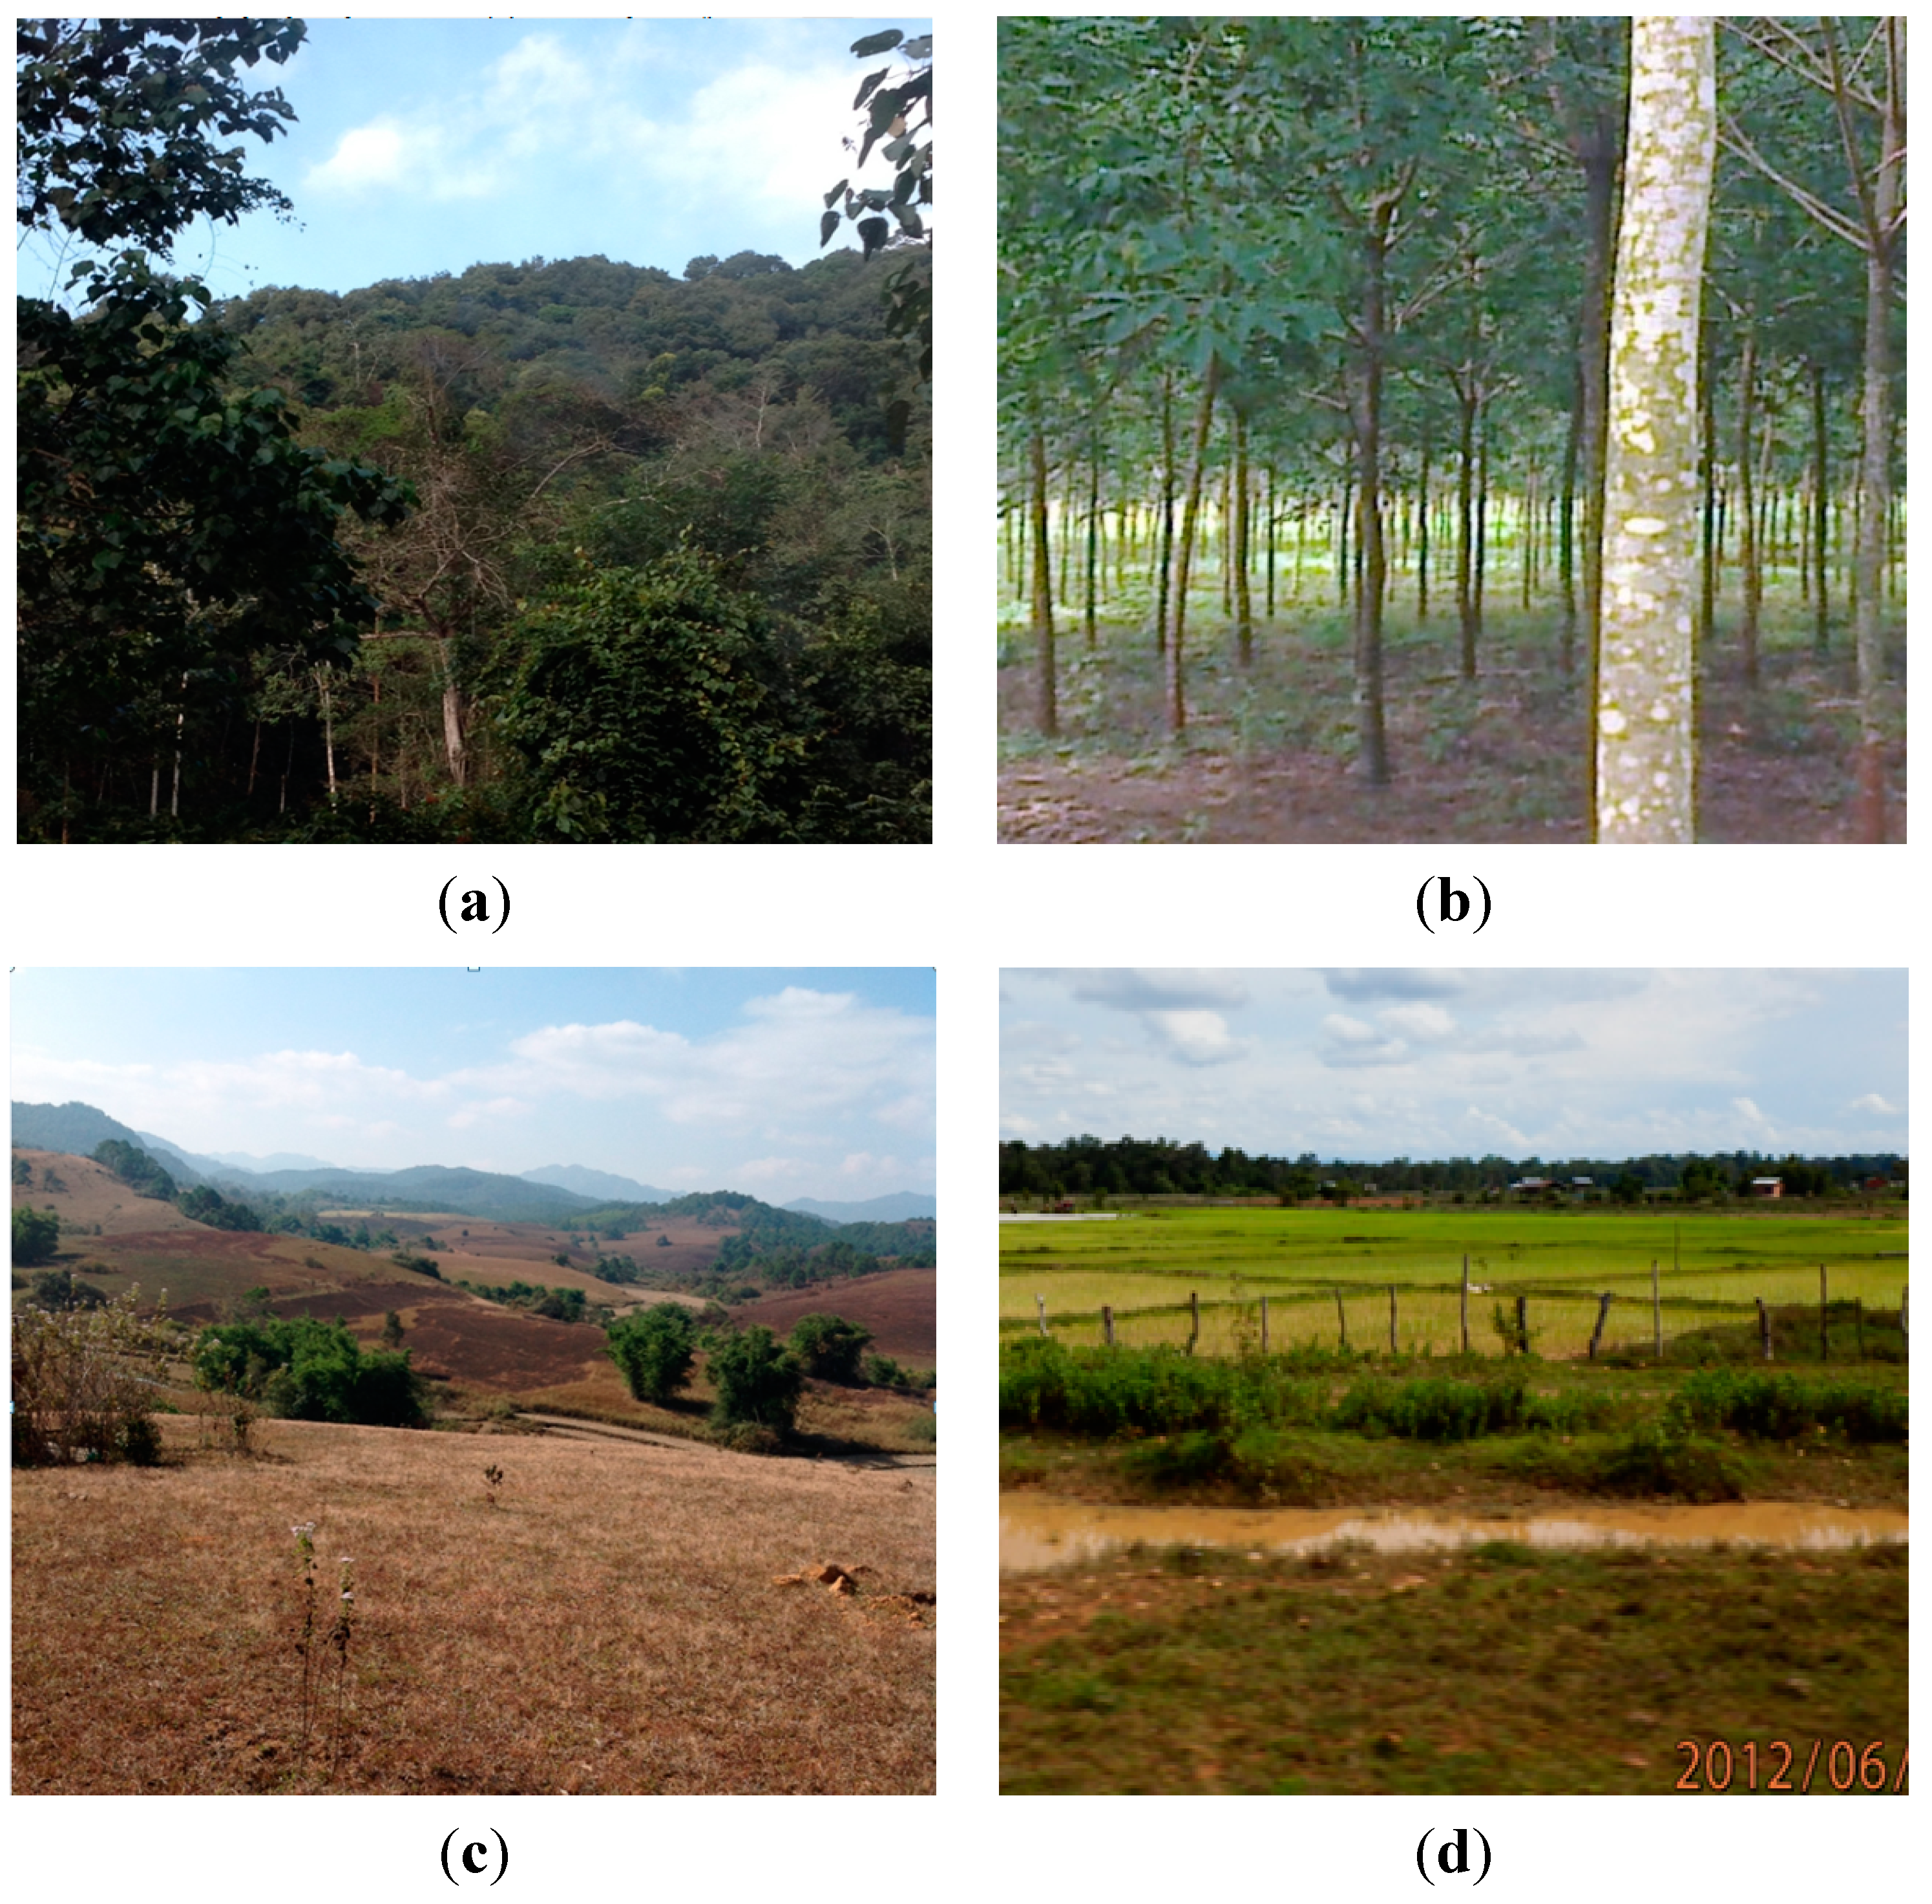
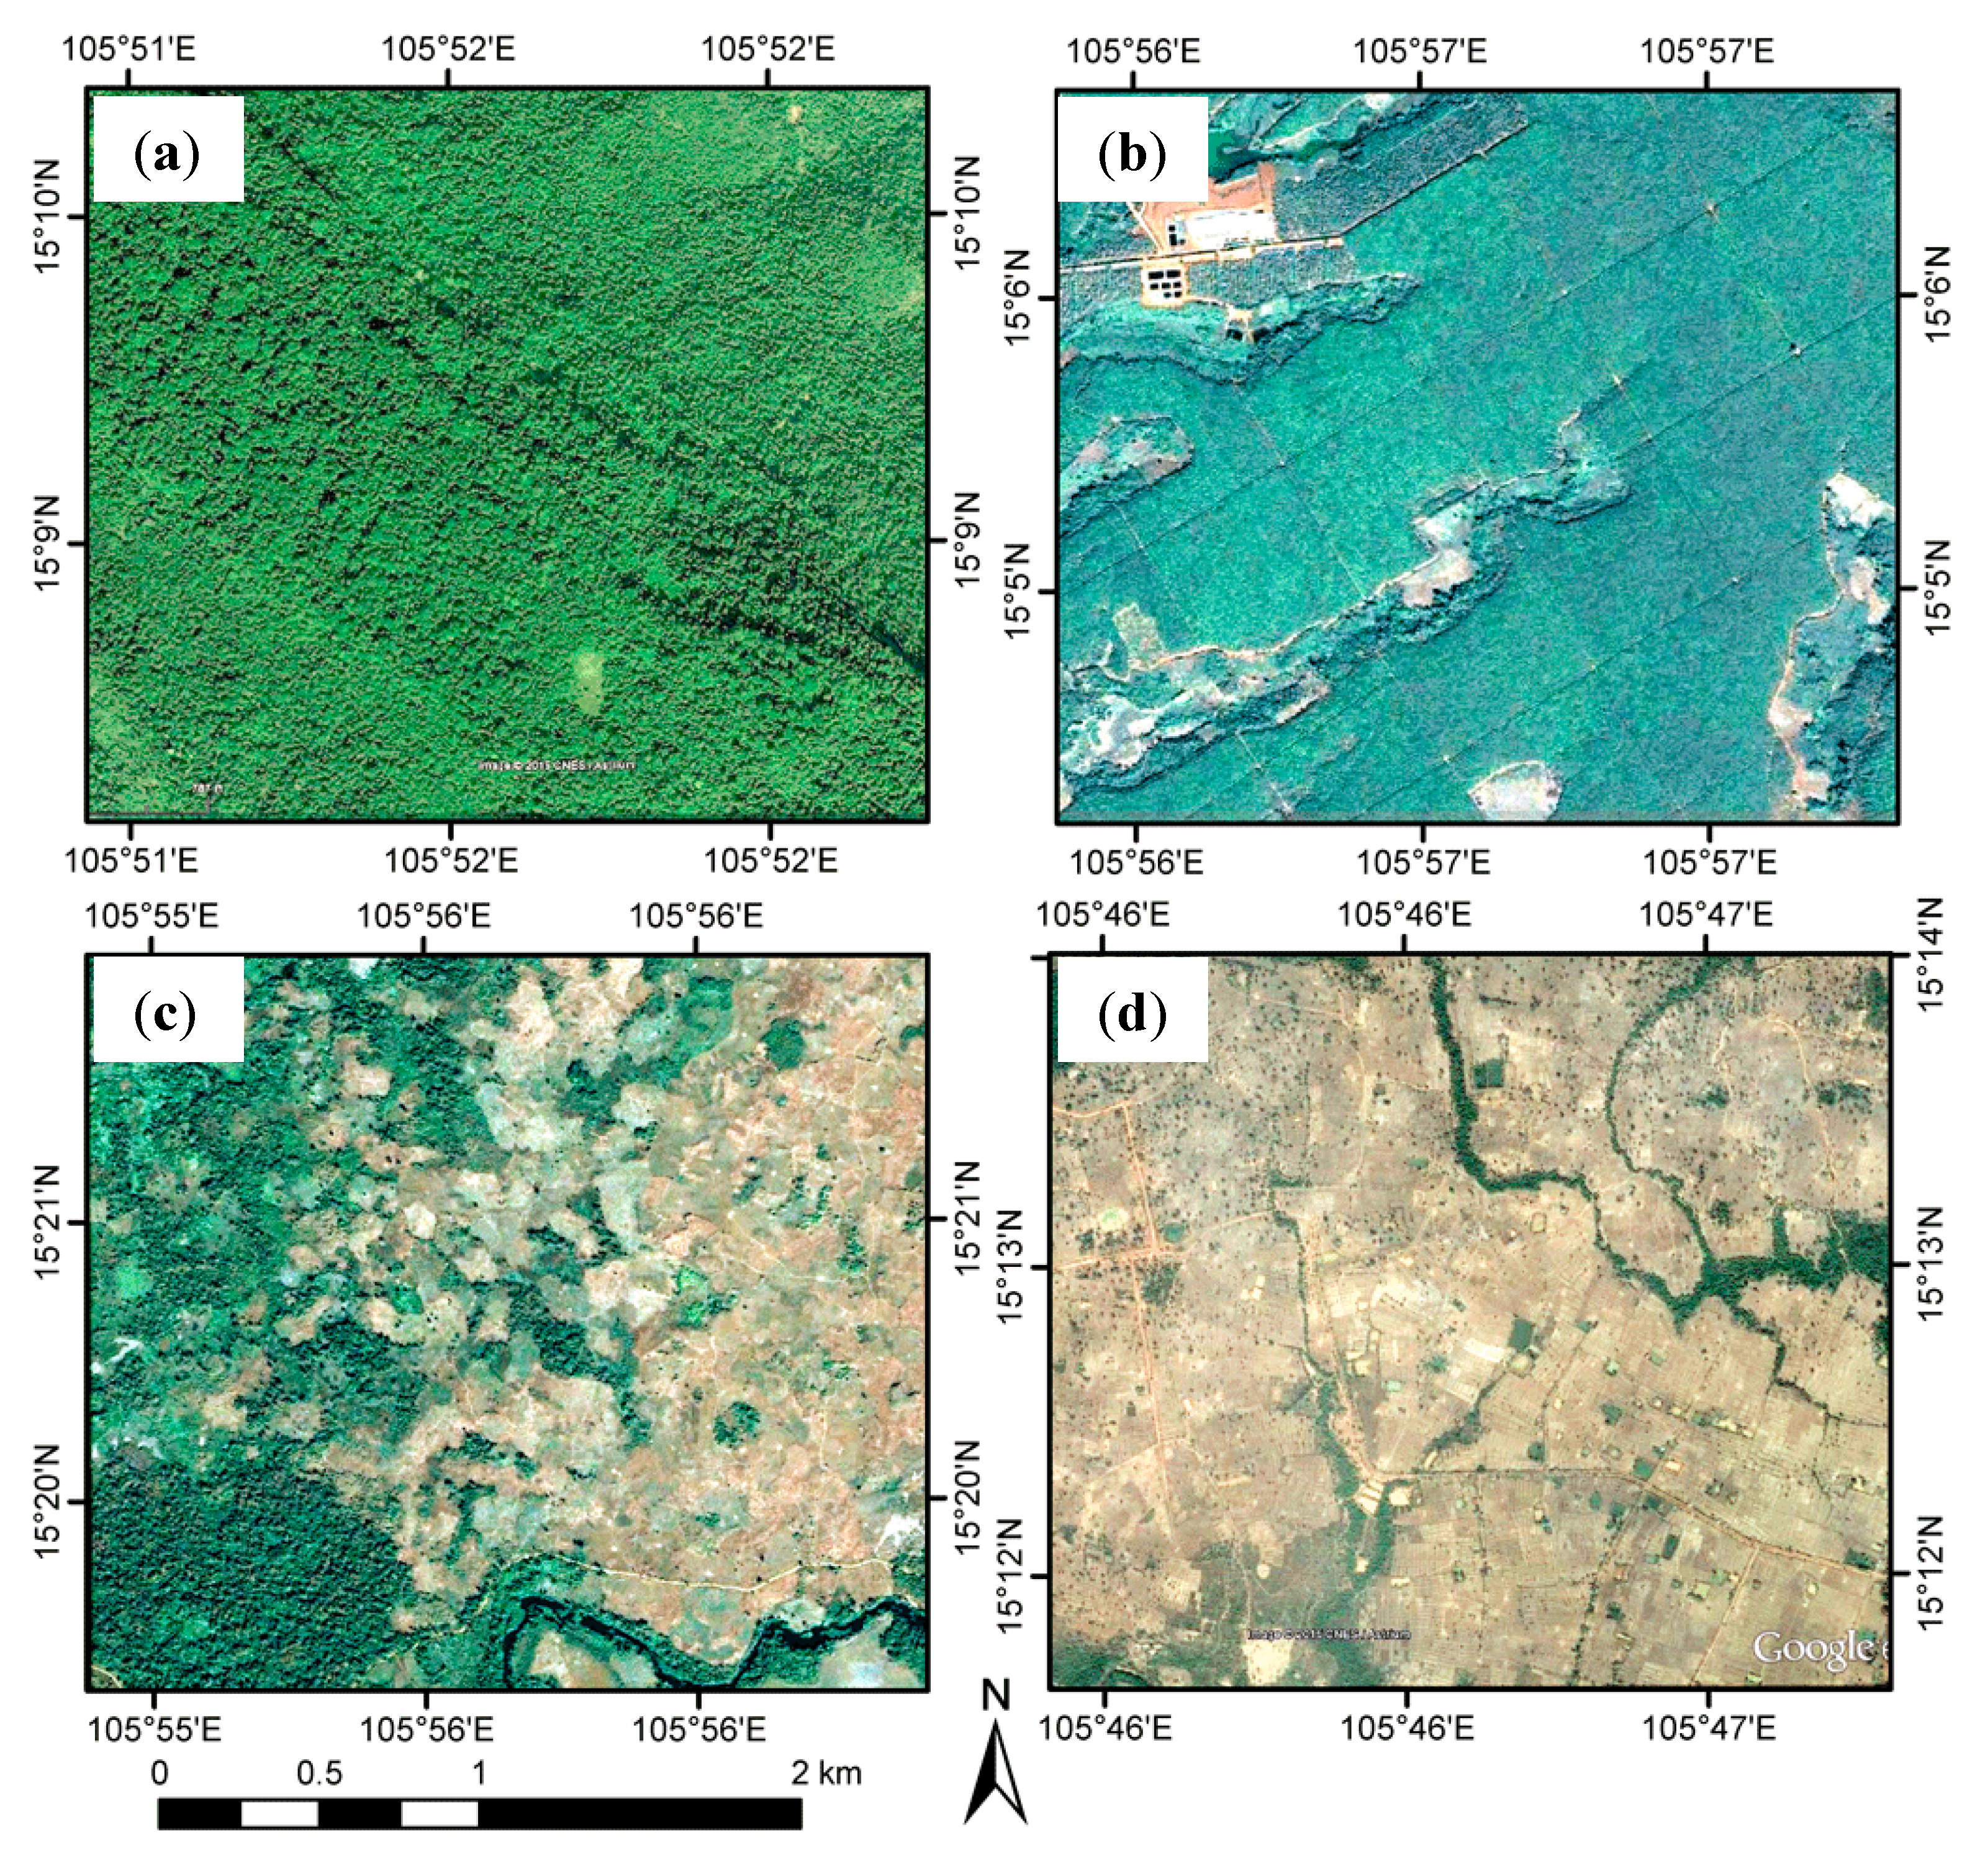
| Native Forest | Native forest is exclusively native vegetation, with little or no clearance. It usually comprises a mixture of tree species with a dense homogeneous canopy. |
| Plantation | Plantations predominantly comprise trees established through planting and/or deliberate seeding of introduced species. Rubber plantations are common in this region. They display homogeneous canopy patterns and textures comprising similar tree ages and regularly planted spaces. They have dense canopies, with texture, pattern and homogeneity easily distinguished from natural forests. |
| Mixed Wooded/Cleared Area | Comprises small or moderate patches of shrubs and trees and large areas of clearances. It usually has low vegetation cover comprised of small trees, grass and bare soils. |
| Agriculture | Exclusively agricultural utilizations. This class includes mainly paddy fields and water or irrigation channels. There is a large area of exposed soils and it is readily distinguished from other land covers. |


2.3.2. Discriminating the Different Land Cover Types Using LST and EVI
3. Results
3.1. Temporal Response of LST and EVI for Different Land Cover Types

3.2. Monthly Transition of LST and EVI
3.3. Discriminating the Different Land Cover Types Using LST and EVI

| Actual | Predicted | |||
|---|---|---|---|---|
| Agriculture | Native Forest | Plantation | Wooded/Cleared | |
| Agriculture | 0.92 | 0 | 0.03 | 0.05 |
| Native Forest | 0 | 0.95 | 0.04 | 0 |
| Plantation | 0 | 0 | 0.92 | 0.07 |
| Wood/Cleared | 0.14 | 0.1 | 0.09 | 0.67 |
| Overall accuracy | 0.86 | |||
4. Discussion
5. Conclusions
Acknowledgments
Author Contributions
Conflicts of Interest
References
- Setiawan, Y.; Yoshino, K.; Prasetyo, L.B. Characterizing the dynamics change of vegetation cover on tropical forestlands using 250 m multi-temporal MODIS EVI. Int. J. Appl. Earth Obs. Geoinf. 2014, 26, 132–144. [Google Scholar]
- Zuidema, P.A.; Baker, P.J.; Groenendijk, P.; Schippers, P.; van der Sleen, P.; Vlam, M.; Sterck, F. Tropical forests and global change: Filling knowledge gaps. Trends Plant Sci. 2013, 18, 413–419. [Google Scholar] [PubMed]
- Thapa, R.B.; Shimada, M.; Watanabe, M.; Motohka, T.; Shiraishi, T. The tropical forest in South East Asia: Monitoring and scenario modeling using synthetic aperture radar data. Appl. Geogr. 2013, 41, 168–178. [Google Scholar]
- Hou, Z.; Xu, Q.; Nuutinen, T.; Tokola, T. Extraction of remote sensing-based forest management units in tropical forests. Remote Sens. Environ. 2013, 130, 1–10. [Google Scholar]
- Forkel, M.; Carvalhais, N.; Verbesselt, J.; Mahecha, M.; Neigh, C.; Reichstein, M. Trend change detection in NDVI time series: Effects of inter-annual variability and methodology. Remote Sens. 2013, 5, 2113–2144. [Google Scholar]
- Prabakaran, C.; Singh, C.P.; Panigrahy, S.; Parihar, J.S. Retrieval of forest phenological parameters from remote sensing-based NDVI time-series data. Curr. Sci. 2013, 105, 795–802. [Google Scholar]
- Hmimina, G.; Dufrêne, E.; Pontailler, J.Y.; Delpierre, N.; Aubinet, M.; Caquet, B.; de Grandcourt, A.; Burban, B.; Flechard, C.; Granier, A.; Gross, P.; Heinesch, B.; Longdoz, B.; Moureaux, C.; Ourcival, J.-M.; Rambal, S.; Saint André, L.; Soudani, K. Evaluation of the potential of MODIS satellite data to predict vegetation phenology in different biomes: An investigation using ground-based NDVI measurements. Remote Sens. Environ. 2013, 132, 145–158. [Google Scholar]
- Mildrexler, D.J.; Zhao, M.; Heinsch, F.A.; Running, S.W. A new satellite-based methodology for continental-scale disturbance detection. Ecol. Appl. 2007, 17, 235–250. [Google Scholar] [PubMed]
- Mildrexler, D.J.; Zhao, M.; Running, S.W. Testing a MODIS global disturbance index across North America. Remote Sens. Environ. 2009, 113, 2103–2117. [Google Scholar]
- Sobrino, J.A.; Julien, Y. Trend analysis of global MODIS-Terra vegetation indices and land surface temperature between 2000 and 2011. IEEE J. Sel. Top. Appl. Earth Obs. Remote Sens. 2013, 6, 2139–2145. [Google Scholar]
- Coops, N.C.; Wulder, M.A.; Iwanicka, D. Large area monitoring with a MODIS-based Disturbance Index (DI) sensitive to annual and seasonal variations. Remote Sens. Environ. 2009, 113, 1250–1261. [Google Scholar]
- Huete, A.R.; Didan, K.; Shimabukuro, Y.E.; Ratana, P.; Saleska, S.R.; Hutyra, L.R.; Yang, W.; Nemani, R.R.; Myneni, R. Amazon rainforests green-up with sunlight in dry season. Geophys. Res. Lett. 2006, 33, 1–4. [Google Scholar]
- Huete, A.R.; Restrepo-Coupe, N.; Ratana, P.; Didan, K.; Saleska, S.R.; Ichii, K.; Panuthai, S.; Gamo, M. Multiple site tower flux and remote sensing comparisons of tropical forest dynamics in Monsoon Asia. Agric. For. Meteorol. 2008, 148, 748–760. [Google Scholar]
- Ma, X.; Huete, A.; Yu, Q.; Coupe, N.R.; Davies, K.; Broich, M.; Ratana, P.; Beringer, J.; Hutley, L.B.; Cleverly, J.; Boulain, N.; Eamus, D. Spatial patterns and temporal dynamics in savanna vegetation phenology across the North Australian Tropical Transect. Remote Sens. Environ. 2013, 139, 97–115. [Google Scholar]
- Senf, C.; Pflugmacher, D.; van der Linden, S.; Hostert, P. Mapping rubber plantations and natural forests in Xishuangbanna (Southwest China) using multi-spectral phenological metrics from MODIS time series. Remote Sens. 2013, 5, 2795–2812. [Google Scholar]
- Zhang, X.; Friedl, M.A.; Schaaf, C.B.; Strahler, A.H.; Liu, Z. Monitoring the response of vegetation phenology to precipitation in Africa by coupling MODIS and TRMM instruments. J. Geophys. Res. 2005, 110, 1–14. [Google Scholar]
- Jiménez-Muñoz, J.C.; Sobrino, J.A.; Mattar, C.; Malhi, Y. Spatial and temporal patterns of the recent warming of the Amazon forest. J. Geophys. Res.: Atmos. 2013, 118, 5204–5215. [Google Scholar]
- Herdianto, R.; Paik, K.; Coles, N.A.; Smettem, K. Transitional responses of vegetation activities to temperature variations: Insights obtained from a forested catchment in Korea. J. Hydrol. 2013, 484, 86–95. [Google Scholar]
- Mildrexler, D.J.; Zhao, M.; Running, S.W. A global comparison between station air temperatures and MODIS land surface temperatures reveals the cooling role of forests. J. Geophys. Res. 2011, 116, 1–15. [Google Scholar]
- Coops, N.C.; Duro, D.C.; Wulder, M.A.; Han, T. Estimating afternoon MODIS land surface temperatures (LST) based on morning MODIS overpass, location and elevation information. Int. J. Remote Sens. 2007, 28, 2391–2396. [Google Scholar]
- van Leeuwen, T.T.; Frank, A.J.; Jin, Y.; Smyth, P.; Goulden, M.L.; van der Werf, G.R.; Randerson, J.T. Optimal use of land surface temperature data to detect changes in tropical forest cover. J. Geophys. Res. 2011, 116, G02002. [Google Scholar]
- Yue, W.; Xu, J.; Tan, W.; Xu, L. The relationship between land surface temperature and NDVI with remote sensing: Application to Shanghai Landsat 7 ETM+ data. Int. J. Remote Sens. 2007, 28, 3205–3226. [Google Scholar]
- Chernetskiy, M.; Pasko, I.; Shevyrnogov, A.; Slyusar, N.; Khodyayev, A. A study of forest vegetation dynamics in the south of the Krasnoyarskii Krai in spring. Adv. Space Res. 2011, 48, 819–825. [Google Scholar]
- Stroppiana, D. Seasonality of MODIS LST over southern Italy and correlation with land cover, topography and solar radiation. Eur. J. Remote Sens. 2014, 47, 133–152. [Google Scholar]
- Ehrlich, D.; Lambin, E.F. Broad scale land-cover classification and interannual climatic variability. Int. J. Remote Sens. 1996, 17, 845–862. [Google Scholar]
- Lambin, E.F.; Ehrlich, D. The surface temperature-vegetation index space for land cover and land-cover change analysis. Int. J. Remote Sens. 1996, 17, 463–487. [Google Scholar]
- Lambin, E.F.; Ehrlich, D. Land-cover changes in Sub-Saharan Africa (1982–1991): Application of a change index based on remotely sensed surface temperature and vegetation indices at a continental scale. Remote Sens. Environ. 1997, 61, 181–200. [Google Scholar]
- Nemani, R.R.; Running, S.W. Land cover characterization using multitemporal red, near-IR, and thermal-IR data from NOAA/AVHRR. Ecol. Appl. 1997, 7, 79–90. [Google Scholar]
- Julien, Y.; Sobrino, J.A. The yearly land cover dynamics (YLCD) method: An analysis of global vegetation from NDVI and LST parameters. Remote Sens. Environ. 2009, 113, 329–334. [Google Scholar] [CrossRef]
- Samanta, A.; Ganguly, S.; Vermote, E.; Nemani, R.R.; Myneni, R.B. Interpretation of variations in MODIS-measured greenness levels of Amazon forests during 2000 to 2009. Environ. Res. Lett. 2012, 7, 1–12. [Google Scholar] [CrossRef]
- Grogan, K.; Fensholt, R. Exploring patterns and effects of aerosol quantity flag anomalies in MODIS surface reflectance products in the tropics. Remote Sens. 2013, 5, 3495–3515. [Google Scholar] [CrossRef]
- Julien, Y.; Sobrino, J.A.; Jiménez-Muñoz, J.C. Land use classification from multitemporal Landsat imagery using the yearly land cover dynamics (YLCD) method. Int. J. Appl. Earth Obs. Geoinf. 2011, 13, 711–720. [Google Scholar] [CrossRef]
© 2015 by the authors; licensee MDPI, Basel, Switzerland. This article is an open access article distributed under the terms and conditions of the Creative Commons Attribution license (http://creativecommons.org/licenses/by/4.0/).
Share and Cite
Phompila, C.; Lewis, M.; Ostendorf, B.; Clarke, K. MODIS EVI and LST Temporal Response for Discrimination of Tropical Land Covers. Remote Sens. 2015, 7, 6026-6040. https://doi.org/10.3390/rs70506026
Phompila C, Lewis M, Ostendorf B, Clarke K. MODIS EVI and LST Temporal Response for Discrimination of Tropical Land Covers. Remote Sensing. 2015; 7(5):6026-6040. https://doi.org/10.3390/rs70506026
Chicago/Turabian StylePhompila, Chittana, Megan Lewis, Bertram Ostendorf, and Kenneth Clarke. 2015. "MODIS EVI and LST Temporal Response for Discrimination of Tropical Land Covers" Remote Sensing 7, no. 5: 6026-6040. https://doi.org/10.3390/rs70506026