Article

Seasonal Characterization of Solar Radiation Estimates Obtained from a MSG-SEVIRI-Derived Dataset and a RAMS-Based Operational Forecasting System over the Western Mediterranean Coast

1
Departament de Física de la Terra i Termodinàmica, Facultat de Física, Universitat de València, Doctor Moliner 50, Burjassot, Valencia 46100, Spain
2
Departament de Geografia, Facultat de Geografia i Història, Universitat de València, Avda. Blasco Ibáñez 28, Valencia 46010, Spain
*
Author to whom correspondence should be addressed.
Remote Sens. 2016, 8(1), 46; https://doi.org/10.3390/rs8010046
Submission received: 15 October 2015 / Revised: 23 December 2015 / Accepted: 29 December 2015 / Published: 7 January 2016

Abstract

:
Solar radiation is a key factor in the Earth’s energy balance and it is used as a crucial input parameter in many disciplines such as ecology, agriculture, solar energy and hydrology. Thus, accurate information of the global downward surface shortwave flux integration into the grid is of significant importance. From the different strategies used for grid integration of the surface solar radiation estimates, satellite-derived and numerical weather prediction forecasts are two interesting alternatives. In the current work, we present a comprehensive evaluation of the global downward solar radiation forecasts provided by the Regional Atmospheric Modeling System (RAMS) and the Downwelling Surface Shortwave Flux (DSSF) product, derived from the Meteosat Second Generation (MSG) Spinning Enhanced Visible and Infrared Imager (SEVIRI). Both solar radiation estimates are compared to thirteen ground-based weather station measurements for the winter 2010–2011 and the summer 2011 seasons. For these periods, the most recent versions of RAMS (4.4 and 6.0) were running in parallel within the real-time weather forecasting system implemented over the Valencia Region. The solar radiation performance and accuracy are evaluated for these datasets segmented into two atmospheric conditions (clear and cloudy skies) and two terrain classes (flat and hilly). DSSF shows a very good agreement over the study area. Statistical daily evaluations show that corresponding errors vary between seasons, with absolute bias ranging from −30 to 40 W·m−2, absolute root mean square errors (RMSE) from 25 to 60 W·m−2, relative bias ranging from −11% to 7% and relative RMSE from 7% to 22%, depending on the sky condition and the terrain location as well, thus reproducing the observations more faithfully than RAMS, which produces higher errors in comparison to the measurements. In this regard, statistical daily evaluations show absolute bias values varying from −50 to 160 W·m−2, absolute RMSE from 60 to 240 W·m−2, relative bias ranging from −30% to 40% and relative RMSE from 10% to 80%, also depending on the daily initialization and the forecast horizon. This bias variability demonstrates that there is a different trend in the deviation of the model results in relation to the observations, both for the DSSF product and RAMS forecasts, and considering the summer and the winter seasons independently. In this regard, although there is an overestimation of the observed solar radiation within the summer months, this magnitude is underestimated during the winter. Finally, comparing this solar radiation estimates for different atmospheric conditions and different terrain classes, the best results are found under clear skies over flat terrain. This result is achieved using both methodologies.

Graphical Abstract

1. Introduction

Global downward surface shortwave radiation is defined as the irradiance in the solar spectrum reaching the Earth’s surface per unit of surface [1], also known as solar radiation (Rs and solar radiation hereafter). Knowledge of spatiotemporal distributions of this parameter is essential for understanding numerous processes in the climate system, such the water cycle or plant photosynthesis [2]. In this regard, Rs is crucial in hydrology, playing a key role in the modelling of evapotranspiration (ET) as well as air temperature [3,4,5,6,7,8]. Moreover, it is a critical input parameter to crop monitoring systems that rely on agrometeorologic models [9,10]. Finally, Rs is essential for diverse socioeconomic sectors, such as the production of energy from solar energy systems [2,11,12,13,14,15].
Time series of Rs data at specific locations can be obtained from a variety of sources: measured at weather stations, modelled using other, more readily-available meteorological observations (e.g., sunshine duration, cloud cover and air temperature range), numerical weather prediction (NWP) models and reanalysis and satellite observations [10]. However, Rs estimates from weather stations alone are not in general sufficient to integrate solar energy onto accurate gridded Rs time series at high spatial resolutions, as this parameter is most difficult to obtain due to the limited number of weather stations that measure this variable [9,10,15]. In contrast, Rs can be obtained easily by means of NWP and satellite observations. Both sources of information are able to provide high spatial and temporal resolution information over large areas. NWP models and their parameters are available for weather prediction and are the basis of solar yield forecasts as they are most appropriate for solar radiation forecasting from a few hours to days ahead, and of particular importance for application in the energy market, where day-ahead power trading plays a major role in many countries [13,15]. Among the different NWP models, mesoscale models can be run over a smaller area when compared with global scale models, including additional details in its physics. Therefore, provided sufficient computing power, these models can be used to forecast solar irradiance over a wide area with high temporal and spatial resolution [13]. On the other hand, operational satellite systems provide valuable information on atmospheric parameters at regular intervals on a global scale. Nowadays, there is a wide variety of satellites, both geostationary and sun-synchronous, from which Rs can be retrieved regionally or globally such as Terra/Aqua Moderate Resolution Imaging Spectroradiometer (MODIS), the National Oceanic and Atmospheric Administration’s (NOAA) Advanced Very High Resolution Radiometer (AVHRR), the Geostationary Operational Environmental Satellites (GOES) or the Meteosat Second Generation (MSG) Spinning Enhanced Visible and Infrared Imager sensor (SEVIRI). Unlike sun-synchronous sensors, geostationary sensors are especially interesting because of their high temporal resolution, which facilitates mapping of Rs at intervals of 15–30 min over large areas [3]. Among all this satellite data, Rs estimates derived from the MSG SEVIRI data product DSSF (Downwelling Surface Short-wave Radiation Flux), have already been evaluated for different areas over Europe (see, e.g., [3,10,16,17], and will be used in the current study, as it is described in the next paragraph. Comparing satellite methods with NWP models, the latter have some potential advantages over the former, such as the possibility to evaluate solar radiation at global scale over longer periods than satellites. Additionally, NWP models perform a comprehensive simulation of the whole atmospheric system, including ancillary variables such as wind, temperature or relative humidity [18]. However, previous studies have shown that the accuracy achieved using NWP models when computing the surface solar radiation is still significantly less than that obtained using satellite-based models [10,19,20,21]. In these studies, reanalysis data has usually been used to be contrasted with satellite data, due to the fact that in reanalysis one NWP model with fixed parameters is employed for the entire time series, which improves the temporal consistency of retrieved climate variables [10]. In contrast, NWP models and their parameters are frequently updated for weather prediction, thus providing crucial meteorological data, including solar radiation, in a real-time environment. From this point of view, the validation of operational NWP solar radiation forecasts is of significant importance for solar resource assessment and management. Even though a few studies have been performed in this regard, the Weather Research and Forecasting (WRF; [22]) mesoscale model has been used for solar yield forecasting in Spain [13,15,18]. In this regard, [23,24] have evaluated the WRF and RAMS forecasted Rs in Southern Italy. In addition, a comprehensive study conducted by [15] dealt with the comparison of several NWP solar irradiance forecasts in the US, Canada and Europe. Finally, [25,26] have evaluated in these same terms the NWP meteorological mesoscale model (MSM) developed by the Japan Meteorological Agency (JMA) over Japan.
In the current work, we present a regional-scale evaluation of different Rs datasets: NWP forecasts, based on the Regional Atmospheric Modeling System (RAMS; [27,28]), and a satellite-derived product, the DSSF algorithm, for the Valencia Region (eastern Spain). In this regard, RAMS was implemented within an operational forecast environment within this area of study for the winter 2010–2011 and the summer 2011, using the most recent versions of this model, RAMS 4.4 (RAMS44 hereafter) and RAMS 6.0 (RAMS60 hereafter) [29,30,31,32,33]. For these two seasons, this operational system was providing Rs forecasts for different locations distributed along the area of study (Figure 1), with a temporal horizon of three consecutive days (today, tomorrow and the day after tomorrow) and two daily initializations of the model.
Figure 1. Simulation domain configuration and distribution of the meteorological weather stations used in the validation of solar radiation estimates depending on the terrain class: flat (closed square) and hilly (closed circle) in addition to the orography simulated by Regional Atmospheric Modeling System (RAMS) within the finer domain (D3).
Remotesensing 08 00046 g001
Therefore, the main aim of this paper is double. On the one hand, we present a comprehensive evaluation of both the RAMS-forecasted Rs and the DSSF product. In this sense, this mesoscale model outputs and this satellite-based data are compared with surface meteorological observations available within the area of study. On the other hand, the usage of different approaches to obtain Rs estimates will permit us to contrast these two sources of data. The Rs performance and accuracy are then evaluated for these datasets segmented based on terrain classes (flat or hilly), and taking into account the corresponding sky condition (clear or cloudy) together with considering all sky conditions. Additionally, the evaluation process is performed for the winter 2010–2011 and the summer 2011, separately. Winter is defined by the months December–February (DJF) and summer from June to August (JJA). Finally, both RAMS44 and RAMS60 and their two daily initializations are compared as well, so as to acquire a full description of the differences between the most recent versions of the model and the effect of the spin-up on the simulation results.
The paper is structured as follows: Section 2 presents the characterization of the study area, as well as the different datasets used in this study. The evaluation methodology is given in Section 3, while Section 4 is devoted to the analysis of the results. In addition, the discussion of these results is presented in Section 5, particularly including a comparison of those achieved in the current work with those obtained in previous studies. Finally, some concluding remarks are provided in Section 6.

2. Study Area and Solar Radiation Datasets

2.1. Site Characterization

The area of study covers the Valencia Region, in the East coast of the Iberian Peninsula. This region is bordered by the Mediterranean Sea in its Eastern part and surrounded by high mountain ranges, exceeding 1500 m height, near the coast (Figure 1). During the summer, solar heating in this area frequently creates thermally induced mesoscale circulations that develop under clear sky conditions, with strong diurnal variations, and with patterns and intensities that depend on the regional surface energy budget and orography [34]. In this sense, mesoscale circulations are the predominant meteorological situations within this period of the year [35,36]. However, during the winter months, the most dominant situation is that associated with northerly-western circulations [35]. Miró et al. [35] developed a methodology to automatically identify and characterize the daily atmospheric situation for the period of 1958–2008. Applying the same approach to the winter of 2010–2011 and the summer of 2011, we have examined to what degree these specific seasons vary from the typical prevailing in the region, considering the original time interval 1958–2008. As a result, it has been found that the percentage of occurrence of the distinct meteorological situations that this procedure detects is similar when using the whole climatic period separating winter from summertime than when using the winter 2010–2011 and the summer 2011 independently. Thus, it may be said that these particular seasons follow the general and typical patterns prevailing in the Valencia Region considering these two seasons of the year.

2.2. Observational Data

The observational data used in the current study is that supplied by the Centro de Estudios Ambientales de Mediterráneo (Mediterranean Center for Environmental Studies) automatic surface weather stations network. Hourly measurements of the direct Rs from a total of thirteen automatic surface weather stations from this network have been used to perform the validation of the MSG-derived DSSF product and the RAMS results (three of them corresponding to hilly locations and 10 corresponding to flat ones; Figure 1).
These weather stations are equipped with Kipp and Zonen CMP3 pyranometers for irradiation measurement. In this instrument, the thermopile sensor construction measures the solar energy that is received from the total solar spectrum and the whole hemisphere (180 degrees field of view), and measures irradiance up to 2000 W·m−2. It is intended for shortwave global solar radiation measurements in the spectral range from 300 to 2800 nm. Instruments are calibrated every two years. In addition to the calibration of the pyranometer, measurements are quality controlled to reject data that show gross differences with nearby stations. Considering the accuracy of the instrument, while the worst case for expected daily sums given by Kipp and Zonen is ±10%, the typical accuracy is found to be ±5%.

2.3. DSSF Product

Since the launch of the geostationary MSG satellite (MeteoSat Second Generation) in 2004, dedicated Satellite EUMETSAT Application Facilities (SAFs) are providing MSG-derived high-level products to a variety of user communities [37]. In this regard, the SAF for Land Surface Analyses (LSA SAF) provides operational global radiation estimates with the down-welling surface short-wave radiation flux (DSSF) product, obtained by means of the SEVIRI sensor [3,9]. LSA SAF, located at the Portuguese Meteorological Institute in Lisbon, offers the DSSF product separately processed over four geographical regions (Europe, North Africa, South Africa, and South America) and at a 30-min time step using data from the three solar spectrum channels of the MSG/SEVIRI sensor (centered on 0.6, 0.8 and 1.6 μm). The product files are generated in HDF5-format with projection and spatial resolution corresponding to the characteristics of the MSG/SEVIRI instrument data. The pixel size is 3 km at the sub-satellite point, approximately 5 km in Central Europe, and then rapidly increases towards the edge of the observed region [17]. Each product file includes a set of three quality flag images [3]: a land and sea mask, a cloud mask also including snow and ice cover and the DSSF algorithm that was applied (clear or cloudy sky algorithm).
The method used to retrieve this magnitude for the DSSF product is based on the framework of the OSI SAF [16] using the three above mentioned short-wave SEVIRI channels, 0.6 μm, 0.8 μm, and 1.6 μm [38]. This model is designed to compute the effective atmospheric transmittance, applying a clear or cloudy sky retrieval method depending on cloud cover. This latter parameter is provided by the cloud mask developed by the Satellite Application Facility on Support to Nowcasting and Very Short Range Forecasting, which is integrated in the LSA SAF operational system [3,17,38]. The clear sky method computes the atmospheric transmittance and the spherical albedo of the atmosphere based on the methodology by [39]. The water vapour used to estimate the atmospheric transmittance is obtained from the European Center for Medium Range Weather Forecasts and the ozone amount is specified according to the Total Ozone Mapping Spectrometer climatology, while the visibility is currently kept at a fixed value of 20 km. The surface albedo is taken from the LSA SAF near-real-time albedo product [3,17]. The cloudy sky pixels consider a simplified physical description of the radiation transfer in the cloud-atmosphere-surface system according to [40] and [16]. As the cloud transmittance and albedo may be highly variable on small time scales depending on the daily evolution of the clouds [17], the measured radiances in the 0.6 μm, 0.8 μm, and 1.6 μm SEVIRI channels are first transformed to broad-band top-of-atmosphere albedo by applying the spectral conversion relations proposed by [41] and the angular reflectance model of [42].
More information about this product and a more detailed technical description is given in the Product User Manual, available on the project website , as well as in [17,38].

2.4. RAMS Model

The Rs RAMS-forecasts are based on the results provided by the operational weather forecasting system implemented for the study region [29,30,31,32,33]. This NWP system has simultaneously been run using two versions of the RAMS model [27,28]: RAMS44 and RAMS60, for the winter season of 2010–2011 and the 2011 summer season. The model’s domain consists of three nested domains, with horizontal grid-spacing of 48, 27 and 3 km, and 24 vertical levels following a stretched scheme, with a 50-m space near the surface increasing gradually up to 1000 m near the model top at 11,000 m and with nine levels in the lower 1000 m. Due to the staggered coordinate system, the lowest model vertical coordinate was located at about 15 m AGL.
The current RAMS setup includes the Kuo-modified parameterization of sub-grid scale convection processes applied to the coarse domain [43], the [44] scheme as representation of the PBL and surface layer turbulence, and the [45] parameterization for short-wave and long-wave radiation. Finally, the cloud and precipitation microphysics scheme from [46] was applied in all the domains, while the LEAF-2 soil-vegetation surface scheme was used within the RAMS44 environment, while LEAF-3 was used for RAMS60; see [47] for detailed model descriptions. LEAF-3 thus is an update of LEAF-2 that uses the Normalized Difference Vegetation Index (NDVI) to compute essential vegetation characteristics of different vegetation parameters, such as the leaf area index, the vegetation fractional cover, the vegetation albedo or the roughness height. A detailed description of the diverse changes performed is included in [48]. Besides the modification in the LEAF scheme, new features have been incorporated to the model in its version 6.0, covering aspects related to the code structure or input/output files format, as well as new parameterizations, such as the Kain-Fritsch cumulus scheme. For a detailed description of the different changes performed in the transition from RAMS44 to RAMS60, see also [49].
The corresponding RAMS simulations were initialized based on the National Centre for Environmental Prediction (NCEP) Global Forecast System (GFS) at 6 h intervals and 1 × 1 degree resolution globally. In addition, a Four-Dimensional Data Assimilation (FDDA) technique was applied to define the forces at the lateral boundaries of the outermost five grid cells of the largest domain. Weather forecasts were performed twice a day, at 00:00 and 12:00 UTC, for both RAMS44 and RAMS60, using the GFS forecast grid from its forecast cycle 12 h earlier, and for a forecast range of three complete days (today, tomorrow and the day after tomorrow). Finally, RAMS forecast outputs are available once every hour for display and analysis purposes.

3. Evaluation Methodology

Both the DSSF product and the RAMS forecasts are evaluated with respect to ground observations at hourly and daily time scales. Considering the DSSF product, a standard day consists of 48 files in HDF5 format, one image every 30 min. This has required aggregation of the DSSF product, available at 30 min intervals. In order to compare the satellite-derived and RAMS-forecasted Rs with the surface weather stations, both DSSF and model outputs were extracted at the corresponding locations. In the case of the RAMS model, we developed a software tool to extract and store, for each daily simulation within the period of study (winter of 2010–2011 and summer of 2011), the hourly simulated Rs, at each selected weather station location using Domain 3 of the simulation (Figure 1). This surface data was then stored in a database for the three days of simulation, the two daily RAMS initializations and the two RAMS versions [33]. In the case of the DSSF model, the daily 48 files were downloaded and processed for the winter 2010–2011 and the summer 2011, even though there are days that have fewer files within the daily cycle. To minimize the impact of data re-sampling due to reprojection, the analysis was carried out in the original projection and spatial resolution of the DSSF product [3]. Once the DSSF product was imported, data extraction was performed using the “nearest point” interpolation in space to the meteorological station locations.
The evaluation procedure used in the current study follows basically that used in [3]. DSSF algorithm performance is analysed under both clear and cloudy sky conditions for hourly and daily evaluation. In the hourly-basis assessment, each hour and pixel record is flagged in terms of cloudy mask and DSSF algorithm with the aim of reporting the corresponding sky conditions. A pixel masked as clear corresponds to a pixel with both the two 30 min intervals DSSF files classified as clear (i.e., a pixel masked as clear both at 12:00 UTC and 12:30 UTC). On the other hand, a pixel masked as cloudy corresponds to a pixel with both the two 30 min intervals DSSF files classified as cloudy. Besides, pixels with different quality flags for a specific hour were excluded in the analysis (i.e., a pixel masked as clear at 12:00 UTC and cloudy at 12:30 UTC). In the daily-basis assessment, the hourly generated files are used to compute the daily Rs average. In this case, the sky condition is also considered. Thus, each day and pixel record is flagged in this sense. To do this, we have used the criterion proposed by [3], which considers a clear-sky day at a given pixel if ≥80% of the time samples between dawn and dusk were cloud free. Moreover, they propose that at least 90% of the potential images within a day must be available as criteria for computation of daily average Rs from the DSSF product. These hourly and daily cloudy and clear sky conditions obtained for DSSF are then exported to the RAMS results and the surface-based data. Therefore, the observed and forecasted hourly records have been recalculated to daytime averages as well.
The assessment of the DSSF product and the RAMS forecasts is performed using several statistical indexes and measures of error, such as the mean bias error (MBE), the mean absolute error (MAE), the root mean square error (RMSE) and the index of agreement (IoA), as defined by the following equations:
MBE= 1 N i= 1 N ( F i O i )
M A E = 1 N i = 1 N | F i O i |
R M S E = 1 N i = 1 N ( F i O i ) 2
I o A = 1 N ( R M S E ) 2 i = 1 N ( | F i O ¯ | + | O i O ¯ | ) 2
where N represents the number of observations included in the calculation. F represents the simulated value and O the observation, while O correspond to the time average observed.
The Mean Bias Error (MBE) is defined as the average of the simulated value minus the observed value and quantifies the systematic error of the model or estimator, the RMSE is used as a measure of the accuracy, and corresponds to the square root of the individual differences between values simulated by a model or an estimator and the observed values, the Mean Absolute Error (MAE) indicates the magnitude of the average error. Finally, the Index of Agreement (IoA), is a modified correlation coefficient that measures the degree to which a model's prediction is free of error. A value of 0 means complete disagreement while a value of 1 implies a perfect agreement.
In addition, the relative errors of the MBE, MAE and RMSE (rMBE, rMAE and rRMSE, respectively) are also calculated as the ratio between the corresponding statistical score and the mean ground observations.
The different accuracy statistics for solar radiation are then computed at hourly and daily time steps. The hourly evaluation considers all hourly records within the corresponding season: winter 2010–2011 (DJF) and summer 2011 (JJA). Thus, the observed and forecasted solar radiation for each hour within each day in the period of these seasons are compared. As mentioned previously, the available information has been divided by areas (flat and hilly terrain), and by sky condition (clear, cloudy and all skies). On the other hand, the daily evaluation includes the same statistical scores but taking into account the daily average records within these seasons of the year, that is, the average observed and forecasted solar radiation for each day within the corresponding season. In the case of RAMS, both evaluation time steps are performed independently for all days of simulation: today, tomorrow and the day after tomorrow (D1–D3 respectively), the two versions of the model (4.4 and 6.0) and the two daily initialization (00Z and 12Z). Considering this distribution of the available data, the next format is used throughout the text: (Day:RAMS Version-RAMS Initialization). For instance, D1:4.4-00Z represents the results computed (within the daily or hourly evaluation) for the first day of simulation using the 00Z daily initialization of RAMS44.
Finally, the different accuracy measurements and errors presented in the current section are shown with one significant figure only if the first two significant figures of the error are higher than 25 and with two significant figures otherwise.

4. Results

4.1. Daily Evaluation

Statistical evaluation at daily time steps, with data segmented based on terrain classes (flat or hilly), considering all sky conditions, is presented in Table 1 for the summer and the winter seasons. In addition, a comparison of the DSSF Rs with observations is included in Figure 2 and Figure 3, for summer and winter time respectively, based on both atmospheric conditions and terrain classes. In general, the DSSF product shows a tendency to overestimate the measurements during the summer season in all cases (Figure 2). Contrasting sky conditions, a more notable data dispersion is found for cloudy skies both over flat and hilly terrain. In this regard, a better agreement with observations is obtained over flat terrain under clear sky conditions compared to the one retrieved over hilly sites under cloudy skies. However, the DSSF algorithm underestimates on average the measured Rs at daily time scale during the winter season in all cases (Figure 3), thus producing the opposite trend observed within the summer.
Figure 2. Daily Downwelling Surface Shortwave Flux (DSSF) (Rs DSSF; W·m−2) solar radiation vs. daily solar radiation measured at the surface weather stations (Rs Meteo; W·m−2) during the summer 2011, segmented based on terrain classes (flat and hilly) and atmospheric condition (clear and cloudy sky): flat-clear (a); flat-cloudy (b); hilly-clear (c) and hilly-cloudy (d). Statistical scores values (RMSE and MBE) presented in W·m−2.
Remotesensing 08 00046 g002
Figure 3. Same as Figure 2, but during the winter 2010–2011: flat-clear (a); flat-cloudy (b); hilly-clear (c) and hilly-cloudy (d). Statistical scores values (RMSE and MBE) presented in W·m−2.
Remotesensing 08 00046 g003
Table 1. Daily solar radiation error and accuracy statistics, depending on flat or hilly terrain and considering all sky conditions, during the summer 2011 and the winter 2010–2011. Mean bias error (MBE), mean absolute error (MAE) and root mean square error (RMSE) in W·m−2. Relative errors (%) rMBE, rMAE and rRMSE in brackets at the right.
Flat TerrainHilly Terrain
MBEMAERMSEIoAMBEMAERMSEIoA
All sky—Summer
DSSF30 (5)40 (7)40 (9)1.017 (4)40 (9)60 (12)1.0
D1:4.4-00Z70 (13)100 (19)140 (30)0.770 (15)110 (24)150 (30)0.7
D1:4.4-12Z60 (12)80 (16)110 (21)0.770 (15)100 (21)130 (30)0.7
D2:4.4-00Z70 (14)100 (195)130 (25)0.670 (14)120 (25)150 (30)0.7
D2:4.4-12Z60 (12)100 (20)140 (30)0.770 (16)120 (30)150 (30)0.7
D3:4.4-00Z60 (12)100 (19)140 (30)0.760 (13)120 (30)150 (30)0.7
D3:4.4-12Z70 (14)100 (19)140 (30)0.670 (15)120 (30)150 (30)0.7
D1:6.0-00Z90 (17)100 (20)140 (30)0.690 (19)120 (30)160 (30)0.7
D1:6.0-12Z80 (15)90 (17)120 (23)0.770 (15)100 (22)140 (30)0.7
D2:6.0-00Z100 (18)110 (22)150 (30)0.6100 (20)130 (30)160 (30)0.7
D2:6.0-12Z80 (15)110 (22)150 (30)0.690 (19)130 (30)160 (30)0.7
D3:6.0-00Z80 (15)110 (22)150 (30)0.690 (20)150 (30)180 (40)0.6
D3:6.0-12Z90 (17)110 (22)150 (30)0.690 (18)120 (30)160 (30)0.7
All sky—Winter
DSSF−16 (−6)25 (9)30 (11)1.0−30 (−10)30 (12)40 (14)1.0
D1:4.4-00Z−30 (−9)90 (30)120 (40)0.8−22 (−7)80 (30)110 (40)0.8
D1:4.4-12Z−40 (−14)80 (30)110 (40)0.8−30 (−10)80 (26)100 (40)0.9
D2:4.4-00Z−10 (−3)90 (30)120 (40)0.8−10 (−4)80 (30)120 (40)0.8
D2:4.4-12Z−20 (−7)80 (30)110 (40)0.8−10 (−3)70 (25)110 (40)0.9
D3:4.4-00Z−7 (−3)90 (30)120 (40)0.80.6 (0.2)90 (30)120 (40)0.8
D3:4.4-12Z4 (1.5)80 (30)110 (40)0.811 (4)80 (30)110 (40)0.8
D1:6.0-00Z−21 (−7)80 (30)110 (40)0.8−19 (−6)80 (30)100 (40)0.9
D1:6.0-12Z−30 (−12)80 (30)110 (40)0.8−30 (−10)70 (25)100 (30)0.9
D2:6.0-00Z−6 (−2.1)80 (30)110 (40)0.85 (1.7)80 (30)110 (40)0.8
D2:6.0-12Z−17 (−6)80 (30)110 (40)0.8−7 (−2.3)70 (24)100 (30)0.9
D3:6.0-00Z−8 (−3)80 (30)120 (40)0.85 (1.6)80 (30)120 (40)0.8
D3:6.0-12Z4 (1.4)80 (30)110 (40)0.813 (5)80 (30)110 (40)0.8
Considering the DSSF product and segmenting this dataset based on terrain classes, a IoA of 1 is observed considering all skies during the summer, indicating that the daily and the day-to-day evolution of the solar radiation is very well reproduced by this model. In addition, the different statistics show slightly higher errors over hilly terrain. Nevertheless, a difference in terms of RMSE and MBE of 20 W·m−2 and 13 W·m−2, respectively, is observed between flat and hilly stations merging all sky conditions during the summer. Segmenting the DSSF dataset based on sky conditions, clear skies show in general a better agreement than cloudy conditions in flat locations (Table 2). In this sense, a difference of 10 W·m−2 in RMSE and 20 W·m−2 in MBE is obtained between clear and cloudy conditions. It is worth noting that the MBE shows a positive trend in general, meaning that the DSSF algorithm overestimates Rs measured at the meteorological stations, as shown previously in Figure 2. In the case of clear skies, a similar value of MBE is obtained for both flat and hilly terrain (40 W·m−2). In contrast, although the MBE is still positive in flat locations under cloudy conditions, the magnitude is slightly negative over hilly terrain under the same cloud situation. This difference is the responsible for the lower MBE value obtained over hilly locations when compared to the one obtained in flat terrain considering all sky conditions. Finally, it is interesting to note that MAE is 40 W·m−2 in all cases, with a relative MAE ranging from 6% to 11% depending on the sky condition and terrain class.
Table 2. Daily solar radiation error and accuracy statistics, depending on flat or hilly terrain and clear or cloudy conditions, during the summer 2011. MBE, MAE and RMSE in W·m−2. Relative errors (%) rMBE, rMAE and rRMSE in brackets at the right.
Flat TerrainHilly Terrain
MBEMAERMSEIoAMBEMAERMSEIoA
Clear sky
DSSF40 (6)40 (6)40 (7)0.840 (7)40 (7)60 (10)0.8
D1:4.4-00Z40 (7)60 (10)70 (12)0.660 (11)70 (13)90 (15)0.6
D1:4.4-12Z40 (8)50 (9)60 (10)0.760 (11)70 (12)80 (15)0.6
D2:4.4-00Z40 (7)60 (10)70 (11)0.650 (9)80 (13)90 (16)0.6
D2:4.4-12Z40 (7)60 (10)70 (13)0.650 (10)80 (14)90 (16)0.6
D3:4.4-00Z40 (7)60 (10)70 (12)0.650 (9)80 (14)90 (16)0.6
D3:4.4-12Z40 (7)50 (10)70 (12)0.650 (9)70 (13)90 (16)0.6
D1:6.0-00Z50 (9)70 (11)70 (13)0.670 (13)80 (14)90 (16)0.6
D1:6.0-12Z50 (9)60 (10)60 (11)0.770 (12)70 (13)80 (14)0.6
D2:6.0-00Z60 (10)60 (11)70 (12)0.670 (12)70 (13)90 (15)0.6
D2:6.0-12Z50 (9)70 (12)80 (14)0.570 (13)80 (14)90 (16)0.6
D3:6.0-00Z50 (9)60 (11)70 (12)0.660 (11)80 (14)90 (17)0.6
D3:6.0-12Z60 (10)60 (11)70 (12)0.670 (13)80 (14)90 (16)0.6
Cloudy sky
DSSF21 (5)40 (9)50 (11)1.0−3 (−0.7)40 (11)60 (14)0.9
D1:4.4-00Z110 (30)160 (40)200 (50)0.580 (19)150 (40)180 (50)0.6
D1:4.4-12Z100 (23)140 (30)170 (40)0.680 (21)130 (30)160 (40)0.6
D2:4.4-00Z130 (30)170 (40)200 (50)0.580 (21)160 (40)190 (50)0.6
D2:4.4-12Z100 (24)170 (40)200 (50)0.590 (23)160 (40)190 (50)0.6
D3:4.4-00Z100 (23)180 (40)210 (50)0.580 (19)170 (40)200 (50)0.6
D3:4.4-12Z120 (30)180 (40)210 (50)0.590 (22)170 (40)190 (50)0.5
D1:6.0-00Z140 (30)160 (40)200 (50)0.5110 (30)160 (40)200 (50)0.6
D1:6.0-12Z110 (30)140 (30)170 (40)0.680 (20)140 (30)170 (40)0.6
D2:6.0-00Z160 (40)190 (50)220 (50)0.5130 (30)180 (40)210 (50)0.5
D2:6.0-12Z120 (30)180 (40)210 (50)0.5110 (30)170 (40)200 (50)0.6
D3:6.0-00Z120 (30)200 (50)240 (60)0.4130 (30)220 (50)240 (60)0.5
D3:6.0-12Z140 (30)200 (50)230 (60)0.4100 (30)170 (40)210 (50)0.5
In the case of the winter season (Table 3), the statistical evaluation at daily time steps, shows a negative value of the MBE score using the DSSF dataset for both terrain classes, indicating the underestimation previously introduced in Figure 3. As it was already observed in the summer, the accuracy of the DSSF algorithm is lower under cloud cover relative to the clear-sky case over flat terrain. In this regard, a difference of 15 W·m−2 in RMSE and a relative RMSE lower than 10% for these sort of stations is observed comparing cloudy with clear skies. However, over hilly terrain similar results are reproduced by DSSF under both sky conditions.
Table 3. Daily solar radiation error and accuracy statistics, depending on flat or hilly terrain and clear or cloudy conditions, during the winter 2010–2011. MBE, MAE and RMSE in W·m−2. Relative errors (%) rMBE, rMAE and rRMSE in brackets at the right.
Flat TerrainHilly Terrain
MBEMAERMSEIoAMBEMAERMSEIoA
Clear sky
DSSF−13 (−4)21 (−6)25 (7)1.0−30 (−9)30 (9)40 (10)0.9
D1:4.4-00Z−25 (−7)50 (−15)80 (21)0.7−20 (−5)50 (12)70 (19)0.7
D1:4.4-12Z−25 (−7)60 (−15)80 (23)0.7−18 (−5)50 (13)70 (19)0.7
D2:4.4-00Z−15 (−4)50 (−14)80 (22)0.7−5 (−1.3)40 (10)80 (19)0.7
D2:4.4-12Z−18 (−5)50 (−14)70 (20)0.8−4 (−0.9)40 (9)60 (15)0.8
D3:4.4-00Z−18 (−5)50 (−13)80 (22)0.7−8 (−2.0)40 (11)70 (18)0.7
D3:4.4-12Z−11 (−3)50 (−13)70 (20)0.7−1.5 (−0.4)40 (10)70 (19)0.7
D1:6.0-00Z−19 (−5)40 (−12)70 (18)0.8−12 (−3)40 (11)60 (16)0.8
D1:6.0-12Z−23 (−6)50 (−14)80 (20)0.7−14 (−4)40 (11)60 (16)0.8
D2:6.0-00Z−19 (−5)50 (−13)80 (22)0.7−0.8 (−0,2)40 (9)70 (18)0.7
D2:6.0-12Z−13 (−3)40 (−11)60 (17)0.8−3 (−0.8)40 (9)60 (15)0.8
D3:6.0-00Z−25 (−7)50 (−13)80 (21)0.7−8 (−2.2)40 (11)90 (22)0.6
D3:6.0-12Z−21 (−6)50 (−12)80 (20)0.73 (0.7)40 (9)60 (16)0.8
Cloudy sky
DSSF−19 (−9)30 (14)40 (19)1.0−23 (−11)30 (16)40 (22)1.0
D1:4.4-00Z−30 (−14)120 (60)150 (70)0.6−23 (−12)120 (60)140 (70)0.7
D1:4.4-12Z−50 (−30)110 (50)130 (70)0.6−40 (−21)100 (50)130 (60)0.7
D2:4.4-00Z−3 (−1.2)120 (60)150 (70)0.6−15 (−8)120 (60)140 (70)0.7
D2:4.4-12Z−23 (−12)120 (60)140 (70)0.6−16 (−8)110 (60)140 (70)0.7
D3:4.4-00Z3 (1.5)120 (60)150 (70)0.69 (4)130 (60)150 (80)0.6
D3:4.4-12Z20 (10)110 (50)140 (70)0.722 (11)120 (60)140 (70)0.7
D1:6.0-00Z−23 (−12)110 (50)140 (70)0.6−25 (−13)110 (50)130 (70)0.7
D1:6.0-12Z−40 (−21)110 (50)130 (60)0.6−40 (−20)100 (50)120 (60)0.7
D2:6.0-00Z7 (4)120 (60)140 (70)0.711 (5)120 (60)150 (70)0.7
D2:6.0-12Z−21 (−10)110 (50)140 (70)0.6−10 (−5)100 (50)130 (60)0.7
D3:6.0-00Z8 (4)120 (60)150 (70)0.618 (9)120 (60)150 (70)0.7
D3:6.0-12Z30 (14)100 (50)130 (60)0.724 (12)120 (60)140 (70)0.7
Considering the RAMS model results, the forecasts accuracy tends to decrease as the simulation progresses (Table 1), as expected. However, the different statistics present comparable values for the first, second and third day of simulation, with a difference of 10–20 W·m−2 in RMSE between the first and the third day of simulation depending on the RAMS version and its initialization over flat terrain and all sky conditions. Besides, comparing the 00 with the 12 UTC run, the second one produces the best results considering all statistical scores in both RAMS44 and RAMS60 using the first day of simulation. Thus, it seems that the simulation without spin-up reproduces the solar radiation measurements for this day in a better way than considering a spin-up of 12 h in the corresponding RAMS run. This result is obtained in general for the summer as well as for the winter season. Taking into account the MBE score, the forecasted Rs is overestimated by RAMS in relation to the measurements in all cases during the summer, thus producing the same trend found using the DSSF algorithm. To clarify this issue, Figure 4 has been introduced so as to compare the RAMS Rs with observations for both versions of the model within the first day of simulation and the 12 UTC run, considering that this RAMS initialization is the most accurate one according to the different statistical estimations. This model shows a good agreement in the case of clear skies both for flat and hilly locations, while a greater data dispersion is observed, as using the DSSF product, under cloudy conditions over all terrain. However, comparing DSSF with RAMS, a more marked data dispersion is reproduced by RAMS when cloudiness is considered (Figure 2b,d and Figure 4b,d). In all cases, the RAMS-forecasted Rs is overestimated in relation to the measurements, as shown by the positive MBE in Table 1. Although RAMS is more stable under clear skies for both sort of stations (Table 2), more differences arise under cloudy conditions between RAMS44 and RAMS60 (Figure 4). Segmenting the RAMS results based on terrain classes, slightly higher errors for hilly terrain are observed. Additionally, contrasting RAMS forecasted data under different sky conditions, a significant difference is observed (Table 2). For example, a difference in terms of RMSE higher than 100 W·m−2 and higher than 50 W·m−2 in MBE has been found comparing both sky conditions. Once again, the same result is observed in the DSSF dataset, but with significantly lower errors than those reproduced by RAMS. These results show differences related to cloudiness, more difficult to forecast than clear sky conditions in all cases. However, although a higher accuracy is obtained over flat terrain for clear sky conditions compared to that obtained over hilly terrain, this results is not that clear under the presence of cloudiness. Table 2 shows that during the summer season and under cloudy skies, RAMS forecasts over hilly terrain shows a better agreement with the observations when compared to the results yielded by this model over flat terrain, with differences of about 10–20 W·m−2 in RMSE and of about in 10–50 W·m−2 MBE, depending on the RAMS version and its initialization. Considering the relative MBE, this statistical score is maintained below or around 10% under clear conditions, while it rises to values around 20%–30% under cloudy conditions, depending on the RAMS forecast horizon.
For the winter season, the same results observed within the summer in terms of RAMS version and initialization are obtained. However, the tendency of the forecasted Rs under cloudy skies is not that clear for the winter as in the summer time. In any case, the MBE as well as the other statistical scores show in general a better accuracy during the winter compared to the results obtain for the summer. For example, contrasting both seasons of the year under clear sky conditions, a difference of about 50 W·m−2 is obtained for RMSE over hilly terrain, decreasing to a value of about 10 W·m−2 in the case of flat locations. It is interesting to note that the highest differences between these two seasons of the year are obtained as the simulation progresses, while similar results are reached for the first day of simulation, specially over flat terrain. This outcome is also reproduced by RAMS separating between cloudy and clear conditions (Figure 5). As a difference observed in the winter in comparison with the summer time, RAMS shows a tendency to produce a significant cloudiness under clear sky conditions, specially over flat terrain (Figure 5a) but also in hilly locations (Figure 5c). Additionally, there is a clear change in the MBE trend with the forecast horizon during the winter season, changing from negative values within the first day of simulation to increasing positive values as the simulation progresses (Table 1 and Table 3).
Figure 4. Daily Regional Atmospheric Modeling System (RAMS) (Rs Fcst; W·m−2) solar radiation vs. daily solar radiation measured at the surface weather stations (Rs Meteo; W·m−2) during the summer 2011, segmented based on terrain classes (flat and hilly) and atmospheric condition (clear and cloudy sky): flat-clear (a); flat-cloudy (b); hilly-clear (c) and hilly-cloudy (d). Statistical scores values (RMSE and MBE) presented in W·m−2.
Remotesensing 08 00046 g004
Figure 5. Same as Figure 4, but during the winter 2010–2011: flat-clear (a); flat-cloudy (b); hilly-clear (c) and hilly-cloudy (d). Statistical scores values (RMSE and MBE) presented in W·m−2.
Remotesensing 08 00046 g005

4.2. Hourly Evaluation

Statistical evaluation at hourly time steps, with data segmented based on terrain classes (flat or hilly), considering all sky conditions, is presented in Table 4 for the summer and the winter seasons. Similar results as those described in the previous section at daily time steps are found for the hourly evaluation as well. Considering the satellite retrieval performance within the summer season, the MBE is positive in all cases, indicating that the DSSF product tends to overestimate the measured Rs. In addition, this model shows a significant dependence on local terrain conditions, with better agreement with observations over flat areas. In this regard, the difference in accuracy between hilly and flat classes is 20 W·m−2 in terms of MAE and RMSE scores. However, the MBE is reduced to about the half over hilly areas compared to that obtained in flatter sites, with values of 17 and 30 W·m−2, respectively. However, the MBE shows the opposite trend during the winter season, with negative values, meaning that the DSSF algorithm underestimates the observed Rs. In this case, the MBE is reduced to about the half over flat classes compared to that obtained in more complex areas, with values of −16 and −30 W·m−2, respectively. It is interesting to note that the accuracy estimations are notably reduced in the winter season when compared to those computed for the summer. In this regard, the difference in accuracy between summer and winter is reduced in 30 W·m−2 and 50 W·m−2 in terms of RMSE, over flat and hilly terrain, respectively.
Table 4. Hourly solar radiation error and accuracy statistics, depending on flat or hilly terrain and considering all sky conditions, during the summer 2011 and the winter 2010–2011. MBE, MAE and RMSE in W·m−2. Relative errors (%) rMBE, rMAE and rRMSE in brackets at the right.
Flat TerrainHilly Terrain
MBEMAERMSEIoAMBEMAERMSEIoA
All sky-Summer
DSSF30 (5)60 (12)90 (17)1.017 (4)80 (17)110 (24)1.0
D1:4.4-00Z70 (13)140 (30)200 (40)0.970 (14)170 (40)210 (50)0.8
D1:4.4-12Z60 (12)130 (30)190 (40)0.970 (15)170 (30)240 (50)0.8
D2:4.4-00Z70 (13)140 (30)200 (40)0.960 (13)180 (40)250 (50)0.8
D2:4.4-12Z60 (12)140 (30)200 (40)0.970 (15)180 (40)250 (50)0.8
D3:4.4-00Z60 (12)140 (30)200 (40)0.960 (13)180 (40)250 (50)0.8
D3:4.4-12Z70 (14)140 (30)200 (40)0.970 (14)180 (40)250 (50)0.8
D1:6.0-00Z90 (17)140 (30)200 (40)0.990 (19)180 (40)250 (50)0.8
D1:6.0-12Z70 (14)140 (30)190 (40)0.970 (15)160 (30)230 (50)0.8
D2:6.0-00Z90 (18)150 (30)210 (40)0.9100 (20)180 (40)240 (50)0.8
D2:6.0-12Z80 (15)150 (30)210 (40)0.990 (19)170 (40)240 (50)0.8
D3:6.0-00Z80 (15)150 (30)210 (40)0.990 (19)190 (40)260 (50)0.8
D3:6.0-12Z90 (17)150 (30)210 (40)0.990 (18)170 (40)240 (50)0.8
All sky-Winter
DSSF−16 (−6)40 (14)60 (20)1.0−30 (−10)50 (17)60 (22)1.0
D1:4.4-00Z−30 (−9)110 (40)160 (50)0.8−22 (−7)110 (40)160 (50)0.8
D1:4.4-12Z−40 (−13)110 (40)160 (50)0.8−30 (−10)110 (40)150 (50)0.9
D2:4.4-00Z−8 (−3)110 (40)160 (50)0.8−10 (−3)110 (40)150 (50)0.8
D2:4.4-12Z−20 (−7)110 (40)150 (50)0.8−10 (−3)110 (40)150 (50)0.9
D3:4.4-00Z−7 (−2.3)120 (40)160 (60)0.81.5 (0.5)110 (40)160 (50)0.8
D3:4.4-12Z5 (1.8)110 (40)150 (50)0.811 (4)110 (40)160 (50)0.8
D1:6.0-00Z−21 (−7)110 (40)150 (50)0.9−19 (−7)110 (40)150 (50)0.9
D1:6.0-12Z−30 (−11)110 (40)150 (50)0.8−30 (−10)110 (40)150 (50)0.9
D2:6.0-00Z−6 (−1.9)110 (40)160 (50)0.85 (1.7)110 (40)160 (50)0.8
D2:6.0-12Z−16 (−6)110 (40)150 (50)0.8−7 (−2.3)110 (40)150 (50)0.9
D3:6.0-00Z−7 (−2.5)120 (40)160 (60)0.85 (1.8)110 (40)160 (50)0.8
D3:6.0-12Z5 (1.6)120 (40)160 (50)0.813 (4)110 (40)150 (50)0.8
Concerning the RAMS model, the MBE is positive at hourly time steps in all cases, indicating that the RAMS-forecasted Rs is overestimated both over flat and hilly terrain, and considering the two RAMS versions and the two daily initializations as well. In contrast, this trend is the opposite during the winter, as it was also mentioned in the previous section. For instance, the MBE reproduced by RAMS60 using the 12 UTC simulation, shows a value of 70 W·m−2 during the summer and it takes a value of −30 W·m−2 during the winter. Additionally, the difference in accuracy between these two seasons of the year is reduced about 100 W·m−2 and 60–70 W·m−2 in general in terms of RMSE and MAE, respectively, using the RAMS model for hilly locations. In contrast, these differences are reduced to about 50 W·m−2 and 20–30·W·m−2 in general in terms of RMSE and MAE over flat terrain. Considering the IoA, values above 0.9 are obtained in most of the cases, meaning that the daily and the day-to-day evolution of the solar radiation is very well reproduced by this model, both at summer and winter time. However, this statistical score shows more difficulties using RAMS forecasts during the summer over hilly terrain. Nevertheless, even in these cases, a high value in terms of IoA (0.8) is still obtained.
Table 5 introduces the summer time data separated by terrain classes (flat or hilly) and sky conditions (clear and cloudy). Once again, the MBE computed for the DSSF product shows the overestimation of the measured Rs under clear sky conditions and for both sort of stations, with a value of 40 W·m−2. However, a slight negative MBE value of −4 W·m−2 is obtained under cloudy skies over hilly terrain. The difference in accuracy in terms of RMSE is about 60 W·m−2 over flat terrain and 40 W·m−2 over hilly sites, while it is of 40 W·m−2 in terms of MAE over both terrain classes.
Table 5. Hourly solar radiation error and accuracy statistics, depending on flat or hilly terrain and clear or cloudy conditions, during the summer 2011. MBE, MAE and RMSE in W·m−2. Relative errors (%) rMBE, rMAE and rRMSE in brackets at the right.
Flat TerrainHilly Terrain
MBEMAERMSEIoAMBEMAERMSEIoA
Clear sky
DSSF40 (6)50 (8)60 (10)1.040 (7)60 (11)90 (16)1.0
D1:4.4-00Z40 (7)90 (16)130 (22)0.960 (11)110 (19)150 (30)0.9
D1:4.4-12Z40 (8)90 (15)110 (20)1.060 (11)100 (19)140 (30)0.9
D2:4.4-00Z40 (6)90 (16)130 (22)0.950 (9)110 (20)170 (30)0.9
D2:4.4-12Z40 (7)90 (16)130 (22)0.950 (10)110 (20)160 (30)0.9
D3:4.4-00Z40 (7)90 (16)120 (21)1.050 (9)110 (20)160 (30)0.9
D3:4.4-12Z40 (7)90 (16)120 (21)1.050 (9)110 (20)160 (30)0.9
D1:6.0-00Z50 (9)90 (16)120 (21)1.070 (13)110 (19)150 (30)0.9
D1:6.0-12Z50 (9)90 (16)120 (20)1.060 (11)110 (19)140 (30)0.9
D2:6.0-00Z60 (10)90 (16)120 (21)1.070 (12)110 (19)140 (25)0.9
D2:6.0-12Z50 (9)100 (17)130 (22)0.970 (13)110 (19)140 (30)0.9
D3:6.0-00Z50 (9)90 (16)120 (21)1.060 (11)110 (21)160 (30)0.9
D3:6.0-12Z60 (10)90 (16)120 (21)1.070 (13)110 (19)140 (24)0.9
Cloudy sky
DSSF21 (5)90 (20)120 (30)1.0−4 (−1.0)100 (24)130 (30)0.9
D1:4.4-00Z110 (30)220 (50)280 (70)0.870 (18)230 (60)300 (70)0.7
D1:4.4-12Z100 (23)210 (50)280 (70)0.880 (20)220 (60)300 (70)0.7
D2:4.4-00Z130 (30)210 (50)280 (70)0.880 (20)240 (60)310 (80)0.7
D2:4.4-12Z100 (24)220 (50)280 (70)0.890 (22)230 (60)310 (80)0.7
D3:4.4-00Z100 (23)220 (50)290 (70)0.870 (18)240 (60)310 (80)0.7
D3:4.4-12Z130 (30)220 (50)280 (70)0.890 (22)240 (60)310 (80)0.7
D1:6.0-00Z140 (30)220 (50)280 (70)0.8110 (30)240 (60)310 (80)0.7
D1:6.0-12Z110 (30)220 (50)280 (70)0.880 (19)220 (60)300 (70)0.7
D2:6.0-00Z160 (40)240 (60)300 (70)0.7120 (30)240 (60)310 (80)0.7
D2:6.0-12Z120 (30)230 (50)290 (70)0.8110 (30)240 (60)310 (80)0.7
D3:6.0-00Z120 (30)250 (60)320 (80)0.7120 (30)260 (70)330 (80)0.7
D3:6.0-12Z140 (30)240 (60)310 (80)0.7100 (25)250 (60)320 (80)0.7
Contrasting the results reproduced by DSSF under different cloudiness observations, it is found that clear sky conditions show better measurement agreement than cloudy conditions in both flat and hilly areas. The same result is found for the RAMS forecasts (Table 5). However, higher differences in accuracy are observed in this latter case. In this regard, although the RMSE and MAE are about 120 W·m−2 and 90 W·m−2 under clear sky conditions in flat terrain, they rise up to about 300 W·m−2 and 220 W·m−2, respectively. This difficulty of the RAMS simulations in forecasting cloudy conditions is reflected in the IoA as well. In this regard, although values higher than 0.9 are reproduced under clear sky conditions, this statistical score is reduced to 0.7 over hilly terrain in the presence of cloudiness. Additionally, the relative errors show values of MBE below 10% over flat terrain and around 10% over hilly terrain, under clear skies, that raise to 30% in the presence of cloudiness. On the other hand, RAMS overestimates the measurements in all cases during the summer, as shown by the positive MBE score. However, a significant difference is obtained for this statistical score contrasting cloudy with clear conditions in both flat and hilly areas, between 10 and 100 W·m−2 approximately, depending on the RAMS versions and its initialization over flat terrain and all sky conditions.
The higher similarity of the RMSE and MAE values for the RAMS model forecasts under cloudy conditions (Table 5), compared to those found for MBE, is based on the errors definition as indicated in section 3. In this regard, although more variability is shown for MBE, identical values are found for RMSE and MAE under cloudy conditions as the discrepancies between the model and the observations are higher in this case and the corresponding error is shown with one significant figure only if the first two significant figures of the error are higher than 25. Therefore, the errors arrangement is the reason why different numerical values of MBE correspond to the same value of RMSE and MAE for different verification datasets.
Finally, the winter time data separated by terrain classes (flat or hilly) and sky conditions (clear and cloudy) is included in Table 6. In this case, the DSSF algorithm underestimates the observed Rs, as reflected by the negative MBE in all cases, with a relative MAE ranging from −11% to −4%, and a relative RMSE varying from 10% to 40% depending on the sky condition and the terrain class. Using this satellite product, the difference in accuracy in terms of RMSE and MAE is 30 and 20 W·m−2, respectively, comparing clear with cloudy skies in all terrains. Comparing these results with the RAMS-based forecasts, the same negative tendency is observed.
Table 6. Hourly solar radiation error and accuracy statistics, depending on flat or hilly terrain and clear or cloudy conditions, during the winter 2010–2011. MBE, MAE and RMSE in W·m−2. Relative errors (%) rMBE, rMAE and rRMSE in brackets at the right.
Flat TerrainHilly Terrain
MBEMAERMSEIoAMBEMAERMSEIoA
Clear sky
DSSF−13 (−4)30 (8)40 (10)1.0−30 (−9)40 (11)50 (13)1.0
D1:4.4-00Z−25 (−7)80 (22)110 (30)0.9−20 (−5)80 (21)110 (30)0.9
D1:4.4-12Z−23 (−6)80 (23)110 (30)0.9−20 (−4)80 (21)110 (30)0.9
D2:4.4-00Z−15 (−4)80 (22)120 (30)0.9−5 (−1.4)70 (19)110 (30)0.9
D2:4.4-12Z−17 (−5)80 (22)110 (30)0.9−3 (−0.8)70 (18)100 (25)0.9
D3:4.4-00Z−18 (−5)80 (22)110 (30)0.9−7 (−1.8)70 (19)100 (30)0.9
D3:4.4-12Z−11 (−3)80 (21)110 (30)0.9−1.8 (−0.5)70 (19)100 (30)0.9
D1:6.0-00Z−19 (−5)80 (21)100 (30)0.9−12 (−3)80 (19)100 (30)0.9
D1:6.0-12Z−22 (−6)80 (22)110 (30)0.9−13 (−3)80 (20)110 (30)0.9
D2:6.0-00Z−20 (−5)90 (23)120 (30)0.9−1.5 (−0.4)70 (18)100 (30)0.9
D2:6.0-12Z−12 (−3)80 (22)110 (30)0.9−3 (−0.8)70 (18)100 (25)0.9
D3:6.0-00Z−24 (−6)90 (24)120 (30)0.9−8 (−2.0)80 (20)120 (30)0.9
D3:6.0-12Z−21 (−6)90 (24)120 (30)0.92 (0.6)70 (18)100 (30)0.9
Cloudy sky
DSSF−19 (−9)50 (30)70 (40)0.9−23 (−11)60 (30)80 (40)0.9
D1:4.4-00Z−30 (−14)150 (70)190 (90)0.7−24 (−12)140 (70)190 (90)0.7
D1:4.4-12Z−50 (−30)140 (70)190 (90)0.7−40 (−21)140 (70)180 (90)0.7
D2:4.4-00Z−0.4 (−0.2)150 (70)190 (90)0.7−15 (−7)150 (70)190 (90)0.7
D2:4.4-12Z−22 (−11)140 (70)190 (90)0.7−16(−8)140 (70)180 (90)0.7
D3:4.4-00Z5 (2.4)150 (70)190 (100)0.710 (5)150 (80)200 (100)0.7
D3:4.4-12Z22 (11)140 (70)180 (90)0.723 (12)150 (80)200 (100)0.7
D1:6.0-00Z−23 (−12)140 (70)180 (90)0.7−30 (−13)140 (70)180 (90)0.7
D1:6.0-12Z−40 (−21)140 (70)180 (90)0.7−40 (−21)140 (70)180 (90)0.7
D2:6.0-00Z9 (4)140 (70)180 (90)0.712 (6)150 (70)200 (100)0.7
D2:6.0-12Z−20 (−10)140 (70)190 (90)0.7−10 (−5)140 (70)180 (90)0.7
D3:6.0-00Z10 (5)150 (70)190 (90)0.718 (9)150 (70)190 (100)0.7
D3:6.0-12Z30 (15)140 (70)180 (90)0.724 (12)150 (70)190 (100)0.7
In general, and as it was previously observed considering the daily evaluation, there is a change in the MBE trend with the forecast horizon during the winter season, varying from negative values within the first day of simulation to increasing positive values as the simulation progresses (Table 6). Concerning the MAE and RMSE, it is interesting to note that similar results are found for the winter and summer seasons under clear skies and over flat terrain, although both statistical scores slightly increase during the summer. However, the highest differences, comparing summer and winter results, appear taking into account cloudy skies conditions. In this case, differences in terms of RMSE are higher that 100 W·m−2, larger during the summer time, with values up to 300 W·m−2 concerning the RMSE score within this season of the year, while this accuracy estimation does not exceed 200 W·m−2 during the winter in any case.

4.3. Solar Radiation Dynamics

Figure 6 shows the hourly evolution of the Rs MBE from dawn to dusk obtained for the summer season and considering the RAMS-forecasts horizon (three days). Once again, data has been segmented based on terrain classes (flat or hilly), taking into account the corresponding sky condition (clear or cloudy). In all this cases, the DSSF product presents an overestimation of the observations practically for the whole day. However, this positive MBE under cloudy sky conditions is clearer in the central part of the day, while covers nearly the whole day under clear skies. Concerning the RAMS forecasts, both versions of the model display rather similar results for the same model initialization, specially under clear sky conditions. In this case, there is a shift in theMBE trend, underestimating the observations within the first half of the day (from sunrise to noon) and overestimating the measurements within the second half of the day (from noon to dusk), both for flat and hilly sites, with larger MBE values within the period covering midday to dusk, particularly at the end of the day.
Figure 6. MBE (W·m−2) hourly solar radiation cycle from dawn to dusk, considering the complete forecast horizon (three days of simulation), during the summer 2011, segmented based on terrain classes (flat and hilly) and atmospheric condition (clear and cloudy sky): flat-clear (a); flat-cloudy (b); hilly-clear (c) and hilly-cloudy (d).
Remotesensing 08 00046 g006
Moreover, considering the presence of cloudiness, RAMS shows an overestimation of the measurements for the whole day, which is rather low from sunrise until noon, with some negative values around sunrise. Under these sky conditions and during the second half of the day, MBE shows rather high values, above 150 W·m−2, larger than those computed under clear sky conditions, in particular over hilly terrain. On the other hand, although similar results are obtained under clear sky conditions and in all sort of stations comparing both daily RAMS simulations (00 and 12 UTC), higher differences arise in the presence of cloudiness, particularly in flat sites. In addition, these divergences between RAMS simulations are more marked in the first half of the day, with values larger than 50 W·m−2. In this regard, values of MBE lower than 50 W·m−2 are obtained using the 12 UTC run within the first day of simulation, and considering the first half of the day. Finally, it is interesting to note that rather similar results are obtained by RAMS for the three days of simulations, specially under clear sky conditions. These results show that there is a shift in the transition between the daytime heating and cooling. While within the first case (corresponding to the first half of the day), RAMS underestimates the measured Rs, in the second case, corresponding to the daytime cooling, RAMS overestimates the measured Rs. As a result, a lower and delayed daily heating is observed, producing lower near-surface temperatures than those observed. In addition, the nocturnal cooling pattern is smoother as well, producing in this case higher near-surface temperatures compared to the other observations [33]. Figure 6 shows that the relation obtained in the mentioned study for the daily temperature and the solar radiation cycles is evident under clear conditions. However, in the presence of cloudiness, RAMS tends to overestimate the measured Rs practically for the whole day. In any case, it is worth noting to remark that the MBE at around noon is considerably reduced in almost all cases.
The hourly evolution of the Rs MBE from dawn to dusk obtained for the winter season is shown in Figure 7. In this case, low and negative MBE values are found, in general below −50 W·m−2, near 0 in the central part of the day, for the DSSF algorithm. In contrast, RAMS forecasts show an underestimation of the observations for the greater part of the day, specially under cloudy conditions, considering the first day of simulation.
Figure 7. Same as Figure 6, but during the winter 2010–2011: flat-clear (a); flat-cloudy (b); hilly-clear (c) and hilly-cloudy (d).
Remotesensing 08 00046 g007
Although this result was already true within the summer season under clear sky conditions, it was just the opposite under cloudy skies. However, the positive MBE is also observed at the end of the day, from 14 UTC to dusk over both hilly and flat terrain, meaning an overestimation of the in-situ measurements for the last hours of the day. During this season of the year and under cloudy conditions, the underestimation observed for the first day of simulation changes to an overestimation when increasing the RAMS forecast horizon (Figure 7b,d). Thus, in the winter season, more differences are found in the presence of cloudiness as the corresponding simulation progresses. In contrast, considering clear sky conditions (Figure 7a,c), rather similar results are obtained for the three days of simulation and for both sort of stations.
Comparing the summer RMSE (Figure 8) with the winter one (Figure 9), it is shown that in all cases, this statistical score is larger during the summer, with differences higher than 50 W·m−2 in contrast to the winter considering the DSSF algorithm over hilly sites and over all terrain classes under cloudy skies. Comparing DSSF with the RAMS forecasts, the second produces larger RMSE than the first one, notably higher in the presence of cloudiness and both for summer (Figure 8b,d) and winter (Figure 9b,d). In all evaluated cases, similar RAMS results are obtained in terms of RMSE as the simulation progresses as well as considering both daily RAMS initializations (00 and 12 UTC).
Finally, the evolution of the IoA is presented in Figure 10 for the summer season and in Figure 11 for the winter. High values of this statistical score (around 0.9) are found within these two seasons of the year considering the DSSF product, slightly larger during the winter, specially considering clear skies (Figure 11a,c). Besides, even though RAMS shows more difficulties than DSSF in reproducing the daily and the day-to-day evolution of the solar radiation, IoA values higher than 0.6 are still obtained and, as in the case of the DSSF algorithm, slightly larger values are reproduced by RAMS during the winter time compared to those found within the summer season. It is interesting to note that under clear skies, previously shown as the data that produces in general the best agreement with the observations, the IoA decreases drastically around noon during the summer (Figure 10a,c). This outcome is not observed within the winter season. This reduction in the IoA accuracy estimation using the RAMS model could be related to the significant overestimation of Rs simulated by this model during the summer. In contrast, these differences between the simulated and observed Rs are substantially reduced during the winter, with a trend to underestimate the measured Rs in some weather stations (not shown). Furthermore, this trend to lessen the IoA at noon under the mentioned sky and geographical conditions is reproduced by the DSSF algorithm as well (Figure 10a,c). In this sense, although DSSF yields higher IoA values than RAMS, the general IoA pattern is the same as in the one simulated by RAMS in all cases.
Figure 8. Same as Figure 6, but for the RMSE (W·m−2) statistical score: flat-clear (a); flat-cloudy (b); hilly-clear (c) and hilly-cloudy (d).
Remotesensing 08 00046 g008
Figure 9. Same as Figure 7, but for the RMSE (W·m−2) statistical score: flat-clear (a); flat-cloudy (b); hilly-clear (c) and hilly-cloudy (d).
Remotesensing 08 00046 g009
Figure 10. Same as Figure 6, but for the IoA statistical score: flat-clear (a); flat-cloudy (b); hilly-clear (c) and hilly-cloudy (d).
Remotesensing 08 00046 g010
Figure 11. Same as Figure 7, but for the IoA statistical score: flat-clear (a); flat-cloudy (b); hilly-clear (c) and hilly-cloudy (d).
Remotesensing 08 00046 g011

5. Discussions and Outlook

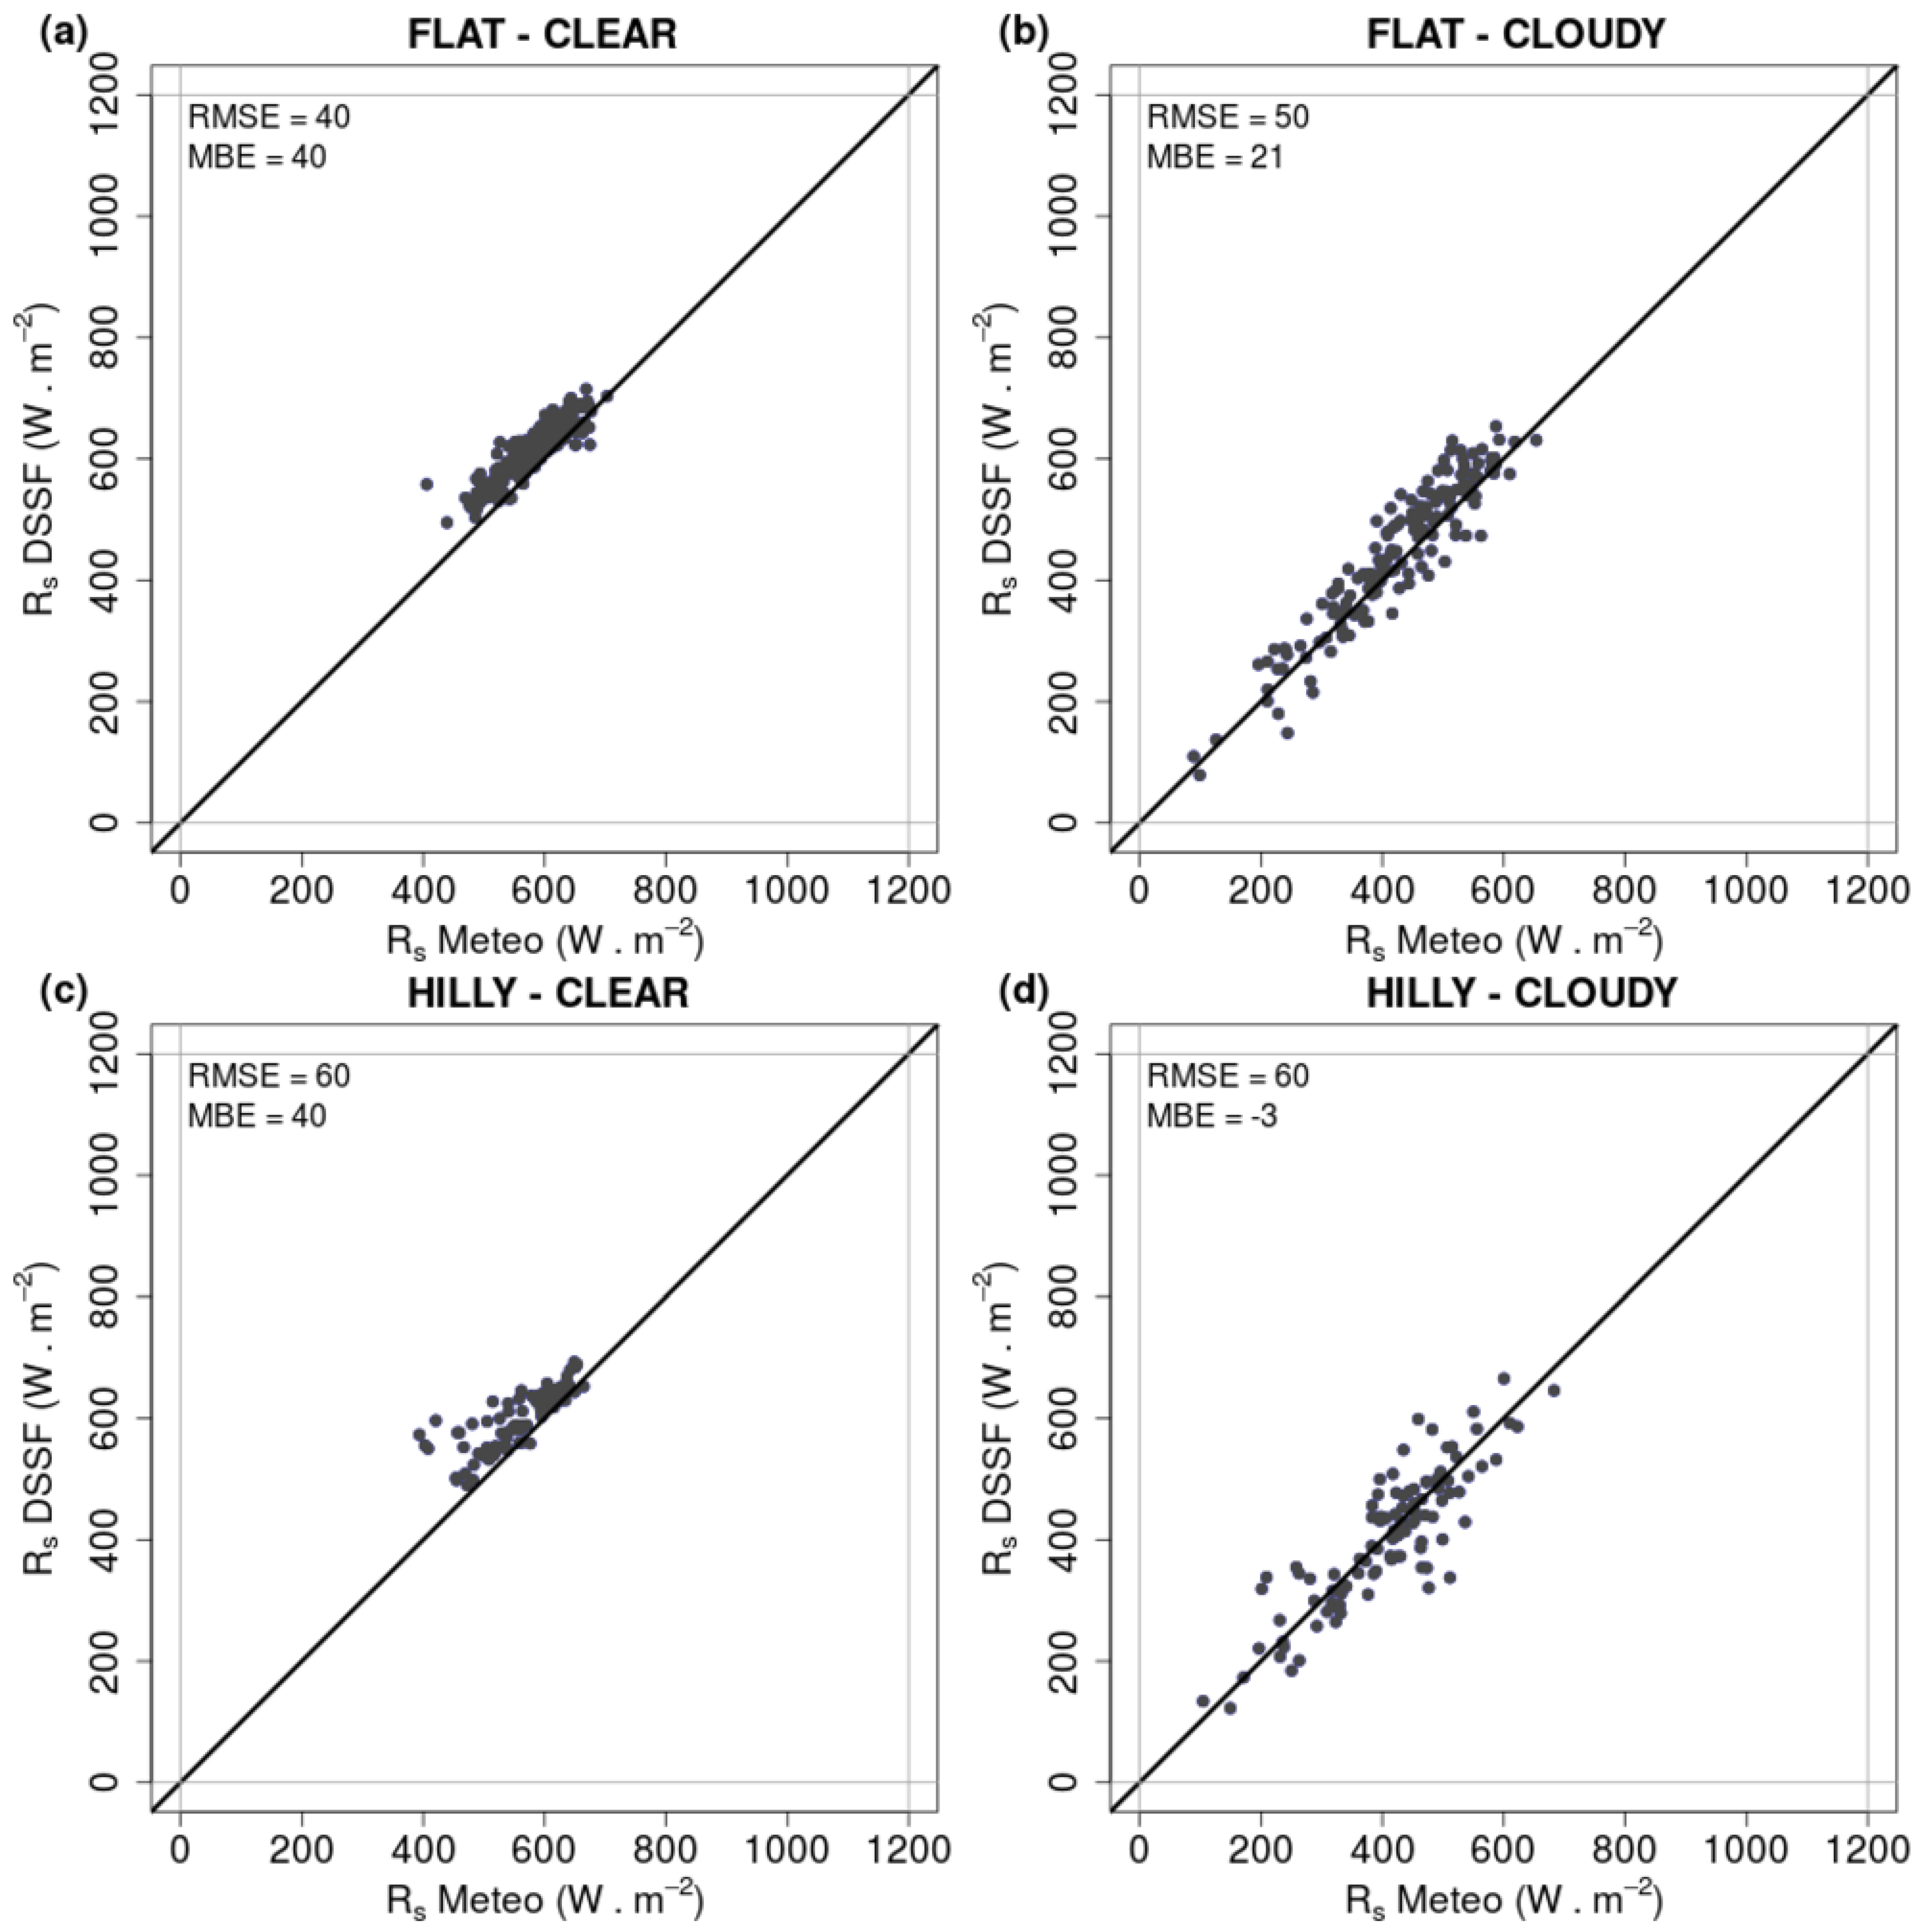
Results presented in the current study at the daily time step for the DSSF product are consistent with those found in the literature. In this regard, and considering a daily evaluation, [3] found an averaged RMSE and MAE for the 2008–2010 period of 30 W·m−2 and 20 W·m−2, respectively at flat sites and under clear sky conditions. Cloudy conditions over these locations yielded an averaged RMSE and MAE considering the whole 2008–2010 period of 40 W·m−2 and 30 W·m−2, respectively. On the other hand, clear sky conditions yielded an averaged RMSE and MAE of 40 W·m−2 and 30 W·m−2, respectively, for hilly sites, while these values rises up to 50 W·m−2 and 40 W·m−2, respectively, under cloudy conditions. [17] found an RMSE of 40 W·m−2 and 110 W·m−2 under clear and cloudy skies, respectively, using data from six European ground measurement stations from 2004 to 2006. In addition, [50] used 13 weather stations from 2008 to 2009 in Belgium, yielding an RMSE of 40 W·m−2 and 90 W·m−2 considering stations over flat terrain, clear and cloudy conditions, respectively. Separating the winter from the summer season, similar results are found in the current study. For example, in the case of the winter time, the current study yields an average RMSE and MAE of 25 W·m−2 and 20 W·m−2, respectively, at flat sites and under clear sky conditions, 40 W·m−2 and 30 W·m−2, respectively, at flat sites and under cloudy sky conditions, 40 W·m−2 and 30 W·m−2, respectively, at hilly sites and under clear sky conditions, 40 W·m−2 and 30 W·m−2, respectively, at hilly sites and under cloudy sky conditions (Table 3). Results during the summer produce slightly larger errors than those found within the winter season.
Considering an hourly evaluation for the whole 2008–2010 period, [3] found an average RMSE and MAE of 40 W·m−2 and 30 W·m−2, respectively, over flat terrain under clear sky conditions, while cloudy conditions over these locations yielded an averaged RMSE and MAE considering of 90 W·m−2 and 60 W·m−2, respectively. On the contrary, clear sky conditions yielded an averaged RMSE and MAE of 60 W·m−2 and 40 W·m−2, respectively, for hilly sites, while these values rises up to 110 W·m−2 and 70 W·m−2, respectively, under cloudy conditions. Separating the winter from the summer season, similar results are found in the current study. For example, taking into account the winter season, the current study yields an average RMSE and MAE of 40 W·m−2 and 30 W·m−2, respectively, at flat sites and under clear sky conditions, 70 W·m−2 and 50 W·m−2, respectively, at flat sites and under cloudy sky conditions, 50 W·m−2 and 40 W·m−2, respectively, at hilly sites and under clear sky conditions, 80 W·m−2 and 60 W·m−2, respectively, at hilly sites and under cloudy sky conditions (Table 6). Once again, results during the summer produce larger errors than those found within the winter season.
Although previous studies dealt in general with the whole dataset [17] or considering the whole year [3], a monthly evaluation was performed as well. Considering a monthly aggregation of the DSSF data, [17] found no clear seasonal bias dependence in the results considering cloudy sky data. In contrast, for the clear sky case a seasonal trend of the monthly biases was obtained, even though the MBE is in general very small and exhibits slightly positive values of less than 10 W·m−2. In this regard, for the clear sky estimates a seasonal trend of the monthly values was perceived (slight underestimation in winter and overestimation in summer). Although no monthly aggregation has been performed in the current study for the DSSF data, the evaluation carried out permits to highlight the seasonal trend obtained within the Valencia Region. In this sense, a similar tendency as the one found in those previous studies is perceived as well. Thus, the MBE is positive during the summer, meaning an overestimation of the observed Rs, while this score is negative during the winter season, indicating an underestimation of the observed Rs.
On the other hand, the slightly lowest absolute errors obtained by [3], when compared to those obtained in the current work, could be related to a compensation of errors in considering the whole year. In this sense, as it was pointed out by [17], when considering the statistics for individual months, more important biases with a positive or negative sign occur which tend to cancel out over the whole period. According this work, a possible explanation for the behaviour of the clear sky bias could potentially be related to an insufficient parameterization of the effects of aerosols, which are currently parameterized with a fixed visibility value of 20 km and therefore their variations are not taken into account.
Previous studies have shown that Rs from reanalysis data produces significantly less accuracy than satellite-based models [10,19,20,21]. However, few studies have been focused on the comparison of operational NWP models with satellite-derived data [13,15,23,24,25,26]. These previous works have shown that, as in the case of reanalysis data, forecast models overestimate Rs in general compared to the ground-based measurements. For example, using the WRF model in Andalusia (southern Spain) in a seasonal evaluation [13], a positive MBE is obtained for all seasons of the year, with values around 40 W·m−2 under clear sky conditions and higher than 100 W·m−2 in the presence of cloudiness. Additionally, the RMSE shows values of about 100 W·m−2 under clear sky conditions and higher than 150 W·m−2 considering cloudy cloudiness, reaching values up to 300 W·m−2. Comparing the relative errors, [13] found a large difference between cloudy and overcast conditions. Although this work divided cloudiness in two categories, cloudy and overcast, we only consider here a category to define this parameter, based on the DSSF product. The results obtained in the current study under cloudy conditions show values in between those found by [13], based on cloudy and overcast conditions. Thus, considering the total cloudiness could also be the reason for the higher dispersion observed in Figure 4 and Figure 5 when using the RAMS model under cloudy conditions. Besides, RMSE rises over hilly terrain within both the summer and the winter seasons. In general, a higher accuracy in terms of the RMSE statistical score is obtained in the summer over flat terrain compared to that obtained for the winter season. In contrast, similar results are found in this accuracy estimation over hilly terrain contrasting these two seasons of the year. These RMSE results are rather similar to those obtained in the current study in terms of magnitude. However, comparing the RMSE for the winter and the summer seasons, WRF produces similar results in both seasons, with even lower values during the summer when considering all sky conditions, in contrast to the RMSE results produced by RAMS in the current work. In addition, although the MBE trend obtained in the current study is the same as the one obtained by [13], thus producing an overestimation of the observations, a significant divergence appears in term of the MBE score during the winter season. In this sense, RAMS produces an underestimation of the observations, in accordance with the MBE obtained using the DSSF product. In contrast, [13] found a positive MBE using WRF for the four seasons of the year. Additionally, [25,26] have also obtained a different trend in the MBE statistical score when comparing the summer with the winter seasons, using the Japan Meteorological Agency mesoscale model (MSM). However, although the current study shows an underestimation of the observations using the RAMS model during the winter season, the MSM produces an overestimation of the observations during this season of the year over Japan. In contrast, the opposite trend has been found within the summer season. In any case, and as it has also been found in the current study, MSM presents larger RMSE errors during the summer season, with values around 100 W·m−2, when compared to those obtained during the winter, higher than 150 W·m−2. This outcome contrasts with the RMSE values found by [13] comparing the winter and the summer seasons using the WRF model over southern Spain and considering all sky conditions, as it has been pointed out previously.
Finally, [23] have also found an overestimation of about 30 W·m−2 for both RAMS and WRF forecasted Rs with respect to the ground based sensor during the summer 2013 in Southern Italy, with a global RMSE of 100 W·m−2. In the same terms, [24] have evaluated the RAMS and WRF forecasted Rs as well as the DSSF product during the period June 2013–December 2013 in Southern Italy. Once again, they have also found not only this positive bias using both NWP forecasted Rs with respect to the ground-based sensor, but also with respect to the DSSF product. Additionally, they have found an RMSE monthly-averaged of 80 W·m−2 for the DSSF product and of 100 W·m−2 for these weather forecast models.
The overestimation obtained by RAMS in the current study, specially during the summer season, may be related to the solar short-wave parameterization used in the current work [45], indicating the limited ability of the RAMS model to forecast cloudy conditions in contrast to the prediction of clear skies during the summer. In this regard, RAMS appears to forecast more clear sky conditions than actually occurred. However, the opposite has also been found during the winter season (Figure 5), and in this case, even under clear sky conditions, some cloudiness is still forecasted by this model. It is worth noting that the [45] scheme does account for condensate in the atmosphere, but not whether it is cloud water, rain, or ice, which is a major limitation [51]. Besides the solar short-wave parameterization, the initial soil moisture content has been revealed as an important parameter to faithfully reproduce the observed patterns using the RAMS model [52], specifically considering the solar radiation. In this regard, moistening the soil produces a better capture of the observed cloudiness under mesoscale circulations. These sort of atmospheric conditions are the most predominant meteorological situations over the area of study during the summer [35,36]. Thus, the false alarms produced by RAMS and related to cloudiness (Figure 4) within this period of the year could be related to the underestimation of this parameter based on an underestimation of the atmospheric humidity [52], that forecasts more clear skies than those really observed. Thus, the initial soil moisture content should also be kept in mind as a likely option to include a better representation of the summer cloudiness in order to improve the RAMS-forecasted Rs under cloudy sky conditions. In contrast, the most dominant situation during the winter is that associated with northerly western circulations [35]. In this case, it seems that RAMS advects more synoptic humidity towards the region of study, thus producing more cloudy skies than those actually observed, specially over flat terrain (Figure 5a).

6. Conclusions

The current study presents the validation and the inter-comparison of the global solar radiation estimates provided by the satellite-based model DSSF product, and the RAMS mesoscale model over the Valencia Region, located in the Western Mediterranean coast. To perform the corresponding evaluation we have taken advantage of the RAMS results generated by the operational weather forecasting system implemented within this area of study during the winter 2010–2011 and the summer 2011. In this regard, hourly and daily solar radiation estimates have been compared to ground-based data for both seasons of the year separately and considering the seasonal data segmented based on two terrain classes (flat and hilly) and two atmospheric conditions (clear and cloudy skies). Additionally, the two most recent versions of the RAMS model have been implemented within this operational system, thus being used in the current evaluation of the solar radiation forecasts.
Evaluation has shown differences between summer and winter. In this regard, even though both DSSF and RAMS overestimate the observations during the summer, the opposite is obtained during the winter season. Considering the RAMS output, it has been shown that the forecasts accuracy tends to decrease as the simulation progresses for the two daily RAMS initializations, and the best performance has been obtained for the 12 UTC run.
Taking into account the corresponding atmospheric conditions, DSSF and RAMS produce a better accuracy under clear conditions than when considering cloudy skies for both the summer and winter seasons, specially considering the RAMS forecasts. Additionally, in some cases, particularly under cloudy skies, the RAMS forecasts provided for the second and the third day of simulation show similar errors those obtained for the first day of simulation, even better in some cases. This results has also been found in other regions of Spain using the WRF model [13].
The results found in the current work indicate that RAMS is a valuable tool to participate in those socio-economic sectors in which the estimation of solar radiation is a key factor. However, cloud forecasts are still a challenging issue for the RAMS model. In this regard, improvements should be obtained before reliable Rs forecasts are obtained under cloudy atmospheric conditions. As it was previously pointed out, the RAMS divergences with the observations found in the current study may be related to the solar short-wave parameterization used in the current work [45]. Additionally, the initial soil moisture content has been revealed as an important parameter to faithfully reproduce the observed patterns using the RAMS model [52].
Finally, it should be highlighted that even though the results obtained in the current study have been obtained for a particular region, they can be regarded as representatives for regions with a similar climate, as none statistical post-processing has been performed upon the forecasts provided by the model.

Acknowledgments

This work has been funded by the Regional Government of Valencia through the project PROMETEOII/2014/086, and by the Spanish Ministerio de Economía y Competitividad through the project CGL2013-46862-C02-1-P. NCEP are acknowledged for providing the GFS meteorological forecasts for RAMS initialization. We acknowledge as well the provision of the satellite data by EUMETSAT through the Satellite Application Facility on Land Surface Analysis Satellite Application Facility (LSA SAF). We would also like to thank the Mediterranean Center for Environmental Studies for providing the surface observations.

Author Contributions

Igor Gómez as the main author proposed the study, and developed and implemented the approach. Vicente Caselles supported the data analysis and the preparation of tables and cross-checked the manuscript. María José Estrela helped in the data analysis and the preparation of figures and cross-checked the manuscript.

Conflicts of Interest

The authors declare no conflict of interest.

References

  1. Ceamanos, X.; Carrer, D.; Roujean, J.-L. Improved retrieval of direct and diffuse downwelling surface shortwave flux in cloudless atmosphere using dynamic estimates of aerosol content and type: Application to the LSA-SAF project. Atmos. Chem. Phys. 2014, 14, 8209–8232. [Google Scholar] [CrossRef]
  2. Sánchez, J.M.; López-Urrea, R.; Rubio, E.; González-Piqueras, J.; Caselles, V. Assessing crop coefficients of sunflower and canola using two-source energy balance and thermal radiometry. Agric. Water Manag. 2014, 137, 23–29. [Google Scholar] [CrossRef]
  3. Cristóbal, J.; Anderson, M.C. Validation of a Meteosat Second Generation solar radiation dataset over the northeastern Iberian Peninsula. Hydrol. Earth Syst. Sci. 2013, 17, 163–175. [Google Scholar] [CrossRef]
  4. Prasad, A.A.; Taylor, R.A.; Kay, M. Assessment of direct normal irradiance and cloud connections using satellite data over Australia. Appl. Energy 2015, 143, 301–311. [Google Scholar] [CrossRef]
  5. Sánchez, J.M.; López-Urrea, R.; Rubio, E.; Caselles, V. Determining water use of sorghum from two-source energy balance and radiometric temperatures. Hydrol. Earth Syst. Sci. 2011, 15, 3061–3070. [Google Scholar] [CrossRef]
  6. Shamim, M.A.; Bray, M.; Remesan, R.; Han, D. A hybrid modelling approach for assessing solar radiation. Theor. Appl. Climatol. 2015, 122, 403–420. [Google Scholar] [CrossRef]
  7. Troccoli, A.; Morcrette, J.J. Skill of Direct Solar Radiation Predicted by the ECMWF Global Atmospheric Model over Australia. J. Appl. Meteorol. Climatol. 2014, 53, 2571–2588. [Google Scholar] [CrossRef]
  8. Roerink, G.J.; Bojanowsky, J.S.; de Wit, A.J.W.; Eerens, H.; Supit, I.; Leo, O.; Boogaard, H.L. Evaluation of MSG-derived global radiation estimates for application in a regional crop model. Agric. For. Meteorol. 2012, 160, 36–47. [Google Scholar] [CrossRef]
  9. Bojanowsky, J.S.; Vrieling, A.; Skidmore, A.K. A comparison of data sources for creating a long-term time series of daily gridded solar radiation for Europe. Sol. Energy 2014, 99, 152–171. [Google Scholar] [CrossRef]
  10. Bilbao, J.; de Miguel, A. Test reference year generation from meteorological and simulated solar radiation data. Sol. Energy 2005, 78, 695–703. [Google Scholar]
  11. Bilbao, J.; de Miguel, A.; Franco, J.A.; Ayuso, A. Test Reference Year Generation and Evaluation Methods in the Continental Mediterranean Area. J. Appl. Meteorol. 2004, 43, 390–400. [Google Scholar] [CrossRef]
  12. Lara-Fanego, V.; Ruiz-Arias, J.A.; Pozo-Vázquez, D.; Santos-Alamillos, F.J.; Tovar-Pecador, J. Evaluation of the WRF model solar irradiance forecasts in Andalusia (southern Spain). Sol. Energy 2012, 86, 2200–2217. [Google Scholar] [CrossRef]
  13. Moreno, A.; Gilabert, M.A.; Camacho, F.; Martínez, B. Validation of daily global solar irradiation images from MSG over Spain. Renew. Energy 2013, 60, 332–342. [Google Scholar] [CrossRef]
  14. Pérez, R.; Lorenz, E.; Pelland, S.; Beauharnois, M.; van Knowe, G.; Hemker, K., Jr.; Heinemann, D.; Remund, J.; Müller, S.C.; Traunmüller, W.; et al. Comparison of numerical weather prediction solar irradiance forecasts in the US, Canada and Europe. Sol. Energy 2013, 94, 305–326. [Google Scholar] [CrossRef]
  15. Sánchez-Lorezo, A.; Wild, M.; Trentmann, J. Validation and stability assessment of the monthly mean CM SAF surface solar radiation dataset over Europe against a homogenized surface dataset (1983–2005). Remote Sens. Environ. 2013, 134, 355–366. [Google Scholar] [CrossRef]
  16. Brisson, A.; le Borgne, P.; Marsouin, A. Development of Algorithms for Surface Solar Irradiance Retrieval at O & SI SAF Low and Mid Latitude; Météo-France/CMS: Lannion, France, 1999. [Google Scholar]
  17. Geiger, B.; Meurey, C.; Lajas, D.; Franchisteguy, L.; Carrer, D.; Roujean, J.-L. Near real-time provision of downwelling shortwave radiation estimates derived from satellite observations. Meteorol. Appl. 2008, 15, 411–420. [Google Scholar] [CrossRef]
  18. Ruiz-Arias, J.A.; Quesada-Ruiz, S.; Fernández, E.F.; Gueymar, C.A. Optimal combination of gridded and ground-observed solar radiation data for regional solar resource assessment. Sol. Energy 2015, 112, 411–424. [Google Scholar] [CrossRef]
  19. Lohmann, S.; Schillings, C.; Mayer, B.; Meyer, R. Long-term variability of solar direct and global radiation derived from ISCCP data and comparison with reanalysis data. Sol. Energy 2006, 80, 1390–1401. [Google Scholar] [CrossRef]
  20. Kennedy, A.; Dong, X.; Xi, B.; Xie, S.; Zhang, Y.; Chen, Y. A Comparison of MERRA and NARR Reanalyses with the DOE ARM SGP Data. J. Clim. 2011, 24, 4541–4557. [Google Scholar] [CrossRef]
  21. Jia, B.; Xie, Z.; Dai, A.; Shi, C.; Chen, F. Evaluation of satellite and reanalysis products of downward surface solar radiation over East Asia: Spatial and seasonal variations. J. Geophys. Res.-Atmos. 2013, 118, 3431–3446. [Google Scholar] [CrossRef]
  22. Skamarock, W.C.; Klemp, J.B.; Dudhia, J.; Gill, D.O.; Barker, D.M.; Duda, M.G.; Huang, X.-Y.; Wang, W.; Powers, J.G. A Description of the Advanced Research WRF Version 3; NCAR Technical Note NCAR/TN-475+STR; NCAR: Boulder, CO, USA, 2003. [Google Scholar]
  23. Avolio, E.; lo Feudo, T.; Calidonna, C.R.; Contini, D.; Torcasio, R.C.; Tiriolo, L.; Montesanti, S.; Transerici, C.; Federico, S. An application of a multi model approach for solar energy prediction in Southern Italy. In Proceedings of the European Geosciences Union (EGU) General Assembly 2015, Vienna, Austria, 12–17 April 2015.
  24. Lo Feudo, T.; Avolio, E.; Gullì, D.; Federico, S.; Sempreviva, A.; Calidonna, C.R. Comparison of hourly solar radiation from ground-based station, remote sensing sensors and weather forecast models: A preliminary study, in a coastal site of South Italy (Lamezia Terme). In Proceedings of the European Geosciences Union (EGU) General Assembly 2015, Vienna, Austria, 12–17 April 2015.
  25. Ohtake, H.; Shimose, K.; Silva-Fonseca, J.G., Jr.; Takashima, T.; Oozeki, T.; Yamada, Y. Accuracy of the solar irradiance forecasts of the Japan Meteorological Agency mesoscale model for the Kanto region, Japan. Sol. Energy 2013, 98, 138–152. [Google Scholar] [CrossRef]
  26. Ohtake, H.; Silva-Fonseca, J.G., Jr.; Takashima, T.; Oozeki, T.; Shimose, K.; Yamada, Y. Regional and seasonal characteristics of global horizontal irradiance forecasts obtained from the Japan Meteorological Agency mesoscale model. Sol. Energy 2015, 116, 83–99. [Google Scholar] [CrossRef]
  27. Cotton, W.R.; Pielke, R.A.S.; Walko, R.L.; Liston, G.E.; Tremback, C.J.; Jiang, H.; McAnelly, R.L.; Harrington, J.Y.; Nicholls, M.E.; Carrio, G.G.; et al. RAMS 2001: Current status and future directions. Meteorol. Atmos. Phys. 2003, 82, 5–29. [Google Scholar]
  28. Pielke, R.A. Mesoscale Meteorological Modeling, 3rd ed.; Academic Press: San Diego, CA, USA, 2013; p. 760. [Google Scholar]
  29. Gómez, I.; Estrela, M.J. Design and development of a java-based graphical user interface to monitor/control a meteorological real-time forecasting system. Comput. Geosci. 2010, 36, 1345–1354. [Google Scholar] [CrossRef]
  30. Gómez, I.; Estrela, M.J.; Caselles, V. Operational forecasting of daily summer maximum and minimum temperatures in the Valencia Region. Nat. Hazards 2014, 70, 1055–1076. [Google Scholar] [CrossRef]
  31. Gómez, I.; Caselles, V.; Estrela, M. Real-time weather forecasting in the Western Mediterranean Basin: An application of the RAMS model. Atmos. Res. 2014, 139, 71–89. [Google Scholar] [CrossRef]
  32. Gómez, I.; Caselles, V.; Estrela, M.J.; Niclòs, R. RAMS-forecasts comparison of typical summer atmospheric conditions over the Western Mediterranean coast. Atmos. Res. 2014, 145–146, 130–151. [Google Scholar] [CrossRef]
  33. Gómez, I.; Caselles, V.; Estrela, M.J. Verification of the RAMS-based operational weather forecast system in the Valencia Region: A seasonal comparison. Nat. Hazards 2015, 75, 1941–1958. [Google Scholar] [CrossRef]
  34. Pérez-Landa, G.; Ciais, P.; Sanz, M.J.; Gioli, B.; Miglietta, F.; Palau, J.L.; Gangoiti, G.; Millán, M. Mesoscale circulations over complex terrain in the Valencia coastal region, Spain. Part 1: Simulation of diurnal circulation regimes. Atmos. Chem. Phys. 2007, 7, 1835–1849. [Google Scholar]
  35. Miró, J.; Estrela, M.J.; Pastor, F.; Millán, M. Análisis comparativo de tendencias en la precipitación, por distintos inputs, entre los dominios hidrológicos del Segura y del Júcar (1958–2008). Investig. Geogr. 2009, 49, 129–157. (In Spanish) [Google Scholar] [CrossRef]
  36. Azorin-Molina, C.; Chen, D.; Tijm, S.; Baldi, M. A multi-year study of sea breezes in a Mediterranean coastal site: Alicante (Spain). Int. J. Climatol. 2011, 31, 468–486. [Google Scholar] [CrossRef]
  37. Trigo, I.F.; Dacamara, C.C.; Viterbo, P.; Roujean, J.-L.; Olesen, F.; Barroso, C.; Camacho-de Coca, F.; Carrer, D.; Freitas, S.C.; García-Haro, J.; et al. The Satellite Application Facility for Land Surface Analysis. Int. J. Remote Sens. 2011, 32, 2725–2744. [Google Scholar] [CrossRef]
  38. Land Surface Analysis Satellite Applications Facility. The EUMETSAT Satellite Application Facility on Land Surface Analysis (LSA SAF), Product User Manual, Down-welling Shortwave Flux (DSSF). 2015. Available online: https://landsaf.meteo.pt/algorithms.jsp?seltab=1\&starttab=1 (accessed on 5 March 2015).
  39. Frouin, R.; Lingner, D.W.; Gautier, C.; Baker, K.S.; Smith, R.C. A Simple Analytical Formula to Compute Clear Sky Total and Photosynthetically Available Solar Irradiance at the Ocean Surface. J. Geophys. Res.-Oceans 2013, 94, 9731–9742. [Google Scholar] [CrossRef]
  40. Gautier, C.; Diak, G.; Masse, S. A Simple Physical Model to Estimate Incident Solar-Radiation at the Surface from Goes Satellite Data. J. Appl. Meteorol. 1980, 19, 1005–1012. [Google Scholar] [CrossRef]
  41. Clerbaux, N.; Bertrand, C.; Caprion, D.; Depaepe, B.; Dewitte, S.; Gonzalez, L.; Ipe, A. Narrowband-to-Broadband Conversions for SEVIRI. In Proceedings of the 2005 EUMETSAT Meteorological Satellite Conference, Dubrovnik, Croatia, 19–23 September 2005; pp. 351–357.
  42. Manalo-Smith, N.; Smith, G.L.; Tiwari, S.N.; Staylor, W.F. Analytic forms of bi-directional reflectance functions for application to Earth radiation budget studies. J. Geophys. Res. 1998, 103, 19733–19751. [Google Scholar] [CrossRef]
  43. Molinari, J. A general form of kuo's cumulus parameterization. Mon. Weather Rev. 1985, 113, 1411–1416. [Google Scholar] [CrossRef]
  44. Mellor, G.; Yamada, T. Development of a turbulence closure model for geophysical fluid problems. Rev. Geophys. Space Phys. 1982, 20, 851–875. [Google Scholar] [CrossRef]
  45. Chen, C.; Cotton, W.R. A one-dimensional simulation of the stratocumulus-capped mixed layer. Bound.-Layer Meteorol. 1983, 25, 289–321. [Google Scholar] [CrossRef]
  46. Walko, R.L.; Cotton, W.R.; Meyers, M.P.; Harrington, J.Y. New RAMS cloud microphysics parameterization. Part I: The single-moment scheme. Atmos. Res. 1995, 38, 29–62. [Google Scholar] [CrossRef]
  47. Walko, R.L.; Band, L.E.; Baron, J.; Kittel, T.G.F.; Lammers, R.; Lee, T.J.; Ojima, D.; Pielke, R.A.; Taylor, C.; Tague, C.; et al. Coupled atmospheric-biophysics-hydrology models for environmental modeling. J. Appl. Meteorol. 2000, 39, 931–944. [Google Scholar] [CrossRef]
  48. Walko, R.L.; Tremback, C.J. Modifications for the Transition from LEAF-2 to LEAF-3; ATMET Technical Note; ATMET: Boulder, CO, USA, 2005. [Google Scholar]
  49. Tremback, C.J.; Walko, R.L. RAMS (Regional Atmospheric Modeling System)-Version 6.0. User’s Guide-Introduction; Document Edition 1.1; ATMET: Boulder, CO, USA, 2005. [Google Scholar]
  50. Journee, M.; Bertrand, C. Improving the spatio-temporal distribution of surface solar radiation data by merging ground and satellite measurements. Remote Sens. Environ. 2010, 114, 2692–2704. [Google Scholar] [CrossRef]
  51. Walko, R.L.; Tremback, C.J. RAMS (Regional Atmospheric Modeling System) Version 6.0. Model. Input Namelist. Parameters; Document Edition 1.4; ATMET: Boulder, CO, USA, 2006. [Google Scholar]
  52. Gómez, I.; Estrela, M.J.; Caselles, V. Impacts of soil moisture content on simulated mesoscale circulations during the summer over eastern Spain. Atmos. Res. 2015, 164–165, 9–26. [Google Scholar]

