Article

Evaluation and Uncertainty Estimation of the Latest Radar and Satellite Snowfall Products Using SNOTEL Measurements over Mountainous Regions in Western United States

1
Jet Propulsion Laboratory, California Institute of Technology, Pasadena, CA 91109, USA
2
Advanced Radar Research Center, University of Oklahoma, Norman, OK 73019, USA
3
NOAA/National Severe Storms Laboratory, Norman, OK 73019, USA
*
Author to whom correspondence should be addressed.
Remote Sens. 2016, 8(11), 904; https://doi.org/10.3390/rs8110904
Submission received: 9 September 2016 / Revised: 20 October 2016 / Accepted: 24 October 2016 / Published: 1 November 2016
(This article belongs to the Special Issue Uncertainties in Remote Sensing)

Abstract

:
Snow contributes to regional and global water budgets, and is of critical importance to water resources management and our society. Along with advancement in remote sensing tools and techniques to retrieve snowfall, verification and refinement of these estimates need to be performed using ground-validation datasets. A comprehensive evaluation of the Multi-Radar/Multi-Sensor (MRMS) snowfall products and Integrated Multi-satellitE Retrievals for GPM (Global Precipitation Measurement) (IMERG) precipitation products is conducted using the Snow Telemetry (SNOTEL) daily precipitation and Snow Water Equivalent (SWE) datasets. Severe underestimations are found in both radar and satellite products. Comparisons are conducted as functions of air temperature, snowfall intensity, and radar beam height, in hopes of resolving the discrepancies between measurements by remote sensing and gauge, and finally developing better snowfall retrieval algorithms in the future.
Keywords:
QPE; SWE; weather radar; GPM

Graphical Abstract

1. Introduction

Snowfall is a dominant type of precipitation in high latitudes [1], and is important in the analysis of regional and global water and energy budgets [2,3]. Snow can also cause hazardous weather and impact flood and drought through delaying the precipitation–runoff process, and thus is important for water resources management. In a warming climate, changes of snowfall characteristics (e.g., intensity, duration, frequency, and density) may also substantially impact albedo and glacier dynamics.
For large-scale weather monitoring and global climate studies, snowfall observations from remote sensing techniques have become highly desirable. There are two major types of remote-sensing snow measurement techniques: (1) ground-based weather radars; and (2) meteorological satellites.
Ground weather radar has proven its value to the nation since the installation of the Weather Surveillance Radar-1988 Doppler (WSR-88D) Next Generation Weather Radar (NEXRAD) network. Based on data measured by the NEXRAD network, the Multi-Radar/Multi-Sensor (MRMS) is currently a real-time test bed comprising high-resolution (1 km, 2 min) liquid and solid precipitation products [4]. The MRMS system uses model surface analyses to segregate snow from rain at the surface. If the RAPid refresh (RAP) surface dry bulb temperature is less than 2 °C, and surface wet bulb temperature is less than 0 °C, the surface precipitation type is set to snow. The MRMS radar-only snowfall rates are obtained by applying Z = 75 S2.0 to the mosaicked reflectivity field pixel by pixel, where Z represents the radar reflectivity (mm6·m−3) and S denotes the snowfall rate (mm·h−1).
The meteorological satellites are other sources to provide snowfall measurements. With decades of observations from NASA and other space agencies, satellite precipitation retrieval algorithms have been developed. The Tropical Rainfall Measurement Mission (TRMM) Multi-satellite Precipitation Analysis (TMPA) has provided Quantitative Precipitation Estimates (QPE) at 3 h and 0.25° resolution since January 1998, without discriminating precipitation phases. Since 2014, the Integrated Multi-satellitE Retrievals for GPM (Global Precipitation Measurement) (IMERG) product has provided merged global precipitation from a constellation of precipitation-relevant satellites and global surface precipitation gauge analyses [5] at 0.1° resolution every ½ h within 65°N and 65°S. Importantly, it ingests the retrievals from the latest version of the Goddard Profiling Algorithm (GPROF2014) [6], which is designed to improve retrievals of light rain and snowfall compared to the earlier versions, which often missed majority of these precipitation types [1,7]. IMERG has a new data field—probability of liquid precipitation—which helps identify precipitation types.
Both radar and satellite snow estimates need verification and refinement from ground-validation datasets. To date, much effort has gone into evaluating precipitation retrievals by comparing with ground observations (e.g., [8,9,10,11,12]), while few studies have investigated the errors in snowfall retrievals. Kirstetter et al. (2015) [13] performed a quantitative evaluation of the MRMS Reflectivity-Snow Water Equivalent (SWE) relationship, and noted significant underestimation relative to the precipitation gauges in Hydrometeorological Automated Data System (HADS). However, measurement errors for snow of HADS gauges frequently range from 20% to 50%, due to undercatch in windy conditions [14]. Having reliable and consistent surface-based reference snow measurements is important in product comparison and validation. In the western United States, a network called Snowpack Telemetry (SNOTEL) was designed to provide snow measurements from high snow accumulation regions (Figure 1). The basic SNOTEL station provides Snow Water Equivalent (SWE) data via a pressure-sensing snow pillow. The daily snowfall accumulation (SA) can be derived from the daily increment of the SWE values, based on the difference in cumulative values between day N and N−1. The SNOTEL station also collects data on snow depth, all-season precipitation accumulation, and air temperature with daily maximums, minimums, and averages [15]. SNOTEL SWE records, along with other station measurements have been used in many studies. For example, SNOTEL daily minimum temperature observations are directly ingested by PRISM [16] and Daymet [17], two widely used gridded climate products. SNTOEL SWE records have been used to examine seasonal aspects of western United States precipitation [18]. Forecast centers (e.g., Colorado Basin River Forecast Center) use SNOTEL daily SA measurements to provide water supply forecasts and other services to the public. In this study, SNOTEL daily SA measurements are used as in situ daily snowfall intensity reference to evaluate radar snowfall products.
The objective of this study is to use the best ground observations (SNOTEL snow pillows) to evaluate daily snowfall accumulation from MRMS and IMERG. In Section 2, we discuss the datasets used in this study. Section 3 introduces the method for matching the dataset. Section 4 presents comprehensive evaluation results of all datasets. A summary follows in the last section.

2. Datasets

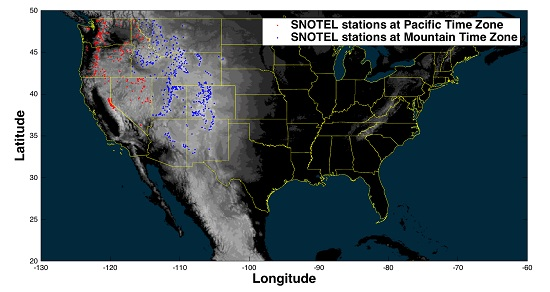
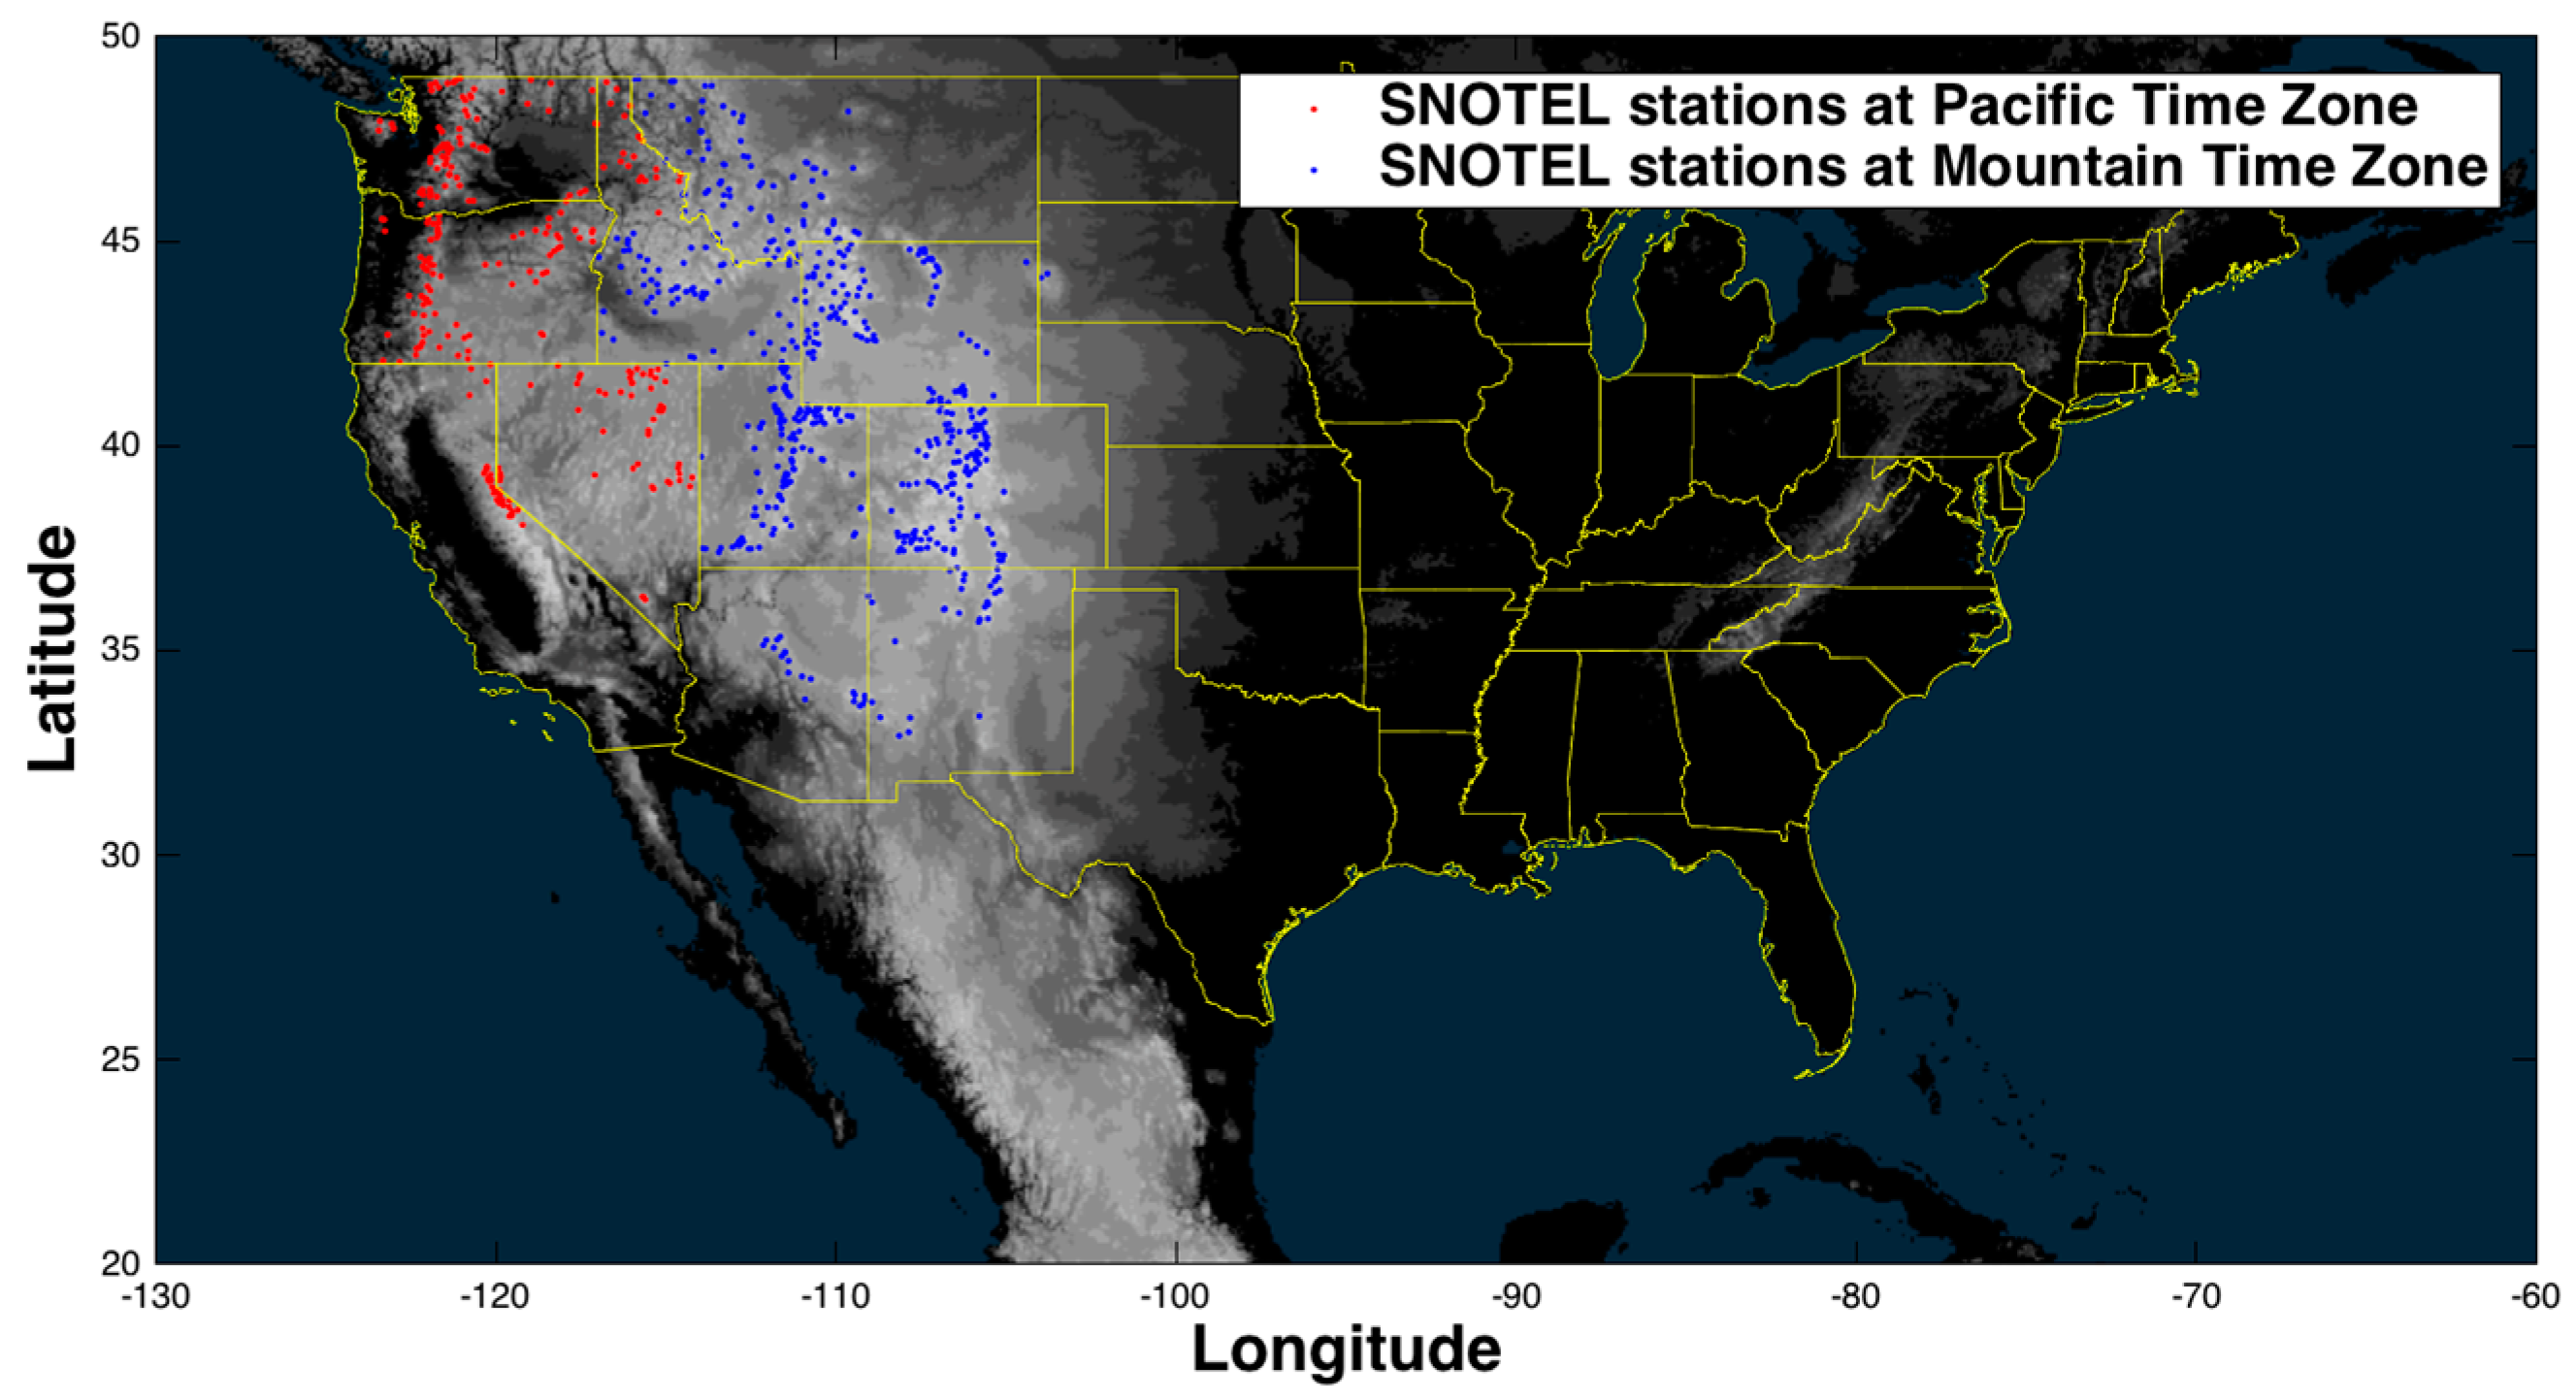
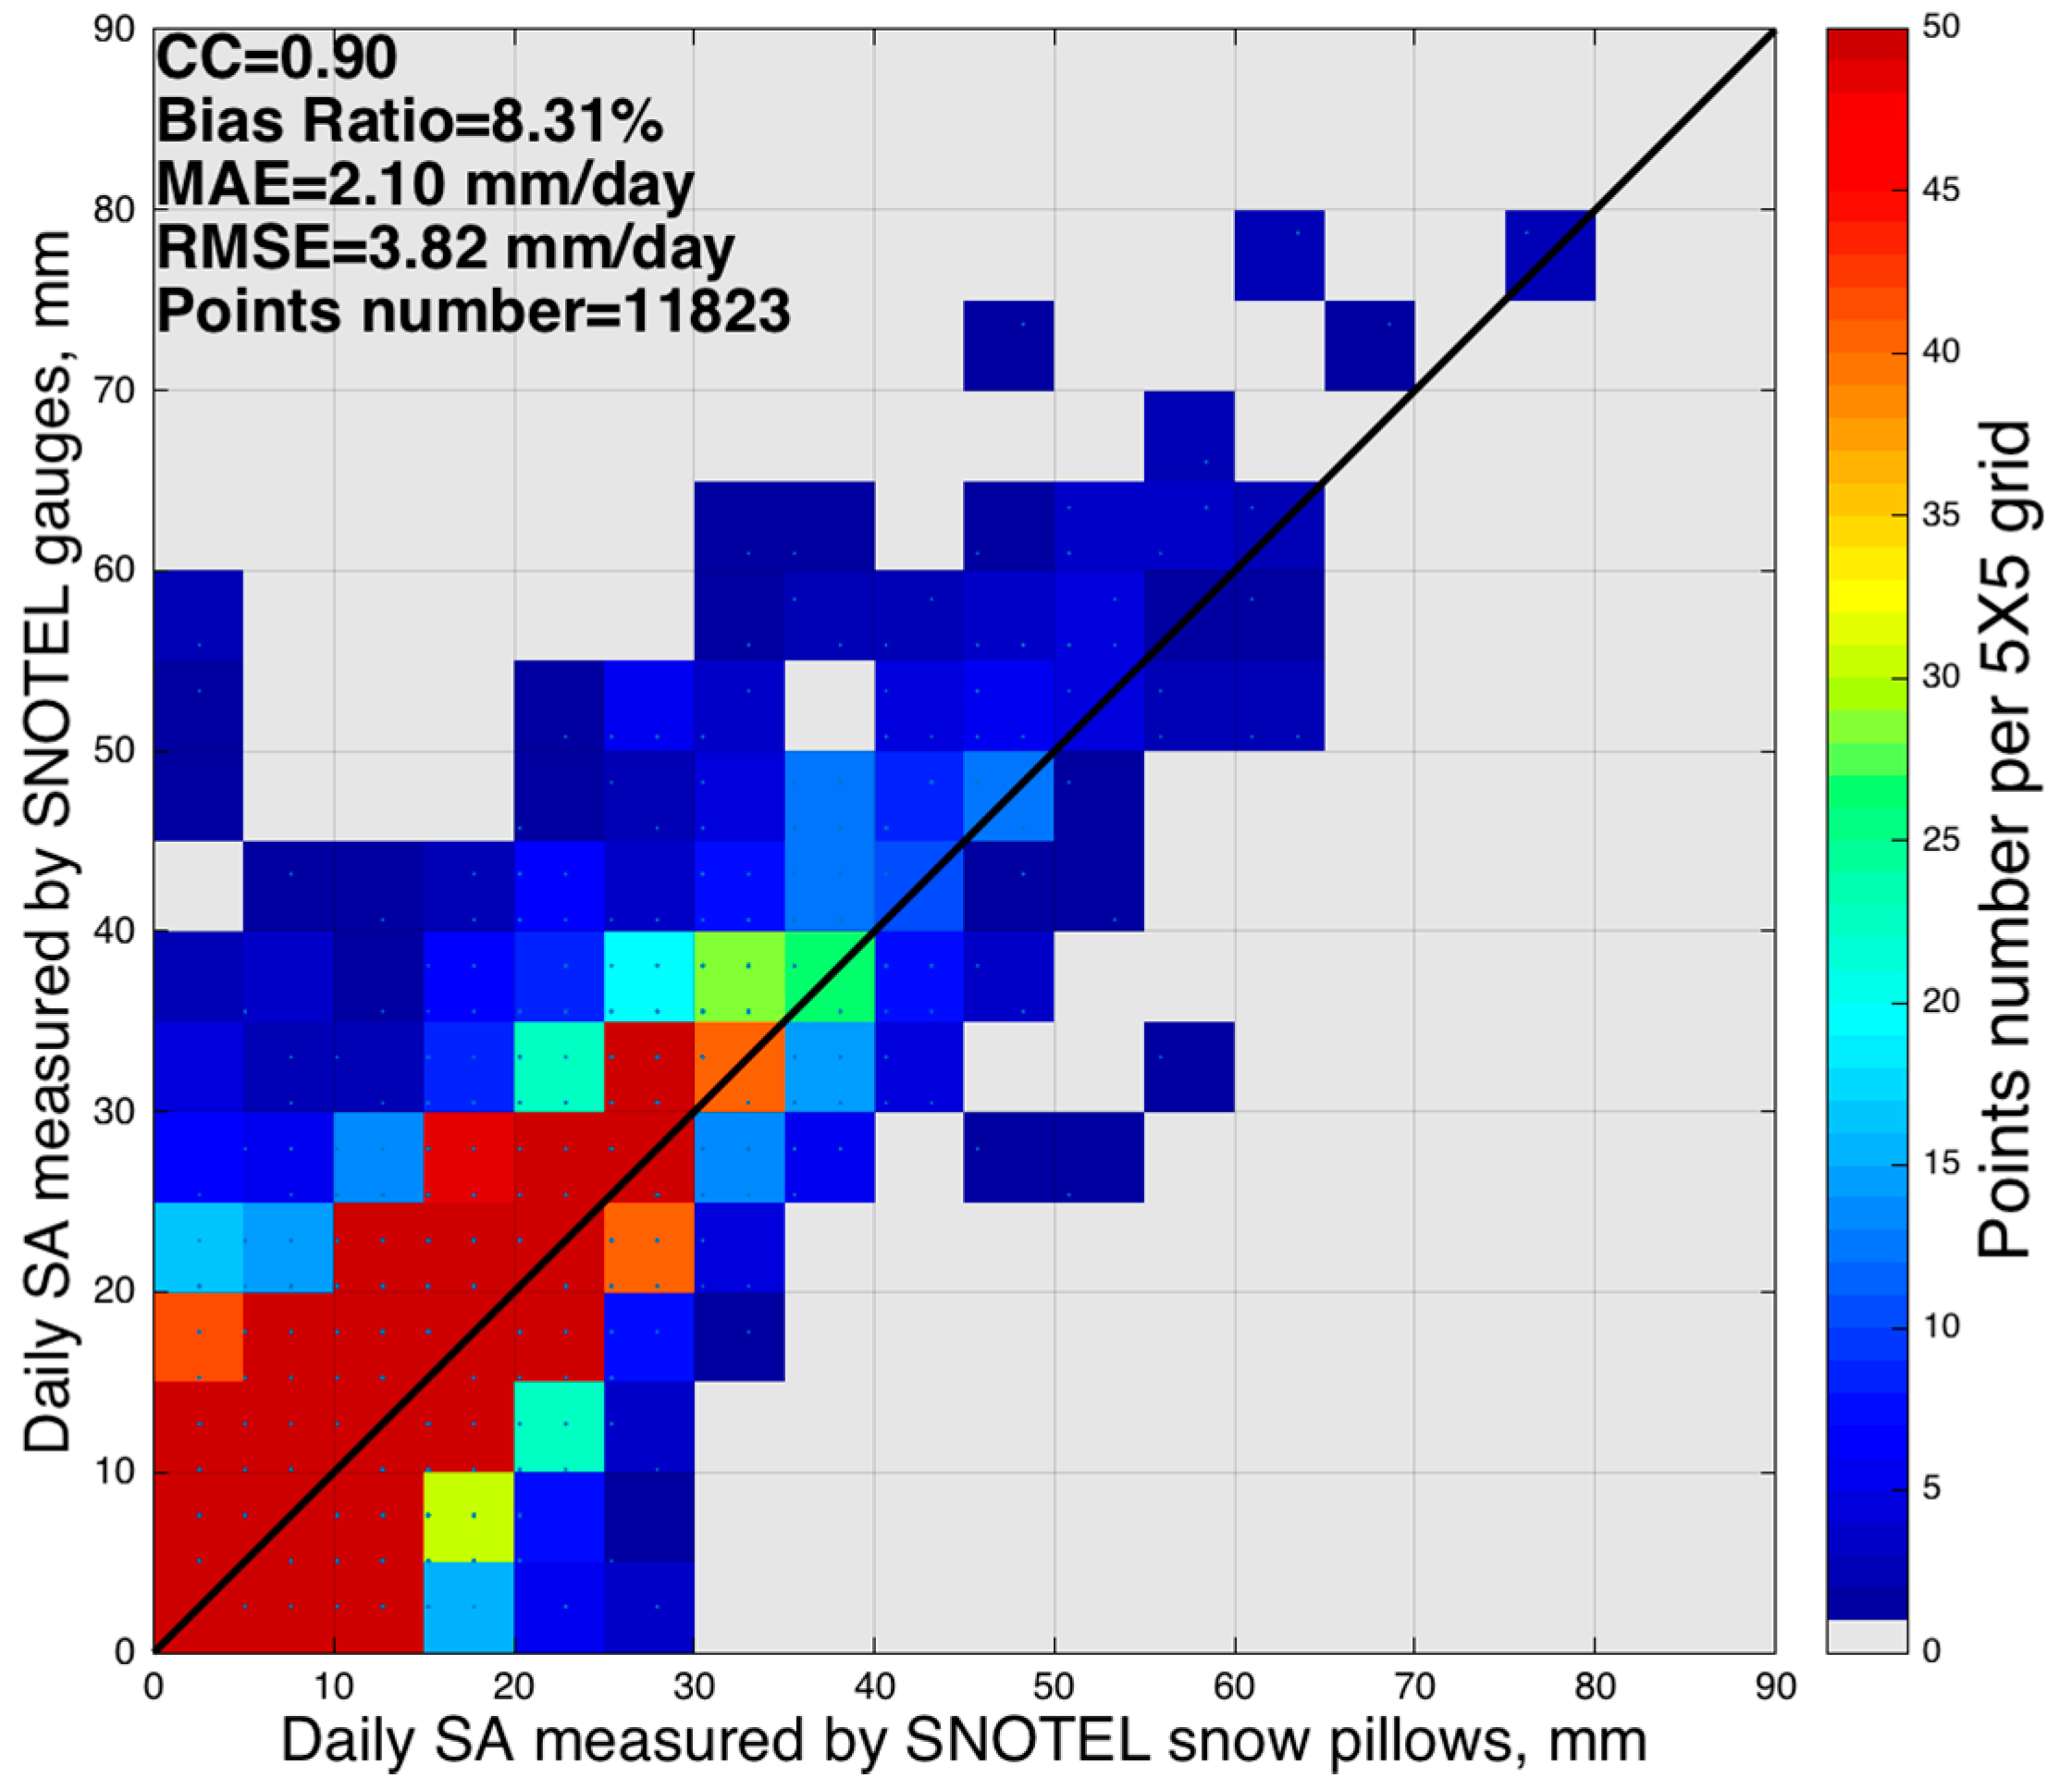
2.1. SNOTEL SWE Measurements

We utilized snow observations from 788 SNOTEL stations located in the western mountainous region (Figure 1) from March 2014 to September 2015 (to temporally match IMERG data availability). SNOTEL stations are fully automated, collecting data on snowpack SWE, snow depth, all-season precipitation accumulation, and air temperature. SWE is measured by snow pillow filled with an antifreeze solution [15]. As snow accumulates, the weight of the snowpack forces the solution into a manometer column inside the instrument shelter. The height change of the manometer is monitored by a pressure transducer and is converted to SWE in inches. Like the snow pillows, SNOTEL gauges also work on the same manometer/pressure transducer principle. The precipitation gauges measure all phases of precipitation, while snow pillows only measure solid precipitation. The snow pillow and precipitation gauges are both hourly sensors. However, due to the wind effect and sensor issues, the hourly SWE and precipitation data may not be reliable compared to daily data. To provide a robust and reliable reference for evaluation, we matched radar and satellite data to daily SNOTEL measurements. The daily SNOTEL measurements are transmitted at local midnight for the previous day. We created daily SA based on the difference in cumulative values between day N and N–1, and conducted a quality control procedure on the SNOTEL dataset following the same one described in [15] to remove the outliers. More detailed information on SNOTEL data can be found in [15].

2.2. MRMS Snow Accumulation
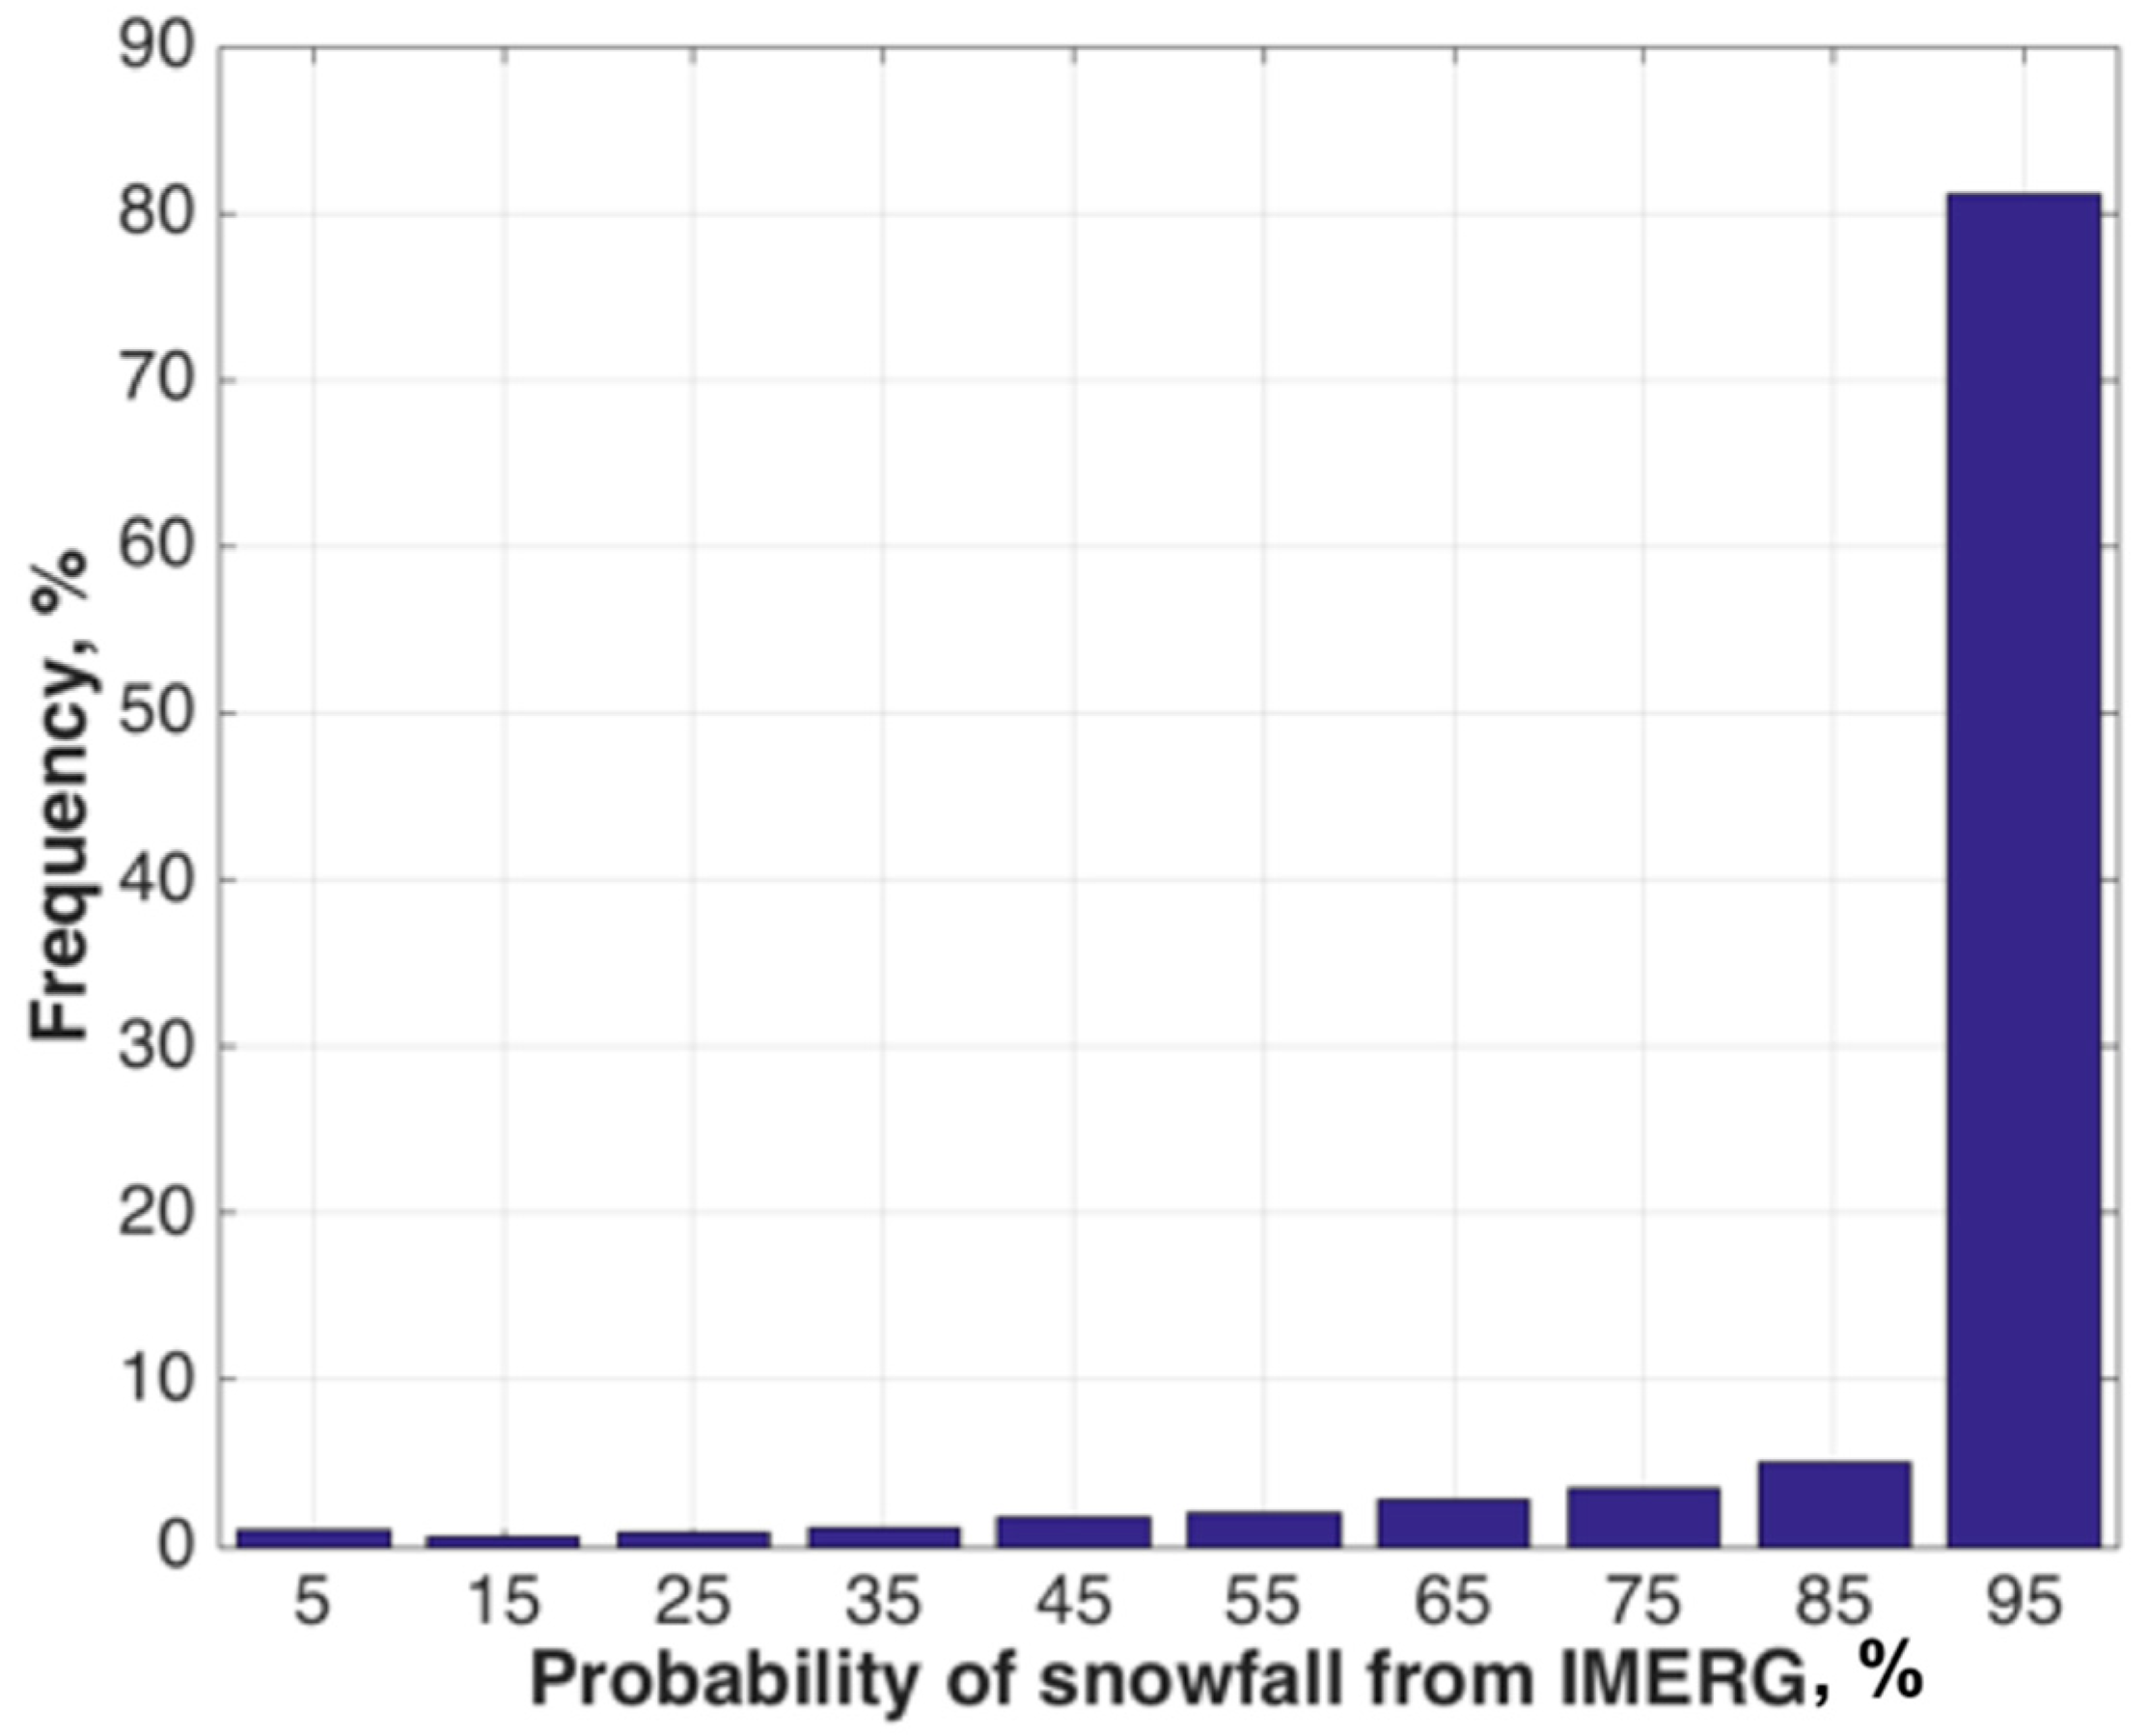
The MRMS is a research system integrating radar, rain gauge, satellite, and numerical weather prediction (NWP) model data and generates automated, seamless national 3D radar mosaic and multi-sensor quantitative precipitation estimates [4]. The MRMS system uses two criteria to identify snowfall. First, to avoid Bragg scattering [19,20], radar reflectivity must exceed 5 dBZ. Second, the surface temperature and wet bulb temperature from hourly temperature model analyses must be lower than 2 °C and 0 °C, respectively. For each grid identified as falling snow, the empirical relation Z = 75 S2 is applied to convert radar reflectivity to snowfall rate. Then, the instantaneous snowfall rate is accumulated to 24-h snow amount.
MRMS ingests quality-controlled hourly rain gauges from the Hydrometeorological Automated Data System (HADS) [21]. Most of the HADS gauges are tipping-bucket type, and are incapable of measuring frozen precipitation properly, even when heated (e.g., [14]). When surface wet-bulb temperature (WBT) is at or below 0 °C, gauge data are considered unreliable and are labeled “frozen” to avoid contaminating radar measurements. So, the MRMS snow accumulation data are measured from radar only without gauge measurements incorporated.

2.3. IMERG

Starting in March 2014, GPM Level III product IMERG synergizes three mainstream algorithms, such as the Precipitation Estimation from Remotely Sensed Information using Artificial Neural Networks—Cloud Classification System (PERSIANN-CCS, [22,23]) and the Climate Prediction Center Morphing-Kalman Filter (CMORPH-KF, [24]) Lagrangian time interpolation scheme to provide high resolution products (30-min and 0.1°). Importantly, it ingests the retrievals from the latest version of the Goddard Profiling Algorithm (GPROF, [6]). The retrievals from the latest version of the GPROF2014 are used to estimate precipitation rate from a constellation of microwave sensors, and it is expected to show higher skill in retrieving light rain and snowfall compared to the earlier versions. IMERG also uses the monthly Global Precipitation Climatology Center (GPCC; [25]) for bias correction. Three products are in the 30-min product suite [5]: Early Run (latency ~6 h), Late Run (latency ~18 h), and Final Run (latency ~4 months). In this study, all available Final Run products (from March 2014 to September 2015) are used [5]. The precipitation with (precipitationCal) and without gauge calibration (precipitationUncal) are both evaluated in this study. Besides the precipitation estimates, IMERG half-hourly data also includes a new data field, Probability of liquid precipitation, to provide the phase of the precipitation (i.e., liquid, solid, or mixed). This data field adopts a scheme developed by [26], which is based on different geophysical parameters (NASA GPM IMERG Algorithm Theoretical Basis Document).

3. Matching MRMS and IMERG with SNOTEL Snow Measurements

SNOTEL observations are point measurements of snow, so we will take an approach of comparing these data with the snowfall by radar and satellite at the grid point nearest to the station. One complicating factor to match MRMS and IMERG with the SNOTEL measurements is that SNOTEL stations do not use UTC time. The SNOTEL stations report daily data at midnight local standard time, which is 7 h after the 0000 UTC if located in the Mountain Time Zone and 8 h in the Pacific Time Zone (Figure 1). So, to match with ground measurements, precipitation from the last 18 h (Mountain Time Zone for example; 17 h if Pacific Time Zone) of remote sensing estimates was combined with that of the first 6 h (7 h in Pacific Time Zone) of the next day’s estimates.
Since we focus on snow measurements in this study, we only use matchups with daily maximum temperature less than 0 °C to ensure that daily SA are exclusively from solid precipitation. Figure 2 shows results from the comparison of snow pillow daily measurements and precipitation gauge daily measurements on snowing days. The colored data-density scatterplot in Figure 2 indicates that there is good overall agreement, with a relative bias of 8.31% and a correlation coefficient of 0.90. The underestimation of gauge measurements compared to snow pillow is the fact that the gauges often underestimate frozen precipitation, particularly in windy conditions, because the snowflakes drift away [27]. The undercatch can exceed 50% in blizzard conditions [28]. The SNOTEL pillow-sensors are better at measuring the snow than precipitation gauges. For solid precipitation comparison studies, snow pillow measurements are used.
To calculate the probability of snowfall, we simply use unity minus the probability of liquid precipitation. Figure 3 indicates that for snowing days identified by SNOTEL daily maximum temperature, IMERG mostly (more than 80%) shows probability of snowfall greater than 95%.

4. Results and Discussion

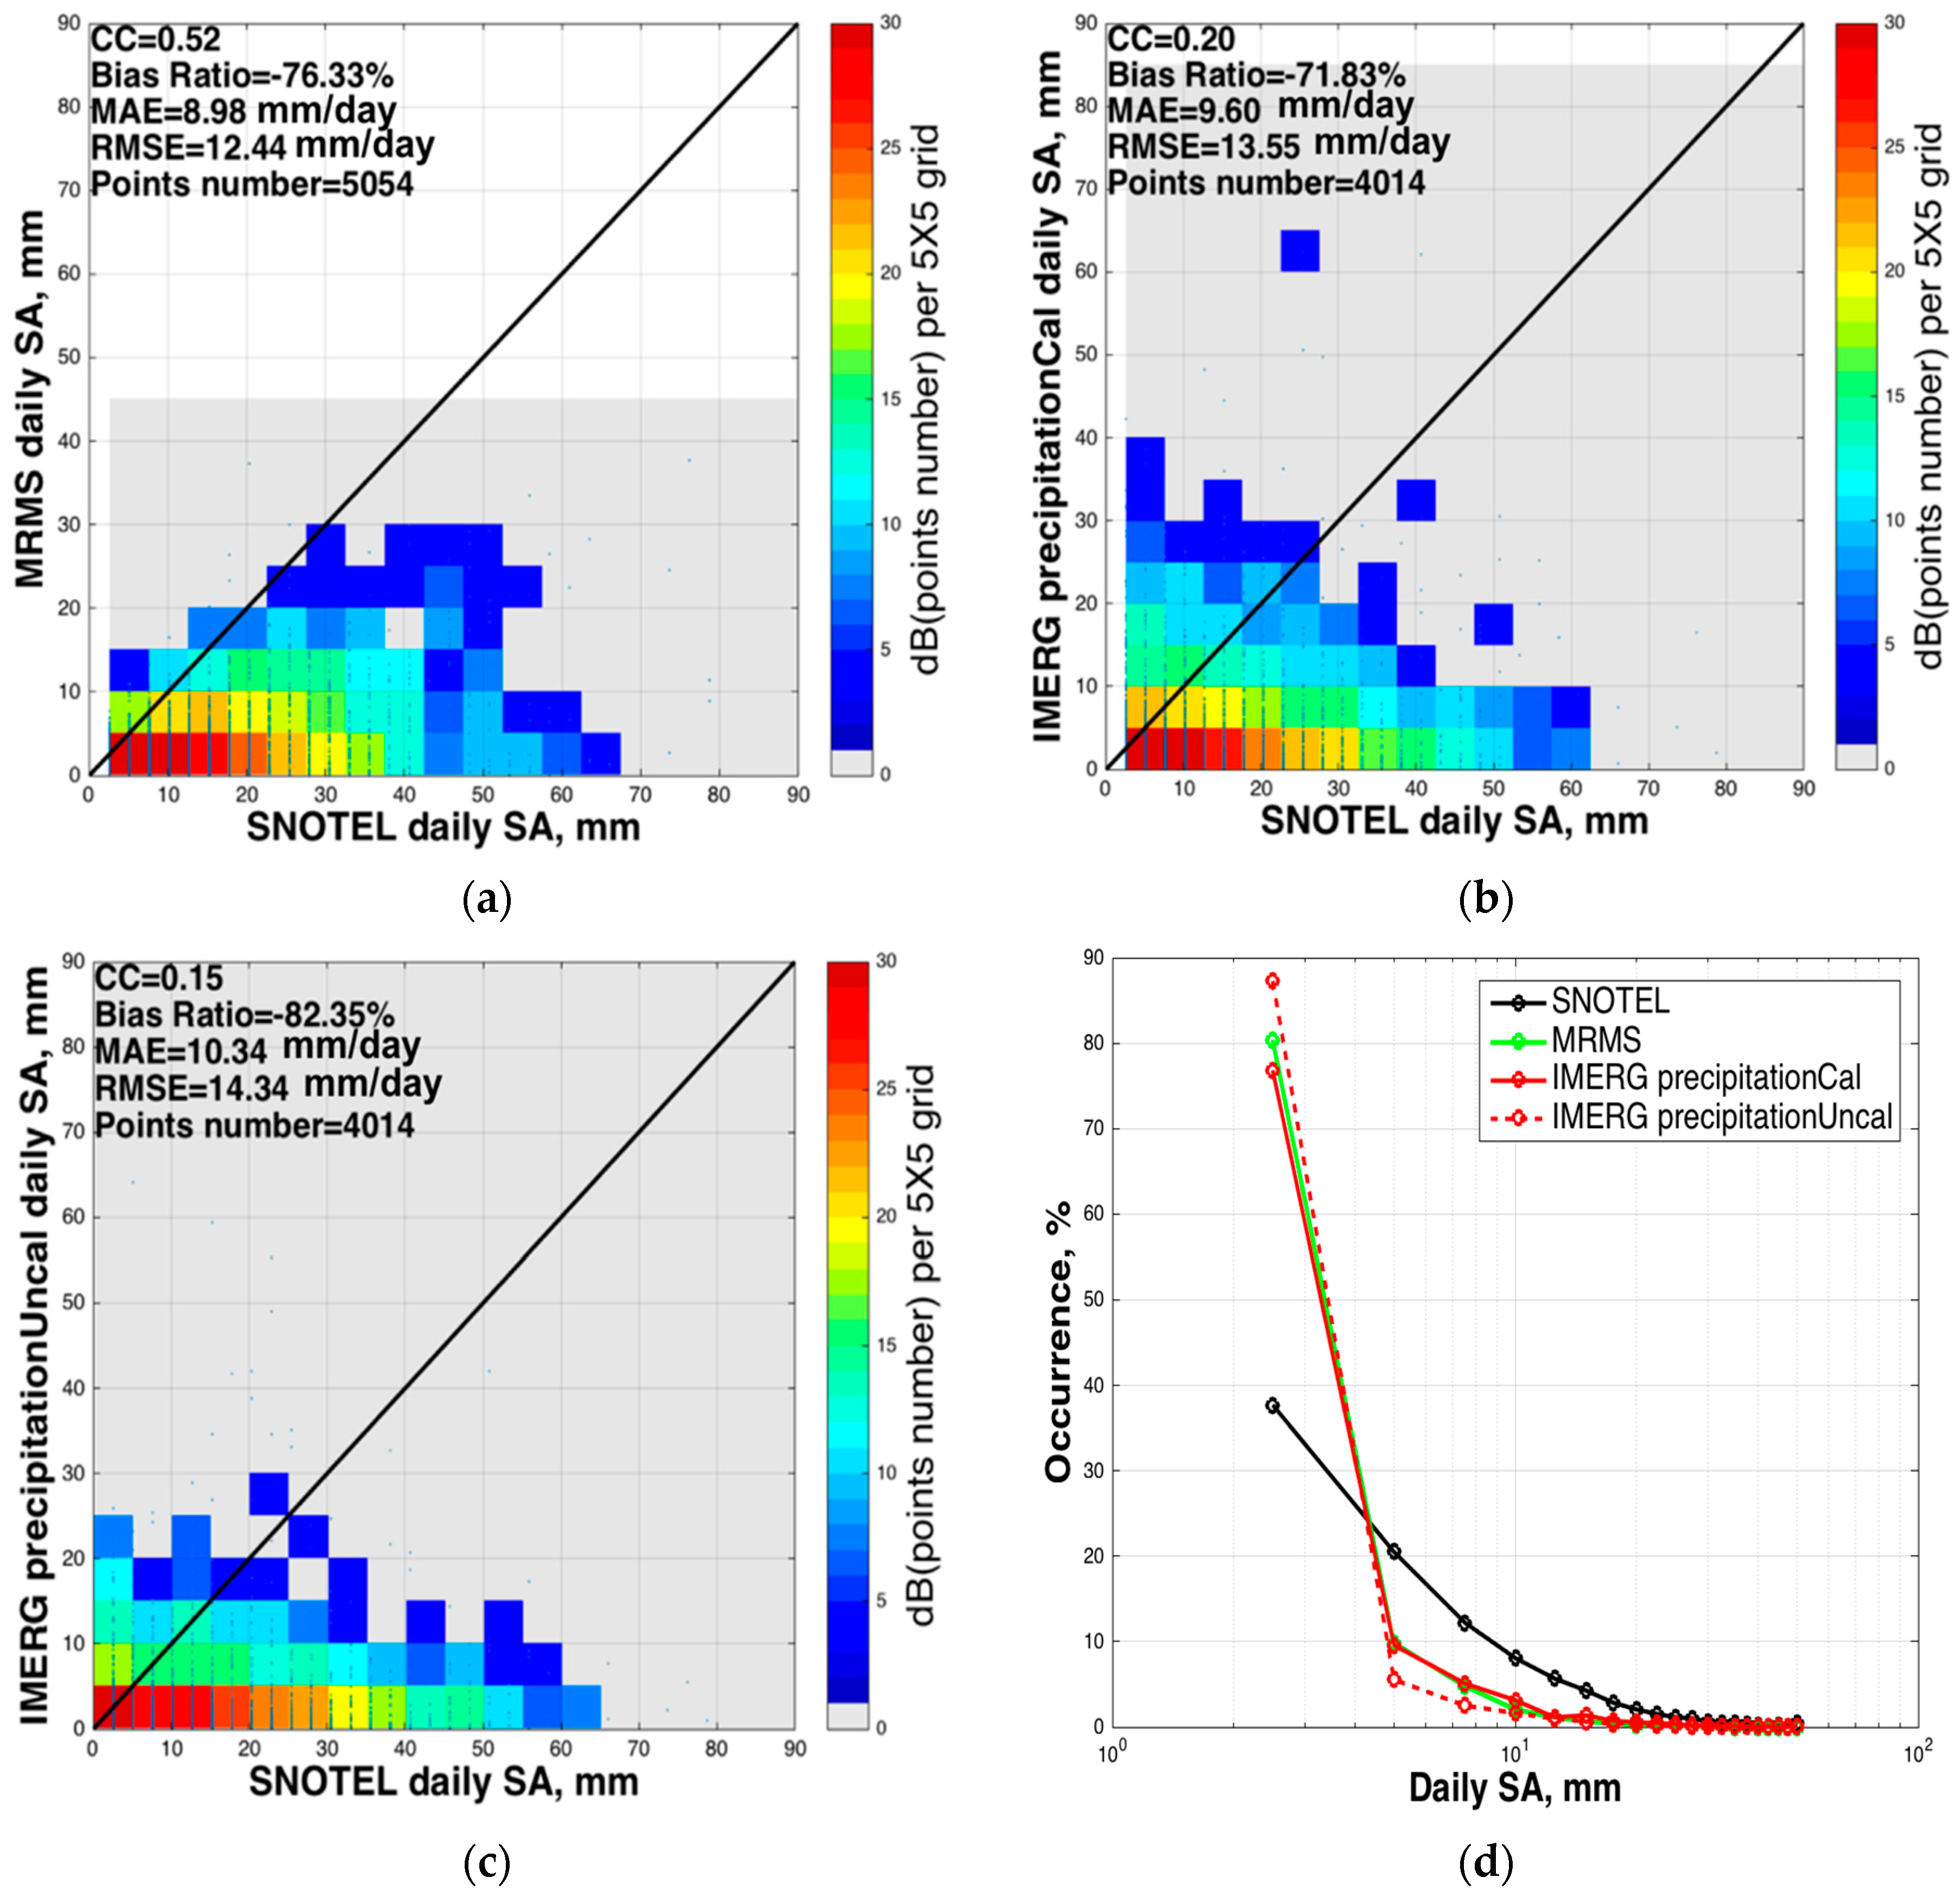
4.1. Daily Snowfall Accumulation Comparisons

We select four statistical indices for comparison of MRMS and IMERG snow daily accumulation with SNOTEL snow pillow daily measurements. The Relative Bias (RB; in percent) is used to assess the systematic bias of estimations. Correlation Coefficient (CC) is used to assess the agreement between estimates and gauge observations. The mean absolute error (MAE) measures the average magnitude of the error, while the root-mean-squared error (RMSE) quantifies the average error magnitude, giving more weight to larger errors.
Figure 4 shows results from the quantitative comparison of daily SA. It suggests that the quantification of snow rate in mountainous areas remains a challenging task for weather radars and satellites. The color-density scatter plots and the histogram in Figure 4 indicate that all three products from radar and satellite have severe underestimation, with relative biases worse than ~−71%. The IMERG precipitationCal shows slightly better bias ratio (−71.83%) compared to MRMS (−76.33%) and IMERG precipitationUncal (−82.35%). Correlation Coefficient of MRMS is about 0.52, which is better than IMERG precipitationCal (CC = 0.20) and precipitationUncal (CC = 0.15). The discrepancies could be due to large variability in snowflake shape, densities, and fall velocities [29]. The discrepancies could also be related to random factors, such as different spatial representativeness and electronic miscalibration. It is more important to identify and resolve the discrepancies from systematic nonrandom effects such as varying snowflake density with temperature, snowfall intensity, and range-dependent error in radar measurements caused by inhomogeneous Vertical Profile of Reflectivity (VPR). These potential nonrandom factors are elucidated in the following sections.

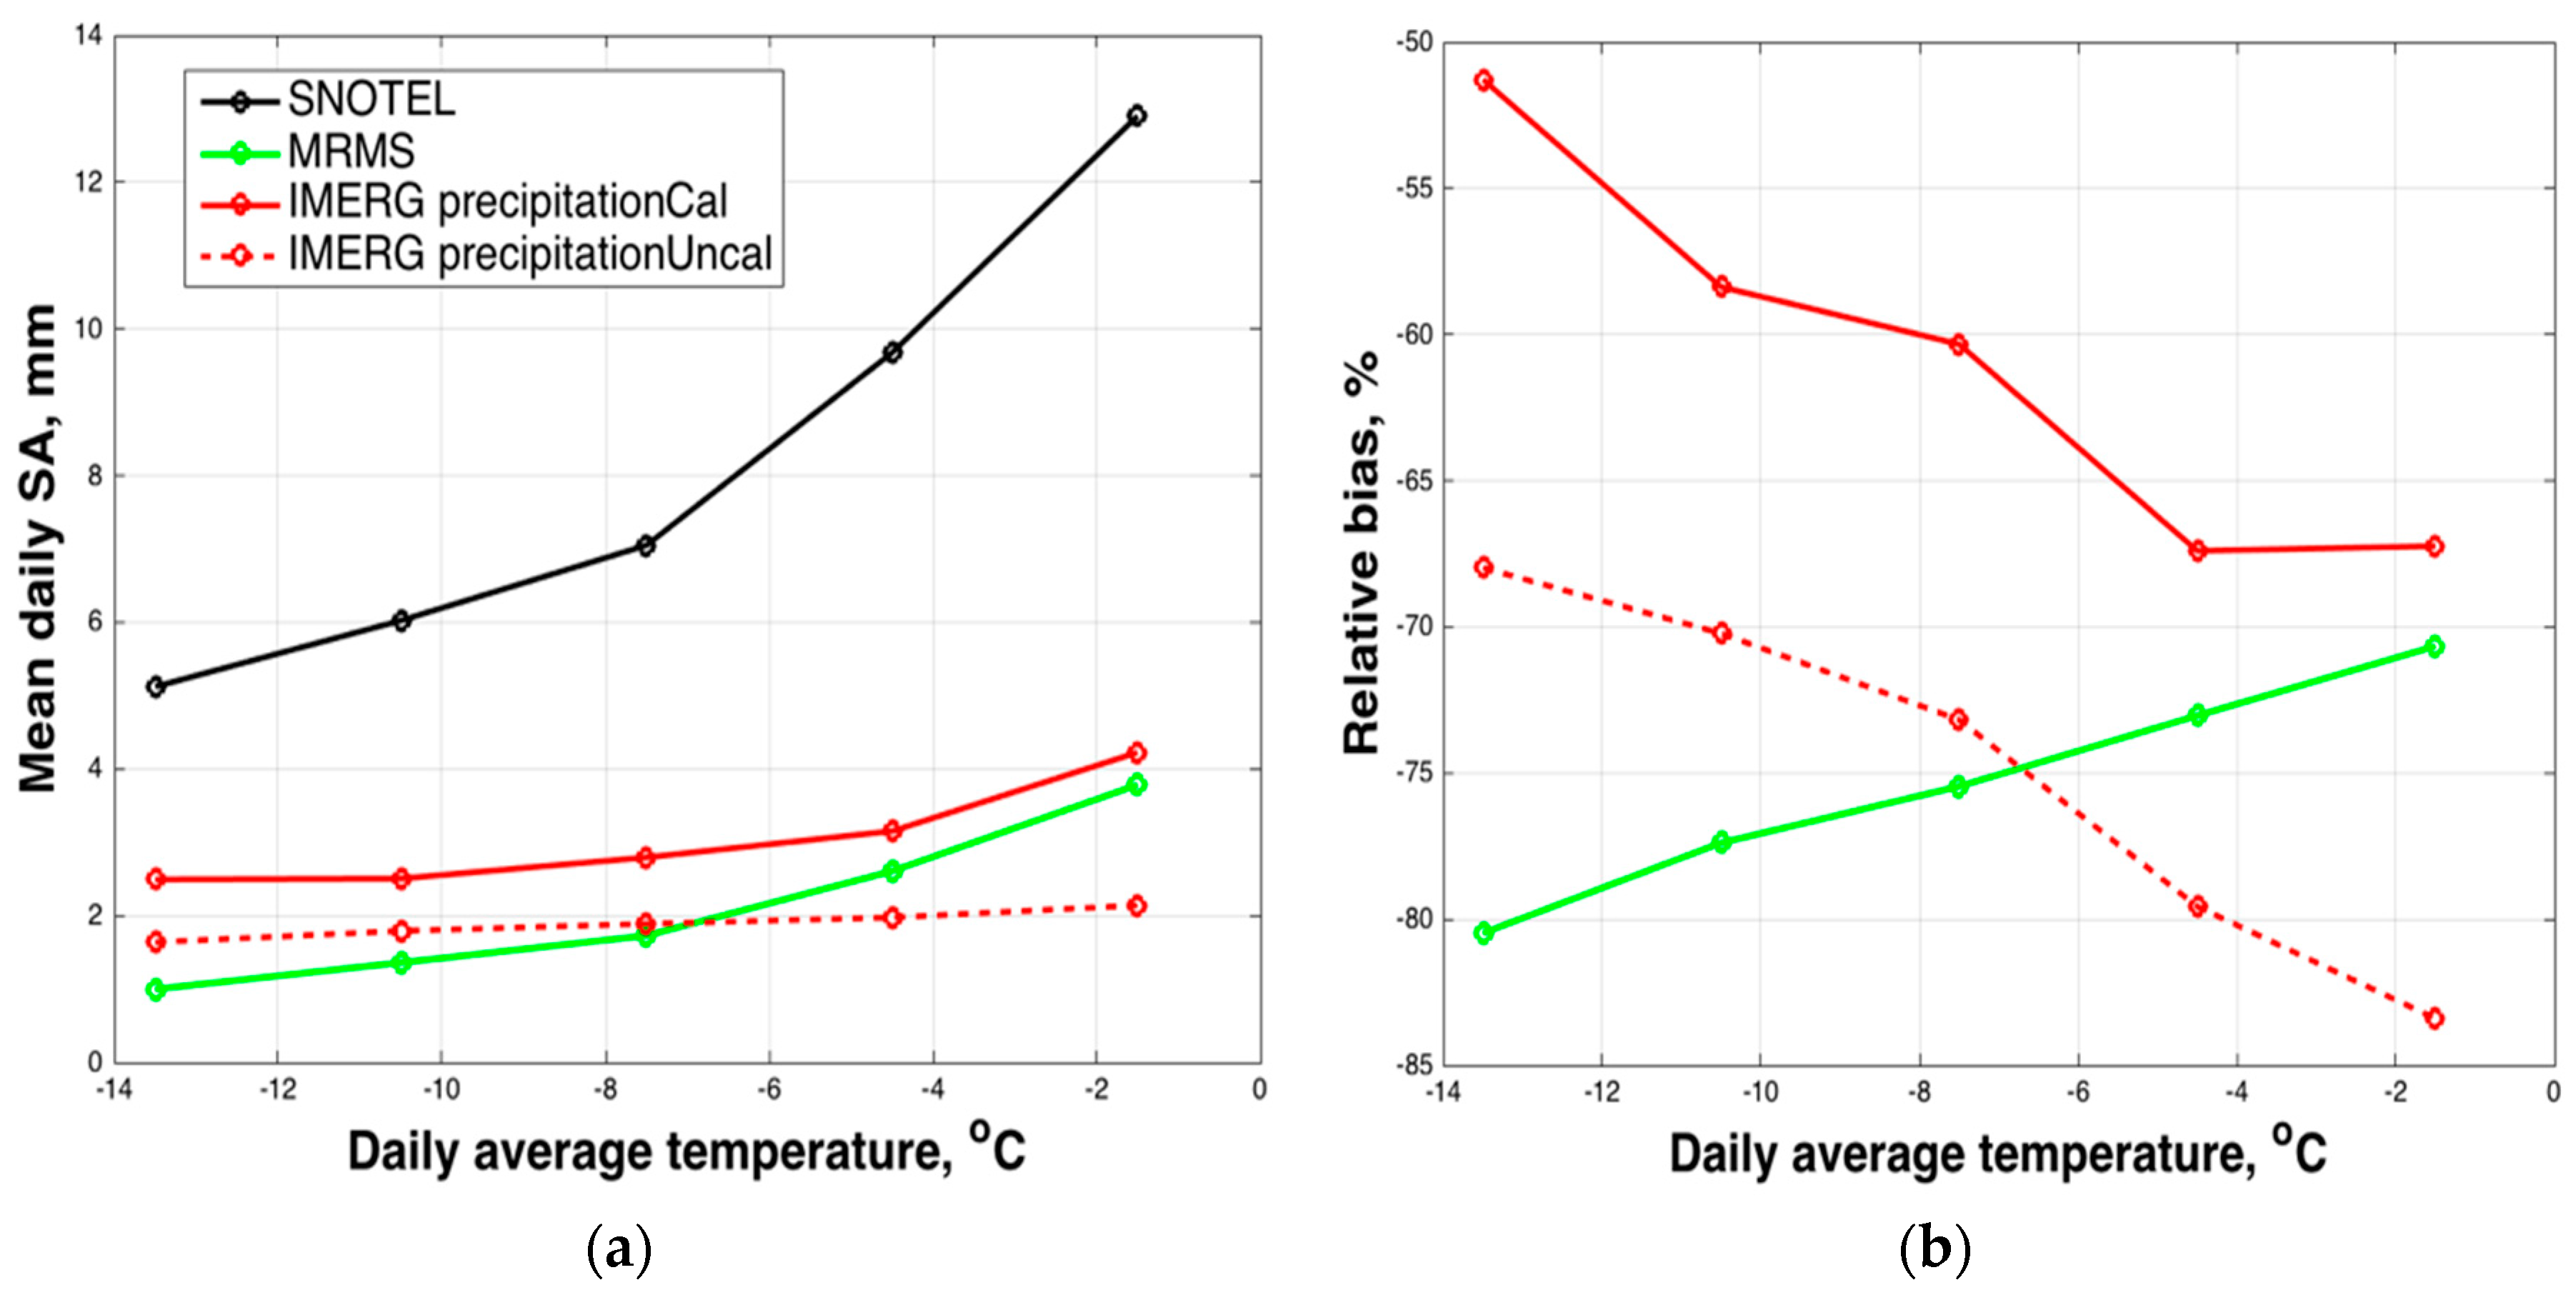
4.2. Evaluation with Temperature

Liquid rain has a relatively constant density. However, snow density can vary greatly, making it difficult to estimate particles’ fall speed, and thus snowfall intensity [30]. Since snow density and fall speed are temperature-dependent [31,32], an evaluation of remote sensing snowfall measurements as a function of temperature is studied.
Figure 5a compares daily SA from SNOTEL with MRMS and IMERG as a function of near-surface air temperature measured by SNOTEL air-temperature sensor. Mean daily SA measured by SNOTEL snow pillows increases with temperature due to the increasing density. This is consistent with previous studies reporting a nonlinear increase in snow density with increasing temperature over range of −15 °C–0 °C (e.g., [31,33]). Garrett et al. (2014) [32] found a 37% reduction in the mean value of snowfall density with temperature decreasing from −3.5 °C to −17.3 °C. Previous wind tunnel studies (e.g., [34,35]) have shown that the denser snow particles accelerate the falling speed, resulting in significant augmentation of snow mass flux.
Both MRMS and IMERG underestimate snow compared to SNOTEL across all −14 °C to 0 °C temperature bins. SNOTEL SA shows a large increase at temperatures warmer than −7 °C, but MRMS and IMERG do not clearly show this increase (Figure 5a). The difference between remote sensing products and SNOTEL becomes larger as temperature increases and approaches 0 °C.
Figure 5b compares the products using RB with SNOTEL SA as reference. MRMS shows lower skill than satellite precipitationUncal for temperatures below −6 °C, but higher skill at warmer temperatures. The lower temperature may be associated with high elevation; e.g., places on top of mountains. The radar beam blockage and overshooting issues are likely to occur in high elevation locations. IMERG precipitationCal always has higher skill than MRMS at all temperatures. This suggests that gauge calibration is effective.

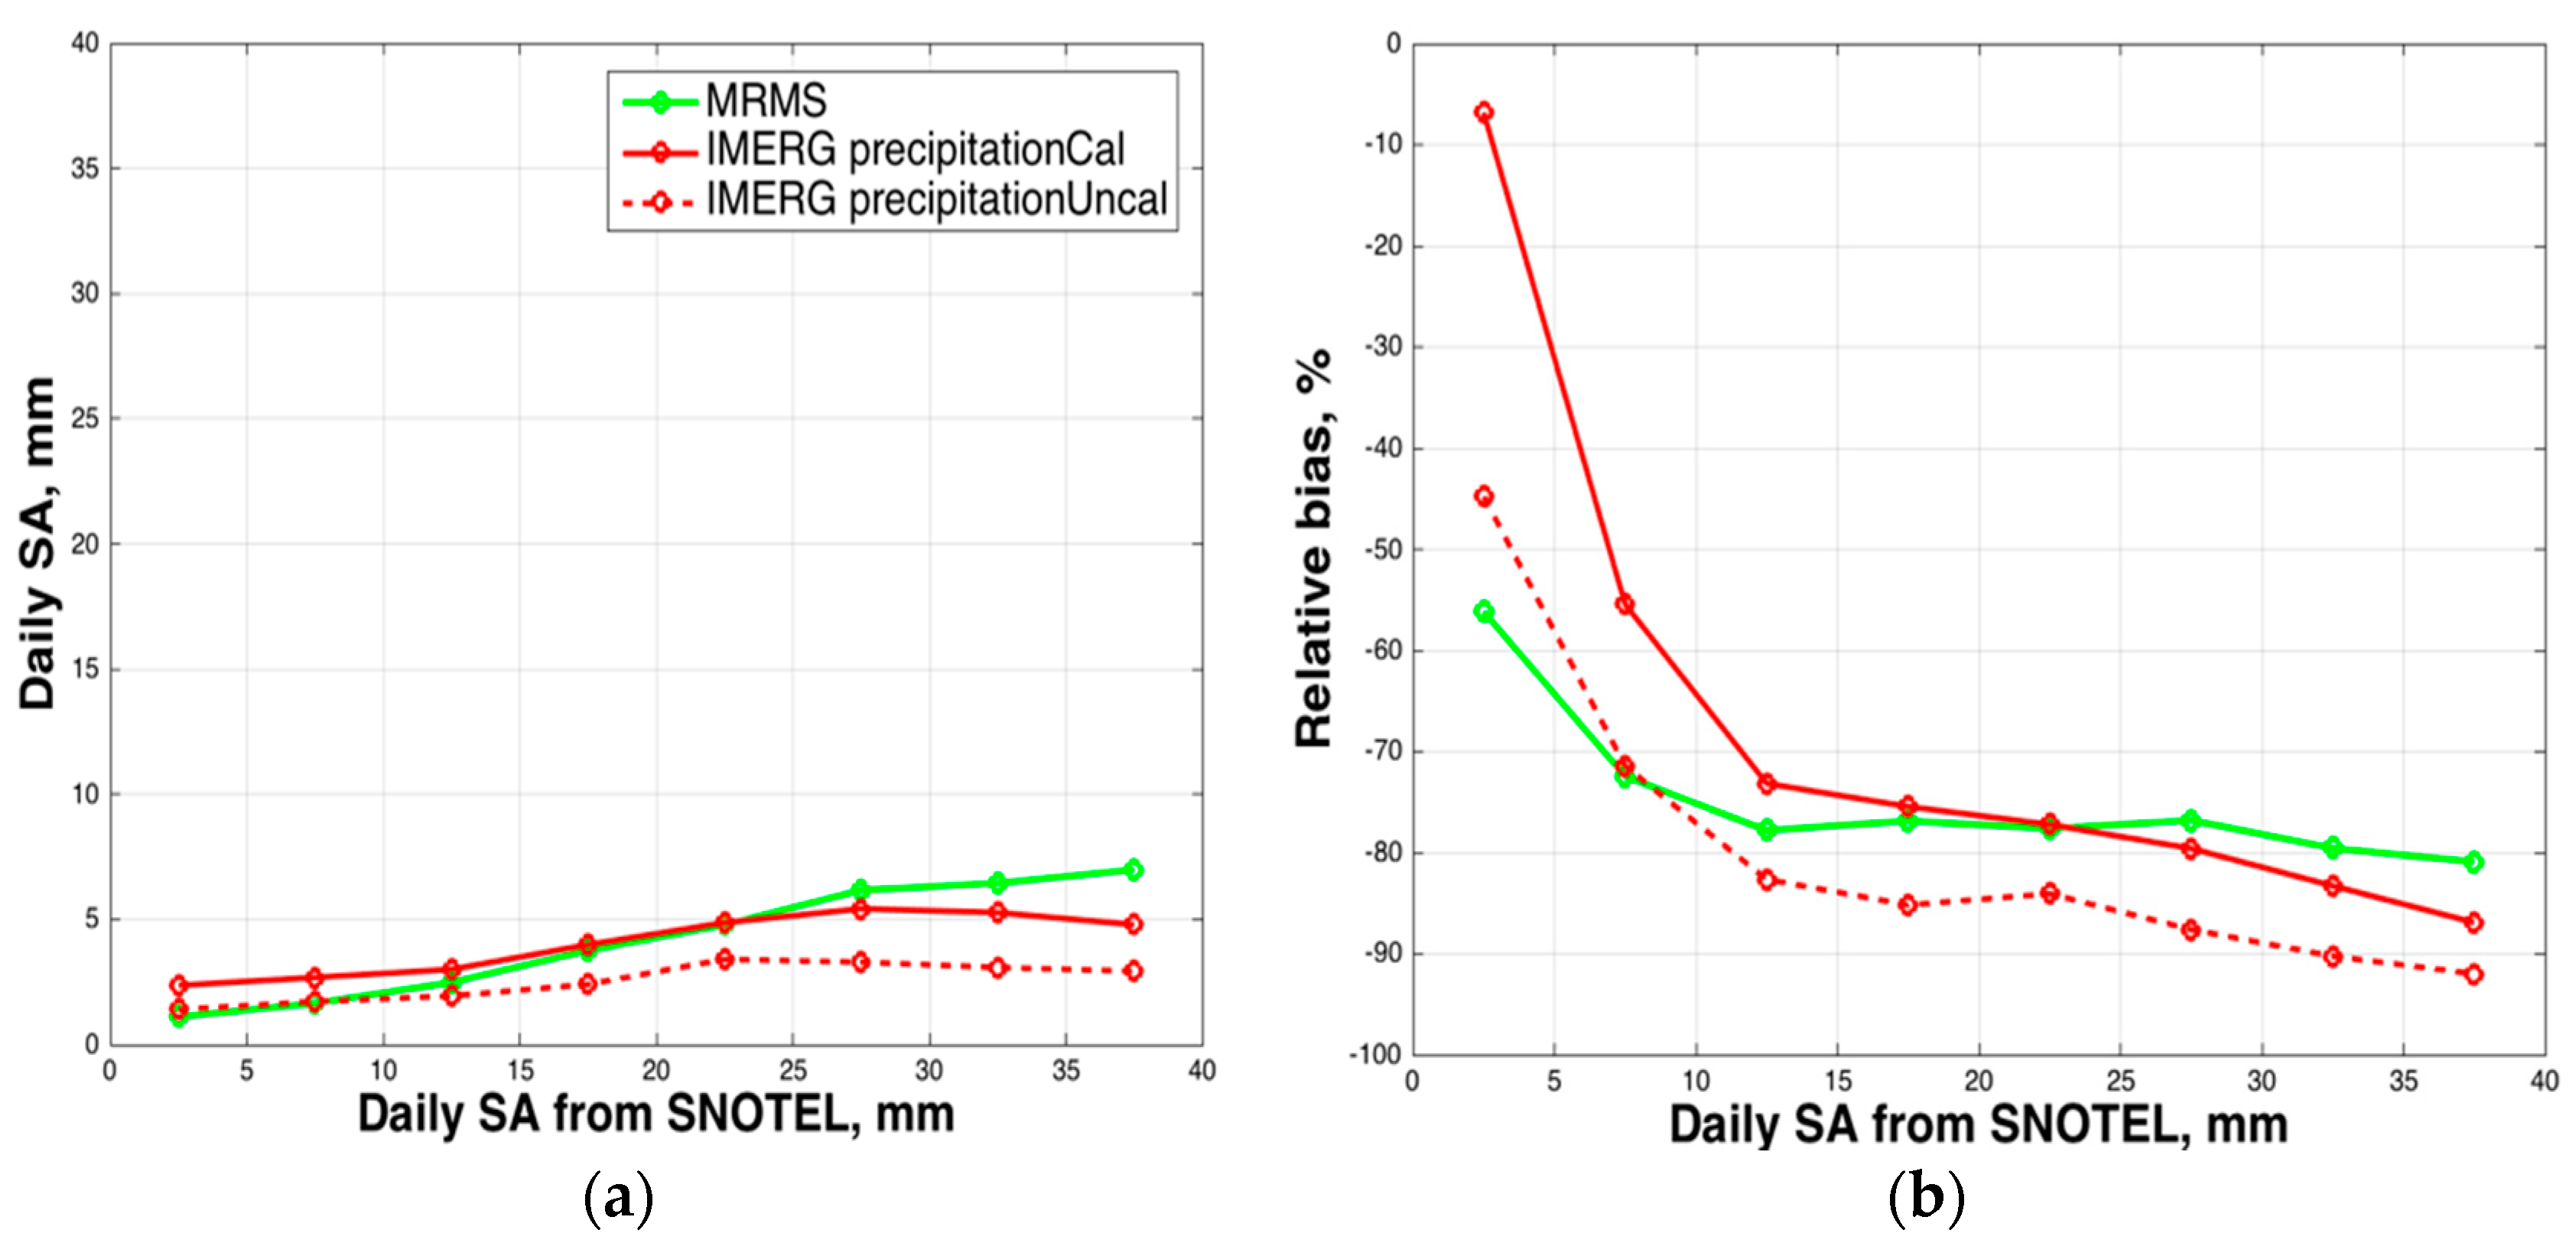
4.3. Evaluation with Snow Intensity

Figure 6a shows negative errors of snowfall estimates with increasing snow intensity measured by SNOTEL. Figure 6b shows that all snowfall estimates (MRMS, IMERG precipitationCal and precipitationUncal) have best performance when daily SA is within 0–5 mm/day. The products show larger negative bias for snow rates greater than 10 mm/day. This suggests that both satellite and radar retrievals have better performance in light snowfall events and do not show improved skill at higher intensities.
The possible factors causing the intensity-dependent errors for ground radar are (1) radar attenuation; and (2) Z-S relation uncertainties. Considering WSR-88D radars are S band with 10-cm wavelength, attenuation does not cause radar underestimation. The Z-S relation uncertainties are discussed in many studies (e.g., [36]). A variety of Z-S relations have been derived in previous studies. The one adopted in MRMS system (Z = 75 S2) is from the “Guidance on selecting Z-R relationships” reported in Radar Operations Center (1999). This Z-S relation may be inappropriate to use for the Continental United States due to large variability in snow density. A new set of Z-S relationships is needed for the western United States studied here.

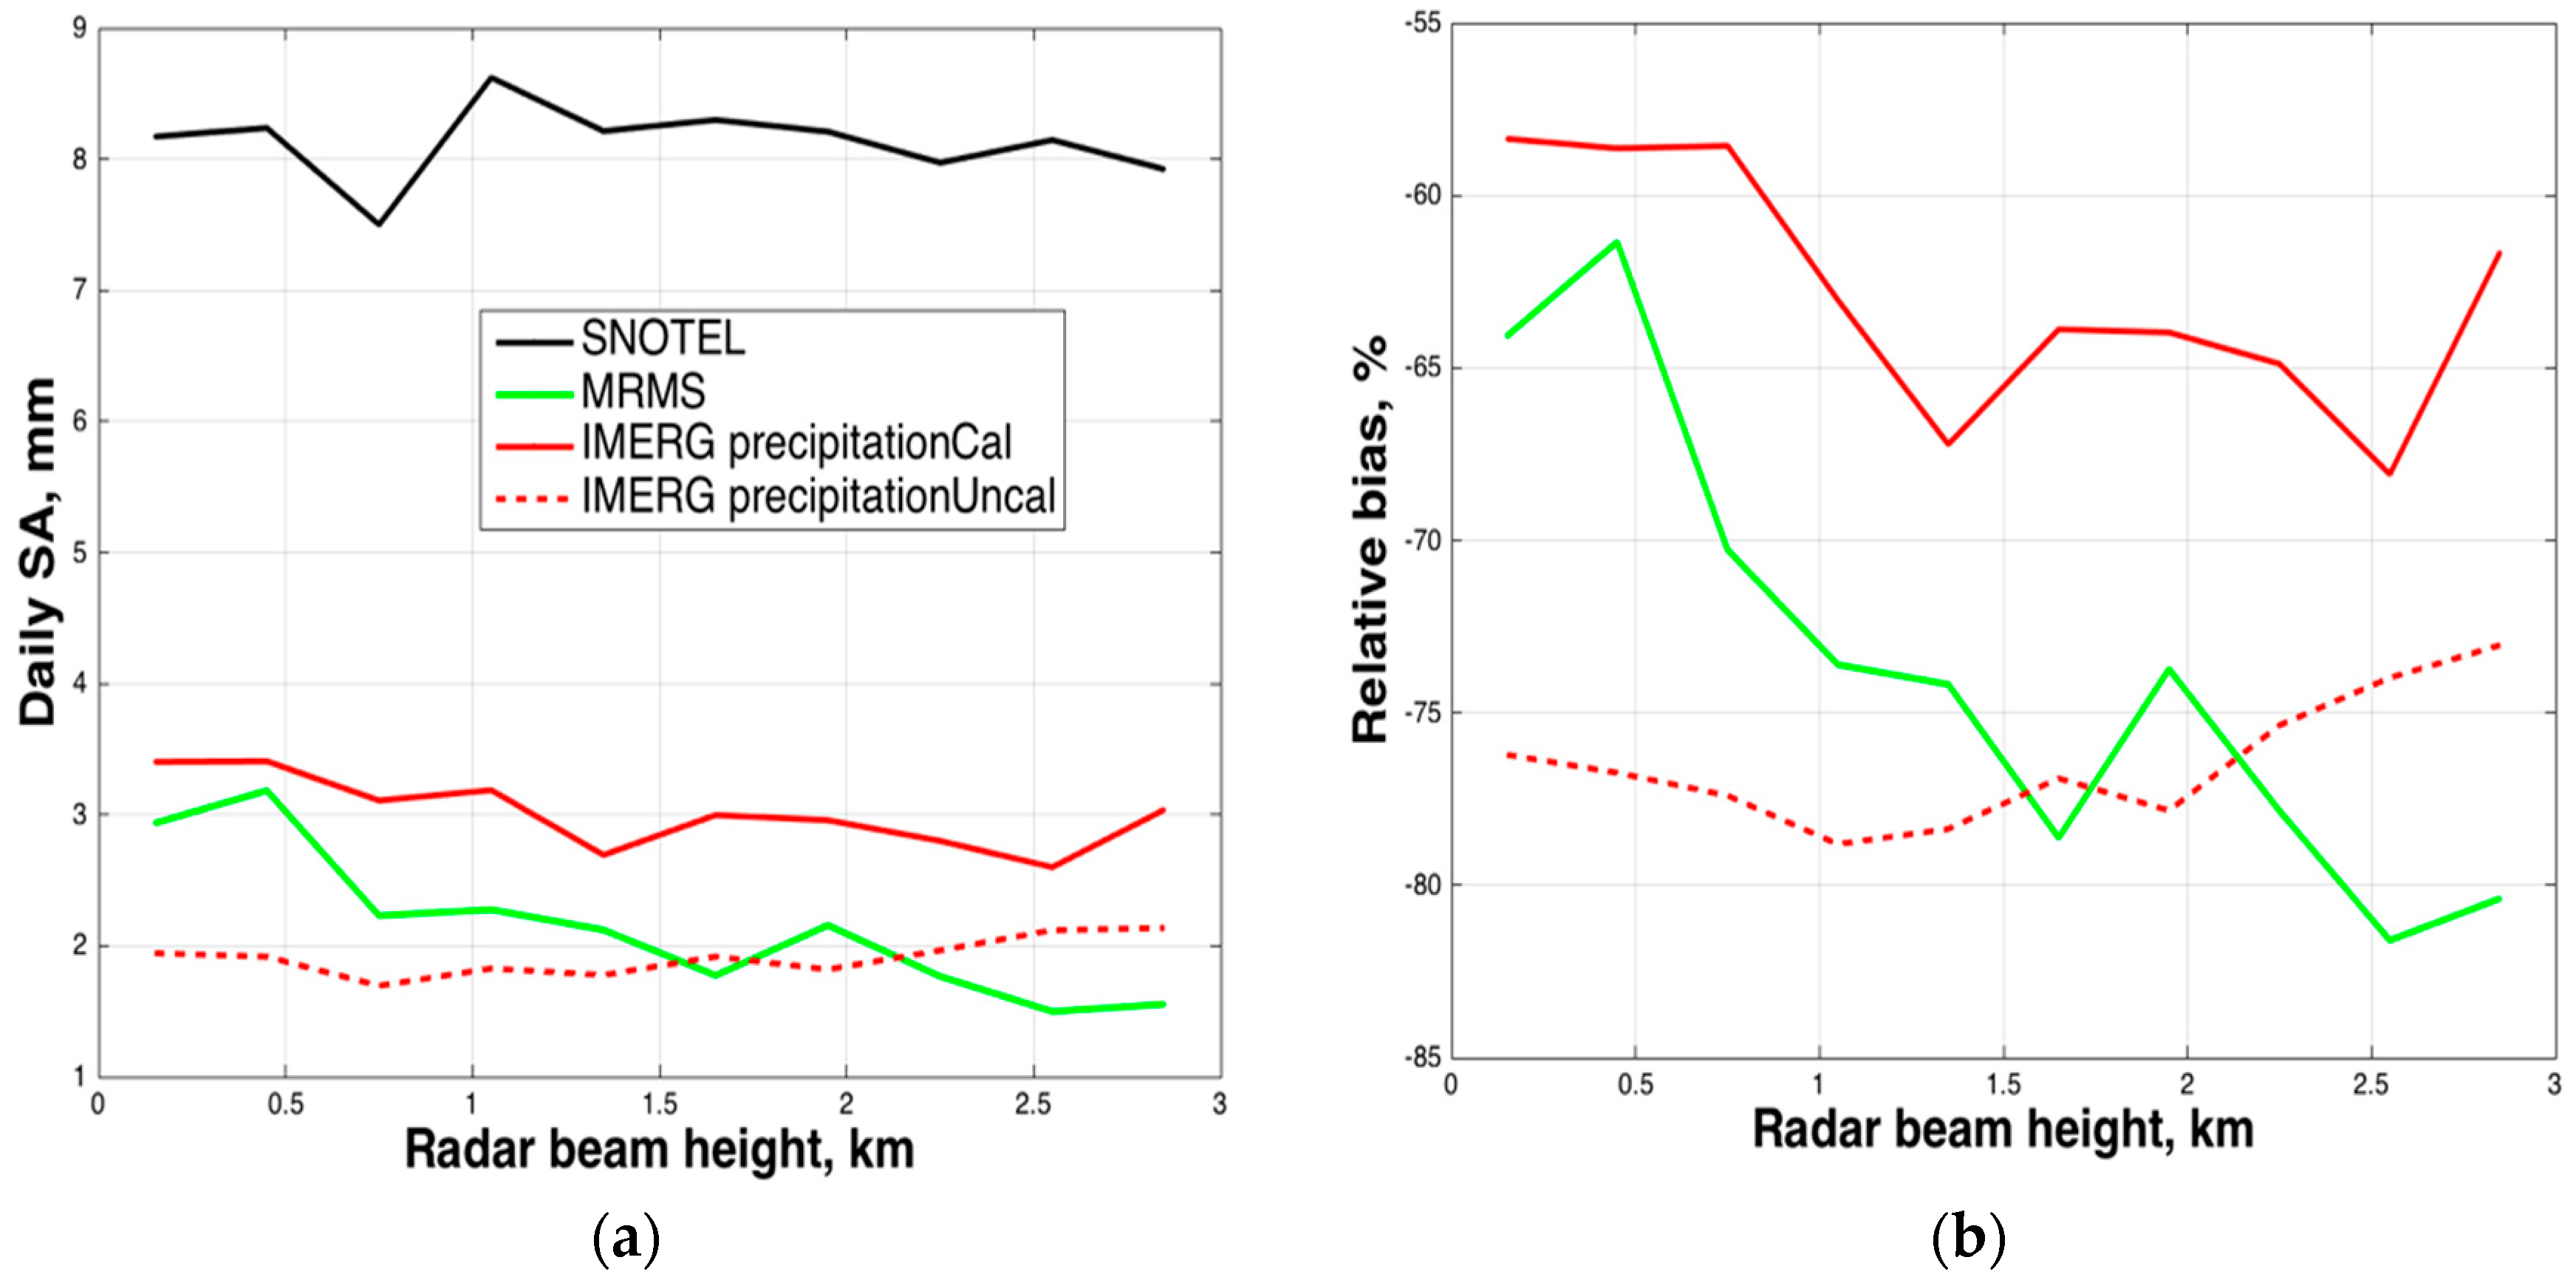
4.4. Evaluation with Ground Radar Beam Height

Systematic errors in ground-based radar precipitation estimation—related to the VPR features combined with the geometric effects of the radar beam—can create the often-noted radar beam height dependence [37,38]. Figure 7a shows that as the beam height increases as daily SA measured by ground radar decreases. However, this beam height-dependent underestimation is less significant compared to that as a function of temperature.
It is interesting to note that IMERG products (though they also have underestimation problem) remain stable with radar beam height. This indicates that as a different viewing angle from ground-based radar, satellite can provide a compensatory view on measuring precipitation. In fact, [39,40] suggested a method to enhance ground radar-based precipitation estimates using reflectivity from TRMM precipitation radar.

5. Conclusions

This study provides a quantitative assessment of snowfall estimates from ground-based radar product MRMS and satellite Global Precipitation Measurement (GPM) level III product IMERG for all snowing days (from 13 March 2014 to 30 September 2015) using the SNOTEL snow pillow measurements as ground truth, snowfall estimates at daily scale were evaluated, and few potential nonrandom factors causing discrepancies were tested. The main findings are summarized as follows:
(1)
Comparisons of daily SA indicate severe underestimations by MRMS and IMERG, with relative bias worse than −71%. IMERG precipitationCal product outperforms MRMS and IMERG precipitationUncal product in terms of relative bias.
(2)
Since snow density and falling speed are temperature dependent, snow estimates as a function of temperature were studied. The error between remote sensing instruments and SNOTEL is enhanced as temperature increases and approaches 0 °C. This suggests that radar and satellite retrievals may not be able to capture increasing snowfall mass flux caused by temperature.
(3)
By comparing remote sensing snow as a function of snowfall intensity, we found that remote sensing retrievals have better performance in light snowfall events. For heavy snow, the underestimation is worse. This snow intensity-associated underestimation indicates an impropriate Z–S applied in MRMS system.
(4)
The negative errors of radar daily snow accumulation with increasing radar beam height is demonstrated in this study, but is not the primary explanatory variable for the significant underestimation.
Both radar and satellite show severe underestimation in QPE of snowfall. Current remote sensing products for snowfall estimates can introduce large errors into hydrology and climate studies. Further improvement in radar and satellite snowfall rate retrieval might be possible by stratifying the data by degree of crystal riming and by snowflake size using environmental variables (e.g., air temperature and relative humidity) and/or polarimetric radar signals.

Acknowledgments

The research described in this paper was carried out at the Jet Propulsion Laboratory, California Institute of Technology, under a contract with the National Aeronautics and Space Administration. Government sponsorship is acknowledged. Ali Behrangi was supported by NASA GRACE/GRACE-FO and NASA WEATHER awards.

Author Contributions

Yixin Wen and Ali Behrangi conceived and designed the experiments; Yixin Wen performed the experiments; Yixin Wen, Ali Behrangi, Bjorn Lambrigtsen and Pierre Kirstetter analyzed the data; Yixin Wen and Ali Behrangi wrote the paper.

Conflicts of Interest

The authors declare no conflict of interest.

Abbreviations

The following abbreviations are used in this manuscript:
CCCorrelation Coefficient
CMORPH-KFClimate Prediction Center Morphing-Kalman Filter
GPCCGlobal Precipitation Climatology Center
GPMGlobal Precipitation Measurement
GPROFGoddard Profiling Algorithm
HADSHydrometeorological Automated Data System
IMERGIntegrated Multi-satellite retrievals for GPM
MAEMean Absolute Error
MRMSMulti-Radar/Multi-Sensor
NEXRADNext Generation Weather Radar
NWPNumerical Weather Prediction
PERSIANN-CCSPrecipitation Estimation from Remotely Sensed Information using Artificial Neural Networks—Cloud Classification System
PrecipitationCalPrecipitation with Gauge Calibration
PrecipitationUncalPrecipitation without Gauge Calibration
QPEQuantitative Precipitation Estimates
RAPRapid Refresh
RBRelative Bias
RMSERoot-Mean-Squared Error
SASnowfall Accumulation
SNOTELSnow Telemetry
SWESnow Water Equivalent
TMPATRMM Multi-satellite Precipitation Analysis
TRMMTropical Rainfall Measurement Mission
VPRVertical Profile of Reflectivity
WSR-88DWeather Surveillance Radar-1988 Doppler

References

  1. Behrangi, A.; Tian, Y.; Lambrigtsen, B.H.; Stephens, G.L. What does cloudsat reveal about global land precipitation detection by other spaceborne sensors? Water Resour. Res. 2014, 50, 4893–4905. [Google Scholar] [CrossRef]
  2. Stephens, G.L.; Li, J.L.; Wild, M.; Clayson, C.A.; Loeb, N.; Kato, S.; L’Ecuyer, T.; Stackhouse, P.W.; Lebsock, M.; Andrews, T. An update on earth’s energy balance in light of the latest global observations. Nat. Geosci. 2012, 5, 691–696. [Google Scholar] [CrossRef]
  3. Behrangi, A.; Christensen, M.; Richardson, M.; Lebsock, M.; Stephens, G.; Huffman, G.J.; Bolvin, D.; Adler, R.F.; Gardner, A.; Lambrigtsen, B.; et al. Status of high-latitude precipitation estimates from observations and reanalyses. J. Geophys. Res. Atmos. 2016, 121, 4468–4486. [Google Scholar] [CrossRef]
  4. Zhang, J.; Howard, K.; Langston, C.; Kaney, B.; Qi, Y.; Tang, L.; Grams, H.; Wang, Y.; Cocks, S.; Martinaitis, S. Multi-Radar Multi-Sensor (MRMS) quantitative precipitation estimation: Initial operating capabilities. Bull. Am. Meteorol. Soc. 2016, 97, 388–393. [Google Scholar] [CrossRef]
  5. Huffman, G.J.; Bolvin, D.T.; Braithwaite, D.; Hsu, K.; Joyce, R.; Kidd, C.; Nelkin, E.J.; Xie, P. NASA Global Precipitation Measurement (GPM) Integrated Multi-Satellite Retrievals for GPM (IMERG). Available online: http://pmm.nasa.gov/sites/default/files/document_files/IMERG_ATBD_V4.5.pdf (accessed on 26 October 2016).
  6. Kummerow, C.D.; Randel, D.L.; Kulie, M.; Wang, N.Y.; Ferraro, R.; Munchak, S.J.; Petkovic, V. The evolution of the Goddard profiling algorithm to a fully parametric scheme. J. Atmos. Ocean. Technol. 2015, 32, 2265–2280. [Google Scholar] [CrossRef]
  7. Behrangi, A.; Lebsock, M.; Wong, S.; Lambrigtsen, B. On the quantification of oceanic rainfall using spaceborne sensors. J. Geophys. Res. 2012, 117, D20105. [Google Scholar] [CrossRef]
  8. Tian, Y.; Peters-Lidard, C.D. Systematic anomalies over inland water bodies in satellite-based precipitation estimates. Geophys. Res. Lett. 2007, 34. [Google Scholar] [CrossRef]
  9. Gourley, J.J.; Jorgensen, D.P.; Matrosov, S.Y.; Flamig, Z.L. Evaluation of incremental improvements to quantitative precipitation estimates in complex terrain. J. Hydrometeorol. 2009, 10, 1507–1520. [Google Scholar] [CrossRef]
  10. Behrangi, A.; Khakbaz, B.; Jaw, T.C.; AghaKouchak, A.; Hsu, K.; Sorooshian, S. Hydrologic evaluation of satellite precipitation products over a mid-size basin. J. Hydrol. 2011, 397, 225–237. [Google Scholar] [CrossRef]
  11. Kirstetter, P.E.; Hong, Y.; Gourley, J.J.; Chen, S.; Flamig, Z.; Zhang, J.; Schwaller, M.; Petersen, W.; Amitai, E. Toward a framework for systematic error modeling of spaceborne radar with NOAA/NSSL ground radar-based National Mosaic QPE. J. Hydrometeorol. 2012, 13, 1285–1300. [Google Scholar] [CrossRef]
  12. Tian, Y.; Huffman, G.J.; Adler, R.F.; Tang, L.; Sapiano, M.; Maggioni, V.; Wu, H. Modeling errors in daily precipitation measurements: Additive or multiplicative? Geophys. Res. Lett. 2013, 40, 2060–2065. [Google Scholar] [CrossRef]
  13. Kirstetter, P.E.; Gourley, J.J.; Hong, Y.; Zhang, J.; Moazamigoodarzi, S.; Langston, C.; Arthur, A. Probabilistic precipitation rate estimates with ground-based radar networks. Water Resour. Res. 2015, 51, 1422–1442. [Google Scholar] [CrossRef]
  14. Rasmussen, R.; Baker, B.; Kochendorfer, J.; Meyers, T.; Landolt, S.; Fischer, A.P.; Black, J.; Thériault, J.M.; Kucera, P.; Gochis, D.; et al. How well are we measuring snow? The NOAA/FAA/NCAR winter precipitation test bed. Bull. Am. Meteorol. Soc. 2012, 93, 811–829. [Google Scholar] [CrossRef]
  15. Serreze, M.C.; Clark, M.P.; Armstrong, R.L.; McGinnis, D.A.; Pulwarty, R.S. Characteristics of the western United States snowpack from snowpack telemetry (SNOWTEL) data. Water Resour. Res. 1999, 35, 2145–2160. [Google Scholar] [CrossRef]
  16. Daly, C.; Halbleib, M.; Smith, J.I.; Gibson, W.P.; Doggett, M.K.; Taylor, G.H.; Curtis, J. Physiographically sensitive mapping of temperature and precipitation across the conterminous United States. Int. J. Climatol. 2008, 28, 2031–2064. [Google Scholar] [CrossRef]
  17. Thornton, P.E.; Running, S.W.; White, M.A. Generating surfaces of daily meteorology variables over large regions of complex terrain. J. Hydrol. 1997, 190, 214–251. [Google Scholar] [CrossRef]
  18. Mock, C.J. Climatic controls and spatial variations of precipitation in the western United States. J. Clim. 1996, 9, 1111–1125. [Google Scholar] [CrossRef]
  19. Knight, C.A.; Miller, L.J. First radar echoes from cumulus clouds. Bull. Am. Meteorol. Soc. 1993, 74, 179–188. [Google Scholar] [CrossRef]
  20. Kollias, P.; Szyrmer, W.; Zawadzki, I.; Joe, P. Considerations for spaceborne 94 GHz radar observations of precipitation. Geophys. Res. Lett. 2007, 34. [Google Scholar] [CrossRef]
  21. Kim, D.; Nelson, B.; Seo, D.J. Characteristics of reprocessed Hydrometeorological Automated Data System (HADS) hourly precipitation data. Weather Forecast. 2009, 24, 1287–1296. [Google Scholar] [CrossRef]
  22. Hong, Y.; Hsu, K.; Sorooshian, S.; Gao, X. Precipitation estimation from remotely sensed imagery using an artificial neural network cloud classification system. J. Appl. Meteorol. 2004, 43, 1834–1853. [Google Scholar] [CrossRef]
  23. Mahrooghy, M.; Anantharaj, V.G.; Younan, N.H.; Aanstoos, J.; Hsu, K.L. On an enhanced PERSIANN-CCS algorithm for precipitation estimation. J. Atmos. Ocean. Technol. 2012, 29, 922–932. [Google Scholar] [CrossRef]
  24. Joyce, R.J.; Xie, P.; Janowiak, J.E. Kalman filter–based CMORPH. J. Hydrometeorol. 2011, 12, 1547–1563. [Google Scholar] [CrossRef]
  25. Schneider, U.; Becker, A.; Meyer-Christoffer, A.; Ziese, M.; Rudolf, B. Global Precipitation Analysis Products of the GPCC. Available online: ftp://ftp-anon.dwd.de/pub/data/gpcc/PDF/GPCC_intro_products_2008.pdf (accessed on 26 October 2016).
  26. Sims, E.M.; Liu, G. A parameterization of the probability of snow–rain transition. J. Hydrometeorol. 2015, 16, 1466–1477. [Google Scholar] [CrossRef]
  27. Doesken, N.J.; Judson, A. The Snow Booklet: A Guide to the Science, Climatology, and Measurement of Snow in the United States; Department of Atmospheric Science, Colorado State University: Fort Collins, CO, USA, 1997. [Google Scholar]
  28. Goodison, B.E. Accuracy of Canadian snow-gage measurements. J. Appl. Meteorol. 1978, 17, 1542–1548. [Google Scholar] [CrossRef]
  29. Matrosov, S.Y.; Shupe, M.D.; Djalalova, I.V. Snowfall retrievals using millimeter-wavelength cloud radars. J. Appl. Meteorol. Climatol. 2008, 47, 769–777. [Google Scholar] [CrossRef]
  30. Rasmussen, R.; Dixon, M.; Vasiloff, S.; Hage, F.; Knight, S.; Vivekanandan, J.; Xu, M. Snow nowcasting using a real-time correlation of radar reflectivity with snow gauge accumulation. J. Appl. Meteorol. 2003, 42, 20–36. [Google Scholar] [CrossRef]
  31. Judson, A.; Doesken, N. Density of freshly fallen snow in the central Rocky Mountains. Bull. Am. Meteorol. Soc. 2000, 81, 1577–1587. [Google Scholar] [CrossRef]
  32. Garrett, T.; Yuter, S. Observed influence of riming, temperature, and turbulence on the fallspeed of solid precipitation. Geophys. Res. Lett. 2014, 41, 6515–6522. [Google Scholar] [CrossRef]
  33. LaChapelle, E.R. The Density Distribution of New Snow; USDA Forest Service, Wasatch National Forest, Alta Avalanche Study Center: Salt Lake City, UT, USA, 1962.
  34. Macklin, W.C. The density and structure of ice formed by accretion. Q. J. R. Meteorol. Soc. 1962, 88, 30–50. [Google Scholar] [CrossRef]
  35. Rasmussen, R.M.; Heymsfield, A.J. A generalized form for impact velocities used to determine graupel accretional densities. J. Atmos. Sci. 1985, 42, 2275–2279. [Google Scholar] [CrossRef]
  36. Rasmussen, R.; Dixon, M.; Hage, F.; Cole, J. Weather support to deicing decision making (WSDDM): A winter weather nowcasting system. Bull. Am. Meteorol. Soc. 2001, 82, 579–595. [Google Scholar] [CrossRef]
  37. Bellon, A.; Lee, G.W.; Zawadzki, I. Error statistics of VPR corrections in stratiform precipitation. J. Appl. Meteorol. 2005, 44, 998–1015. [Google Scholar] [CrossRef]
  38. Kirstetter, P.E.; Andrieu, H.; Boudevillain, B.; Delrieu, G. A physically-based identification of vertical profiles of reflectivity from volume scan radar data. J. Appl. Meteorol. Climatol. 2013, 52, 1645–1663. [Google Scholar] [CrossRef]
  39. Wen, Y.; Cao, Q.; Kirstetter, P.-E.; Hong, Y.; Gourley, J.J.; Zhang, J.; Zhang, G.; Yong, B. Incorporating NASA space-borne radar data into NOAA National Mosaic QPE system for improved precipitation measurement: A physically based VPR identification and enhancement method. J. Hydrometeorol. 2013, 14, 1293–1307. [Google Scholar] [CrossRef]
  40. Wen, Y.; Kirstetter, P.E.; Hong, Y.; Gourley, J.J.; Cao, Q.; Zhang, J.; Flamig, Z.; Xue, X. Evaluation of a method to enhance real-time, ground radar–based rainfall estimates using climatological profiles of reflectivity from space. J. Hydrometeorol. 2016, 17, 761–775. [Google Scholar] [CrossRef]
Figure 1. The locations of 788 Snowpack Telemetry (SNOTEL) stations in the western mountainous region, with terrain elevation in the background. The red dots denote SNOTEL stations located at Pacific Time Zone. The blue dots denote SNOTEL stations located at Mountain Time Zone.
Remotesensing 08 00904 g001
Figure 2. Scatterplot with colored data density of daily snowfall accumulation (SA) of the snowpack measured by snow pillows and total precipitation measured by gauges. All points were selected from days with maximum air temperature lower than 0 °C to limit the comparison to mainly snowfall. CC: correlation coefficient; MAE: mean absolute error; RMSE: root-mean-squared error.
Remotesensing 08 00904 g002
Figure 3. The histogram of probability of snowfall in snowing days (identified from SNOTEL daily maximum temperature lower than 0 °C). IMERG: Integrated Multi-satellitE Retrievals for GPM (Global Precipitation Measurement).
Remotesensing 08 00904 g003
Figure 4. The color-density scatterplots of daily SA from SNOTEL and (a) Multi-Radar/Multi-Sensor (MRMS); (b) IMERG with gauge calibration; (c) IMERG without gauge calibration; and (d) Histograms of SNOTEL, MRMS, IMERG precipitationCal and precipitationUncal daily SA.
Remotesensing 08 00904 g004
Figure 5. (a) Daily SA from SNOTEL, MRMS, and IMERG as a function of air temperature; (b) The relative bias of MRMS and IMERG daily SA·[(MRMS − SNOTEL)/SNOTEL × 100%] as a function of air temperature.
Remotesensing 08 00904 g005
Figure 6. (a) Daily SA from SNOTEL, MRMS, and IMERG as a function of daily SA measured by SNOTEL; (b) The relative bias of MRMS and IMERG daily SA·[(MRMS − SNOTEL)/SNOTEL × 100%] as a function of SA measured by SNOTEL.
Remotesensing 08 00904 g006
Figure 7. (a) Daily SA from SNOTEL, MRMS, and IMERG as a function of radar beam height above ground level; (b) The relative bias of MRMS and IMERG daily SA·[(MRMS − SNOTEL)/SNOTEL × 100%] as a function of radar beam height above ground level.
Remotesensing 08 00904 g007

