
The Use of C-/X-Band Time-Gapped SAR Data and Geotechnical Models for the Study of Shanghai’s Ocean-Reclaimed Lands through the SBAS-DInSAR Technique


Abstract
:
1. Introduction
2. Study Area
3. Data and Methods
3.1. SAR Data
3.2. The SBAS-DInSAR Technique
3.3. Vertical Deformation Time-Series Retrieval
3.4. Vertical Deformation Time-Series Combination
4. Experimental Results
4.1. SBAS-DInSAR Analysis
4.2. Combined C-/X-Band Vertical Deformation Time-Series
5. Discussion
6. Conclusions
Supplementary Materials
Acknowledgments
Author Contributions
Conflicts of Interest
References
- Hoeksema, R.J. Three stages in the history of land reclamation in the Netherlands. Irrig. Drain. 2007, 56, 113–216. [Google Scholar] [CrossRef]
- Douglas, I.; Lawson, N. Airport construction: Materials use and geomorphic change. J. Air Trans. Manag. 2003, 9, 177–185. [Google Scholar] [CrossRef]
- Zhao, Q.; Lin, H.; Gao, W.; Zebker, H.; Chen, A.; Yeung, K. InSAR detection of residual settlement of an ocean reclamation engineering project: A case study of Hong Kong International Airport. J. Oceanogr. 2011, 67, 415–426. [Google Scholar] [CrossRef]
- Ganesalingam, D.; Ameratunga, J.; Scweitzer, G.; Boyle, P.; Sivakugan, S. Anisotropy in the permeability and consolidation characteristics of dredged mud. In Proceedings of the ANZ 2012, Ground Engineering in a Changing World: 11th Australia–New Zealand Conference on Geomechanics, Melbourne, Australia, 15–18 July 2012; pp. 752–757.
- Philip, D.R.E.; McIlquham, J.D. Geotechnical design for the Port Botany expansion project. Proc. Inst. Civ. Eng. Geotech. Eng. 2011, 164, 149–167. [Google Scholar]
- Puzrin, A.M.; Alonso, E.E.; Pinyol, N.M. Unexpected Excessive Settlements: Kansai International Airport, Japan. In Geomechanics of Failures; Springer: New York, NY, USA, 2010; pp. 23–43. [Google Scholar]
- Rizzo, A. Metro Doha. Cities 2013, 31, 533–543. [Google Scholar] [CrossRef]
- Yang, H. Legal Regulation of Land Reclamation in China’s Coastal Area. Coast. Manag. 2014, 42, 9–79. [Google Scholar]
- Yin, Y.H. Thinking on large area reclamation in Caofeidian, Tangshan city, Hebei Province. Mar. Geol. Lett. 2007, 23, 1–10. [Google Scholar]
- Wang, Z.Y.; Li, Y.; He, Y. Sediment budget of the Yangtze River. Water Resour. Res. 2007, 43, 1–14. [Google Scholar] [CrossRef]
- Liu, G.X.; Luo, X.J.; Chen, Q.; Huang, J.F.; Ding, X.L. Detecting land subsidence in Shanghai by PS-networking SAR interferometry. Sensors 2008, 8, 4725–4741. [Google Scholar] [CrossRef]
- Bhattacharyaa, S.; Hyodob, M.; Godaa, K.; Tazohc, T.; Taylora, C.A. Liquefaction of soil in the Tokyo Bay area from the 2011 Tohoku (Japan) earthquake. Soil Dyn. Earthq. Eng. 2011, 31, 1618–1628. [Google Scholar] [CrossRef]
- Chien, L.K.; Oh, Y.N.; Chang, C.H. Effects of fines content on liquefaction strength and dynamic settlement of reclaimed soil. Can. Geotech. J. 2002, 39, 254–265. [Google Scholar] [CrossRef]
- Plant, G.W.; Covil, C.S.; Hughes, R.A. Geology, Surveying, Reclamation Settlement. In Site Preparation of the New Hong Kong International Airport, 1st ed.; Thomas Telford: London, UK, 1998. [Google Scholar]
- Yang, M.S.; Jiang, Y.; Liao, M.; Wang, H. The analysis of the subsidence patterns in Lingang New City (Shanghai) using high-resolution SAR images. Shanghai Land Resour. 2013, 34, 12–16. (In Chinese) [Google Scholar]
- Chen, J.; Wu, J.; Zhang, L.; Zou, J.; Liu, G.; Zhang, R.; Yu, B. Deformation Trend Extraction Based on Multi-Temporal InSAR in Shanghai. Remote Sens. 2013, 5, 1774–1786. [Google Scholar] [CrossRef]
- Perissin, D.; Wang, Z.; Lin, H. Shanghai subway tunnels and highways monitoring through Cosmo-SkyMed Persistent Scatterers. ISPRS J. Photogramm. Remote Sens. 2012, 73, 58–67. [Google Scholar] [CrossRef]
- Dong, S.; Samsonov, S.; Yin, H.; Ye, S.; Cao, Y. Time-series analysis of subsidence associated with rapid urbanization in Shanghai, China measured with SBAS InSAR method. Environ. Earth Sci. 2014, 72, 677–691. [Google Scholar] [CrossRef]
- Zhao, Q.; Pepe, A.; Gao, W.; Lu, Z.; Bonano, M.; He, M.L.; Wang, J.; Tang, X. A DInSAR Investigation of the Ground Settlement Time Evolution of Ocean-Reclaimed Lands in Shanghai. IEEE Sel. Top. Appl. Earth Obs. Remote Sens. 2015, 8, 1763–1781. [Google Scholar] [CrossRef]
- Been, K.; Sills, G.C. Self-weight consolidation of soft soils: An experimental and theoretical study. Geotechnique 1981, 31, 519–535. [Google Scholar] [CrossRef]
- Terzaghi, K.; Ralph, P.B.; Gholamreza, M. Soil Mechanics in Engineering Practice, 3rd ed.; Wiley-Interscience: Hoboken, NJ, USA, 1996; pp. 1–592. [Google Scholar]
- Bürgmann, R.; Rosen, P.A.; Fielding, E.J. Synthetic aperture radar interferometry to measure Earth’s surface topography and its deformation. Annu. Rev. Earth Planet. Sci. 2000, 28, 169–209. [Google Scholar] [CrossRef]
- Massonnet, D.; Feigl, K.L. Radar interferometry and its application to changes in the Earth’s surface. Rev. Geophys. 1998, 36, 441–500. [Google Scholar] [CrossRef]
- Massonnet, D.; Rossi, M.; Carmona, C.; Adragna, F.; Peltzer, G.; Feigl, K.; Rabaute, T. The displacement field of the Landers earthquake mapped by radar interferometry. Nature 1993, 364, 138–142. [Google Scholar] [CrossRef]
- Massonnet, D.; Briole, P.; Arnaud, A. Deflation of Mount Etna monitored by spaceborne radar interferometry. Nature 1995, 375, 567–570. [Google Scholar] [CrossRef]
- Ferretti, A.; Prati, C.; Rocca, F. Permanent scatterers in SAR interferometry. IEEE Trans. Geosci. Remote Sens. 2001, 39, 8–20. [Google Scholar] [CrossRef]
- Kampes, B.M. Radar Interferometry: Persistent Scatterer Technique; Springer: New York, NY, USA, 2006. [Google Scholar]
- Berardino, P.; Fornaro, G.; Lanari, R.; Sansosti, E. A new algorithm for surface deformation monitoring based on small baseline differential SAR interferograms. IEEE Trans. Geosci. Remote Sens. 2004, 40, 2375–2383. [Google Scholar] [CrossRef]
- Mora, O.; Mallorquí, J.J.; Broquetas, A. Linear and nonlinear terrain deformation maps from a reduced set of interferometric SAR images. IEEE Trans. Geosci. Remote Sens. 2003, 41, 2243–2253. [Google Scholar] [CrossRef]
- Usai, S. A least squares database approach for SAR interferometric data. IEEE Trans. Geosci. Remote Sens. 2003, 41, 753–760. [Google Scholar] [CrossRef]
- Hooper, A.; Bekaert, D.; Spaans, K.; Arıkan, M. Recent advances in SAR interferometry time series analysis for measuring crustal deformation. Tectonophysics 2012, 514, 1–13. [Google Scholar] [CrossRef]
- Strang, G. Linear Algebra and Its Appications; Harcourt Brace Jovanovich: Orlando, FL, USA, 1988. [Google Scholar]
- Greif, V.; Vicko, J. Monitoring of post-failure landslide deformation by the PS-InSAR technique at Lubietova in Central Slovakia. Environ. Earth Sci. 2012, 66, 1585–1595. [Google Scholar] [CrossRef]
- Guzzetti, F.; Manunta, M.; Ardizzone, F.; Pepe, A.; Cardinali, M.; Zeni, G.; Reichenbach, P.; Lanari, R. Analysis of ground deformation detected using the SBAS-DInSAR technique in Umbria, Central Italy. Pure Appl. Geophys. 2009, 166. [Google Scholar] [CrossRef]
- Bonano, M.; Manunta, M.; Pepe, A.; Paglia, L.; Lanari, R. From previous C-band to New X-band SAR systems: Assessment of the DInSAR mapping improvement for deformation time-series retrieval in urban areas. IEEE Trans. Geosci. Remote Sens. 2013, 51, 1973–1984. [Google Scholar] [CrossRef]
- Parcharidis, I.; Lagios, E.; Sakkas, V.; Raucoules, D.; Feurer, D.; le Mouelic, S.; King, C.; Carnec, C.; Novali, F.; Ferretti, A.; et al. Subsidence monitoring within the Athens Basin (Greece) using space radar interferometric techniques. Earth Planets Space 2006, 58, 505–513. [Google Scholar] [CrossRef]
- Cavalie, O.; Sladen, A.; Kelner, M. Detailed quantification of delta subsidence, compaction and interaction with man-made structures: The case of the NCA airport, France. Nat. Hazards Earth Syst. Sci. 2015, 9, 1973–1984. [Google Scholar] [CrossRef]
- Zhang, J.Z.; Hauang, H.; Bi, H. Land Subsidence in the modern Yellow River Delta based on InSAR time-series Analysis. Nat. Hazards 2015, 75, 2385–2397. [Google Scholar] [CrossRef]
- Aly, M.H.; Klein, A.G.; Zebker, H. Land Subsidence in the Nile Delta of Egypt by persistent scatterer interferometry. Remote Sens. Lett. 2012, 3, 621–630. [Google Scholar] [CrossRef]
- Yang, P.; Tang, Y.Q.; Zhou, N.Q.; Wang, J.X. Consolidation settlement of Shanghai dredger fill under self-weight using centrifuge modeling test. J. Cent. South Univ. Technol. 2008, 39, 862–866. (In Chinese) [Google Scholar]
- Taylor, R.N. Geothecnical Centrifuge Technology; Blackie Academic and Professional: Glasgow, UK, 1995. [Google Scholar]
- Cui, Z.D.; Tang, Y.Q. Land subsidence and pore structure of soils caused by the high-rise building group through centrifuge model test. Eng. Geol. 2010, 113, 44–52. [Google Scholar] [CrossRef]
- Xu, Y.S.; Ma, L.; Du, Y.J.; Shen, S.L. Analysis of urbanization-induced land subsidence in Shanghai. Nat. Hazards 2012, 63, 1255–1267. [Google Scholar] [CrossRef]
- Shanghai Municipal Bureau of Planning and Land Resources. Shanghai Geological Environmental Bulletin (2001–2009); Shanghai Municipal Bureau of Planning and Land Resources: Shanghai, China, 2009. (In Chinese) [Google Scholar]
- Yang, S.L.; Milliman, J.D.; Li, P.; Xu, K. 50,000 dams later: Erosion of the Yangtze River and its delta. Glob. Planet. Chang. 2011, 75, 14–20. [Google Scholar] [CrossRef]
- Tang, Y.; Zhou, J.; He, X.; Yang, P.; Wang, J. Theoretical and experimental study of consolidation settlement characteristics of hydraulic fill soil in Shanghai. Environ. Earth Sci. 2012, 67, 1397–1405. [Google Scholar] [CrossRef]
- Shen, S.L. Geological environmental character of Lin Gang New City and its influences to the construction. Shanghai Geol. 2008, 105, 24–28. (In Chinese) [Google Scholar]
- Shi, Y.; Yan, X.; Zhou, N. Land subsidence induced by recent alluvia deposits in Yangtze River delta area, a case study of Shanghai Lingang New City. J. Eng. Geol. 2007, 15, 391–402. (In Chinese) [Google Scholar]
- Desnos, Y.L.; Laur, H.; Lim, P.; Meisl, P.; Gach, T. The Envisat-1 advanced synthetic aperture radar processor and data products. In Proceedings of the IEEE 1999 International Geoscience and Remote Sensing Symposium, Hamburg, Germany, 28 June–2 July 1999; pp. 1683–1685.
- Covello, F.; Battazza, F.; Coletta, A.; Lopinto, E.; Fiorentino, C.; Pietranera, L.; Valentini, G.; Zoffoli, S. COSMO-SkyMed an existing opportunity for observing the Earth. J. Geodyn. 2010, 49, 171–180. [Google Scholar] [CrossRef]
- Zebker, H.A.; Villasenor, J. Decorrelation in interferometric radar echoes. IEEE Trans. Geosci. Remote Sens. 1992, 30, 950–959. [Google Scholar] [CrossRef]
- Pepe, A.; Lanari, R. On the extension of the minimum cost flow algorithm for phase unwrapping of multitemporal differential SAR interferograms. IEEE Trans. Geosci. Remote Sens. 2006, 44, 2374–2383. [Google Scholar] [CrossRef]
- Lanari, R.; Casu, F.; Manzo, M.; Zeni, G.; Berardino, P.; Manunta, M.; Pepe, A. An overview of the small BAseline subset algorithm: A DInSAR technique for surface deformation analysis. Pure Appl. Geophys. 2007, 164, 637–661. [Google Scholar] [CrossRef]
- Manzo, M.; Fialko, Y.; Casu, F.; Pepe, A.; Lanari, R. A quantitative assessment of DInSAR measurements of interseismic deformation: The Southern San Andreas fault case study. Pure Appl. Geophys. 2012, 169, 1463–1482. [Google Scholar] [CrossRef]
- Fialko, Y.; Simons, M.; Agnew, D. The complete (3-D) surface displacement field in the epicentral area of the 1999 M(w)7.1 Hector Mine earthquake, California, from space geodetic observations. Geophys. Res. Lett. 2001, 28, 3063–3066. [Google Scholar] [CrossRef]
- Wright, T.J.; Parsons, B.E.; Lu, Z. Toward mapping surface deformation in three dimensions using InSAR. Geophys. Res. Lett. 2004, 31, L01607. [Google Scholar] [CrossRef]
- Gray, L. Using multiple RADARSAT InSAR pairs to estimate a full three-dimensional solution for glacial ice movement. Geophys. Res. Lett. 2011, 38, L05502-1–L05502-6. [Google Scholar] [CrossRef]
- Sansosti, E.; Berardino, P.; Manunta, M.; Serafino, F.; Fornaro, G. Geometrical SAR image registration. IEEE Trans. Geosci. Remote Sens. 2006, 44, 2861–2870. [Google Scholar] [CrossRef]
- Rosen, P.A.; Hensley, S.; Gurrola, E.; Rogez, F.; Chan, S.; Martin, J. SRTM C-band topographic data quality assessment and calibration activities. In Proceedings of the IEEE 2001 International Geoscience and Remote Sensing Symposium, Sydney, Australia, 9–13 July 2001; pp. 739–741.
- Rosen, P.A.; Hensley, S.; Joughin, I.R.; Li, F.K.; Madsen, S.N.; Rodriguez, E.; Goldstein, R.M. Synthetic aperture radar interferometry. IEEE Trans. Geosci. Remote Sens. 2000, 48, 333–382. [Google Scholar] [CrossRef]
- Goldstein, R.M.; Werner, C.L. Radar interferogram filtering for geophysical applications. Geophys. Res. Lett. 1998, 25, 4035–4038. [Google Scholar] [CrossRef]
- Yang, Y.; Pepe, A.; Manzo, M.; Bonano, M.; Liang, D.N.; Lanari, R. A simple Solution to Mitigate Noise Effects in Time-Redundant Sequences of Small Baseline Multi-look DInSAR Interferograms. Remote Sens. Lett. 2013, 4, 609–618. [Google Scholar]
- Wang, T.; Liao, M.; Perissin, D. InSAR coherence-decomposition analysis. IEEE Geosci. Remote Sens. Lett. 2010, 7, 156–160. [Google Scholar] [CrossRef]
- Navarro-Sanchez, V.D.; Lopez-Sanchez, J.M.; Vicente-Guijalba, F. A contribution of polarimetry to satellite differential SAR interferometry: Increasing the number of pixel candidates. IEEE Geosci. Remote Sens. Lett. 2010, 7, 276–280. [Google Scholar] [CrossRef]
- Levenberg, K. A Method for the Solution of Certain Non-Linear Problems in Least Squares. Q. Appl. Math. 1994, 2, 164–168. [Google Scholar]
- Marquardt, D. An Algorithm for Least-Squares Estimation of Nonlinear Parameters. SIAM J. Appl. Math. 1963, 11, 431–441. [Google Scholar] [CrossRef]
- Markwardt, C.B. Non-linear Least Squares Fitting in IDL with MPFIT. In Proceedings of the 17th Annual Conference on Astronomical Data Analysis Software and Systems (ADASS XVII), London, UK, 23–26 September 2007.
- Cai, J.; Wang, J.; Wu, J.; Hu, C.; Grafarend, E.; Chen, J. Horizontal deformation rate analysis based on multiepoch GPS measurements in Shanghai. J. Surv. Eng. 2008, 134, 132–137. [Google Scholar] [CrossRef]
- Dai, K.; Liu, G.; Li, Z.; Li, T.; Yu, B.; Wang, X.; Singleton, A. Extracting Vertical Displacement Rates in Shanghai (China) with Multi-Platform SAR Images. Remote Sens. 2015, 7, 9542–9562. [Google Scholar] [CrossRef]
- Shirzaei, M. A seamless multitrack multitemporal InSAR algorithm. Geochem. Geophys. Geosyst. 2015, 16, 1656–1669. [Google Scholar] [CrossRef]
- Hu, J.; Ding, X.; Li, Z.; Zhu, J.; Sun, Q.; Zhang, L. Kalman-Filter-Based Approach for Multisensor, Multitrack, and Multitemporal InSAR. IEEE Trans. Geosci. Remote Sens. 2013, 51, 4226–4239. [Google Scholar] [CrossRef]
- Manzo, M.; Ricciardi, G.P.; Casu, F.; Ventura, G.; Zeni, G.; Borgstrom, S.; Berardino, P.; del Gaudio, C.; Lanari, R. Surface deformation analysis in the Ischia Island (Italy) based on spaceborne radar interferometry. J. Volcanol. Geotherm. Res. 2006, 151, 399–416. [Google Scholar] [CrossRef]
- Gourmelen, N.; Amelung, F.; Casu, F.; Manzo, M.; Lanari, R. Mining-related ground deformation in Crescent Valley, Nevada: Implications for sparse GPS networks. Geophys. Res. Lett. 2007, 34, L09309. [Google Scholar] [CrossRef]
- Samsonov, S.; d’Oreye, N. Multidimensional time-series analysis of ground deformation from multiple InSAR data sets applied to Virunga Volcanic Province. Geophys. J. Int. 2012, 191, 1095–1108. [Google Scholar]
- Pepe, A.; Solaro, G.; Calò, F.; Dema, C. A Minimum-Acceleration Approach for the Retrieval of Multi-Platform InSAR Deformation Time-Series. IEEE J. Sel. Top. Appl. Earth Obs. Remote Sens. 2016, in press. [Google Scholar] [CrossRef]
- Torres, R.; Snoeij, P.; Geudtner, D.; Bibby, D.; Davidson, M.; Attema, E.; Potin, P.; Rommen, B.; Floury, N.; Brown, M.; et al. GMES Sentinel-1 mission. Remote Sens. Environ. 2012, 120, 9–24. [Google Scholar] [CrossRef]


| Sensor | WS (mm) | ES (mm) |
|---|---|---|
| ENVISAT | 5.8 | 8.0 |
| CSK | 3.4 | 5.7 |
| ENVISAT/CSK | 4.8 | 7.2 |
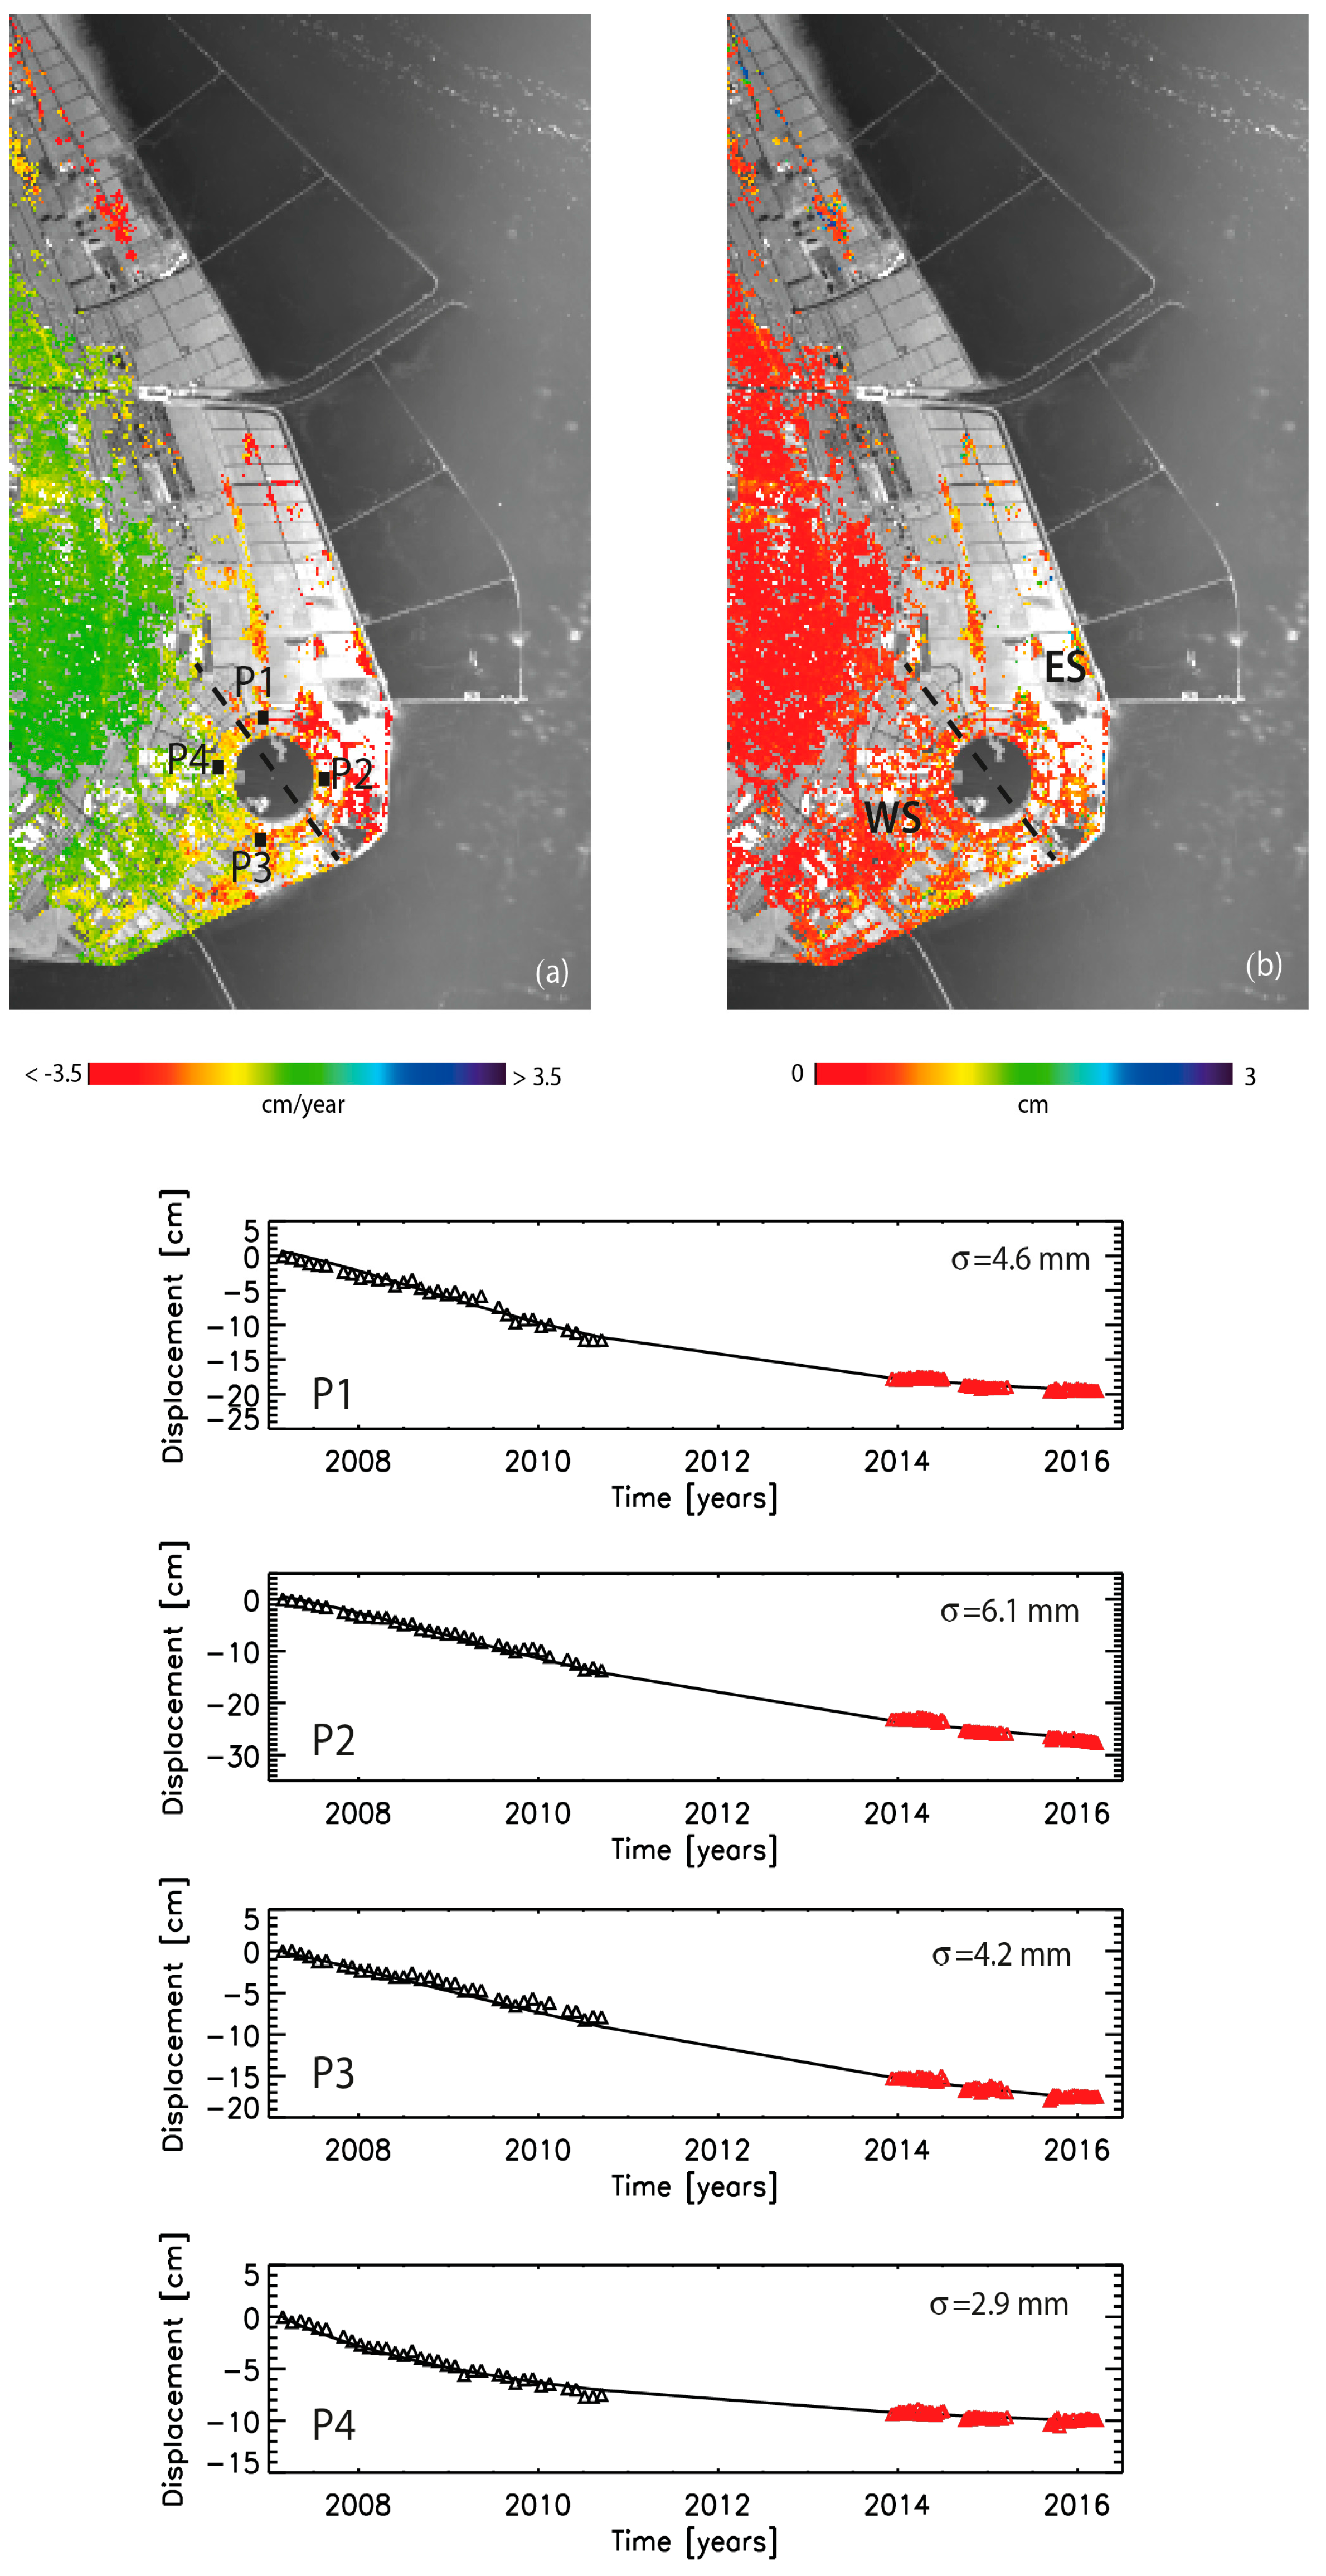
| Point | S (cm) | k | λ | δ |
|---|---|---|---|---|
| P1 | –19.7 | 11.9 | 0.7 | –5 |
| P2 | –41.2 | 26.6 | 0.7 | –3 |
| P3 | –27.6 | 16.2 | 0.7 | –1 |
| P4 | –11.4 | 8.6 | 0.5 | –4 |
| Period | Measured (mm/Year) | Modeled (mm/Year) | ||
|---|---|---|---|---|
| WS | ES | WS | ES | |
| 2007–2010 | –16.9 | –35.0 | –16.6 | –35.2 |
| 2014–2016 | –3.9 | –16.9 | –3.4 | –13.4 |
| Sensor | WS | ES |
|---|---|---|
| ENVISAT vs. ENVISAT/CSK | 3.9 mm | 6.4 mm |
© 2016 by the authors; licensee MDPI, Basel, Switzerland. This article is an open access article distributed under the terms and conditions of the Creative Commons Attribution (CC-BY) license (http://creativecommons.org/licenses/by/4.0/).
Share and Cite
Pepe, A.; Bonano, M.; Zhao, Q.; Yang, T.; Wang, H. The Use of C-/X-Band Time-Gapped SAR Data and Geotechnical Models for the Study of Shanghai’s Ocean-Reclaimed Lands through the SBAS-DInSAR Technique. Remote Sens. 2016, 8, 911. https://doi.org/10.3390/rs8110911
Pepe A, Bonano M, Zhao Q, Yang T, Wang H. The Use of C-/X-Band Time-Gapped SAR Data and Geotechnical Models for the Study of Shanghai’s Ocean-Reclaimed Lands through the SBAS-DInSAR Technique. Remote Sensing. 2016; 8(11):911. https://doi.org/10.3390/rs8110911
Chicago/Turabian StylePepe, Antonio, Manuela Bonano, Qing Zhao, Tianliang Yang, and Hanmei Wang. 2016. "The Use of C-/X-Band Time-Gapped SAR Data and Geotechnical Models for the Study of Shanghai’s Ocean-Reclaimed Lands through the SBAS-DInSAR Technique" Remote Sensing 8, no. 11: 911. https://doi.org/10.3390/rs8110911
APA StylePepe, A., Bonano, M., Zhao, Q., Yang, T., & Wang, H. (2016). The Use of C-/X-Band Time-Gapped SAR Data and Geotechnical Models for the Study of Shanghai’s Ocean-Reclaimed Lands through the SBAS-DInSAR Technique. Remote Sensing, 8(11), 911. https://doi.org/10.3390/rs8110911