Article

Exploiting TERRA-AQUA MODIS Relationship in the Reflective Solar Bands for Aerosol Retrieval

1
Nanjing Institute of Geography and Limnology, Chinese Academy of Sciences, Nanjing 210008, China
2
Key Laboratory of Watershed Geographic Sciences, Chinese Academy of Sciences, Nanjing 210008, China
*
Author to whom correspondence should be addressed.
Remote Sens. 2016, 8(12), 996; https://doi.org/10.3390/rs8120996
Submission received: 29 August 2016 / Revised: 15 November 2016 / Accepted: 28 November 2016 / Published: 3 December 2016
(This article belongs to the Special Issue Multi-Sensor and Multi-Data Integration in Remote Sensing)

Abstract

:
Satellite remote sensing has been providing aerosol data with ever-increasing accuracy, representative of the MODerate-resolution Imaging Spectroradiometer (MODIS) Dark Target (DT) and Deep Blue (DB) aerosol retrievals. These retrievals are generally performed over spectrally dark objects and therefore may struggle over bright surfaces. This study proposed an analytical TERRA-AQUA MODIS relationship in the reflective solar bands for aerosol retrieval. For the relationship development, the bidirectional reflectance distribution function (BRDF) effects were adjusted using reflectance ratios in the MODIS 2.13 μm band and the path radiance was approximated as an analytical function of aerosol optical thickness (AOT) and scattering phase function. Comparisons with MODIS observation data, MODIS AOT data, and sun photometer measurements demonstrate the validity of the proposed relationship for aerosol retrieval. The synergetic TERRA-AQUA MODIS retrievals are highly correlated with the ground measured AOT at TERRA MODIS overpass time (R2 = 0.617; RMSE = 0.043) and AQUA overpass time (R2 = 0.737; RMSE = 0.036). Compared to our retrievals, both the MODIS DT and DB retrievals are subject to severe underestimation. Sensitivity analyses reveal that the proposed method may perform better over non-vegetated than vegetated surfaces, which can offer a complement to MODIS operational algorithms. In an analytical form, the proposed method also has advantages in computational efficiency, and therefore can be employed for fine-scale (relative to operational 10 km MODIS product) MODIS aerosol retrieval. Overall, this study provides insight into aerosol retrievals and other applications regarding TERRA-AQUA MODIS data.

1. Introduction

Aerosol is a major atmospheric variable that can affect the transfer of radiative energy and the formation of precipitation. The characterization of aerosol is highly needed for the study of energy and water balance. Remote sensing technique provides a useful tool to obtain spatial distribution and track temporal variation of aerosol optical thickness (AOT) and other optical properties. On a global scale, inversion of long-term remotely sensed data has generated multi-decadal aerosol climatology [1,2]. Recently, the Intergovernmental Panel on Climate Change Fifth Assessment Report indicates that aerosol may play more crucial roles in short-term climate projections than greenhouse gases, particularly on regional scales and for hydrological cycle variables [3]. Therefore, more and more efforts are being directed toward accuracy assessment of global aerosol data [4] and quantitative retrieval of regional aerosol data [5,6].
Satellite remote sensing of aerosol in the reflective solar bands is generally based on radiative transfer theory. Under the assumption of Lambertian surface, the TOA signal recorded by satellite sensors can be written as [7]:
ρ T O A ( τ a , ω 0 , μ , μ 0 , ϕ ) = ρ a ( τ a , ω 0 , μ , μ 0 , ϕ ) + ρ T g T ( τ a , ω 0 , μ 0 ) T ( τ a , ω 0 , μ ) 1 ρ S ( τ a , μ 0 ) ,
where ρTOA is top-of-atmosphere (TOA) reflectance, ρa is atmospheric path radiance in reflectance units, ρ is surface reflectance, Tg is transmittance due to atmospheric absorption, T is transmittance due to atmospheric scattering, S is spherical albedo, τa is aerosol optical thickness (hereinafter refers to AOT at 550 nm), ω0 is single scattering albedo, μ is the cosine of view zenith angle (VZA), μ0 is the cosine of solar zenith angle (SZA), and φ is relative azimuth angle (RAA) between the sun-target direction and the target-sensor direction.
The path radiance and the transmittance caused by atmospheric scattering are highly dependent on AOT, which forms the theoretical basis for remote sensing of aerosol in the reflective solar bands [8]. Based on Equation (1), retrieval methods have been evolving over the past decades. In the beginning, the single-channel method retrieved aerosol data over dark surfaces by assuming a linear dependence between path radiance and AOT [9]. Recently, numerical iteration has been used to solve Equation (1) for AOT. For instance, Li et al. [10] retrieved AOT data from historical Advanced Very High Resolution Radiometer (AVHRR) images with a stated uncertainty of ±0.05 ± 0.20τ (R = 0.88 and RMSE = 0.07; R denotes correlation coefficient and RMSE denotes root mean square error). For the single-channel method, other aerosol properties (usually aerosol model) should be specified prior to aerosol retrieval. The main optical properties of aerosol include the single scattering albedo (SSA) and the asymmetry parameter (g), and they are generally categorized to several aerosol types [11,12]. The multi-channel method, however, enables simultaneous retrieval of AOT and other aerosol optical properties. The MODerate-resolution Imaging Spectroradiometer (MODIS) Dark Target (DT) and Deep Blue (DB) algorithms belong to this method. The DT algorithm assumes the surface reflectances of dark targets (e.g., dense dark vegetation) in the visible bands (0.47 μm and 0.66 μm) as proportional to those in the shortwave bands (2.1 μm and 3.8 μm) [13]. Compared to Aerosol Robotic Network (AERONET) data, the retrieved AOT data have an overall uncertainty of ±0.05 ± 0.15τ [14]. Oo et al. [15] further revised the reflectance ratios and derived more accurate aerosol data over urban areas. The DB algorithm improves aerosol retrieval over bright surfaces where the surface reflectances are much darker in the blue bands (419 nm and 490 nm) than in the red and near-infrared bands [16,17]. The expected error of the retrieved AOT data is estimated to be better than ±0.05 ± 0.20τ [17]. Because these multi-channel satellite data are not sufficiently sensitive to SSA, the expected aerosol model should be assigned a priori to aerosol retrieval [12].
The operational MODIS DT and DB algorithms have generated global aerosol data since 1998, and the quality of aerosol data is ever-improving. The MODIS Collection 005 (C005) DT retrievals are reported to overestimate AOT over the bright surfaces while underestimating AOT over the extremely dark surfaces [18]. A recent validation study reports that the Collection 006 (C006) retrievals outperform the C005 retrievals, especially for the DB algorithm [19]. With regard to C006 retrievals, the performances of DB and DT algorithms are regionally dependent [20]. The DT retrievals are generally higher than the DB retrievals over the eastern China and the DB retrievals exhibit obvious underestimates in southern China [21]. Even for these operational MODIS products, the accuracy needs improvement, especially over the vast eastern and southern China. Meanwhile, the MODIS operational retrievals have a spatial resolution of ~0.1° × 0.1° (10 × 10 km) that is inadequate for monitoring and understanding the behavior of atmospheric aerosols at local scales. Therefore, several new MODIS algorithms have been developed in an effort to derive finer-scale aerosol data. Li et al. [22] modified the MODIS DT algorithm and derived 1 × 1 km aerosol retrievals with overall uncertainty of 0.10~0.20τ. Wong et al. [5] employed the seasonally dependent minimum reflectance technique to obtain 500m AOT retrievals. These retrievals are well correlated with ground aerosol measurements (R2 > 0.76, R2 denotes coefficient of determination). Wang et al. [23] applied prior knowledge for aerosol retrieval and retrieved 500 m AOT data with an overall uncertainty of ±0.10 ± 0.20τ. Bilal et al. [6] proposed a Simplified high resolution MODIS Aerosol Retrieval Algorithm (SARA). The algorithm directly solved radiative transfer codes for aerosol, supported by AERONET aerosol properties and daily MODIS surface reflectance data [24]. The retrievals were in good agreement with ground measurements (R = 0.964 and RMSE = 0.077).
Remote sensing of aerosol using a single-view direction (including single-channel and multi-channel methods), as a common practice for a vast array of satellite sensors has limited information content, even when a large number of spectral bands are available [8,25]. Therefore, it is natural to imagine that data from multi-view sensors, such as MISR (Multi-angle Imaging SpectroRadiometer), POLDER (POLarization and Directionality of the Earth's Reflectances) and Compact High Resolution Imaging Spectrometer (CHRIS), would generate more accurate aerosol products [26,27,28,29,30]. Due to large data volume, the retrieval algorithms generally rely on lookup tables of atmospheric radiative parameters and predetermined aerosol models to carry out radiative transfer calculations [31]. Meanwhile, the analytical methods have also been applied to aerosol retrieval, especially for two-view sensors [32,33]. Nevertheless, there are currently only a few sensors that have the ability to conduct multi-angle imaging. For this reason, synergistic use of spectrally similar sensors, for instance, TERRA and AQUA MODIS sensors, offers new opportunity to retrieve aerosol distribution and properties. For instance, Tang et al. [34] proposed an analytical SYNergy of TERRA and AQUA MODIS (SYNTAM) algorithm. The retrieved AOT data were demonstrated as being in good agreement with AERONET measurements. Assuming relatively stable aerosol conditions during sensor overpasses, the daily TERRA and AQUA MODIS data are fictitious two-view measurements. As other multi-angle sensor data, the TERRA-AQUA MODIS data may minimize the sensitivity of aerosol retrievals to the brightness of underlying surfaces [27], which may provide a supplement to the MODIS operational DT and DB algorithms.
Assuming invariant AOT, Equation (1) applies to both TERRA and AQUA MODIS sensors. If other atmospheric parameters are known, the unknown parameters are AOT and the bidirectional surface reflectances. First, the relationships between path radiance/atmospheric scattering transmittance and AOT should be determined. The radiative codes are generally used to specify the relationship in the form of look-up tables and numerical iterations [31,32]. For operational use, the relationships are also quantified using analytical functions. The atmospheric scattering transmittance can be accurately modeled as a rational polynomial of AOT [35]. However, it is more difficult to model atmospheric path radiance in a similar fashion. When confined to a given observational geometry, path radiance can be modeled as a logarithmic function [36] or a linear function [37] of AOT. In our recent studies, we demonstrated that linear function also applied when the SZA and VZA were relaxed (SZA = 0–60° and VZA = 0–10°) [38,39]. Despite all this, modeling path radiance is still non-trivial for arbitrary observational geometries [40]. Second, treating bidirectional reflectance distribution function (BRDF) effects is important to separate the atmospheric contribution from the surface contribution. Generally, the treatment includes band ratioing technique and BRDF modeling. To deal with this effect, Martonchik et al. [31] specified the shape of surface reflectances, and allowed the absolute reflectance in the blue and red bands to vary as free parameters. Veefkind et al. [32] assumed that surface reflectances in the visible bands were proportional to that in the mid-infrared (1.6 μm) band. Based on these studies, Tang et al. [34] exploited daily TERRA and AQUA MODIS images and used reflectance ratio in the MODIS 2.13 μm band to characterize BRDF effects in the visible bands. For polarized sensor data, Deuzé et al. [41] employed Bidirectional Polarization Distribution Function (BPDF) models to quantify the surface contribution. Although the predefined BRDF models can provide relatively accurate boundary conditions for aerosol retrieval, the band ratioing technique is more simple and practical.
The primary objective of this study is to retrieve fine-scale (relative to operational 10 km MODIS product) AOT data from daily collocated TERRA and AQUA MODIS sensor data with a computationally efficient method, in an effort to complement operational MODIS retrievals. Initially, an analytical relationship between TERRA and AQUA MODIS images in the reflective solar bands was developed. The relationships between path radiance/atmospheric scattering transmittance and AOT were specified and the BRDF effects were quantified using the band ratioing technique in the MODIS 2.13 μm band. The TERRA-AQUA relationship was then solved for AOT, and the retrievals were validated using MODIS aerosol retrievals and sun photometer measurements. Finally, the angular parameters, surface conditions, and BRDF effects were investigated for their respective effects on aerosol retrieval. The current study provides insight into remote sensing of aerosol and also has implications for other applications regarding the synergetic use of TERRA and AQUA data.

2. Methodology

2.1. Atmospheric Absorption and Scattering

In the reflective solar bands, the major atmospheric absorbents are ozone and water vapor. The transmittances due to their absorptions can be approximated as follows [42]:
T g ( O 3 ) = exp ( a × T O C / μ s ( v ) ) ,
T g ( H 2 O ) = exp ( exp ( b + c × ln ( T P W / μ s ( v ) ) + d × ln 2 ( T P W / μ s ( v ) ) ) ) ,
where TOC denotes total ozone concentration in cm·atm−1, TPW denotes total precipitable water vapor in g·cm−2, θs, and θv are SZA and VZA, μs and μv are the cosine of θs and θv, and a, b, c, d are sensor dependent coefficients that can be determined using radiative transfer calculations.
Rahman and Dedieu [35] approximated atmospheric scattering transmittance as a function of AOT and the observational geometries:
T ( θ s ( v ) ) = a 0 + a 1 τ a / μ s ( v ) + a 2 / ( 1 + μ s ( v ) ) ,
where T is atmospheric scattering transmittance, τa is AOT at 550 nm, and a0, a1, a2 are sensor dependent coefficients that can be determined using radiative transfer calculations.

2.2. Analytical Representation of Path Radiance

In the case of low aerosol loadings, Rayleigh and aerosol scattering reflectances can be expressed as [40]:
ρ a s [ r s ] ( λ , θ s , θ v , Δ φ ) = τ a [ r ] ( λ ) ω a [ r ] ( λ ) p a [ r ] ( λ , θ s , θ v , Δ φ ) / 4 μ s μ v ,
where
p a [ r ] ( λ , θ s , θ v , Δ φ ) = P a [ r ] ( λ , γ ) + [ ρ F ( θ s ) + ρ F ( θ v ) ] P a [ r ] ( λ , γ + ) ,
where the definitions of symbols are shown in Table 1.
Although developed for low AOT/Rayleigh optical thickness and over water surface, Equation (5) is used here for aerosol retrieval over land surface and its viability will be validated in the following. In Equation (5), path radiance depends on AOT/Rayleigh optical thickness, scattering phase functions, SZA, and VZA. The phase function in Equation (5) is generally difficult to solve [43]. Among numerous analytical approximations, Draine [44] proposed the one with two parameters:
P D ( θ ) = 1 4 π 1 g 2 ( 1 + g 2 2 g cos θ ) 3 / 2 1 + α cos 2 θ 1 + α ( 1 + 2 g 2 ) / 3 .
This function considers both aerosol scattering and Rayleigh scattering. With Equations (5)–(7), path radiance can be approximated. Initially, the first term in the right-hand side of Equation (6) is substituted by Equation (7). Because we primarily focus on the scattering angle in the backward directions (γ-), the second term in the right-hand side of Equation (6) is considered negligible. Then the phase function term in Equation (5) is substituted by Equation (6). Finally, Equation (5) is reformed as
ρ p a t h = A × τ a μ s μ v [ 1 4 π 1 g 2 ( 1 + g 2 2 g cos γ ) 3 / 2 1 + α cos 2 γ 1 + α ( 1 + 2 g 2 ) / 3 ] + B ,
where cos γ = cos ( θ s ) cos ( θ v ) sin ( θ s ) sin ( θ v ) cos ( Δ φ ) , and A, B are the regression coefficients to be determined. The coefficients are used to compensate for factors that are unconsidered.

2.3. Treatment of BRDF Effect

Flowerdew and Haigh [45] approximated surface reflectance as a part describing the variation with wavelength and a part describing the variation with observational geometry. Vermote et al. [46] also assumed that the shape of the BRDF model varied much more slowly than the reflectance magnitude. Therefore, for two observational geometries, the reflectance ratio in band 1 can be approximated as that in band 2:
f B R D F = ρ ( λ 1 , θ s , θ v , Δ φ ) ρ ( λ 1 , θ s , θ v , Δ φ ) = ρ ( λ 2 , θ s , θ v , Δ φ ) ρ ( λ 2 , θ s , θ v , Δ φ ) ,
where fBRDF denotes BRDF adjustment factor, λ1 and λ2 denote two spectral bands, and the superscript denotes the difference in observational geometry.

2.4. TERRA-AQUA MODIS Relationship and AOT Retrieval

We have previously derived a relationship between nadir-looking MODIS and AVHRR images in the reflective solar bands [38]. In that relationship, inter-sensor spectral band difference is adjusted using the spectral band adjustment factor (fSBAF). Similarly, a MODIS-MODIS relationship can be derived by substituting fSBAF for the BRDF adjustment factor (fBRDF). Thus, the final form is
ρ T O A , 2 = f B R D F | T g T ( θ s ) T ( θ v ) | 2 | T g T ( θ s ) T ( θ v ) | 2 ρ T O A , 1 + T g 2 ( ρ p a t h , 2 f B R D F | T ( θ s ) T ( θ v ) | 2 | T ( θ s ) T ( θ v ) | 1 ρ p a t h , 1 ) ,
where subscripts 1 and 2 denote the reference (AQUA) and subject (TERRA) sensors. Definitions of other variables in Equations (7)–(10) can be found in Table 1.
Using Equation (7), AOT can be retrieved when the following conditions are satisfied.
(1)
Daily cloud-free TERRA and AQUA MODIS observations (ρTOA) are available;
(2)
Ozone and water vapor data are available to calculate Tg;
(3)
The BRDF effects are accounted for by fBRDF;
(4)
The relation between atmospheric scattering transmittance (T) and AOT is specified;
(5)
The relation between path radiance (ρpath) and AOT is specified.

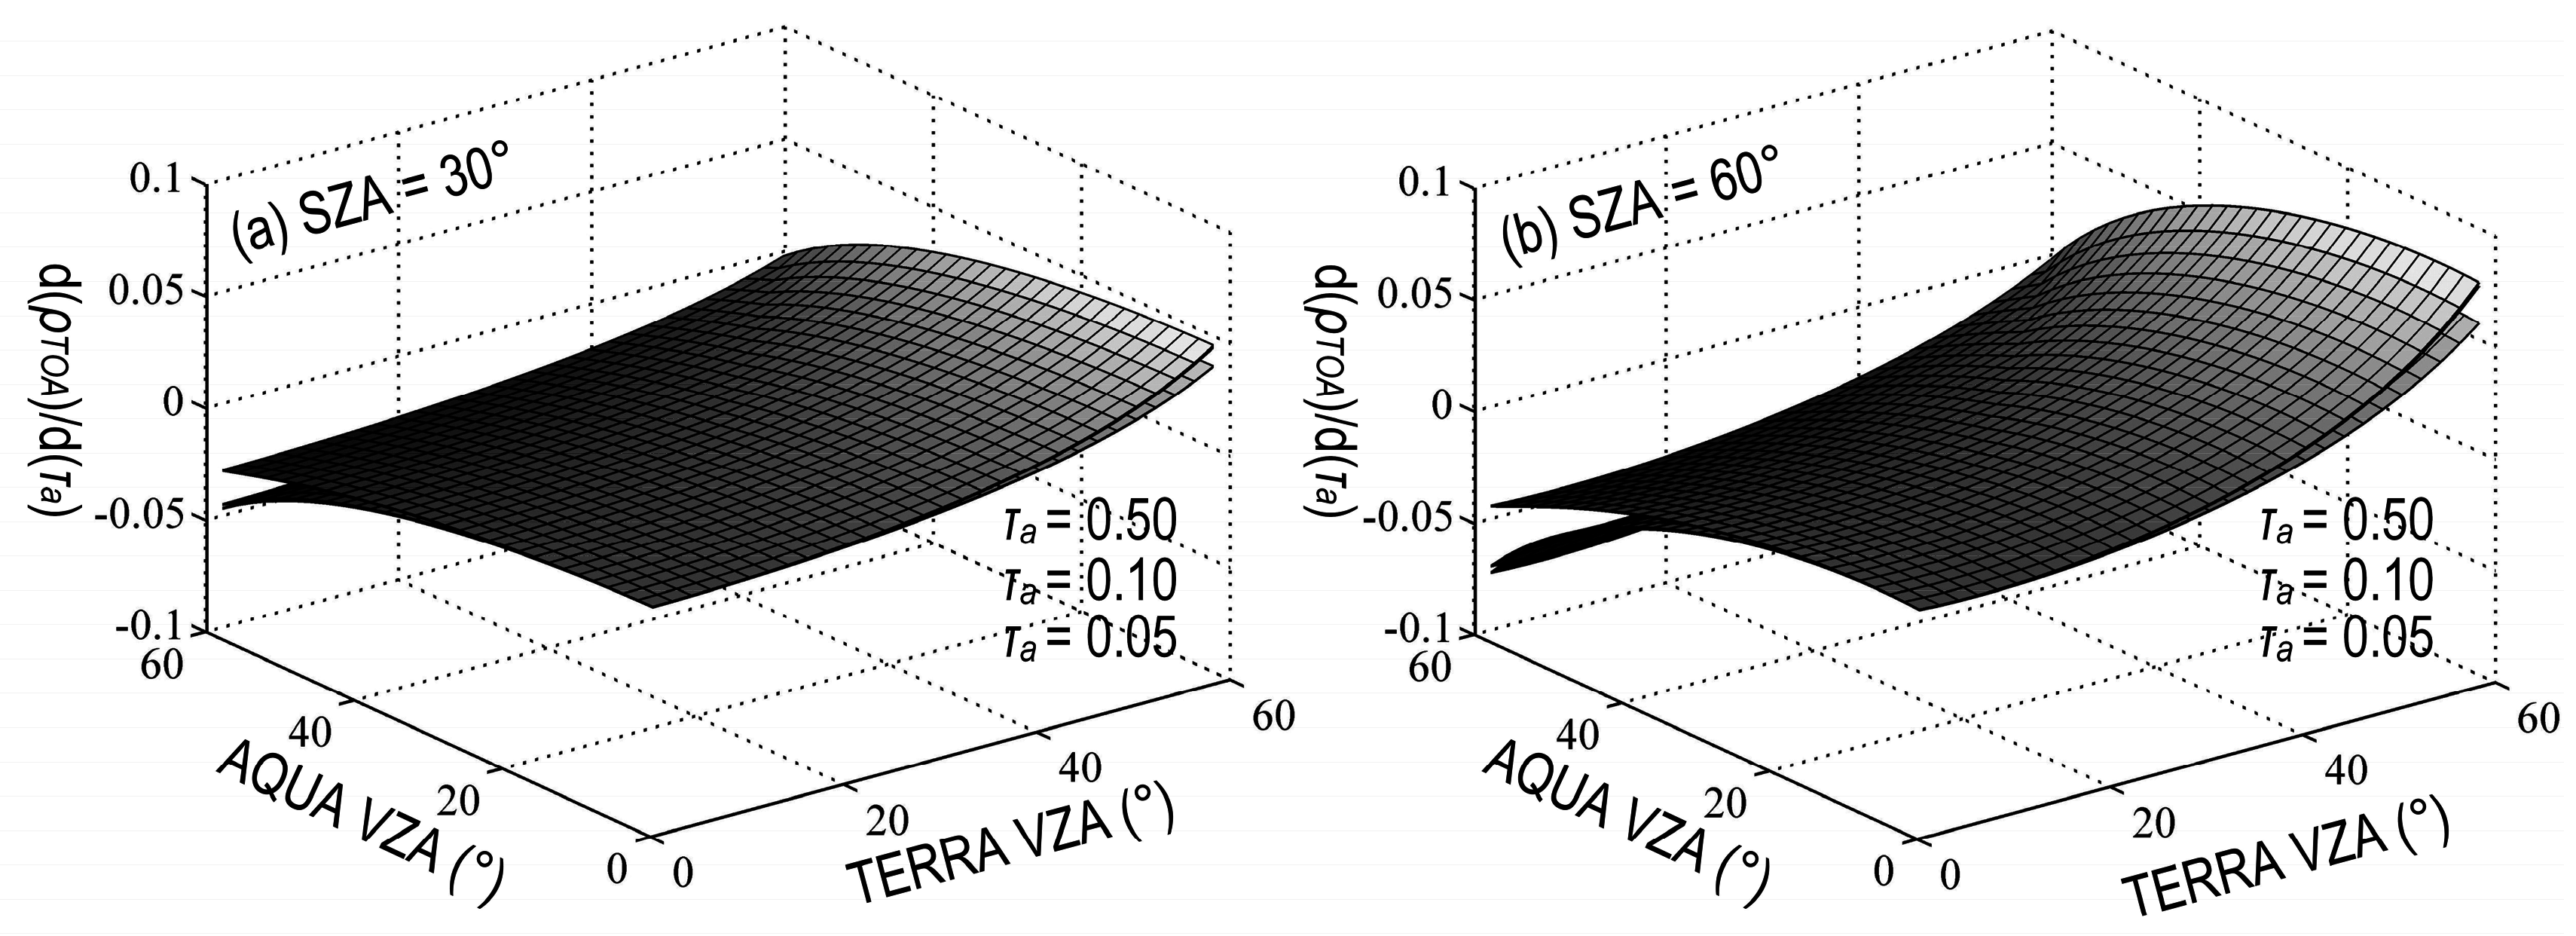
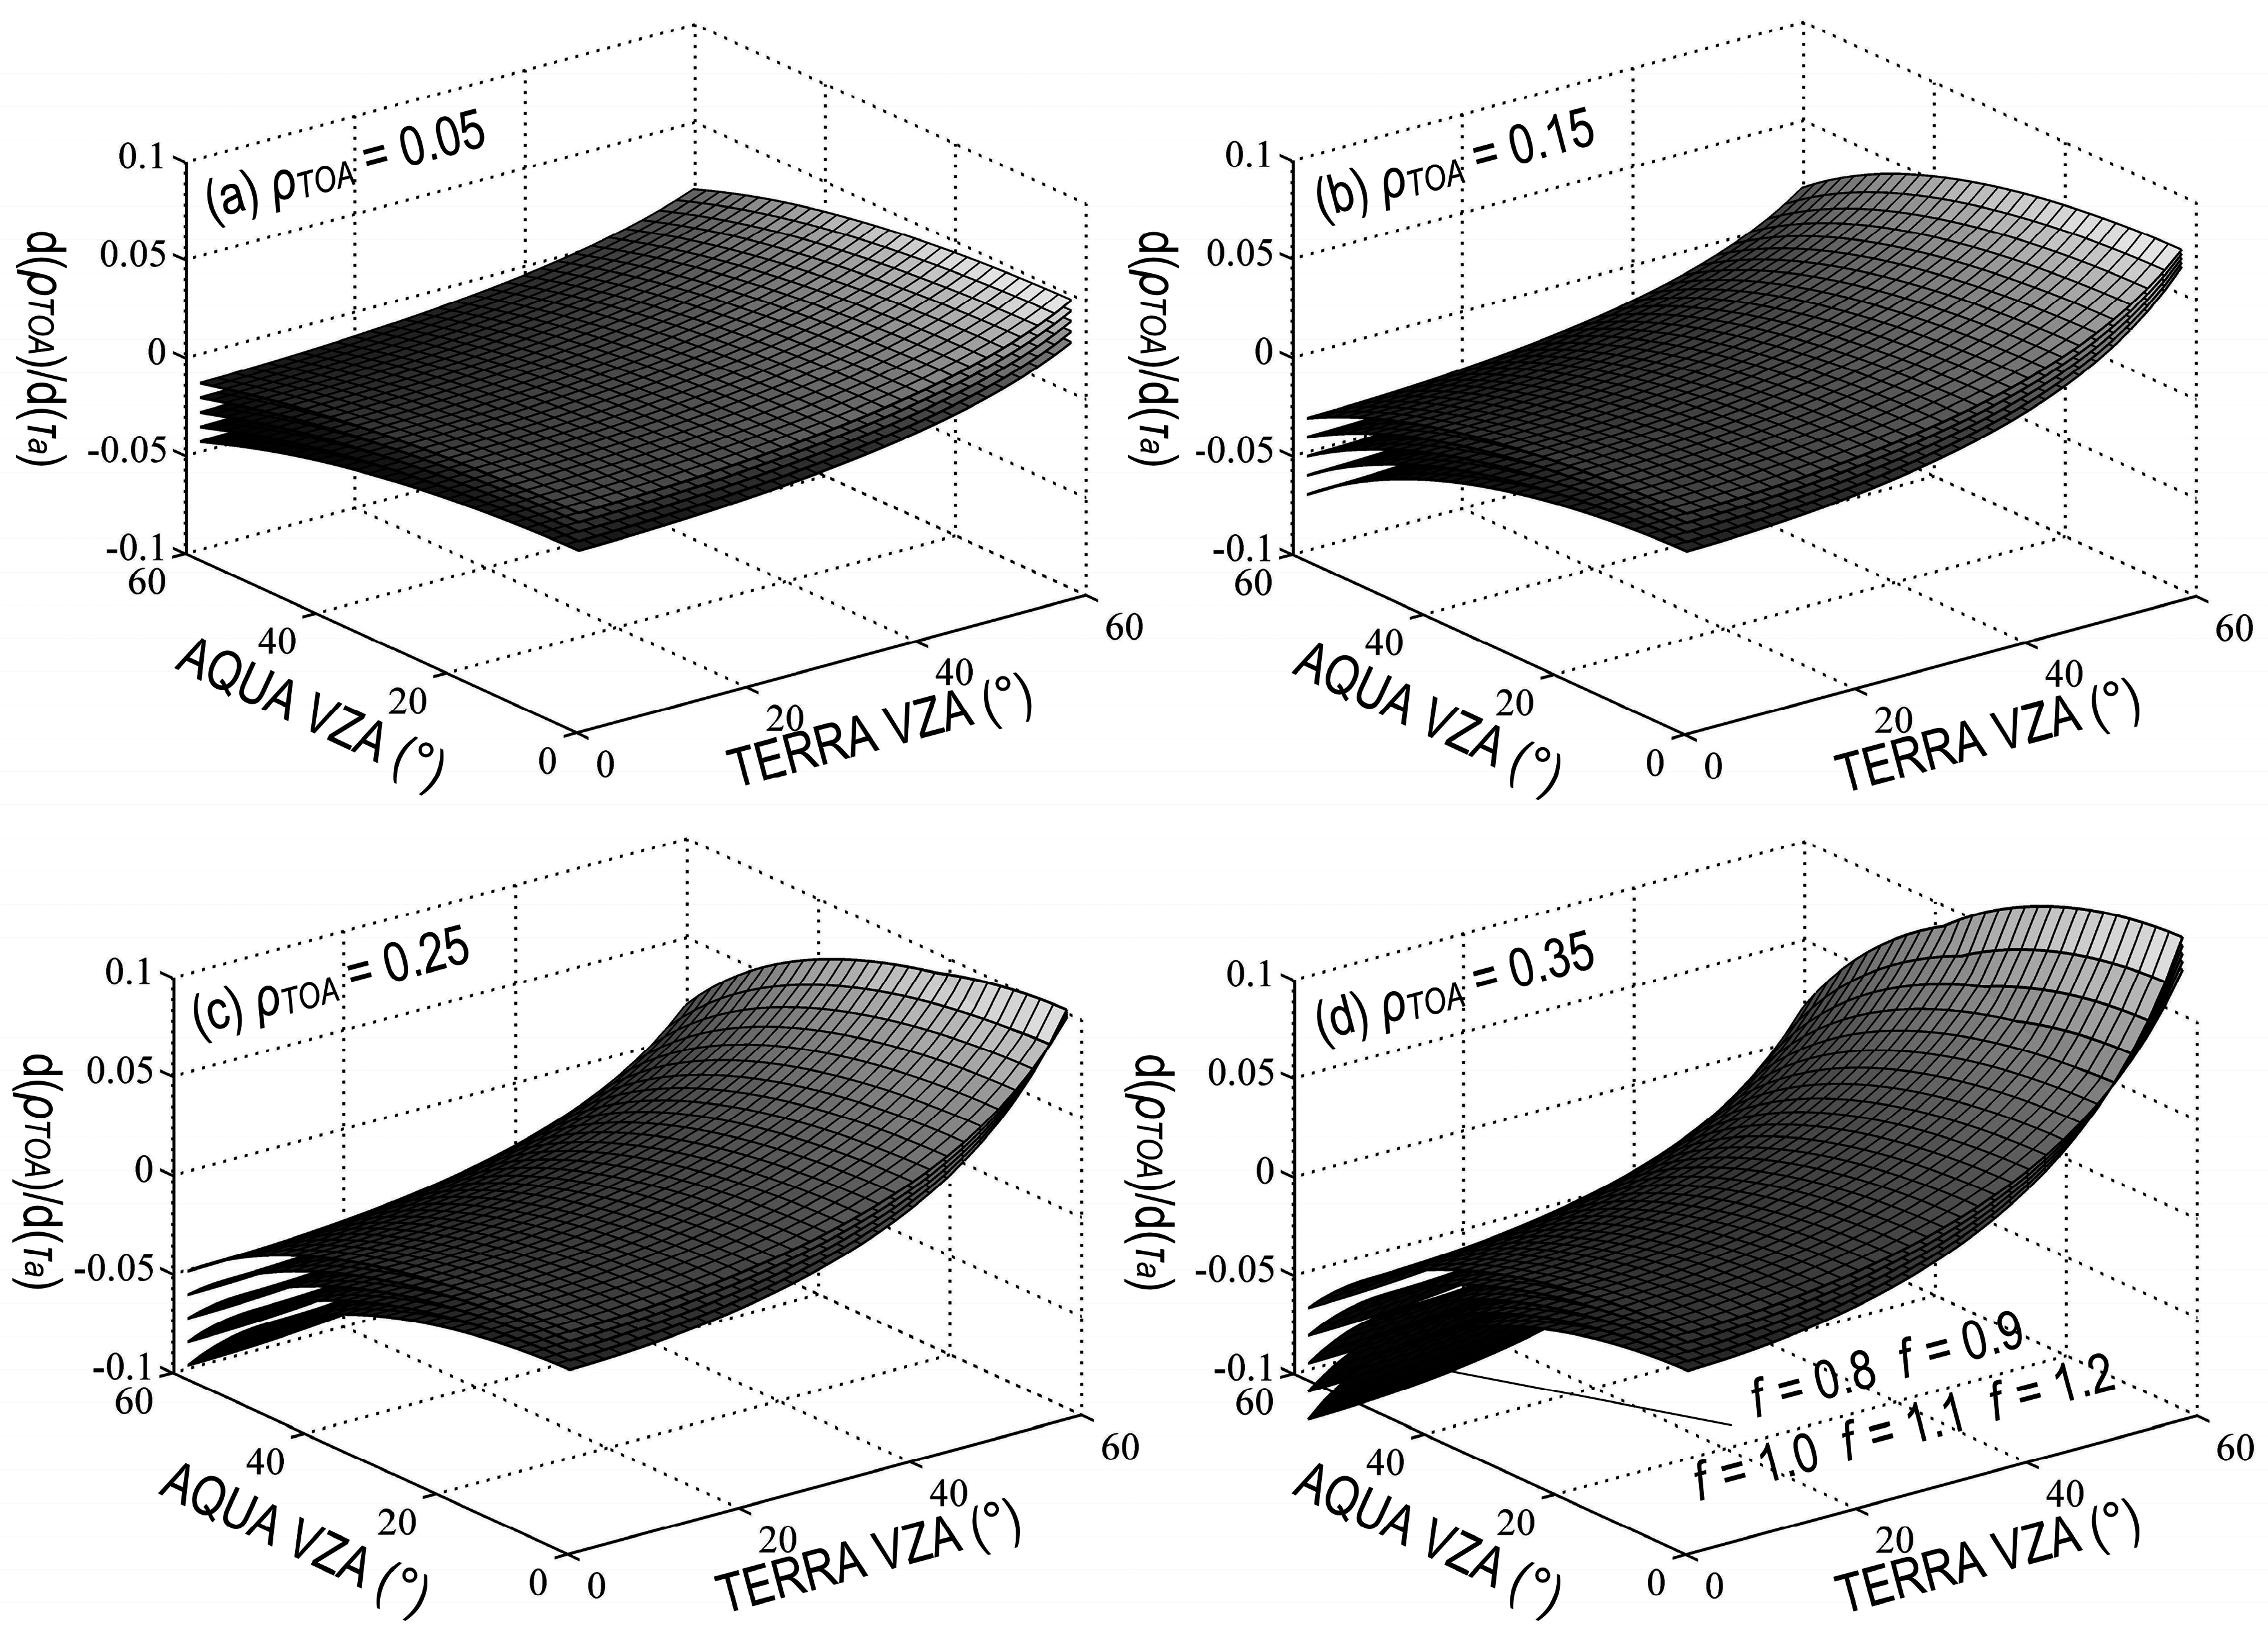
2.5. Sensitivity Analysis

Because ρTOA,2 is an analytical function of AOT in Equation (10), the derivation of ρTOA,2 with respect to AOT (τa) should be also in an analytical form, which can be written as
β = d ρ T O A , 2 / d τ a = f u n ( ρ T O A , 1 , G E O , f B R D F , A T M ) ,
where β denotes partial differential equation; GEO denotes observational geometry including SZA, VZA, and RAA; and ATM denotes atmospheric parameter including TOC, TPW, and AOT. Because the partial differential equation is complicated, we use fun instead of the full equation.
The value of β is jointly controlled by TOA reflectance at the reference sensor (AQUA), SZA, VZA, RRA, the BRDF adjustment factor and the atmospheric parameters (including AOT). The index mathematically represents the sensitivity of TOA reflectance at the subject sensor to AOT. High β value implies that minor variations in AOT correspond to major variations in ρTOA,2. Therefore, high β value shows strong sensitivity of TOA reflectance to AOT, and thus indicates better accuracy of aerosol retrieval.

3. Study Materials and Data Preprocessing

3.1. Radiative Transfer Calculations

The radiative transfer calculations were performed to solve the coefficients in Equations (2)–(4) and Equation (8). The 6S (Second Simulation of the Satellite Signal in the Solar Spectrum) radiative transfer code [7,47,48] was used to simulate atmospheric absorptions due to ozone and water vapor, atmospheric scattering transmittances and path radiances at different SZA, VZA, RAA, and AOT values. For each 6S simulation, the aerosol was fixed as continental type, and the spectral response functions were set as the MODIS red band (0.645 μm) and near-infrared band (0.859 μm). In this study, we proposed the TERRA-AQUA synergetic algorithm and performed a preliminary validation in southern China, while we did not publish a worldwide operational algorithm. Therefore, the best matched continental aerosol model was used. SZAs and VZAs varied between 0° and 60° (5° increment), and the solar and view azimuth angles varied between 0° and 360° (30° increment), and AOT varied between 0 and 1 (0.2 increment). Using the simulated data, the coefficients in Equations (2)–(4) and Equation (8) were solved for both MODIS bands. The solutions were constrained by the law of least squares.

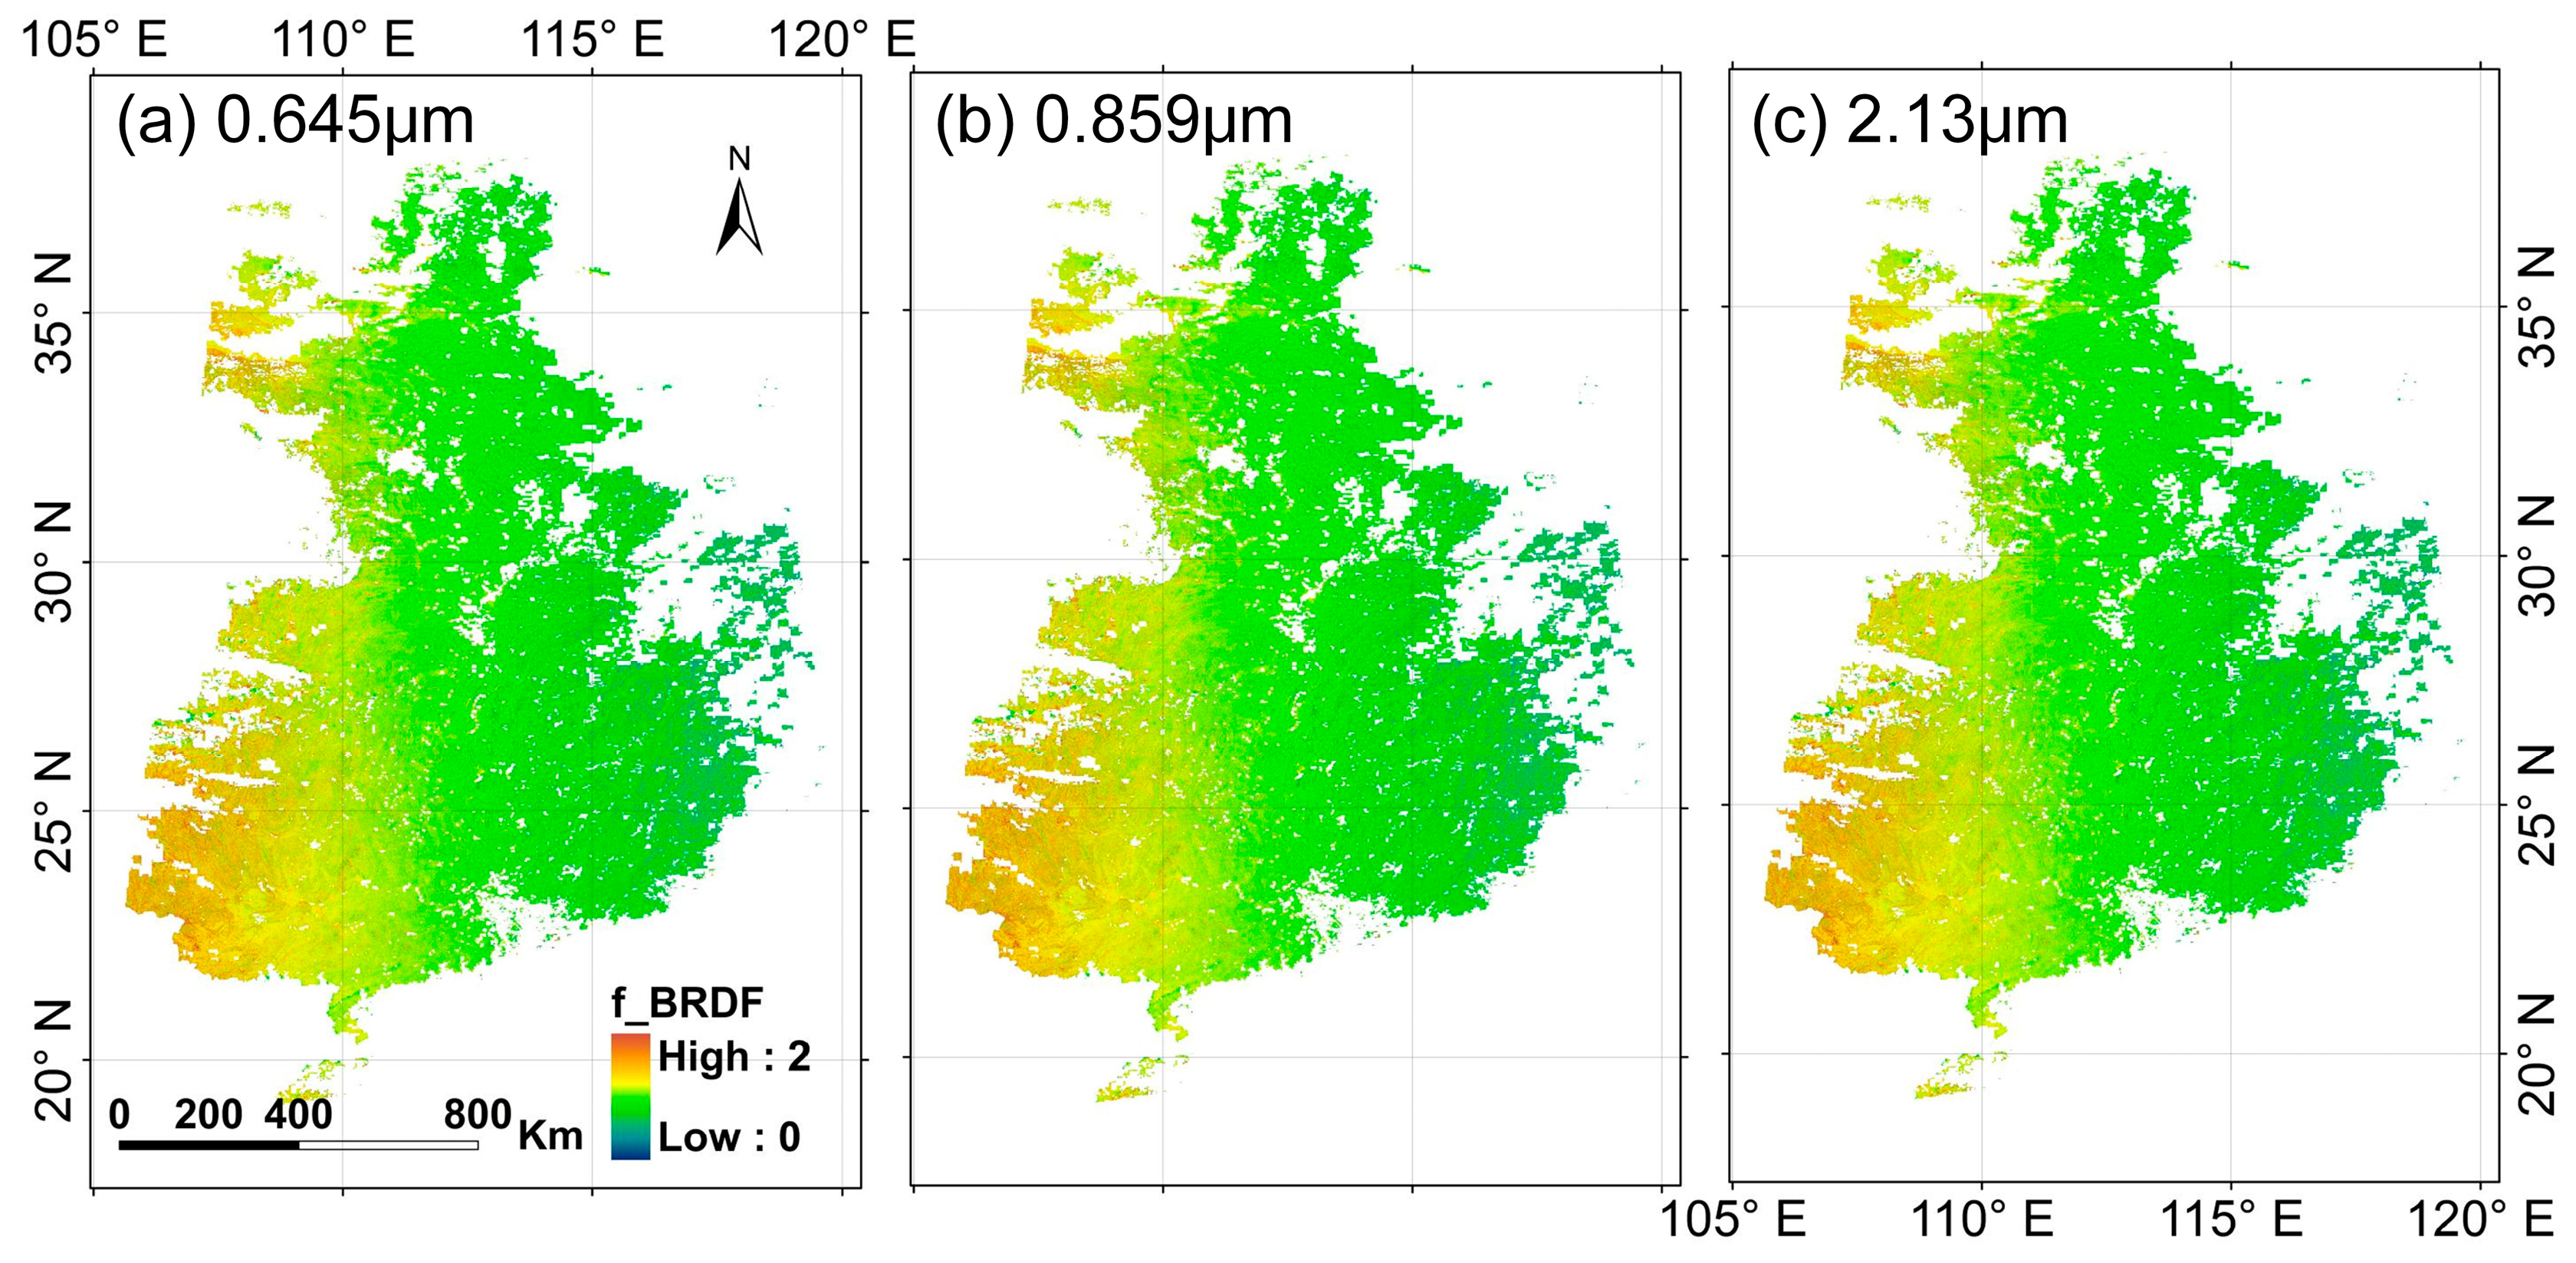
3.2. Processing of BRDF Data

The BRDF data were used to validate the ratioing technique for BRDF characterization. The original data include bidirectional reflectances of the bog and forest land cover types in the 429 nm, 521 nm, 606 nm, 866 nm, 1243 nm, 1660 nm, and 2200 nm bands. The two land cover types are common in the southern China. The SZAs and VZAs vary from nadir to 90° (10° increment) and the RRAs range between 0 and 180° (30° increment). Initially, the data records were discarded when SZA > 60° or VZA > 60°. This treatment eliminated the observational geometries that were not covered by MODIS and ensured the quality of spectral measurements. Because the MODIS spectral bands did not coincide with those of the BRDF data, the 606 nm band was substituted as the MODIS red band (0.645 μm), and the 866 nm band as the MODIS near-infrared band (0.859 μm), and the 2200 nm band as the MODIS 2.13 μm band.
To validate the band ratioing technique, reflectance ratios were calculated. Initially, a reference observational geometry was arbitrarily selected as (SZA = 30°, VZA = 0°, RAA = 0°). Then, the original reflectances were divided by the reference reflectance at each of the three bands. Finally, the ratios at the 606 nm and 866 nm bands were plotted respectively against those at the 2200 nm band. The fittings were evaluated to determine whether it was suitable to treat BRDF effects with the band ratioing technique. Note that the selection of reference geometry did not affect the evaluation.

3.3. Validation of TERRA-AQUA MODIS Relationship

The validation was divided into three parts. First, TOA reflectances (modelled TERRA) were calculated using Equation (10) and compared with the corresponding TERRA MODIS observations. The TERRA MODIS observations were acquired from TERRA MOD021KM L1B images (DOY = 2006308; Time = 0250 & 0255), and the AQUA MODIS observations from AQUA MOD021KM L1B image (DOY = 2006308; Time = 0605). These collocated totally cloud free images covered most of southern China. The MODIS 0.645 μm, 0.859 μm, and 2.13 μm bands were converted to TOA reflectances using the corresponding calibration coefficients, and aggregated into 3 × 3 km to reduce the effects of spatial misregistration between TERRA and AQUA MODIS images. The BRDF adjustment factors were then calculated by ratioing the TERRA MODIS 2.13 μm band over the AQUA MODIS 2.13 μm band. Meanwhile, the ozone (‘Total_Ozone’) and water vapor (‘Water_Vapor’) products were acquired from the MODIS atmospheric profile dataset (MOD07 & MYD07), and the aerosol (DT algorithm) products from the MODIS aerosol dataset (MOD04 & MYD04), and the observational geometry data from the MODIS geolocation dataset (MOD03 & MYD03). All the products were collected from the MODIS C006 database. The mean difference and standard deviation were used to show the differences between the calculated and observed TERRA MODIS reflectances. Second, AOT data were retrieved using Equation (10) and compared with both TERRA and AQUA MODIS retrievals (DT algorithm). The input data were also acquired from MOD02, MOD03, and MOD07 datasets. Similarly, the mean difference and standard deviation were used to show the differences between the TERRA-AQUA MODIS retrievals and the MODIS DT retrievals.
It is reported that the MODIS C006 aerosol data are not accurate over southern China [21]. Therefore, a third validation was performed to compare TERRA-AQUA MODIS retrievals with the CE318 sun photometer measurements. The sun photometer was located near the Poyang Lake, China (29.45°N, 116.05°E) and has operated since February 2015. In this study, the data collected in 2016 were used for validation purposes. All the observed data were artificially screened for cloud effects, and the days with continuous observations were reserved. Then the remaining data were retrieved for AOT at 1640 nm, 1020 nm, 870 nm, 670 nm, 500 nm, 440 nm, 380 nm, 340 nm, and the Ångström coefficient (α). AOT at 550nm was calculated as follows:
τ a , 550 = τ a , 500 × ( 550 / 500 ) α ,
where τa,550 and τa,500 are AOT at 550 nm and AOT at 500 nm.
Correspondingly, the cloud free TERRA and AQUA MODIS data covering the sun photometer site were acquired. The data including MOD02/MYD02, MOD03/MYD03, and MOD07/MYD07 were used for TERRA-AQUA MODIS aerosol retrievals. The retrievals were the same as those in the second validation. In addition, the operational TERRA and AQUA MODIS aerosol data, both DT and DB retrievals, were compared with our retrievals. R2 and RMSE were used to evaluate the comparisons. For clarity, the abovementioned validations were presented in Table 2.

3.4. Assignments for Sensitivity Analysis

Equation (11) served as the basis for sensitivity analyses. Three major factors including angular difference, surface condition, and BRDF effects were simulated for their effects on aerosol retrieval. For angular difference, only VZA differences were considered because SZAs were generally similar for dual sensors. For surface condition, TOA reflectance was considered since it was difficult to derive surface reflectance. The BRDF effects were characterized by the variations in BRDF adjustment factor. For each simulation, the parameters were assigned as SZA = 30°, VZA = 0–60°, RAA = 0°, TOA reflectance = 0.05, fBRDF = 1.0, TOC = 0.35 cm·atm−1, TPW = 1.0 g·cm−2, and AOT = 0.50. SZA = 30° represents a median SZA value, and VZA = 0–60° covers the MODIS observational geometry, and RAA = 0° represents a simplified observational geometry, and TOA reflectance = 0.05 (red band) represents a typical vegetation surface, and fBRDF = 1.0 represents a weak BRDF effect. TOC = 0.35 cm·atm−1, TPW = 1.0 g·cm−2, and AOT = 0.50 represent a relatively dry and clear atmosphere.
For simulation of angular difference and surface condition, SZA = 60° was also included, in order to investigate the possible SZA dependence. For simulation of surface condition, TOA reflectance varied from 0.05 to 0.25, representing a dark to a bright surface. For simulation of BRDF effects, fBRDF varied in between 0.8 and 1.2, representing a very weak BRDF effect (fBRDF = 1.0) to a very strong BRDF effect (fBRDF = 0.8 and fBRDF = 1.2). In some cases, AOT varied in between 0.05 and 0.50, representing a light aerosol loading to a heavy aerosol loading.

4. Results

4.1. Validation Results of the Ratioing Technique

Performances of the band ratioing technique are shown in Figure 1. For the bog land cover type (non-vegetated), the reflectance ratios at the 2200 nm band are highly correlated with those at the 606 nm band (y = 1.567x − 0.451, R2 = 0.856) and also those at the 866 nm band (y = 0.944x + 0.199, R2 = 0.815). The reflectance ratios at the 2200 nm band are in better agreement with those at the 866 nm band, while they are generally lower than those at the 606 nm band. For the forest land cover type (vegetated), however, the reflectance ratios at the 2200 nm band are weakly correlated with those at the 606 nm band (y = 0.225x + 1.400, R2 = 0.006). This also applies to the 866 nm band although there are some improvements in statistical values (y = 0.509x + 0.641, R2 = 0.331). Notably, the abnormally large ratio values at the 606 nm band cannot be approximated by those at the 2200 nm band. Overall, the band ratioing technique performs better in the near-infrared band than in the red band and over non-vegetated surfaces than over vegetated surfaces.

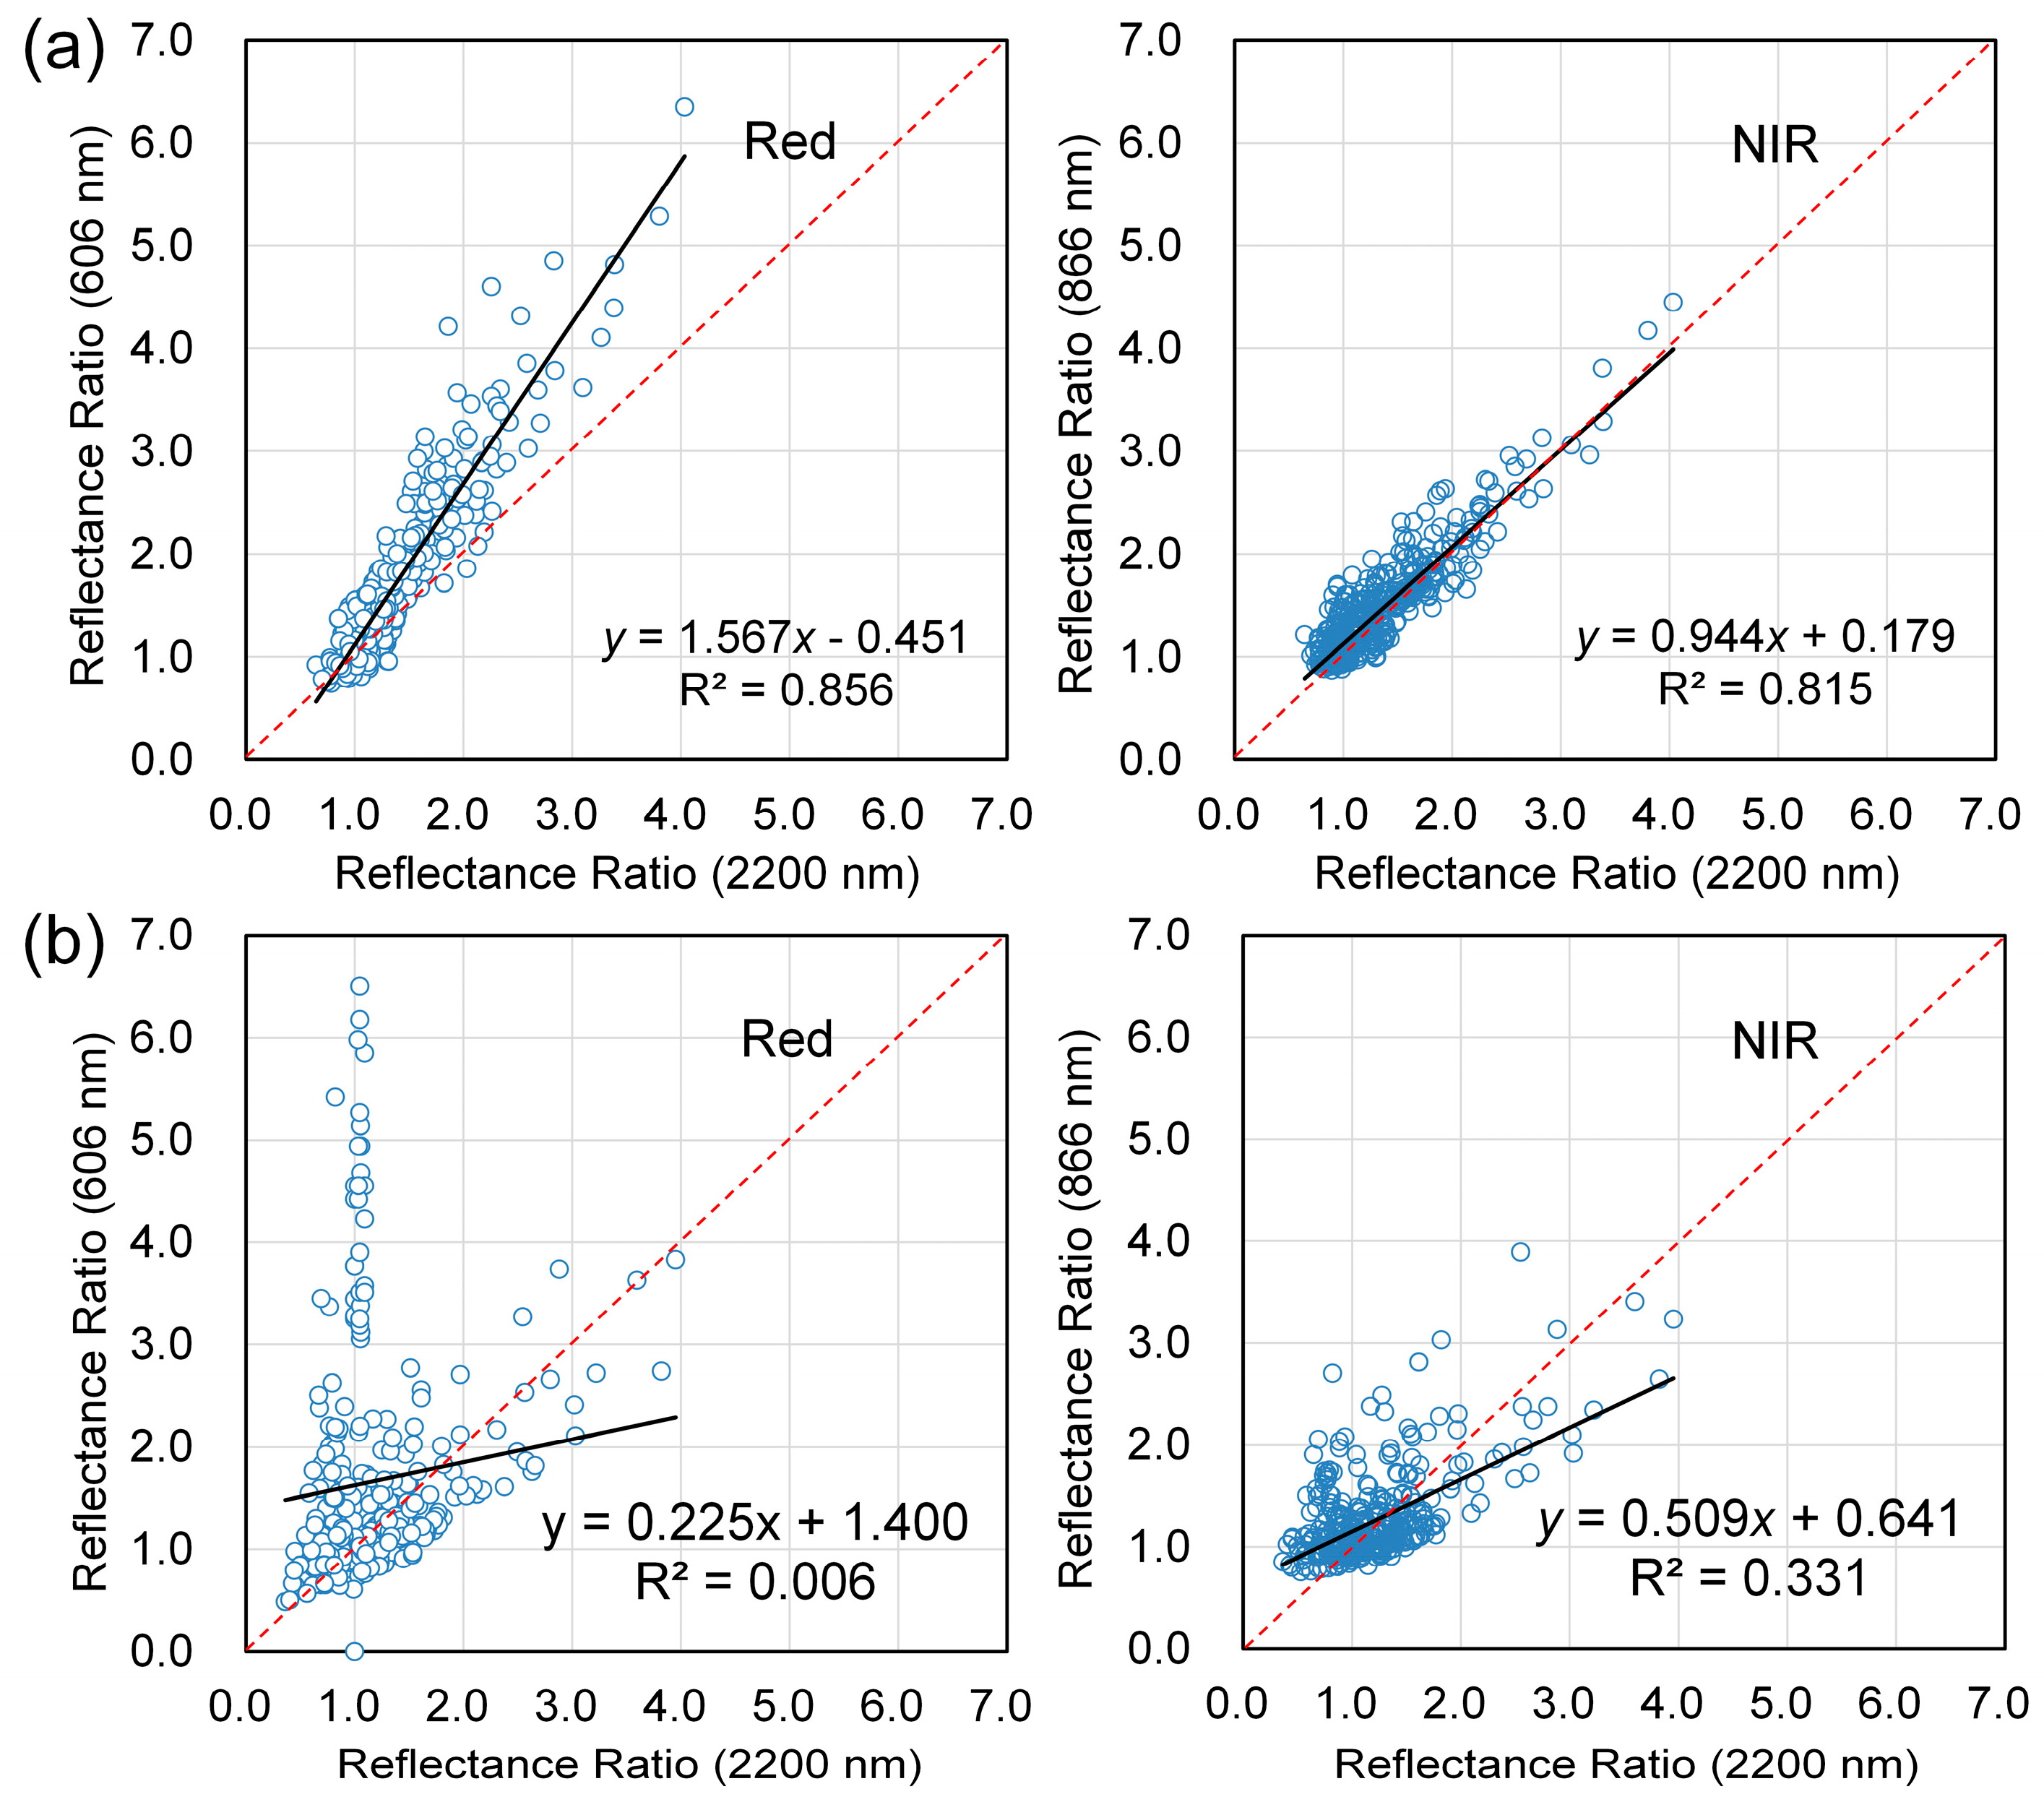
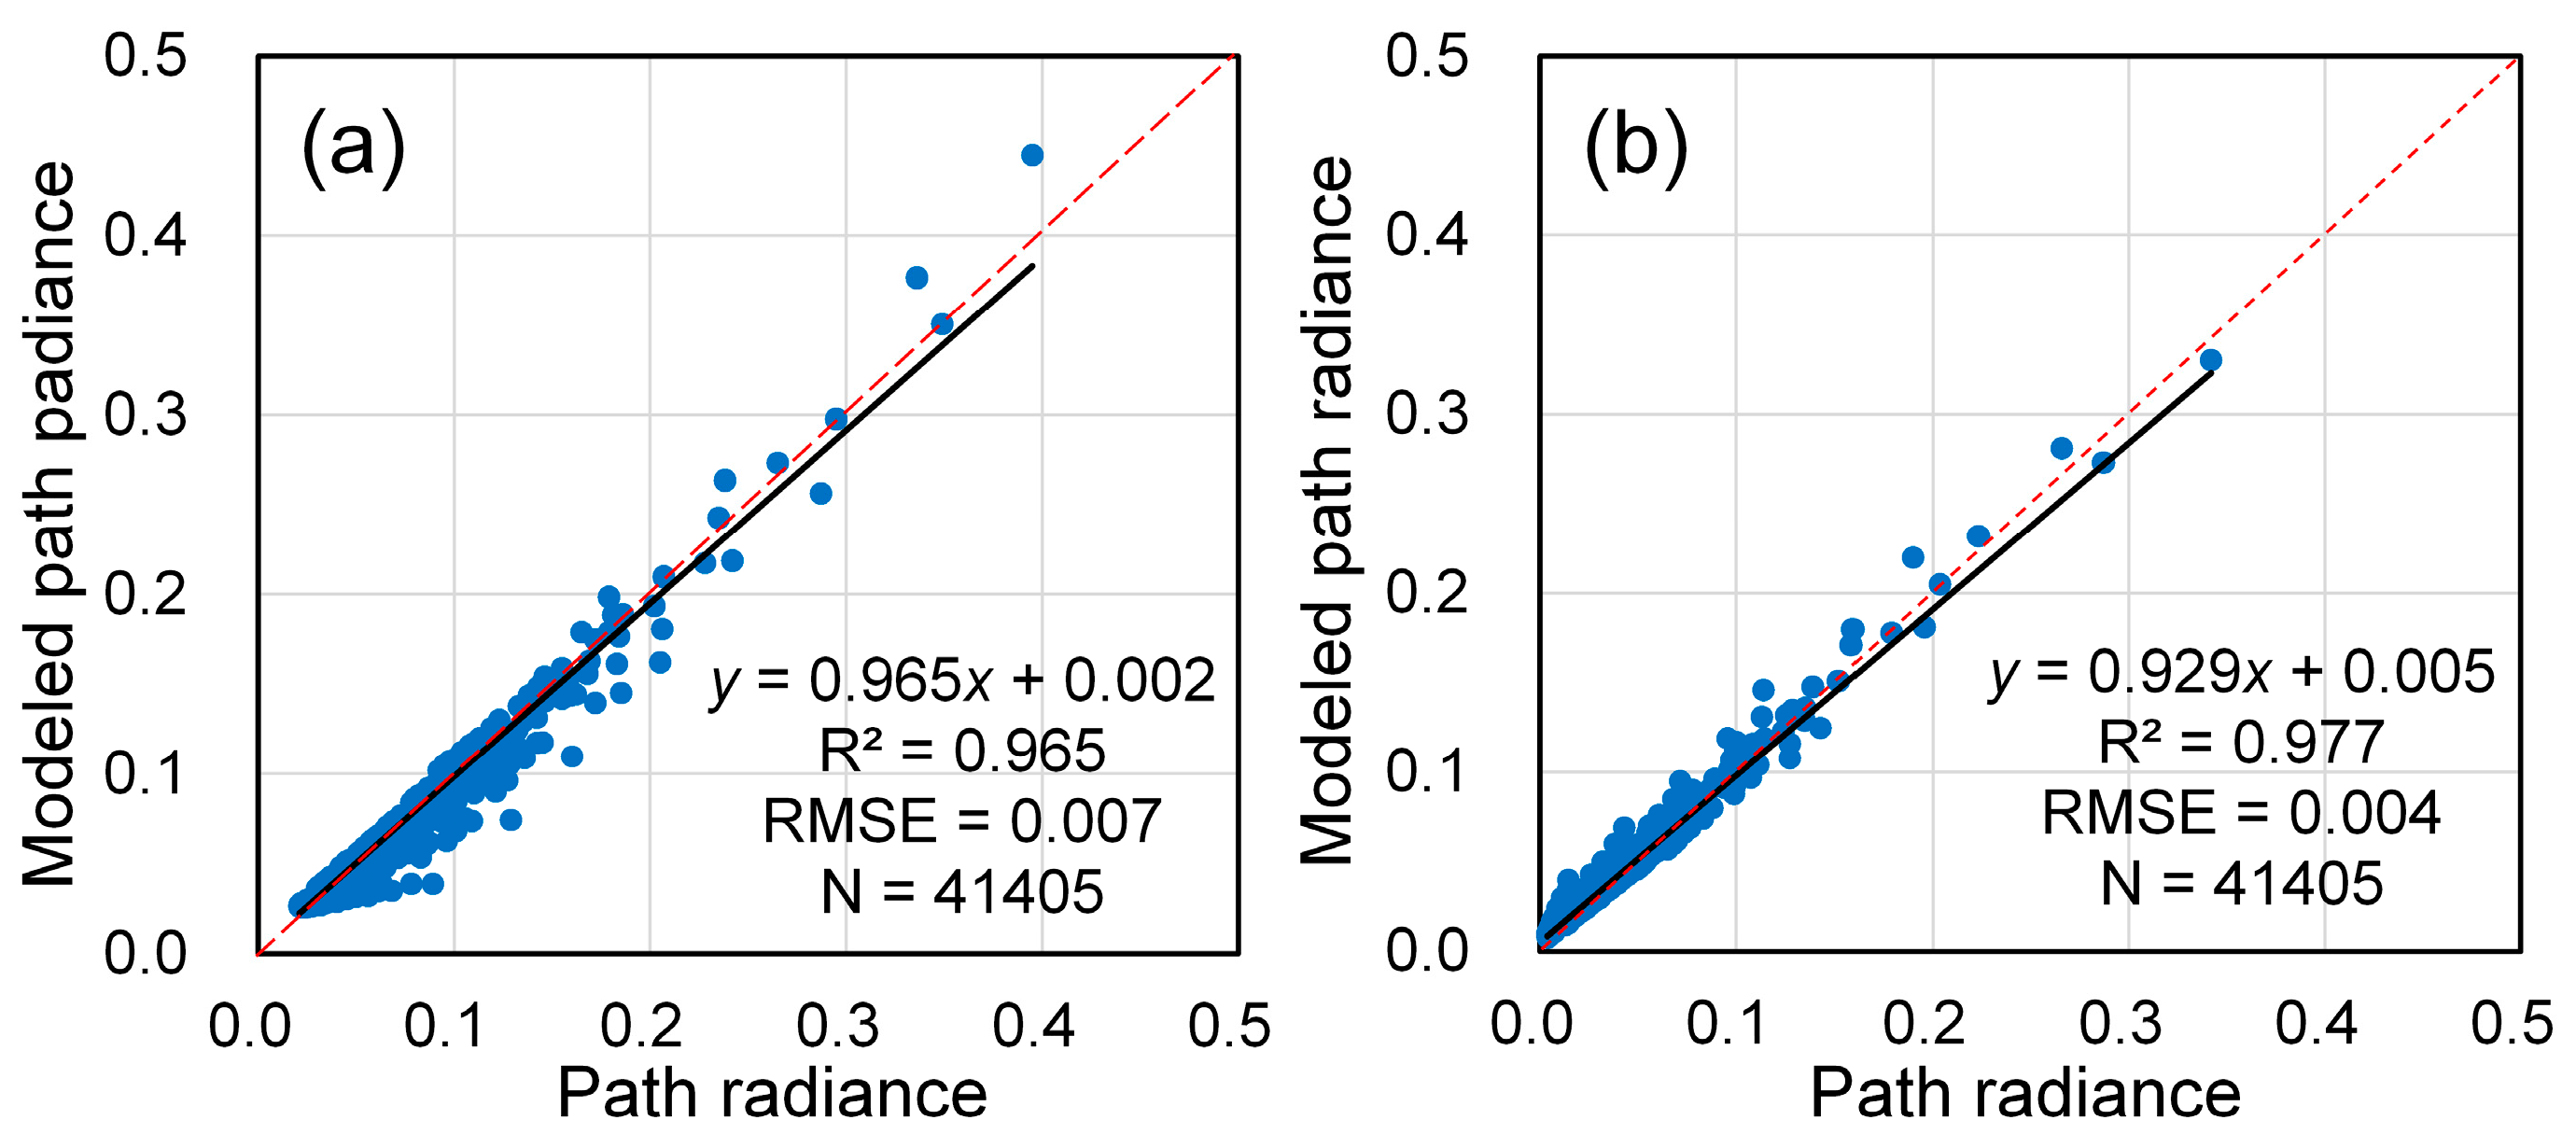
4.2. The Performance of Path Radiance Approximation

Comparisons of the calculated path radiances (6S model) and the estimated (analytical model) path radiances are shown in Figure 2. The 6S path radiances are calculated with AOT = 0–1, SZA = 0–60°, VZA = 0–60°, solar azimuth angle = 0–360° and view azimuth angle = 0–360°. For the continental aerosol type, the optimal values of the two parameters α and g in Equation (8) are 0.55 and 0.35 for both MODIS bands. Generally, path radiance can be accurately modeled with Equation (8). Statistical analyses reveal that the calculated and approximated path radiances are highly correlated for both the red band (y = 0.965x + 0.002; R2 = 0.965; RMSE = 0.007; N = 41405) and the near-infrared band (y = 0.929x + 0.005; R2 = 0.977; RMSE = 0.004; N = 41405). Slightly better statistical values (in terms of R2 and RMSE) are observed for the near-infrared band than the red band. It is worth noting that path radiance is also smaller for the near-infrared band than the red band.

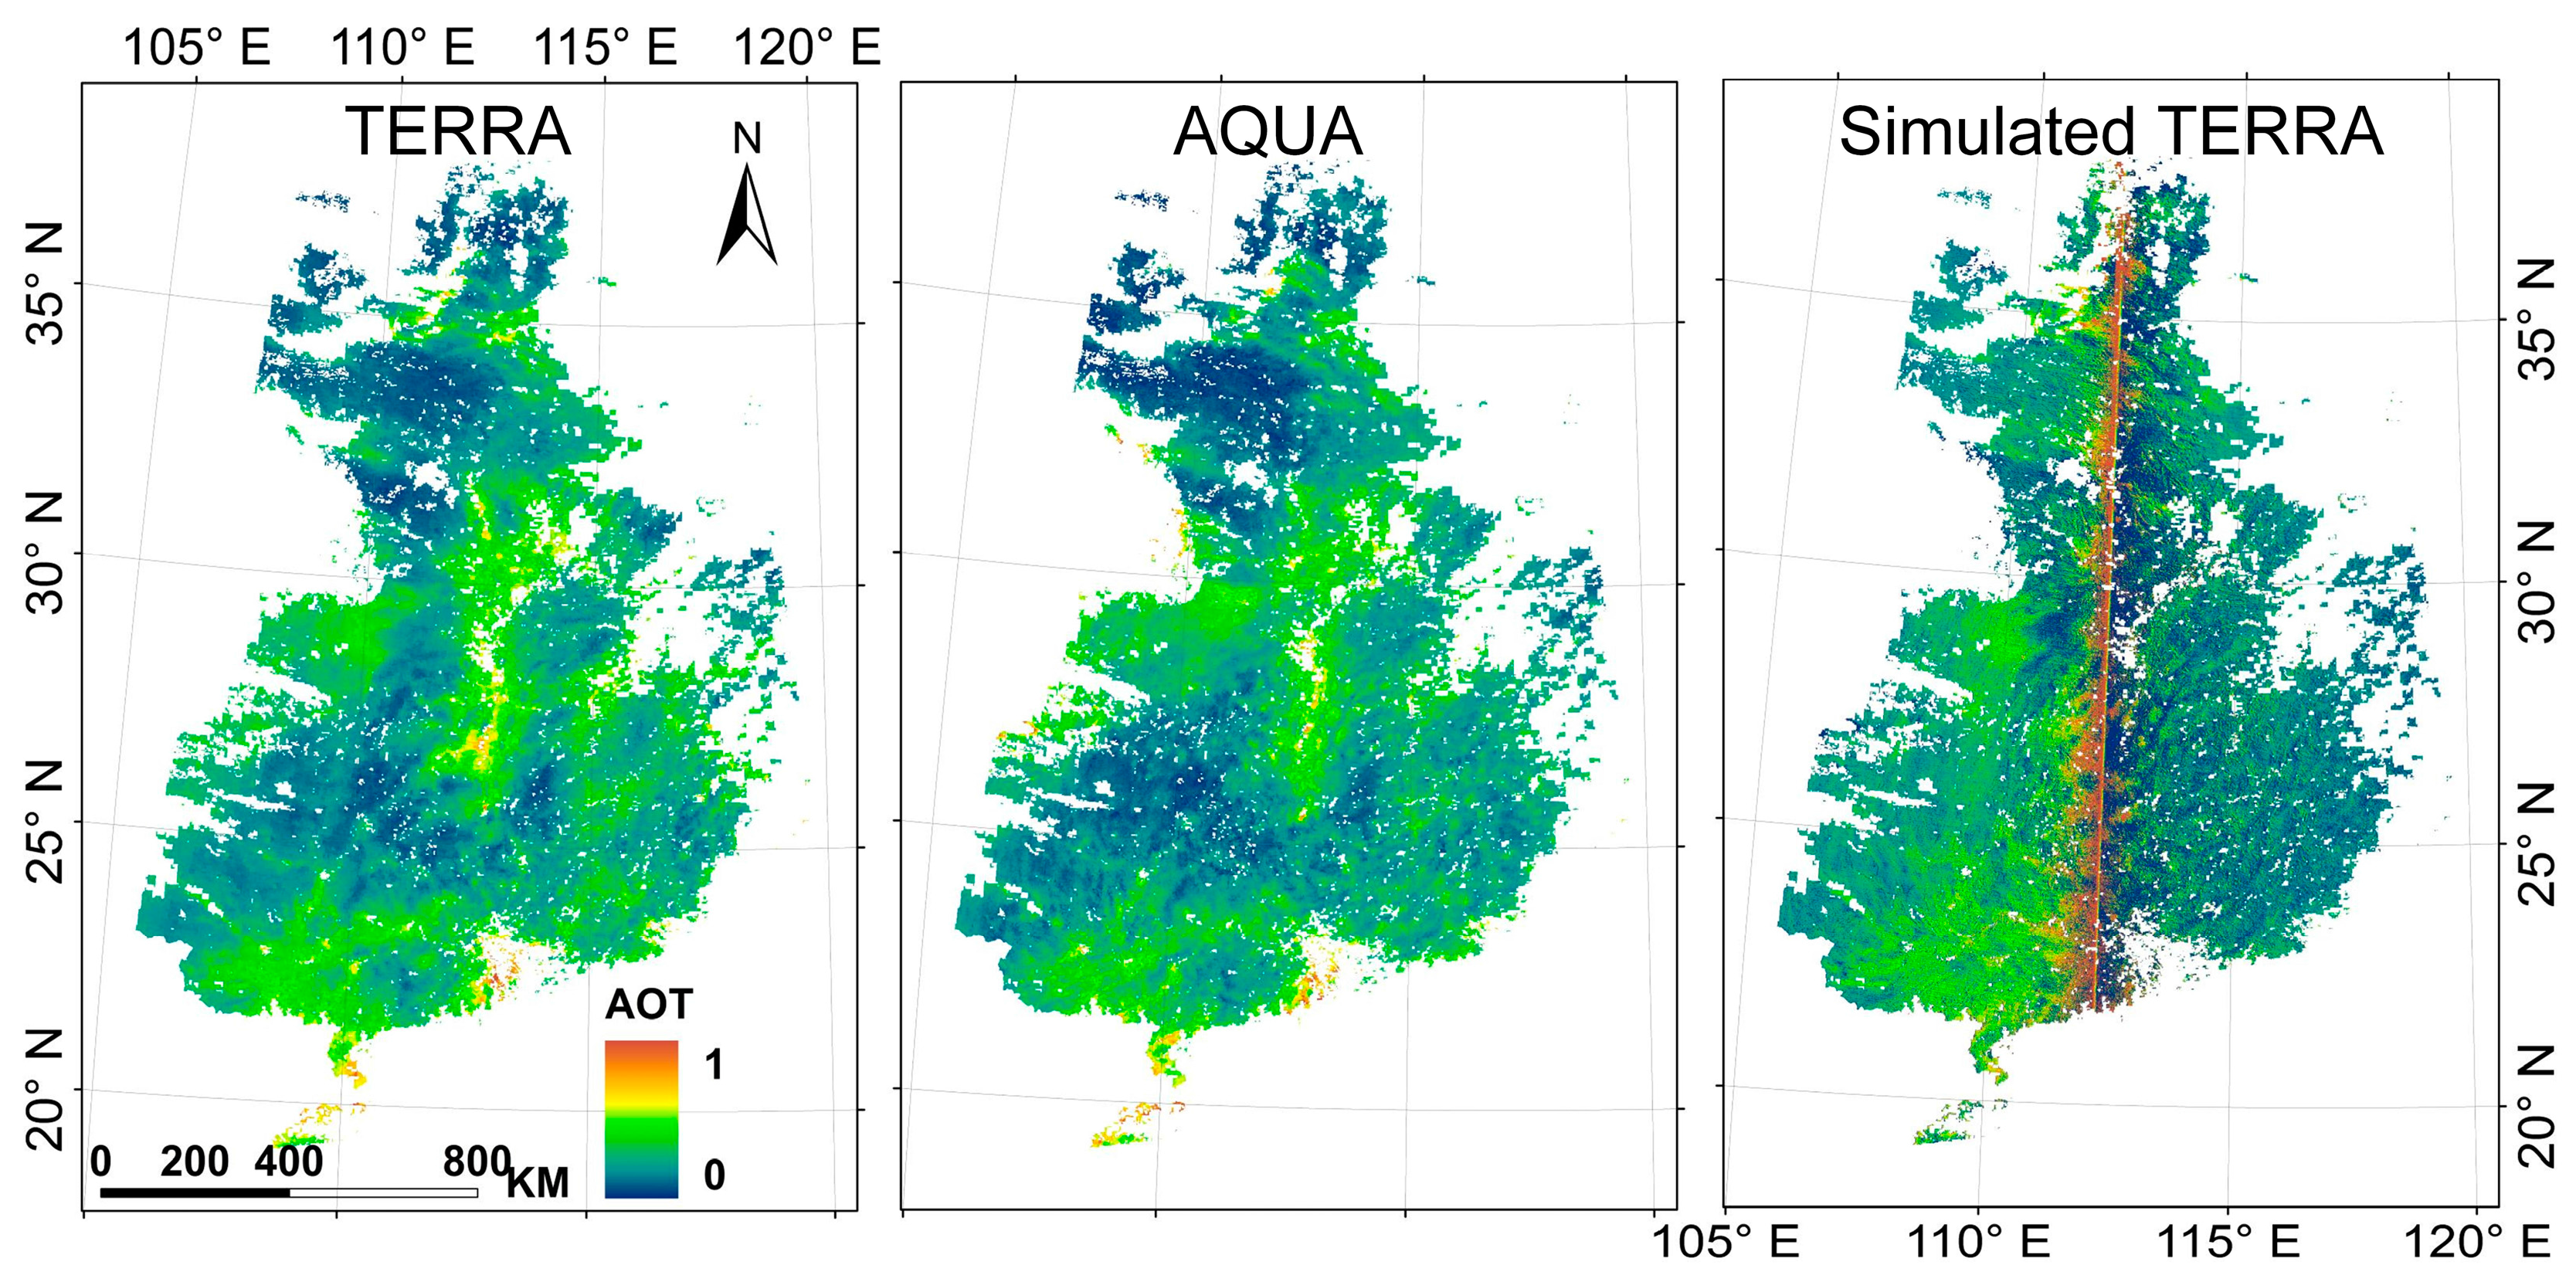
4.3. Validation Results of the MODIS-MODIS Relationship

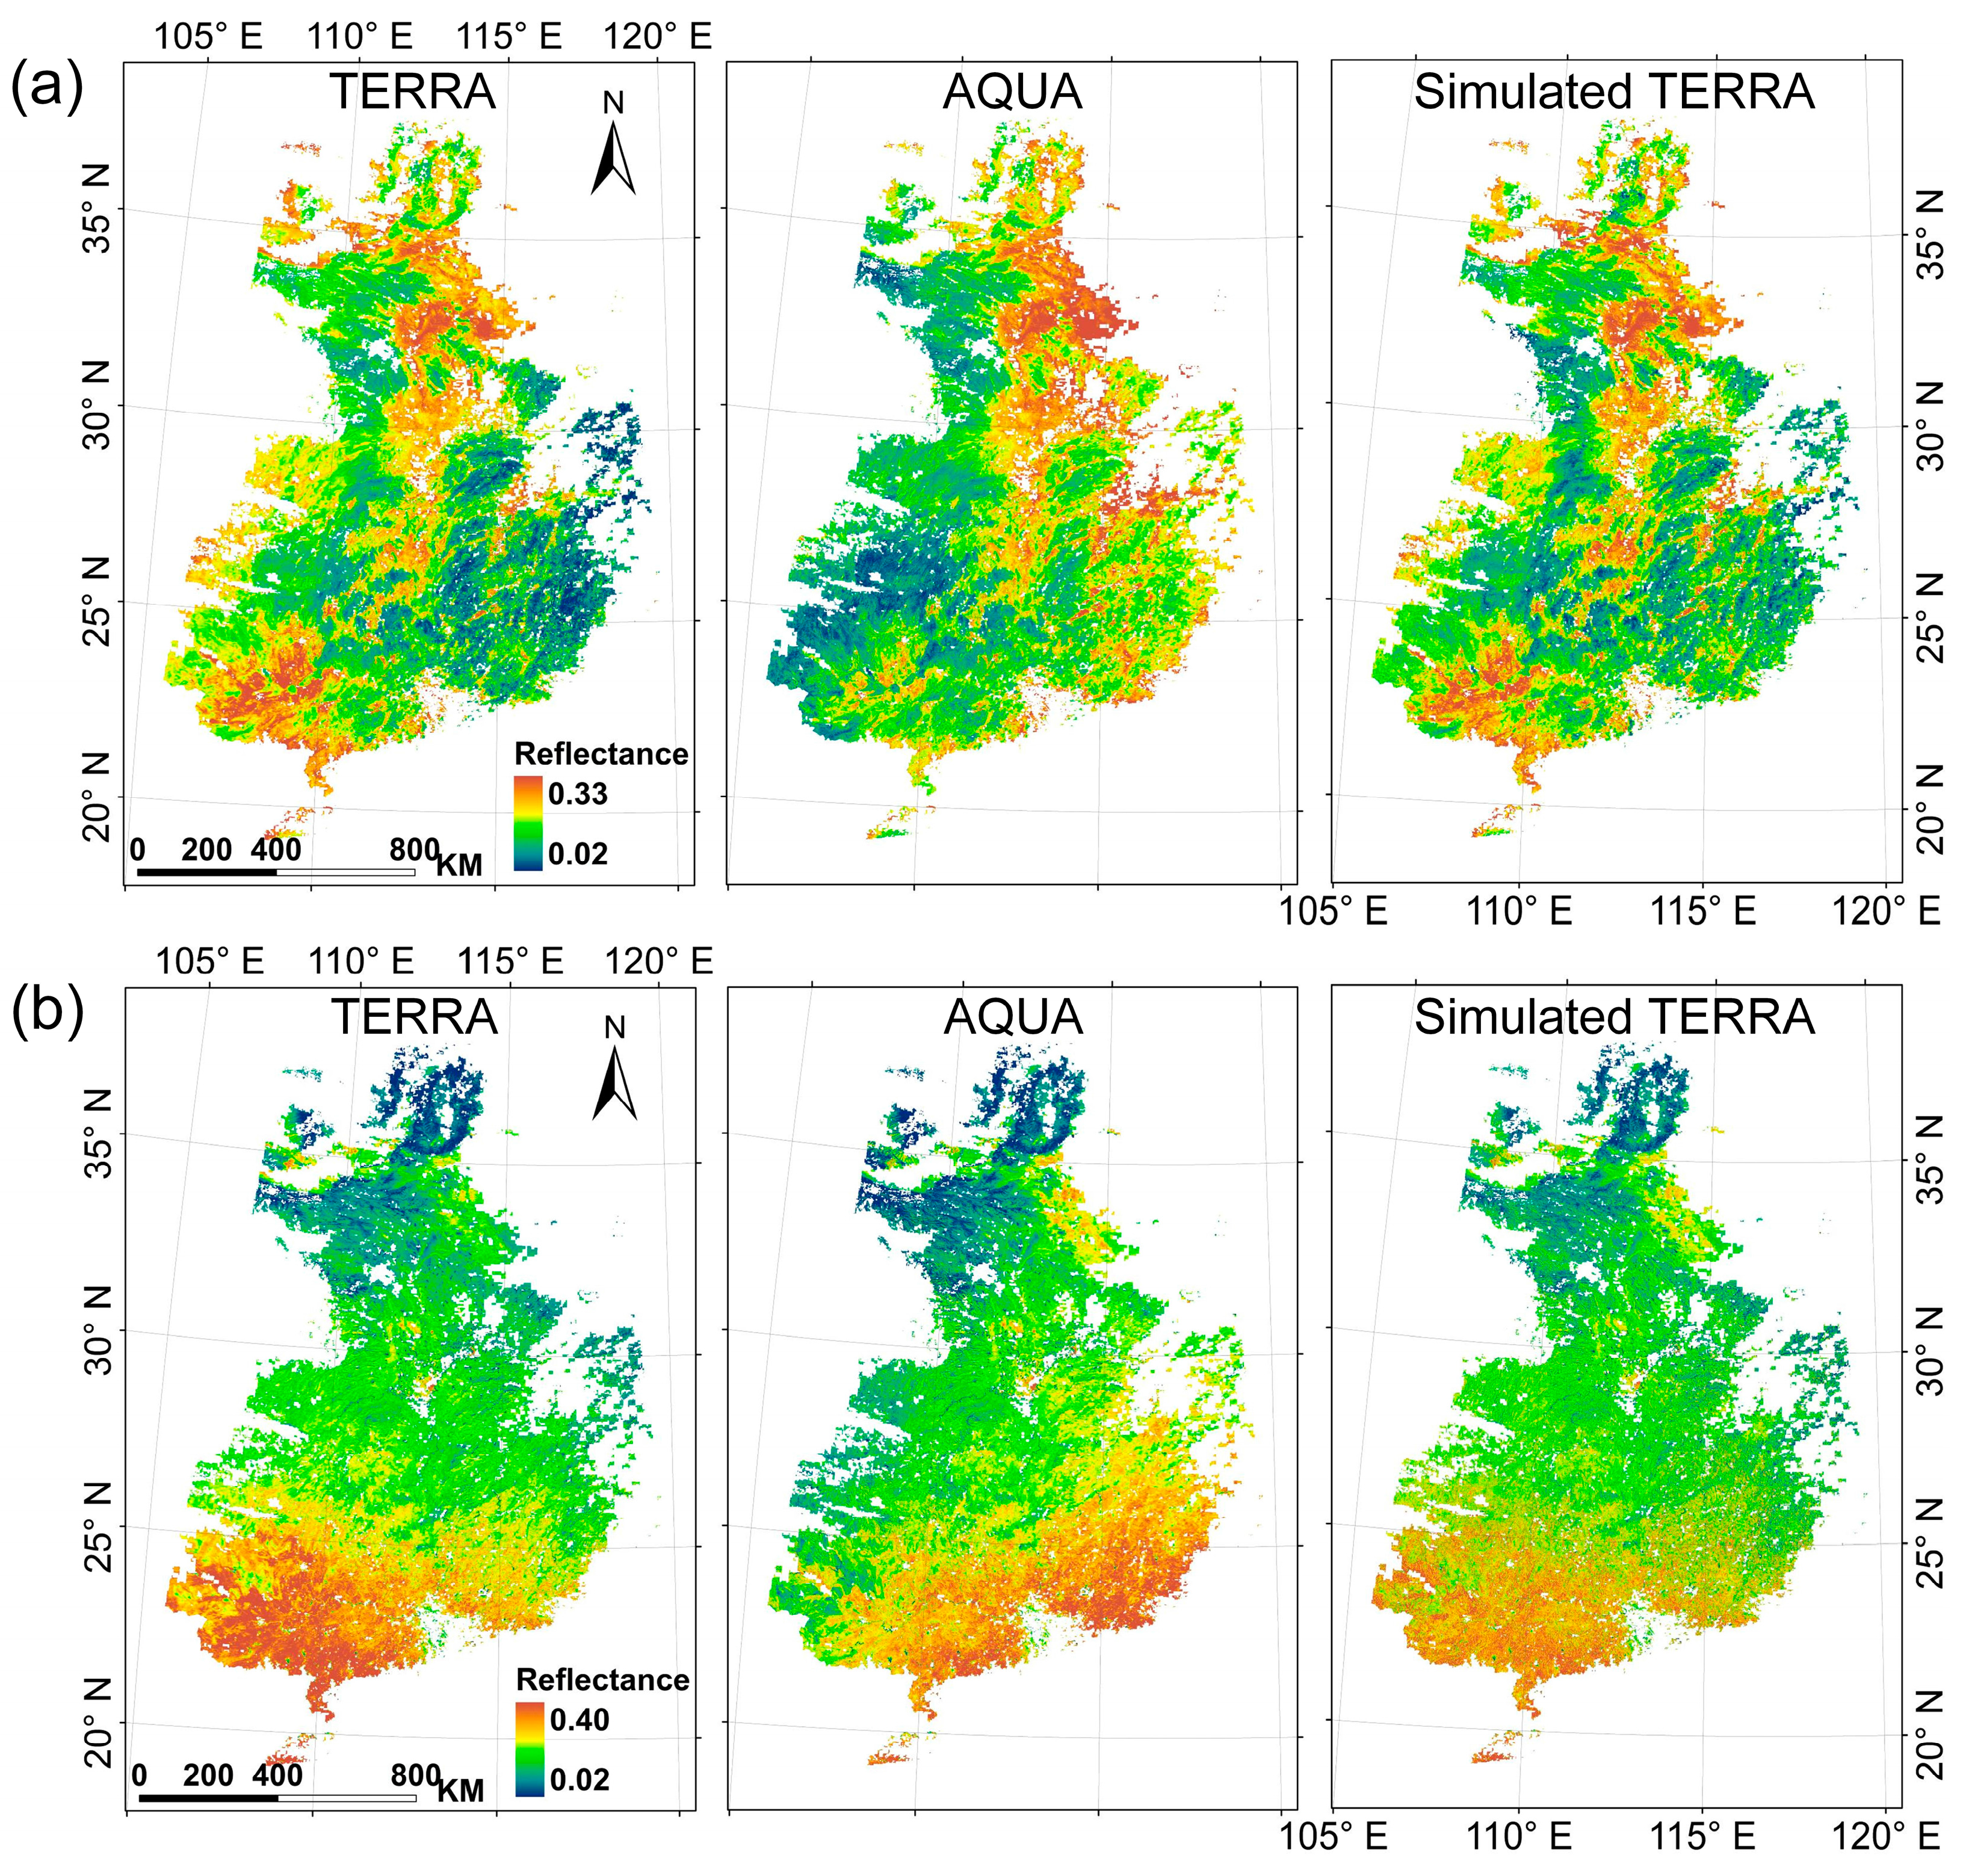
4.3.1. Comparisons with MODIS Reflectances

Figure 3 shows comparisons of TERRA MODIS observations, AQUA MODIS observations, and the modelled TERRA MODIS reflectances in the visible and near-infrared bands. There are marked differences between the corresponding bands of daily TERRA and AQUA MODIS. For the red band, AQUA MODIS observes lower (higher) reflectances than TERRA MODIS in the western (eastern) areas. While for the near-infrared band, the BRDF effects are relatively weaker than the red band. AQUA MODIS observes lower reflectances in the western and southern areas than its TERRA counterpart. These differences are largely reduced when AQUA MODIS band reflectances are transformed to mimic TERRA MODIS observations. The spatial patterns are in better agreement between TERRA MODIS observations and the simulated TERRA MODIS reflectances. The reflectance difference decreases from −0.0025 ± 0.0149 to −0.0013 ± 0.0070 reflectance units (N = 1204916) for the red band, and decreases from −0.0126 ± 0.0244 to −0.0103 ± 0.0222 reflectance units (N = 1204916) for the near-infrared band. Overall, the relationship performs better for the red band than the near-infrared band.

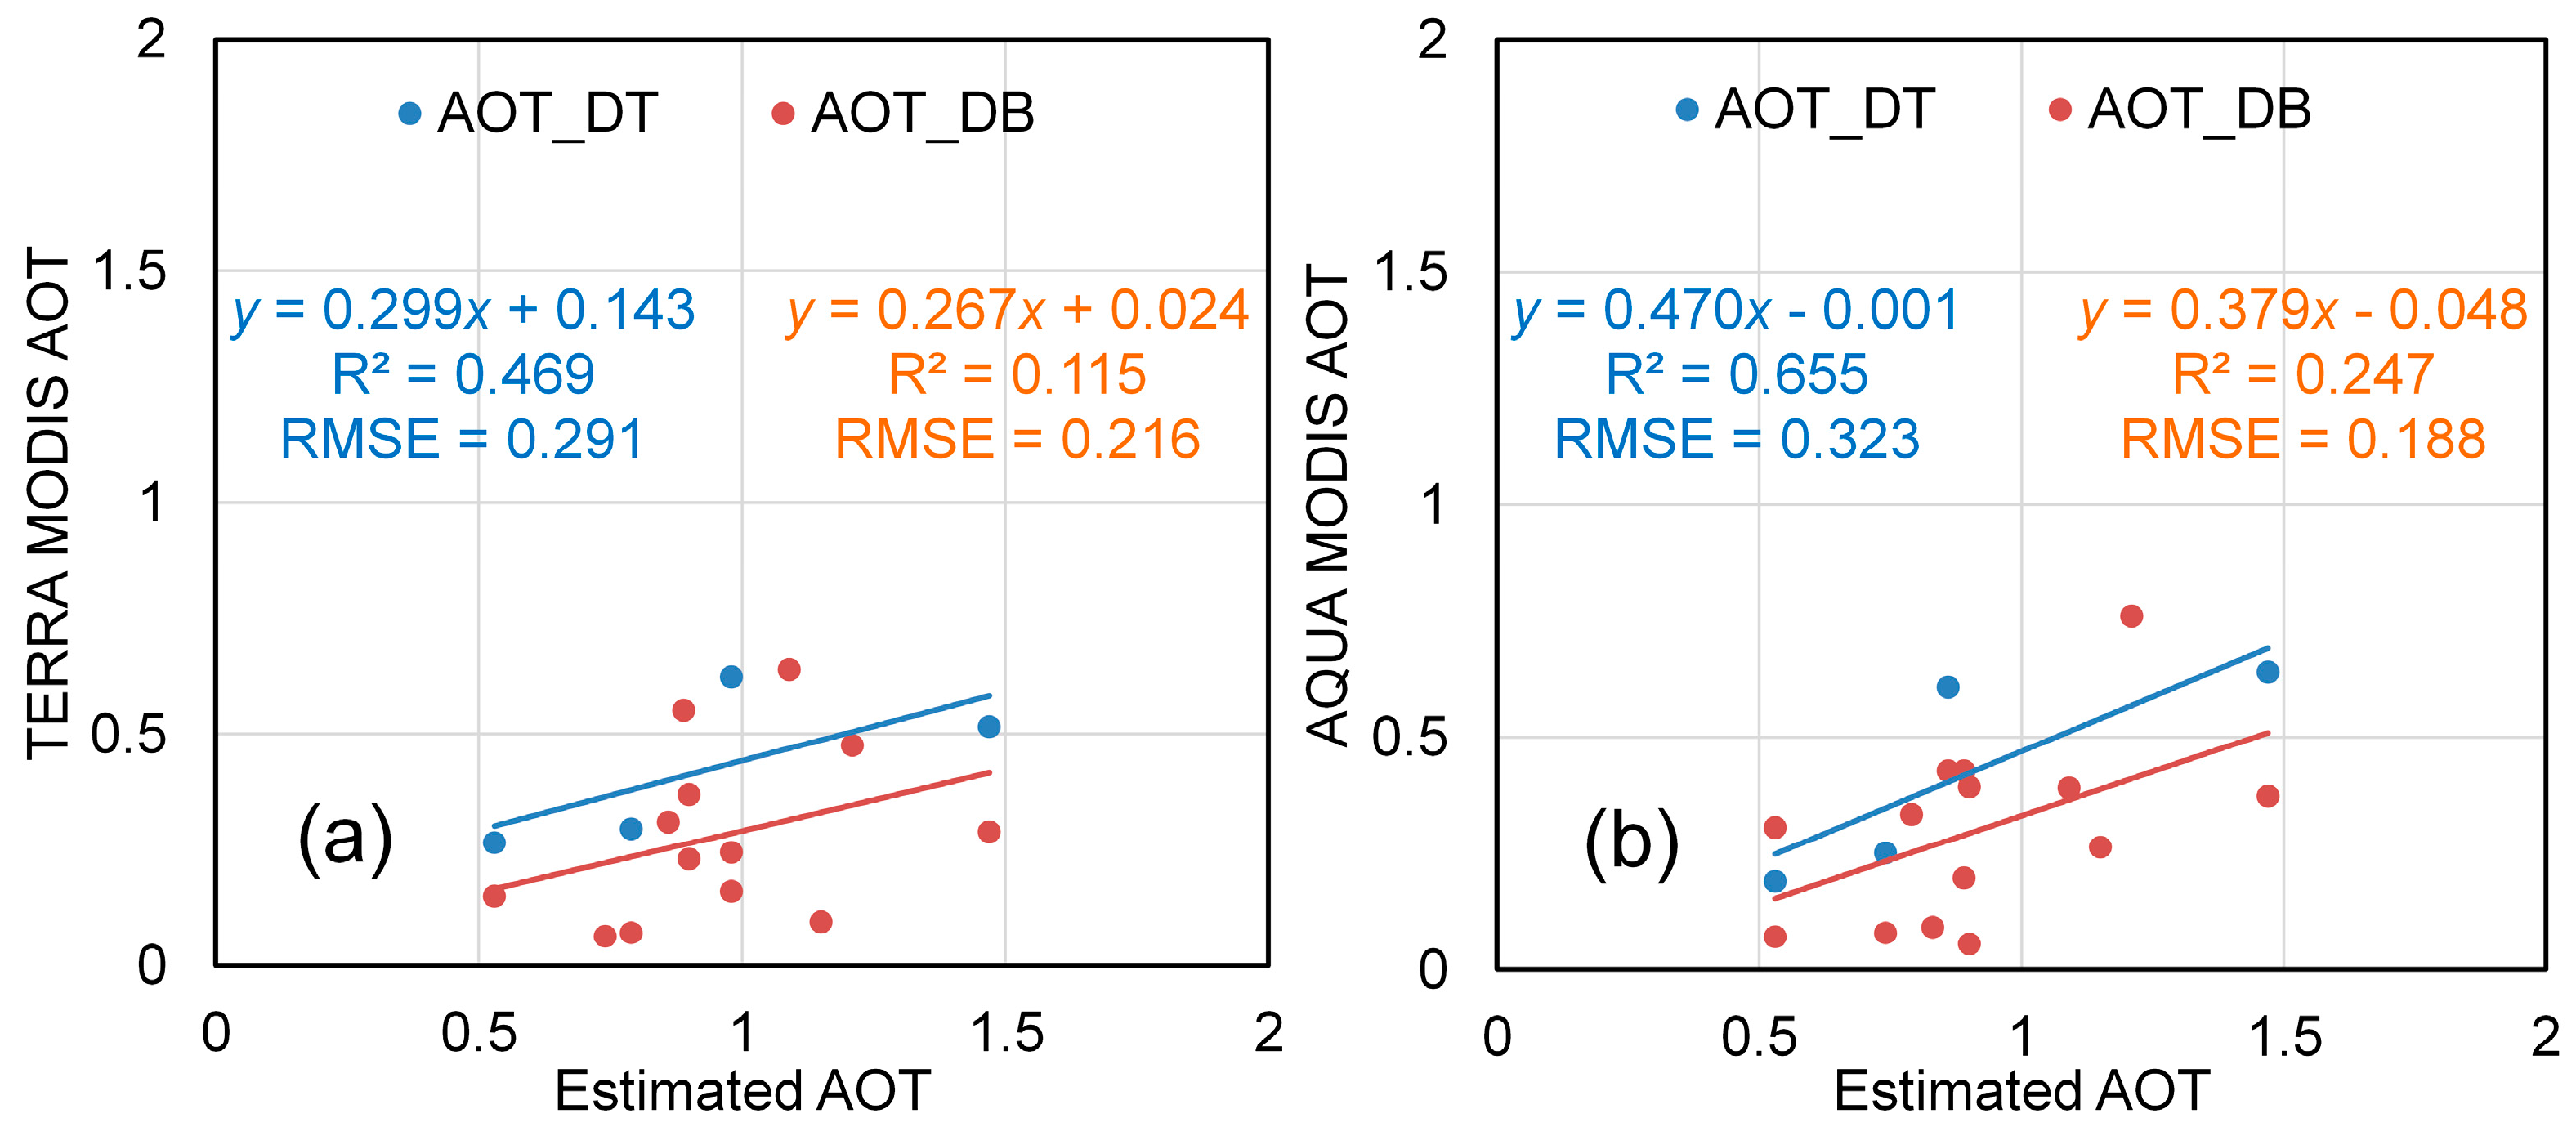
4.3.2. Comparisons with MODIS AOT Retrievals

Figure 4 shows comparisons of TERRA MODIS aerosol retrievals, AQUA MODIS aerosol retrievals, and the retrieved AOT data in this study. Overall, the TERRA and AQUA MODIS aerosol retrievals are similar in both spatial pattern and magnitude, although there are approximately three hours apart during TERRA and AQUA overpasses. This partly demonstrates that aerosol distribution remains relatively stable during a short time interval (e.g., three hours). The TERRA-AQUA MODIS retrievals are generally in agreement with the MODIS products. High AOT values are observed in the southern and western areas, while low AOT values are observed in the eastern areas. However, our retrievals are 0.013 ± 0.311 higher than the TERRA MODIS retrievals, and 0.033 ± 0.313 higher than the AQUA MODIS retrievals. Note that the strip-like abnormal values occur where there are similar TERRA and AQUA MODIS view zenith angles.

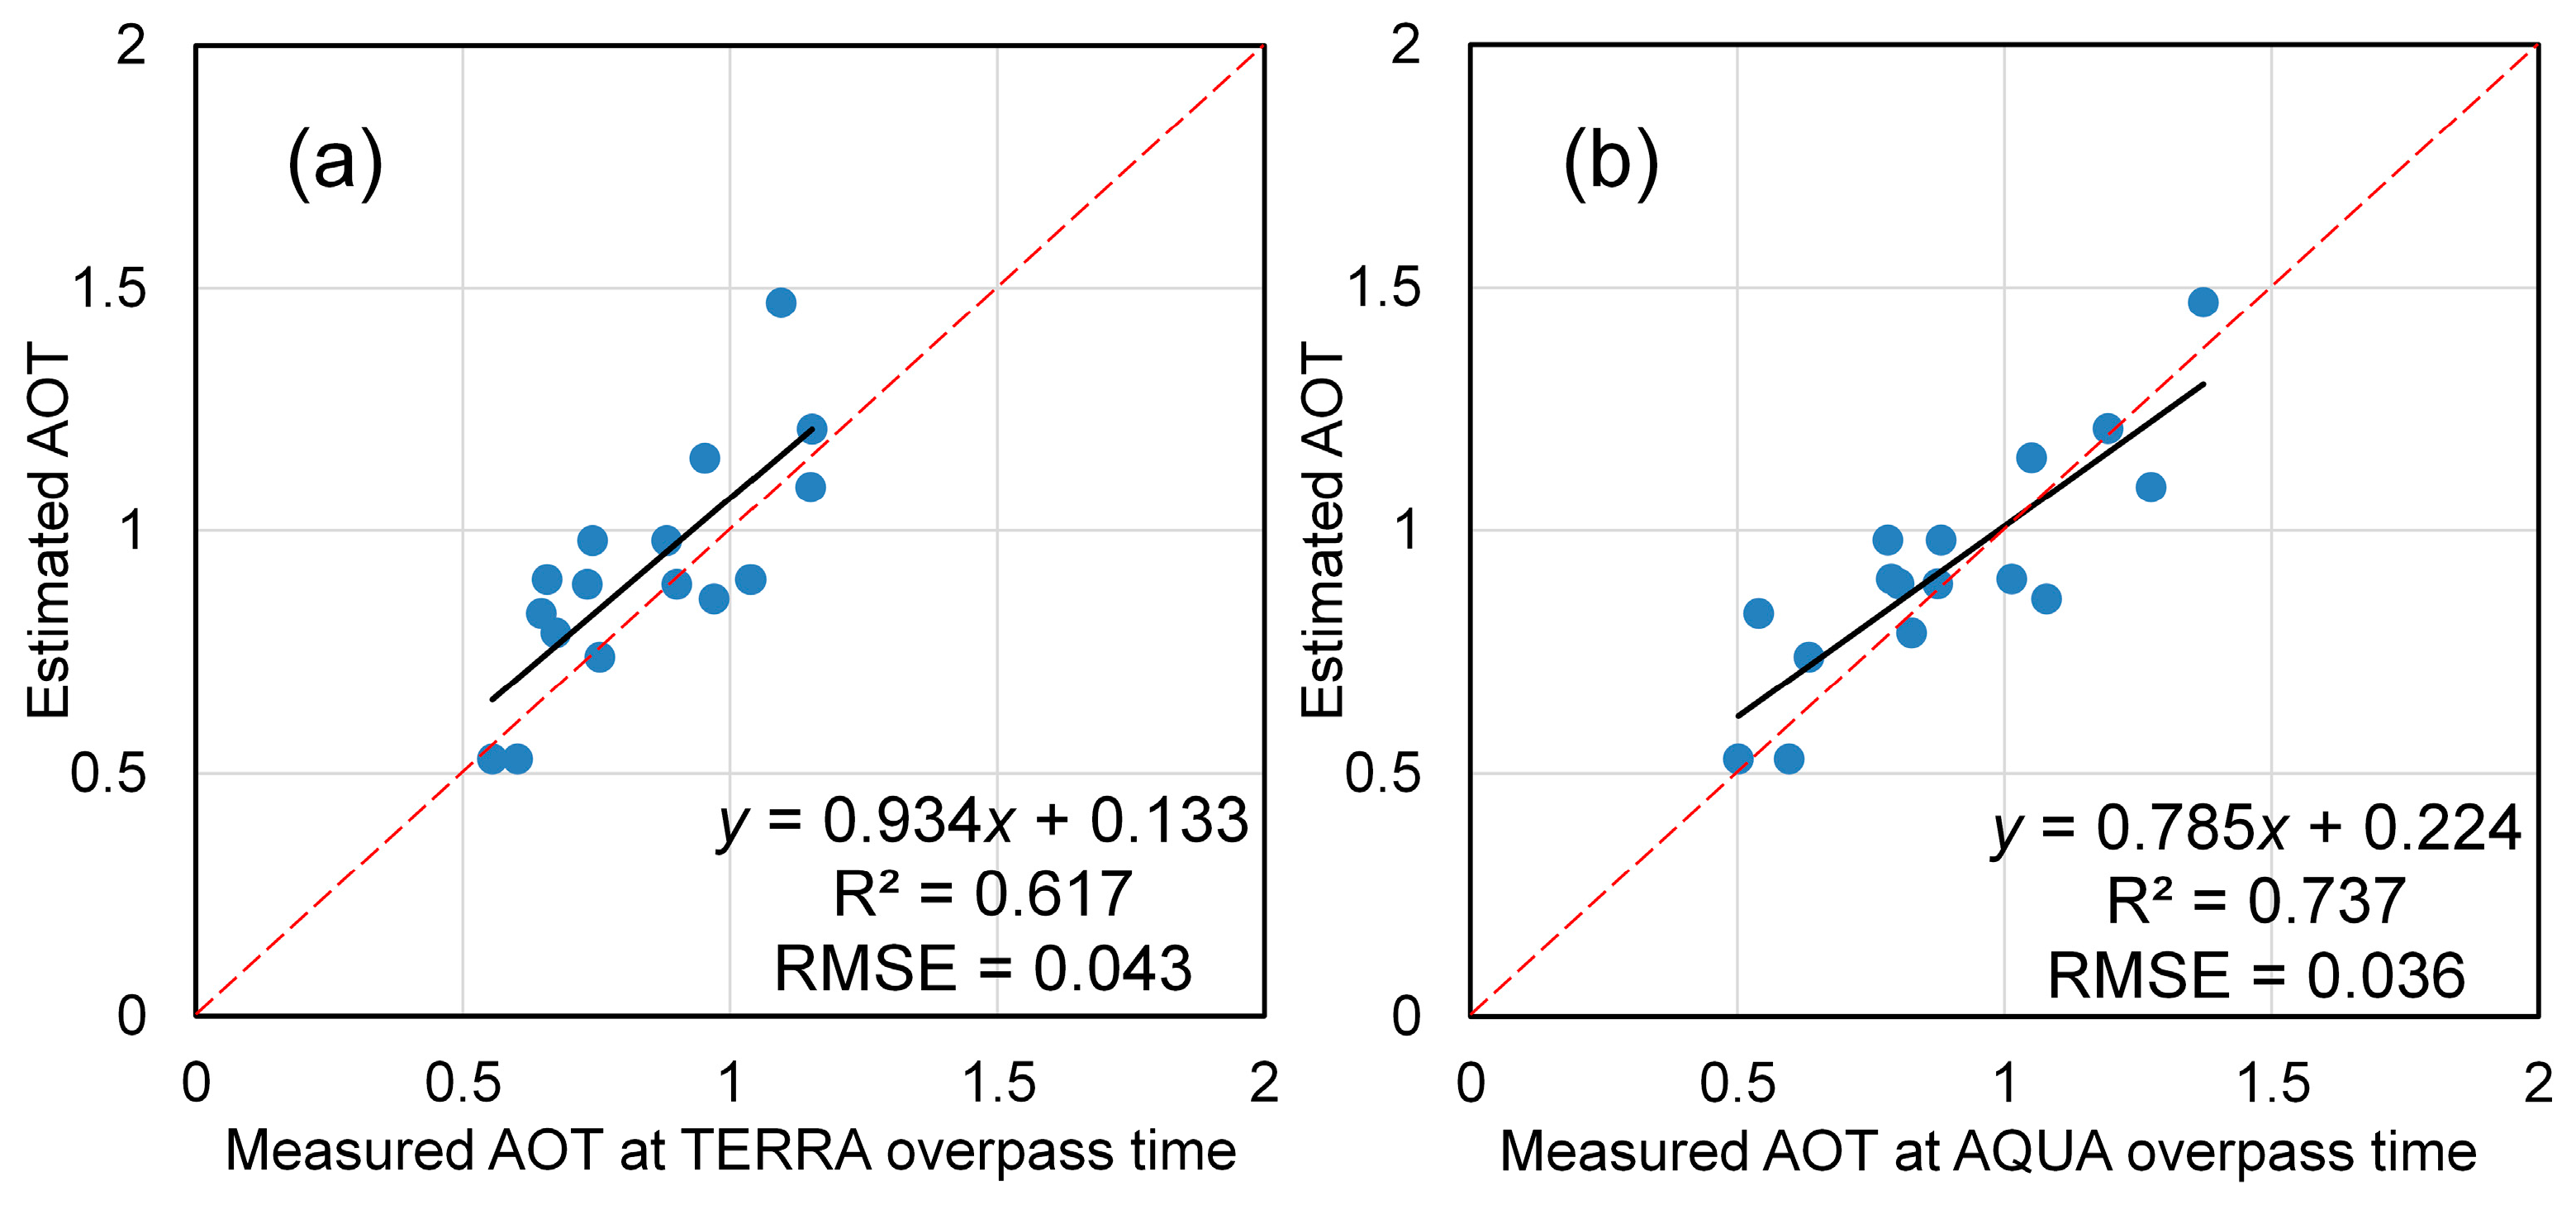
4.3.3. Comparisons with Sun Photometer AOT Retrievals

Comparisons of the TERRA-AQUA MODIS retrievals and the measured AOT data are shown in Figure 5. Due to frequent cloud coverages, there are only 15 cloud-free matches that can be used in 2016. At the TERRA overpass time, aerosol retrievals and measurements are highly correlated (y = 0.934x + 0.133; R2 = 0.617; RMSE = 0.043). Slightly better correlation can be found at the AQUA overpass time (y = 0.785x + 0.224; R2 = 0.737; RMSE = 0.036). The close similarities between aerosol measurements at TERRA and AQUA overpass time evidence the validity of our assumption that aerosol properties remain stable during dual sensor overpasses. The collocated comparisons between MODIS DT/DB retrievals and the TERRA-AQUA retrievals are shown in Figure 6. There are only four matches of DT retrievals and TERRA-AQUA retrievals due to the dense dark vegetation assumptions. Overall, both the DT and DB retrievals largely underestimate AOT. The underestimation is more significant for the MODIS DB retrievals.

4.4. The Sensitivity of Aerosol Retrieval to Critical Factors

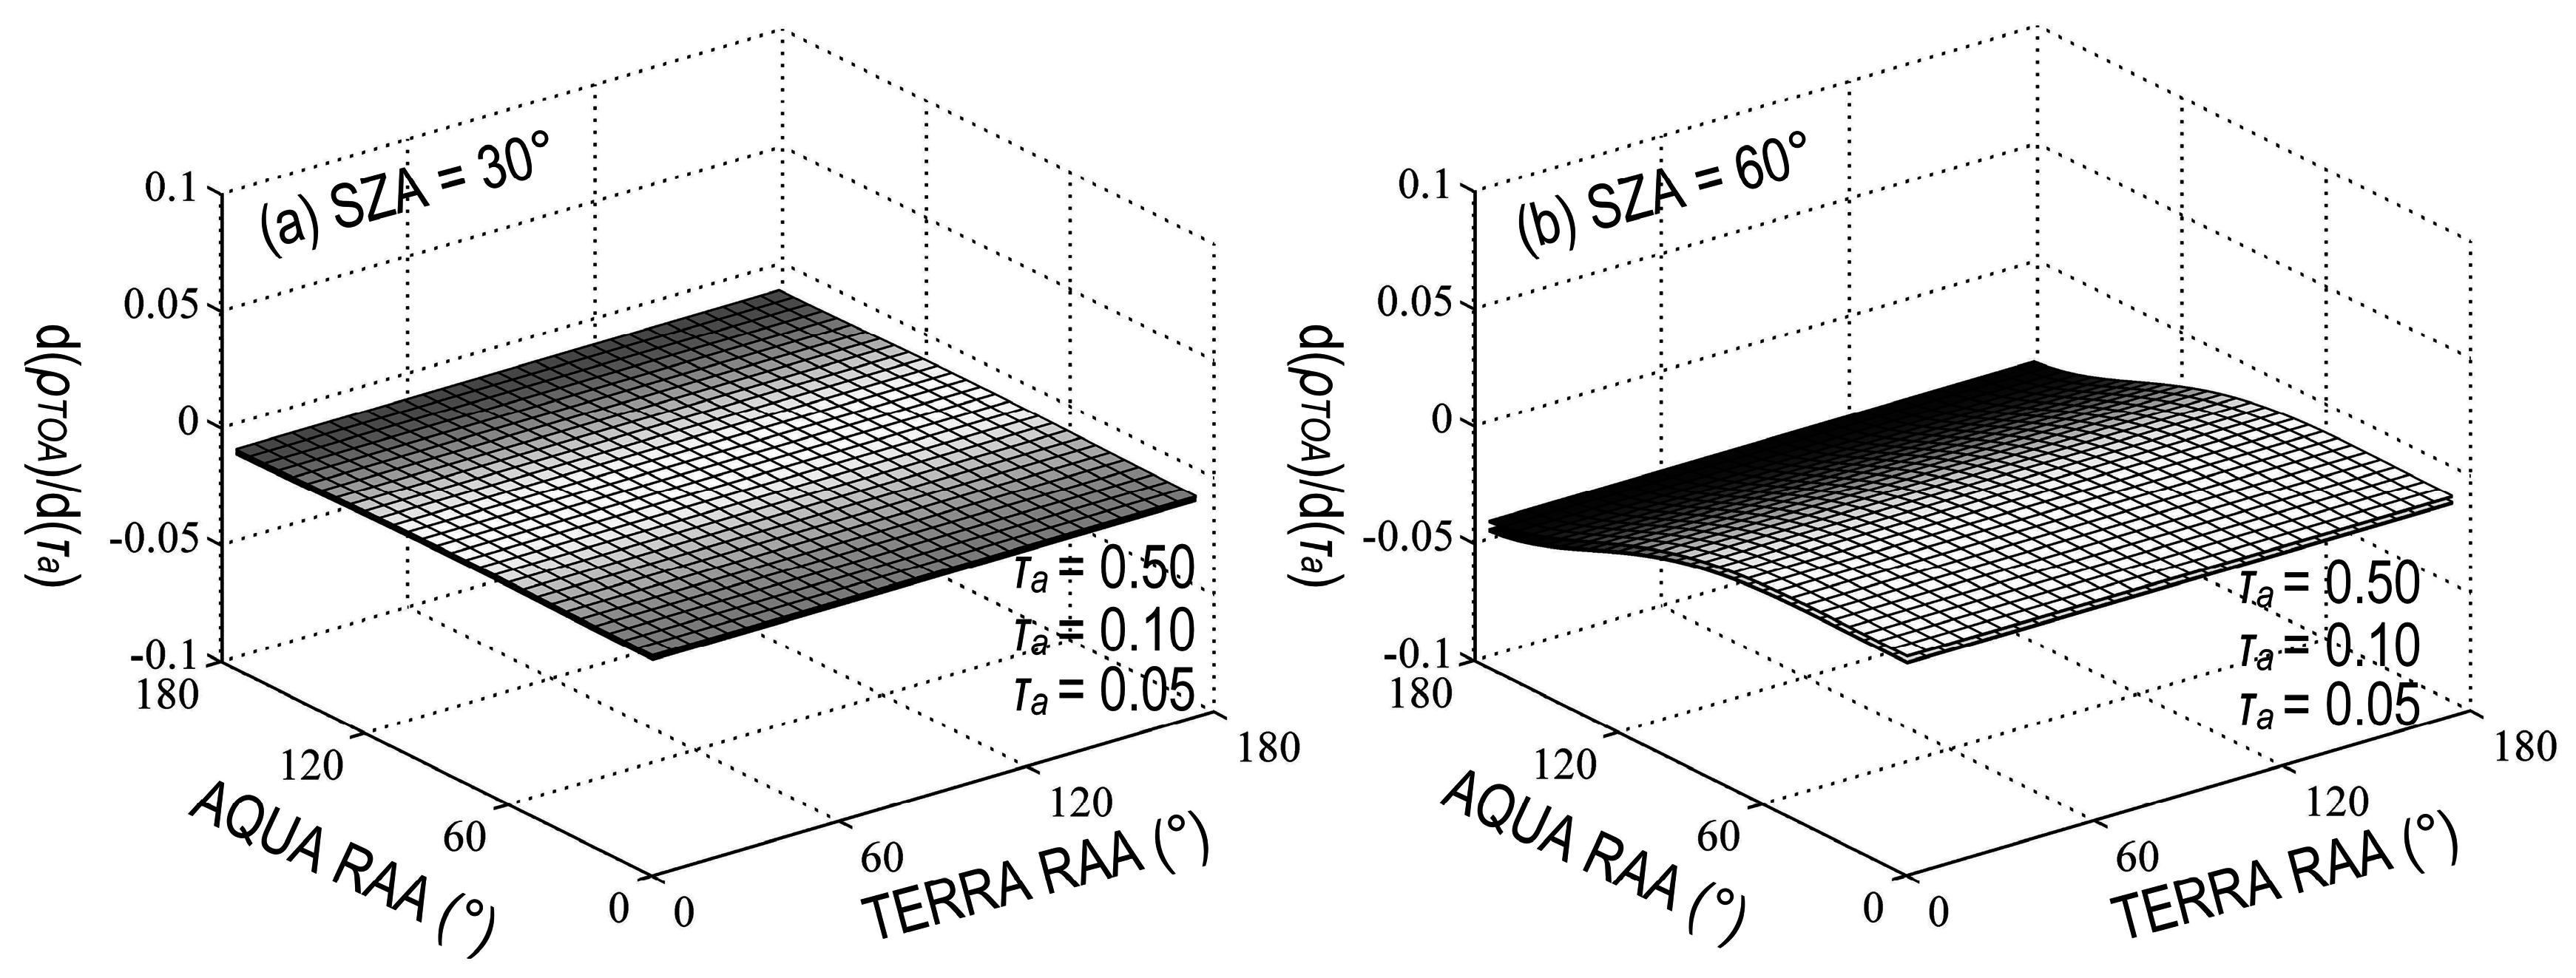
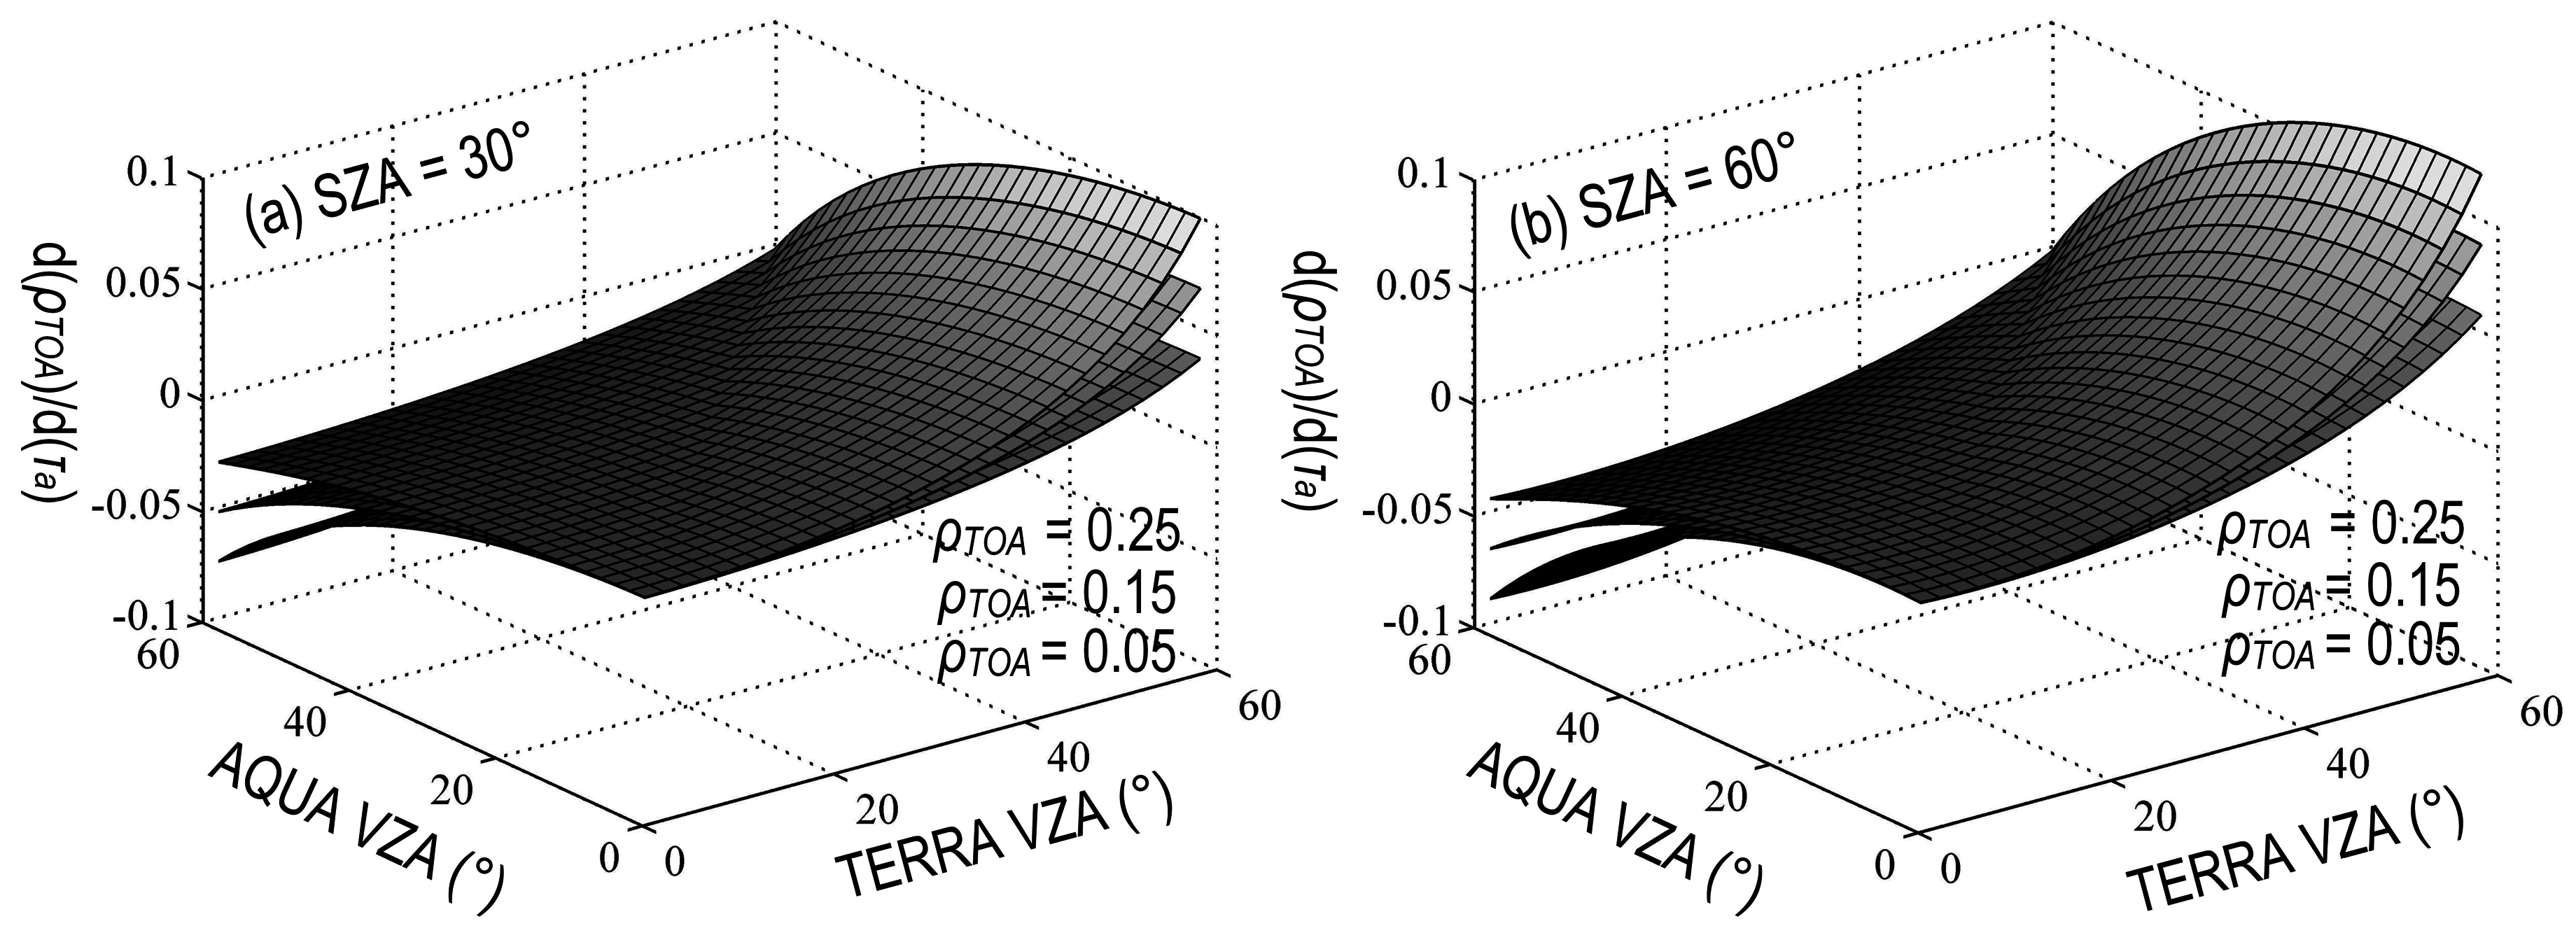
4.4.1. Angular Difference

In most cases, SZAs are similar for TERRA and AQUA MODIS sensors. Therefore, differences in VZAs determine most of the differences in atmospheric scattering and path radiance. The effects of VZA differences on aerosol retrieval are shown in Figure 7. Three major findings can be observed. First, the index β increases with absolute VZA difference. The value maximizes when AQUA VZA = 0° (minimized) and TERRA VZA = 60° (maximized). Specifically, when AQUA VZA = TERRA VZA, β = 0. In this case, satellite signals are insensitive to aerosol variation. Second, the index β increases with AOT. When other conditions remain unchanged, high AOT may correspond to a large β value. Third, the index β increases with SZA. Relative to the case of SZA = 30°, the index β exhibits an overall increase for the case of SZA = 60°. This can be observed when AOT = 0.05, AOT = 0.10, and AOT = 0.50. Overall, high index values generally occur when there are considerable VZA differences, high AOTs, or large SZAs.
RAA affects the bidirectional reflectance and the path radiance. The former effect can be treated using the band ratioing technique, and therefore the latter effect should be considered. The effects of RAA differences on aerosol retrieval are shown in Figure 8. For SZA = 30°, the index β is almost insensitive to RAA difference and independent of AOT. This also applies to SZA = 60° when AQUA RAA lies within 0–90°. While for AQUA RAA within 90–180°, the absolute value of index β increases with AQUA RAA. As a result, aerosol retrievals tend to be more accurate when the reference sensor (here referring to AQUA MODIS) observes in backward directions. However, the tendency is not significant for low SZAs.

4.4.2. Land Surface

Land surface is complicated and, in this study, it is approximated as TOA reflectance. The effects of land surface on aerosol retrieval are shown in Figure 9. Two major findings can be observed. First, the index β increases gradually with TOA reflectance when ρTOA = 0.05, ρTOA = 0.15 and ρTOA = 0.25. The increases are independent of SZA (SZA = 30° and 60°). Therefore, the satellite signal is more sensitive to aerosol variation over bright surfaces (e.g., bare soils) than dark surfaces (e.g., vegetated surfaces). Second, for the same underlying surface, the index β increases with SZA, indicating that TOA reflectance is more sensitive to aerosol variation at high SZAs. Overall, high β values occur over bright surfaces and at high SZAs.

4.4.3. BRDF Characterization

BRDF characterization is a critical step for separation of land surface contribution. The effects on aerosol retrieval are shown in Figure 10. Overall, the index β increases with the BRDF adjustment factor. To characterize the effects of BRDF characterization, the absolute difference of index values (when fSBAF = 0.8 and 1.2) is calculated. The maximum difference is 0.0301, 0.0396, 0.0490, and 0.0585, respectively for ρTOA = 0.05, ρTOA = 0.15, ρTOA = 0.25, and ρTOA = 0.35. Therefore, the effects of BRDF characterization are more significant for the bright surfaces (e.g., bare soils). Overall, minor differences in index β occur over dark surfaces.

5. Discussion

5.1. The Band Ratioing Technique for Aerosol Retrieval

The band ratioing technique is widely used for quantifying BRDF effects in dual-view aerosol retrieval algorithms. This technique can be also derived from the single-view MODIS operational DT algorithm. For DT algorithm, surface reflectances in the 0.47 μm and 0.66 μm bands are approximated as ρ0.47 = 0.25ρ2.13 and ρ0.66 = 0.5ρ2.13 [13]. Supposing that the relationships are independent of BRDF effects, the reflectance ratio in the 0.47 (0.66) μm band should be equated to that in the 2.13 μm band. However, Remer et al. [49] reveal that the specular reflection can severely corrupt these relationships. This may cause the significant scattering for the forest land cover type in Figure 1b. In general, the vegetated surfaces exhibit strong and complicated BRDF effects. Specifically, for the low reflective red band, it is more likely to generate abnormal ratio values (extremely large ratio values in Figure 1b). Except for extreme cases, the ratioing technique can still have a good performance over vegetated surfaces. The reflectance ratios at 0.645 μm, 0.859 μm, and 2.13 μm bands are shown in Figure 11. The BRDF effects in the visible and near-infrared bands are well characterized by the 2.13 μm band ratios. The relative difference is 0.05 ± 0.26 and 0.07 ± 0.25, respectively, for the 0.645 μm and 0.859 μm bands.
Because the ratioing technique may sometimes perform unsatisfactorily over vegetated surfaces, the effects on aerosol retrieval should be carefully investigated. In Figure 10, the variation range of index β implies the effect of biased BRDF adjustment factor on aerosol retrieval. Overall, the variation range increases with TOA reflectance. That is, for a vegetated (non-vegetated) surface, the effect of BRDF characterization is relatively minor (major). In summary, the BRDF effects may not be properly characterized over vegetated surfaces, however, the resulting effects on aerosol retrieval may not be so critical. On the contrary, the BRDF effects may be properly characterized over non-vegetated surfaces, however, the resulting effect on aerosol retrieval can still be considerable.

5.2. The Expalantions of Path Radiance Approximations

Path radiance results from Rayleigh scattering and aerosol scattering. The former depends on atmospheric molecules that are relatively stable in concentration, while the latter depends on aerosol properties that may vary in space and over time. The varying sun-target-sensor geometries further complicate path radiance approximations. Mathematically, Equation (5) provides a simple description of this complicated physical process. Equation (8) omits the forward atmospheric scattering and simplifies the effect of single scattering albedo to derive a regression model. In Equation (8), path radiance is linearly related to AOT, and inversely proportional to μs and μv. For a specific geometry, such as SZA = 60° and VZA = 0° in [37], μs, μv and the scattering angle (γ-) in Equation (8) are constant values. Therefore, linear functions can provide good approximations. To compensate for other unaccounted factors, the nonlinear functions in Kaufman [36] can be more accurate.
Path radiance approximation is generally complicated because solar zenith angle and view zenith angle may vary significantly. The varying angles not only have a direct impact on μs and μv, but also have an indirect impact on the phase functions and Fresnel reflection coefficients. Therefore, the existing linear and nonlinear functions may no longer apply to the cases of relaxed solar zenith angles, view zenith angles, and relative azimuth angles. Nevertheless, linear functions can still work when the variation ranges of solar zenith angles and/or view zenith angles are narrowed. For instance, linear functions are used when SZAs are confined to 0–60° and VZAs are confined to 0–10° in [38]. It is confirmed that linear functions are more accurate for small SZAs or VZAs. This is partly due to the weak dependence between the scattering angle and RAA. Note that the coefficients α and g in Equation (8) would be equated to zero when linear function is used for path radiance approximation. While in this study, the coefficients α and g are 0.55 and 0.35 for the continental aerosol model. These values vary with the aerosol model and a new set of values should be determined for other aerosol models.

5.3. Examination of the Continental Aerosol Model for Aerosol Retrieval

The microphysical properties of aerosol affect the calculation of atmospheric scattering in Equation (4) and the calculation of path radiance in Equation (8). Previous studies have investigated the effects of these properties on satellite observations [50] and atmospheric correction [51]. Because the microphysical properties of aerosol vary significantly in space and with time, aerosol models are predefined through cluster analysis [11,12]. The assumed aerosol models generally have an impact on aerosol retrieval from ground measurements [52] and on atmospheric correction of satellite images [53]. With regard to MODIS aerosol product, aerosol models include continental (Type 1), moderate absorption fine (Type 2), strong absorption fine (Type 3), weak absorption fine (Type 4), and dust coarse (Type 5). According to Mielonen et al. [54], non-absorption fine aerosol type corresponds to clean and polluted continental aerosols. Figure 12 shows time series of aerosol type information collected from TERRA and AQUA MODIS aerosol products. In spring and summer, aerosols belong to the moderate absorption type. While in autumn and winter (and probably early spring), aerosols belong to the weak absorption type. Therefore, it is likely that the assumed continental aerosol type is more suitable for aerosol retrieval in autumn and winter (and early spring). The aerosol map in Figure 4 is derived from TERRA/AQUA MODIS at DOY308. Most of the retrievals in Figure 5 are performed in the second half of 2016, because later spring and summer are rainy seasons over the validation site. The considerable accuracies may be consistent with the time when aerosols belong to the weak absorption type. It is speculated that the impact of the assumed aerosol type is seasonally dependent.

5.4. Contributions and Limitations of the Synergetic Method

This study proposes a synergetic TERRA-AQUA MODIS method for aerosol retrieval, assuming that aerosol properties undergo no abrupt changes during dual sensor overpasses. The retrievals are theoretically more accurate over the non-vegetated surfaces than the vegetated surfaces. Compared to the MODIS operational retrievals, the current method overcomes the general underestimation problems associated with DB and DT algorithms. Although further validations need to be performed over more AERONET sites, the preliminary validation results show the potential of this method. In an analytical form, the proposed method is computationally efficient and the uncertainties can be readily traceable using partial differential equations. As a result, MODIS aerosol products can be efficiently retrieved with a spatial resolution of 500m, or even 250m. These products are useful for monitoring regional aerosol generations and variations. In addition to spatially detailed aerosol retrievals, the method can be extended for historic aerosol retrievals. Because AVHRR sensor bands are spectrally similar within the second generation (AVHRR/2) and the third generation (AVHRR/3) [55], the within-generation AVHRR sensors can be synergized for aerosol retrieval. The synergies may improve the characterization of long-term aerosol properties and trends.
Despite all the advantages, the method in its current form still has some limitations and needs further improvements. First, the primary assumption is that aerosol properties remain stable during TERRA and AQUA MODIS overpasses. This assumption is dependent on the atmospheric situation, such as weather, wind, and temperature. For example, the assumption is false during the initial period or the ending period of a dust storm. Second, the current method predefines the continental model for aerosol retrieval, which is only valid for our study area. While an operational retrieval method should cover all aerosol properties. Future directions can be focused on simultaneous retrieval of AOT and the coefficients α and g. Third, our relationship is developed based on a Lambertian assumption, which may cause inaccurate estimates of surface reflectances. As a result, the differences in band ratio of the visible band and that of the 2.13 μm band may introduce additional uncertainties. Furthermore, the proposed method should be validated using more ground measurements.

6. Conclusions

This study proposed an analytical TERRA-AQUA MODIS relationship in the reflective solar bands for aerosol retrieval. The BRDF effects were treated using the band ratioing technique in the MODIS 2.13 μm band. The treatment generally performed better over non-vegetated than vegetated surfaces that have complicated BRDF effects. The path radiance was approximated as an analytical function of AOT and scattering phase function. By reference to the data from the 6S radiative transfer calculations, the approximation was promising for both the visible and near-infrared bands (R2 > 0.97; RMSE < 0.007). Subsequently, comparisons with MODIS TOA observations, MODIS operational aerosol retrievals, and ground measurements demonstrated the validity of the proposed relationship for aerosol retrieval. The TERRA-AQUA MODIS aerosol retrievals were generally higher than TERRA and AQUA MODIS operational retrievals, and temporally in agreement with ground measurements at the TERRA overpass time (R2 = 0.617; RMSE = 0.043) and the AQUA overpass time (R2 = 0.737; RMSE = 0.036).
Sensitivity analyses show that the proposed synergetic method has good performance over bright surfaces, which may provide a candidate complement to the MODIS operational DT and DB algorithms. In an analytical form, the method is computationally efficient that can be appropriate to generate fine-scale MODIS aerosol products at spatial resolutions of 500 m and 250 m. Meanwhile, we are aware that the current method is far from being operational. Future directions should include simultaneous retrieval of AOT and other aerosol properties and more comprehensive validations. It is anticipated that the proposed TERRA-AQUA MODIS relationship can provide insight into other applications regarding dual-MODIS images.

Acknowledgments

This study was supported in part by the National Natural Science Foundation of China under Grant No. 41171272 and in part by the talent introduction project of the Nanjing Institute of Limnology and Geography, Chinese Academy of Sciences under Grant No. NIGLAS2015QD08. TERRA and AQUA MODIS data sets were acquired from LAADS Web Level 1 and the Atmosphere Archive and Distribution System, Goddard Space Flight Center (GSFC) (https://ladsweb.nascom.nasa.gov/). We would like to express our thanks to Bo Zhong with the Institute of Remote Sensing and Digital Earth, Chinese Academy of Sciences (CAS) for providing the BRDF data.

Author Contributions

X.F. analyzed the data and wrote the paper. Y.L. provided critical guidance on the main idea.

Conflicts of Interest

The authors declare no conflict of interest.

References

  1. Stowe, L.L.; Jacobowitz, H.; Ohring, G.; Knapp, K.R.; Nalli, N.R. The advanced very high resolution radiometer (AVHRR) pathfinder atmosphere (PATMOS) climate dataset: Initial analyses and evaluations. J. Clim. 2002, 15, 1243–1260. [Google Scholar] [CrossRef]
  2. Mishchenko, M.I.; Geogdzhayev, I.V.; Cairns, B.; Carlson, B.E.; Chowdhary, J.; Lacis, A.A.; Liu, L.; Rossow, W.B.; Travis, L.D. Past, present, and future of global aerosol climatologies derived from satellite observations: A perspective. J. Quant. Spectrosc. Radiat. Transfer 2007, 106, 325–347. [Google Scholar] [CrossRef]
  3. Intergovernmental Panel on Climate Change (IPCC). Climate Change 2013: The Physical Science Basis. Contribution of Working Group I to the Fifth Assessment Report of the Intergovernmental Panel on Climate Change; Stocker, T.F., Qin, D., Plattner, G.-K., Tignor, M., Allen, S.K., Boschung, J., Nauels, A., Xia, Y., Bex, V., Midgley, P.M., Eds.; Cambridge University Press: Cambridge, UK; New York, NY, USA, 2013. [Google Scholar]
  4. Li, Z.; Zhao, X.; Kahn, R.; Mishchenko, M.; Remer, L.; Lee, K.H.; Wang, M.; Laszlo, I.; Nakajima, T.; Maring, H. Uncertainties in satellite remote sensing of aerosols and impact on monitoring its long-term trend: A review and perspective. Ann. Geophys. 2009, 27, 2755–2770. [Google Scholar] [CrossRef]
  5. Wong, M.S.; Nichol, J.E.; Lee, K.H. An operational MODIS aerosol retrieval algorithm at high spatial resolution, and its application over a complex urban region. Atmos. Res. 2011, 99, 579–589. [Google Scholar] [CrossRef]
  6. Bilal, M.; Nichol, J.E.; Bleiweiss, M.P.; Dubois, D. A simplified high resolution MODIS Aerosol Retrieval Algorithm (SARA) for use over mixed surfaces. Remote Sens. Environ. 2013, 136, 135–145. [Google Scholar] [CrossRef]
  7. Vermote, E.F.; Tanré, D.; Deuze, J.L.; Herman, M.; Morcette, J.J. Second simulation of the satellite signal in the solar spectrum, 6S: An overview. IEEE Trans. Geosci. Remote Sens. 1997, 35, 675–686. [Google Scholar] [CrossRef]
  8. King, M.D.; Kaufman, Y.J.; Tanré, D.; Nakajima, T. Remote sensing of tropospheric aerosols from space: Past, present, and future. Bull. Am. Meteorol. Soc. 1999, 80, 2229–2259. [Google Scholar] [CrossRef]
  9. Stowe, L.L.; Ignatov, A.M.; Singh, R.R. Development, validation, and potential enhancements to the second-generation operational aerosol product at the National Environmental Satellite, Data, and Information Service of the National Oceanic and Atmospheric Administration. J. Geophys. Res. 1997, 102, 16923–16934. [Google Scholar] [CrossRef]
  10. Li, Y.; Xue, Y.; de Leeuw, G.; Li, C.; Yang, L.; Hou, T.; Marir, F. Retrieval of aerosol optical depth and surface reflectance over land from NOAA AVHRR data. Remote Sens. Environ. 2013, 133, 1–20. [Google Scholar] [CrossRef]
  11. Omar, A.H.; Won, J.G.; Winker, D.M.; Yoon, S.C.; Dubovik, O.; McCormick, M.P. Development of global aerosol models using cluster analysis of Aerosol Robotic Network (AERONET) measurements. J. Geophys. Res. 2005, 110. [Google Scholar] [CrossRef]
  12. Levy, R.C.; Remer, L.A.; Dubovik, O. Global aerosol optical properties and application to Moderate Resolution Imaging Spectroradiometer aerosol retrieval over land. J. Geophys. Res. 2007, 112. [Google Scholar] [CrossRef]
  13. Kaufman, Y.J.; Tanré, D.; Remer, L.A.; Vermote, E.F.; Chu, A.; Holben, B.N. Operational remote sensing of tropospheric aerosol over land from EOS moderate resolution imaging spectroradiometer. J. Geophys. Res. 1997, 102, 17051–17067. [Google Scholar] [CrossRef]
  14. Remer, L.A.; Kaufman, Y.J.; Tanré, D.; Mattoo, S.; Chu, D.A.; Martins, J.V.; Li, R.R.; Ichoku, C.; Levy, R.C.; Kleidman, R.G.; et al. The MODIS aerosol algorithm, products, and validation. J. Atmos. Sci. 2005, 62, 947–973. [Google Scholar] [CrossRef]
  15. Oo, M.M.; Jerg, M.; Hernandez, E.; Picon, A.; Gross, B.M.; Moshary, F.; Ahmed, S.A. Improved MODIS aerosol retrieval using modified VIS/SWIR surface albedo ratio over urban scenes. IEEE Trans. Geosci. Remote Sens. 2010, 48, 983–1000. [Google Scholar] [CrossRef]
  16. Hsu, N.C.; Tsay, S.C.; King, M.D.; Herman, J.R. Aerosol properties over bright-reflecting source regions. IEEE Trans. Geosci. Remote Sens. 2004, 42, 557–569. [Google Scholar] [CrossRef]
  17. Hsu, N.C.; Jeong, M.J.; Bettenhausen, C.; Sayer, A.M.; Hansell, R.; Seftor, C.S.; Huang, J.; Tsay, S.C. Enhanced Deep Blue aerosol retrieval algorithm: The second generation. J. Geophys. Res. 2013, 118, 9296–9315. [Google Scholar] [CrossRef]
  18. Levy, R.C.; Remer, L.A.; Kleidman, R.G.; Mattoo, S.; Ichoku, C.; Kahn, R.; Eck, T.F. Global evaluation of the Collection 5 MODIS dark-target aerosol products over land. Atmos. Chem. Phys. 2010, 10, 10399–10420. [Google Scholar] [CrossRef] [Green Version]
  19. Bilal, M.; Nichol, J.E. Evaluation of MODIS aerosol retrieval algorithms over the Beijing-Tianjin-Hebei region during low to very high pollution events. J. Geophys. Res. 2015, 120, 7941–7957. [Google Scholar] [CrossRef]
  20. Sayer, A.M.; Munchak, L.A.; Hsu, N.C.; Levy, R.C.; Bettenhausen, C.; Jeong, M.J. MODIS Collection 6 aerosol products: Comparison between Aqua's e-Deep Blue, Dark Target, and “merged” data sets, and usage recommendations. J. Geophys. Res. 2014, 119, 13965–13989. [Google Scholar] [CrossRef]
  21. Tao, M.; Chen, L.; Wang, Z.; Tao, J.; Che, H.; Wang, X.; Wang, Y. Comparison and evaluation of the MODIS Collection 6 aerosol data in China. J. Geophys. Res. 2015, 120, 6992–7005. [Google Scholar] [CrossRef]
  22. Li, C.; Lau, A.H.; Mao, J.; Chu, D.A. Retrieval, validation, and application of the 1-km aerosol optical depth from MODIS measurements over Hong Kong. IEEE Trans. Geosci. Remote Sens. 2005, 43, 2650–2658. [Google Scholar]
  23. Wang, Y.; Xue, Y.; Li, Y.; Guang, J.; Mei, L.; Xu, H.; Ai, J. Prior knowledge-supported aerosol optical depth retrieval over land surfaces at 500 m spatial resolution with MODIS data. Int. J. Remote Sens. 2012, 33, 674–691. [Google Scholar] [CrossRef]
  24. Bilal, M.; Nichol, J.E.; Chan, P.W. Validation and accuracy assessment of a Simplified Aerosol Retrieval Algorithm (SARA) over Beijing under low and high aerosol loadings and dust storms. Remote Sens. Environ. 2014, 153, 50–60. [Google Scholar] [CrossRef]
  25. Lee, K.H.; Li, Z.; Kim, Y.J.; Kokhanovsky, A. Atmospheric aerosol monitoring from satellite observations: A history of three decades. In Atmospheric and Biological Environmental Monitoring; Springer: Heidelberg, Germany, 2009; pp. 13–38. [Google Scholar]
  26. Martonchik, J.V.; Diner, D.J. Retrieval of aerosol optical properties from multi-angle satellite imagery. IEEE Trans. Geosci. Remote Sens. 1992, 30, 223–230. [Google Scholar] [CrossRef]
  27. Diner, D.J.; Martonchik, J.V.; Kahn, R.A.; Pinty, B.; Gobron, N.; Nelson, D.L.; Holben, B.N. Using angular and spectral shape similarity constraints to improve MISR aerosol and surface retrievals over land. Remote Sens. Environ. 2005, 94, 155–171. [Google Scholar] [CrossRef]
  28. Tanré, D.; Bréon, F.M.; Deuzé, J.L.; Dubovik, O.; Ducos, F.; François, P.; Goloub, P.; Herman, M.; Lifermann, A.; Waquet, F. Remote sensing of aerosols by using polarized, directional and spectral measurements within the A-Train: The PARASOL mission. Atmos. Meas. Tech. 2011, 4, 1383–1395. [Google Scholar] [CrossRef] [Green Version]
  29. Zhang, Y.; Li, Z.; Qie, L.; Zhang, Y.; Liu, Z.; Chen, X.; Hou, W.; Li, K.; Xu, H. Retrieval of aerosol fine-mode fraction from intensity and polarization measurements by PARASOL over East Asia. Remote Sens. 2016, 8, 417. [Google Scholar] [CrossRef]
  30. Davies, W.H.; North, P.R.; Grey, W.M.; Barnsley, M.J. Improvements in aerosol optical depth estimation using multiangle CHRIS/PROBA images. IEEE Trans. Geosci. Remote Sens. 2010, 48, 18–24. [Google Scholar] [CrossRef]
  31. Martonchik, J.V.; Diner, D.J.; Kahn, R.A.; Ackerman, T.P.; Verstraete, M.M.; Pinty, B.; Gordon, H.R. Techniques for the retrieval of aerosol properties over land and ocean using multiangle imaging. IEEE Trans. Geosci. Remote Sens. 1998, 36, 1212–1227. [Google Scholar] [CrossRef]
  32. Veefkind, J.P.; de Leeuw, G.; Durkee, P.A. Retrieval of aerosol optical depth over land using two-angle view satellite radiometry during TARFOX. Geophys. Res. Lett. 1998, 25, 3135–3138. [Google Scholar] [CrossRef]
  33. Veefkind, J.P.; de Leeuw, G.; Stammes, P.; Koelemeijer, R.B. Regional distribution of aerosol over land, derived from ATSR-2 and GOME. Remote Sens. Environ. 2000, 74, 377–386. [Google Scholar] [CrossRef]
  34. Tang, J.; Xue, Y.; Yu, T.; Guan, Y. Aerosol optical thickness determination by exploiting the synergy of TERRA and AQUA MODIS. Remote Sens. Environ. 2005, 94, 327–334. [Google Scholar] [CrossRef]
  35. Rahman, H.; Dedieu, G. SMAC: A simplified method for the atmospheric correction of satellite measurements in the solar spectrum. Int. J. Remote Sens. 1994, 15, 123–143. [Google Scholar] [CrossRef]
  36. Kaufman, Y.J. Aerosol optical thickness and atmospheric path radiance. J. Geophys. Res. 1993, 98, 2677–2692. [Google Scholar] [CrossRef]
  37. Oliveros, C.S.; Reyes, F.O.; Alados-Arboledas, L. Determination of aerosol optical thickness from measurements of spectral sky radiance. J. Aerosol Sci. 1998, 29, 1199–1211. [Google Scholar] [CrossRef]
  38. Fan, X.; Liu, Y. Quantifying the relationship between intersensor images in solar reflective bands: Implications for intercalibration. IEEE Trans. Geosci. Remote Sens. 2014, 52, 7727–7737. [Google Scholar]
  39. Fan, X.; Liu, Y.; Tao, J.; Weng, Y. Soil salinity retrieval from advanced multi-spectral sensor with partial least square regression. Remote Sens. 2015, 7, 488–511. [Google Scholar] [CrossRef]
  40. Antoine, D.; Morel, A. Relative importance of multiple scattering by air molecules and aerosols in forming the atmospheric path radiance in the visible and near-infrared parts of the spectrum. Appl. Opt. 1998, 37, 2245–2259. [Google Scholar] [CrossRef] [PubMed]
  41. Deuzé, J.L.; Bréon, F.M.; Devaux, C.; Goloub, P.H.; Herman, M.; Lafrance, B.; Maignan, F.; Marchand, A.; Nadal, F.; Perry, G.; et al. Remote sensing of aerosols over land surfaces from POLDER-ADEOS-1 polarized measurements. J. Geophys. Res. 2001, 106, 4913–4926. [Google Scholar] [CrossRef]
  42. El Saleous, N.Z.; Vermote, E.F.; Justice, C.O.; Townshend, J.R.G.; Tucker, C.J.; Goward, S.N. Improvements in the global biospheric record from the advanced very high resolution radiometer (AVHRR). Int. J. Remote Sens. 2000, 21, 1251–1277. [Google Scholar] [CrossRef]
  43. Sharma, S.K. A review of approximate analytic light-scattering phase functions. In Light Scattering Reviews 9; Springer: Berlin, Germany, 2015; pp. 53–100. [Google Scholar]
  44. Draine, B.T. Scattering by interstellar dust grains. I. Optical and ultraviolet. Astrophys. J. 2003, 598, 1017–1025. [Google Scholar] [CrossRef]
  45. Flowerdew, R.J.; Haigh, J.D. An approximation to improve accuracy in the derivation of surface reflectances from multi-look satellite radiometers. Geophys. Res. Lett. 1995, 22, 1693–1696. [Google Scholar] [CrossRef]
  46. Vermote, E.; Justice, C.O.; Bréon, F.M. Towards a generalized approach for correction of the BRDF effect in MODIS directional reflectances. IEEE Trans. Geosci. Remote Sens. 2009, 47, 898–908. [Google Scholar] [CrossRef]
  47. Kotchenova, S.Y.; Vermote, E.F.; Matarrese, R.; Klemm, F.J., Jr. Validation of a vector version of the 6S radiative transfer code for atmospheric correction of satellite data. Part I: Path radiance. Appl. Opt. 2006, 45, 6762–6774. [Google Scholar] [CrossRef] [PubMed]
  48. Kotchenova, S.Y.; Vermote, E.F. Validation of a vector version of the 6S radiative transfer code for atmospheric correction of satellite data. Part II. Homogeneous Lambertian and anisotropic surfaces. Appl. Opt. 2007, 46, 4455–4464. [Google Scholar] [CrossRef] [PubMed]
  49. Remer, L.A.; Wald, A.E.; Kaufman, Y.J. Angular and seasonal variation of spectral surface reflectance ratios: Implications for the remote sensing of aerosol over land. IEEE Trans. Geosci. Remote Sens. 2001, 39, 275–283. [Google Scholar] [CrossRef]
  50. Bassani, C.; Cavalli, R.M.; Antonelli, P. Influence of aerosol and surface reflectance variability on hyperspectral observed radiance. Atmos. Meas. Tech. 2012, 5, 1193–1203. [Google Scholar] [CrossRef] [Green Version]
  51. Bassani, C.; Manzo, C.; Braga, F.; Bresciani, M.; Giardino, C.; Alberotanza, L. The impact of the microphysical properties of aerosol on the atmospheric correction of hyperspectral data in coastal waters. Atmos. Meas. Tech. 2015, 8, 1593–1604. [Google Scholar] [CrossRef]
  52. Dubovik, O.; Smirnov, A.; Holben, B.N.; King, M.D.; Kaufman, Y.J.; Eck, T.F.; Slutsker, I. Accuracy assessments of aerosol optical properties retrieved from Aerosol Robotic Network (AERONET) Sun and sky radiance measurements. J. Geophys. Res. 2000, 105, 9791–9806. [Google Scholar] [CrossRef]
  53. Tirelli, C.; Curci, G.; Manzo, C.; Tuccella, P.; Bassani, C. Effect of the aerosol model assumption on the atmospheric correction over land: Case studies with CHRIS/PROBA hyperspectral images over Benelux. Remote Sens. 2015, 7, 8391–8415. [Google Scholar] [CrossRef] [Green Version]
  54. Mielonen, T.; Arola, A.; Komppula, M.; Kukkonen, J.; Koskinen, J.; de Leeuw, G.; Lehtinen, K.E.J. Comparison of CALIOP level 2 aerosol subtypes to aerosol types derived from AERONET inversion data. Geophys. Res. Lett. 2009, 36. [Google Scholar] [CrossRef]
  55. Fan, X.W.; Liu, Y.B. A global study of NDVI difference among moderate-resolution satellite sensors. ISPRS J. Photogramm. Remote Sen. 2016, 121, 177–191. [Google Scholar] [CrossRef]
Figure 1. The performances of reflectance ratios at the mid-infrared band (2200 nm) to approximate those at the red band (606 nm) and those at the near-infrared band (866 nm) for (a) the bog and (b) the forest land cover types.
Remotesensing 08 00996 g001
Figure 2. Comparisons of the calculated path radiances (6S model) and the estimated path radiances (analytical model) in (a) the red and (b) the near-infrared bands.
Remotesensing 08 00996 g002
Figure 3. Comparisons of TOA reflectances in (a) the red and (b) the near-infrared bands. The left frame denotes TERRA MODIS band reflectances, the middle frame denotes the corresponding AQUA MODIS band reflectances, and the right frame denotes the modeled TERRA MODIS band reflectances.
Remotesensing 08 00996 g003
Figure 4. Comparison of AOT data at 550 nm. The left frame denotes TERRA MODIS aerosol retrieval, the middle frame denotes AQUA MODIS retrieval, and the right frame denotes the aerosol retrievals in this study.
Remotesensing 08 00996 g004
Figure 5. Comparisons of the TERRA-AQUA aerosol retrievals and the sun photometer aerosol measurements at (a) the TERRA overpass time and (b) the AQUA overpass time.
Remotesensing 08 00996 g005
Figure 6. Comparisons of the TERRA-AQUA aerosol retrievals and (a) the TERRA MODIS retrievals and (b) the AQUA MODIS retrievals. DT represents dark target algorithm and DB represents dark blue algorithm.
Remotesensing 08 00996 g006
Figure 7. The effects of VZA difference on aerosol retrieval under different levels of AOT (AOT = 0.05; 0.10; 0.50) for (a) SZA = 30° and (b) SZA = 60°.
Remotesensing 08 00996 g007
Figure 8. The effects of dual-view RAA difference on aerosol retrieval under different levels of AOT (AOT = 0.05; 0.10; 0.50) for (a) SZA = 30° and (b) SZA = 60°.
Remotesensing 08 00996 g008
Figure 9. The effects of land surface (TOA reflectance = 0.05; 0.15; 0.25) on aerosol retrieval for (a) SZA = 30° and (b) SZA = 60°.
Remotesensing 08 00996 g009
Figure 10. The effects of BRDF adjustment factor (fBRDF = 0.8; 0.9; 1.0; 1.1; 1.2) on aerosol retrieval for (a) TOA reflectance = 0.05; (b) TOA reflectance = 0.15; (c) TOA reflectance = 0.25; and (d) TOA reflectance = 0.35.
Remotesensing 08 00996 g010
Figure 11. Comparisons of TERRA and AQUA MODIS band ratios in the (a) 0.645 μm, (b) 0.859 μm, and (c) 2.13 μm bands.
Remotesensing 08 00996 g011
Figure 12. Time series (January 1–September 30, 2016) of aerosol type information collected from (a) TERRA and (b) AQUA MODIS aerosol products.
Remotesensing 08 00996 g012
Table 1. Symbols and definitions.
SymbolsDefinitionsDimension/Units
ρas, ρrsSingle scattering reflectance of aerosol and RayleighDimensionless
τa, τrOptical thickness of aerosol and Rayleigh scatteringDimensionless
ωa, ωrSingle scattering albedo of aerosol and Rayleigh scatteringDimensionless
Pa, PrScattering phase function of aerosol and Rayleigh scatteringsr−1
pa, prIntermediate variables related to Pa and Prsr−1
θs, θvSolar zenith angle (SZA) and sensor zenith angle (VZA)Degrees
μs, μvμs = cos(θs) and μv = cos(θv)Dimensionless
ρF(θ)Fresnel reflection coefficient for angle θDimensionless
PD(θ)Draine’s phase function at angle θsr−1
γ±Scattering angle in forward (+) and backward (-) directionsDegrees
α, gParameters of Draine’s phase functionDimensionless
ρSurface reflectanceDimensionless
ρpathTotal path radiance caused by aerosol and Rayleigh scatteringDimensionless
ρTOATop-of-atmosphere reflectanceDimensionless
λWavelengthnm
ΔφDifference between solar and view azimuth anglesDegrees
TAtmospheric scatteringDimensionless
TgAtmospheric absorptionDimensionless
TOCTotal ozone concentrationcm·atm−1
TPWTotal precipitable water vaporg·cm−2
BRDFBidirectional reflectance distribution functionDimensionless
fBRDFBRDF adjustment factorDimensionless
Table 2. Summary of the validations in this study. R2 is coefficient of determination, RMSE is root mean square error, ME is mean error, and SD is standard deviation.
Validation ItemsData SourcesData for ComparisonMetrics
Band ratioing techniqueBRDF datasetBand ratiosR2
Path radiance approximation6S calculationsPath radiancesR2, RMSE
TERRA-MODIS relationshipMOD(MYD) 02/03/04/07TOA reflectancesME ± SD
TERRA-MODIS AOT retrievalMOD(MYD) 02/03/04/07AOT retrievalsME ± SD
TERRA-MODIS AOT retrievalSunphotometer dataAOT retrievalsR2, RMSE

