Next Issue
Volume 9, January
Previous Issue
Volume 8, November
 
 
remotesensing-logo

Journal Browser

Journal Browser
From the start of 2016, the journal uses article numbers instead of page numbers to identify articles. If you are required to add page numbers to a citation, you can do with using a colon in the format [article number]:1–[last page], e.g. 10:1–20.

Remote Sens., Volume 8, Issue 12 (December 2016) – 68 articles

Cover Story (view full-size image): 
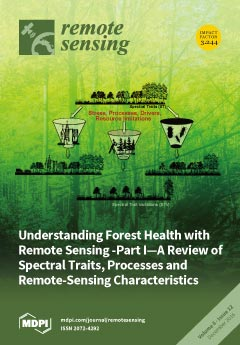
A framework is presented for conceptualizing and understanding forest health using remote sensing.
Remote sensing is a crucial technique for recording spectral radiance or reflectance associated with forest characteristics. Distinct “spectral traits” (ST) and “spectral trait variations” (STV) over space and time (Figure 3) can serve as indicators of forest health and condition. They help us to understand, explain and predict organism occurrence and how organisms interact with different stressors, disturbances or resource limitations. Furthermore, ST and STV can be used to assess the types of drivers and processes that produce environmental change, thereby impacting forest health (Figure 6).
This paper describes the applicability, advantages and limitations of remote sensing for assessing and monitoring forest health within the context of taxonomic, structural and functional diversity. View this paper
  • Issues are regarded as officially published after their release is announced to the table of contents alert mailing list.
  • You may sign up for e-mail alerts to receive table of contents of newly released issues.
  • PDF is the official format for papers published in both, html and pdf forms. To view the papers in pdf format, click on the "PDF Full-text" link, and use the free Adobe Reader to open them.
Order results
Result details
Section
Select all
Export citation of selected articles as:
3800 KiB  
Article
The Potential Impact of Vertical Sampling Uncertainty on ICESat-2/ATLAS Terrain and Canopy Height Retrievals for Multiple Ecosystems
by Amy L. Neuenschwander and Lori A. Magruder
Remote Sens. 2016, 8(12), 1039; https://doi.org/10.3390/rs8121039 - 21 Dec 2016
Cited by 78 | Viewed by 8646
Abstract
With a planned launch no later than September 2018, the Ice, Cloud and land Elevation Satellite-2 (ICESat-2) will provide a global distribution of geodetic elevation measurements for both the terrain surface and relative canopy heights. The Advanced Topographic Laser Altimeter System (ATLAS) instrument [...] Read more.
With a planned launch no later than September 2018, the Ice, Cloud and land Elevation Satellite-2 (ICESat-2) will provide a global distribution of geodetic elevation measurements for both the terrain surface and relative canopy heights. The Advanced Topographic Laser Altimeter System (ATLAS) instrument on-board ICESat-2 is a LiDAR system sensitive to the photon level. The photon-counting technology has many advantages for space-based altimetry, but also has challenges, particularly with delineating the signal from background noise. As such, a current unknown facing the ecosystem community is the performance of ICESat-2 for terrain and canopy height retrievals. This paper aims to provide the science user community of ICESat-2 land/vegetation data products with a realistic understanding of the performance characteristics and potential uncertainties related to the vertical sampling error, which includes the error in the perceived height value and the measurement precision. Terrain and canopy heights from simulated ICESat-2 data are evaluated against the airborne LiDAR ground truth values to provide a baseline performance uncertainty for multiple ecosystems. Simulation results for wooded savanna and boreal forest result in a mean bias error and error uncertainty (precision) for terrain height retrievals at 0.06 m (0.24 m RMSE) and −0.13 m (0.77 m RMSE). In contrast, results over ecosystems with dense vegetation show terrain errors of 1.93 m (1.66 m RMSE) and 2.52 m (3.18 m RMSE), indicating problems extracting terrain height due to diminished ground returns. Simulated top of canopy heights from ICESat-2 underestimated true top of canopy returns for all types analyzed with errors ranging from 0.28 m (1.39 m RMSE) to 1.25 m (2.63 m RMSE). These results comprise a first step in a comprehensive evaluation of ICESat-2 anticipated performance. Future steps will include solar noise impact analysis and investigation into performance discrepancy between visible and near-infrared wavelengths. Full article
Show Figures

Graphical abstract

14087 KiB  
Article
Elevation Change Rates of Glaciers in the Lahaul-Spiti (Western Himalaya, India) during 2000–2012 and 2012–2013
by Saurabh Vijay and Matthias Braun
Remote Sens. 2016, 8(12), 1038; https://doi.org/10.3390/rs8121038 - 21 Dec 2016
Cited by 89 | Viewed by 8689
Abstract
Previous studies have shown contrasting glacier elevation and mass changes in the sub-regions of high-mountain Asia. However, the elevation changes on an individual catchment scale can be potentially influenced by supraglacial debris, ponds, lakes and ice cliffs besides regionally driven factors. Here, we [...] Read more.
Previous studies have shown contrasting glacier elevation and mass changes in the sub-regions of high-mountain Asia. However, the elevation changes on an individual catchment scale can be potentially influenced by supraglacial debris, ponds, lakes and ice cliffs besides regionally driven factors. Here, we present a detailed study on elevation changes of glaciers in the Lahaul-Spiti region derived from TanDEM-X and SRTM C-/X-band DEMs during 2000–2012 and 2012–2013. We observe three elevation change patterns during 2000–2012 among glaciers with different extent of supraglacial debris. The first pattern (<10% debris cover, type-1) indicates maximum thinning rates at the glacier terminus and is observed for glaciers with no or very low debris cover. In the second pattern (>10% debris cover, type-2), maximum thinning is observed up-glacier instead of glacier terminus. This is interpreted as the insulating effect of a thick debris cover. A third pattern, high elevation change rates near the terminus despite high debris cover (>10% debris cover, type-3) is most likely associated with either thinner debris thickness or enhanced melting at supraglacial ponds and lakes as well as ice cliffs. We empirically determined the SRTM C- and X-band penetration differences for debris-covered ice, clean ice/firn/snow and correct for this bias in our elevation change measurements. We show that this penetration bias, if uncorrected, underestimates the region-wide elevation change and geodetic mass balance by 20%. After correction, the region-wide elevation change (1712 km 2 ) was estimated to be −0.65 ± 0.43 m yr 1 during 2000–2012. Due to the short observation period, elevation change measurements from TanDEM-X for selected glaciers in the period 2012–2013 are subject to large uncertainties. However, similar spatial patterns were observed during 2000–2012 and 2012–2013, but at different magnitudes. This study reveals that the thinning patterns of debris-covered glaciers cannot be generalized and spatially detailed mapping of glacier elevation change is required to better understand the impact of different surface types under changing climatic conditions. Full article
Show Figures

Graphical abstract

8063 KiB  
Article
A New Operational Snow Retrieval Algorithm Applied to Historical AMSR-E Brightness Temperatures
by Marco Tedesco and Jeyavinoth Jeyaratnam
Remote Sens. 2016, 8(12), 1037; https://doi.org/10.3390/rs8121037 - 21 Dec 2016
Cited by 45 | Viewed by 6101
Abstract
Snow is a key element of the water and energy cycles and the knowledge of spatio-temporal distribution of snow depth and snow water equivalent (SWE) is fundamental for hydrological and climatological applications. SWE and snow depth estimates can be obtained from spaceborne microwave [...] Read more.
Snow is a key element of the water and energy cycles and the knowledge of spatio-temporal distribution of snow depth and snow water equivalent (SWE) is fundamental for hydrological and climatological applications. SWE and snow depth estimates can be obtained from spaceborne microwave brightness temperatures at global scale and high temporal resolution (daily). In this regard, the data recorded by the Advanced Microwave Scanning Radiometer—Earth Orbiting System (EOS) (AMSR-E) onboard the National Aeronautics and Space Administration’s (NASA) AQUA spacecraft have been used to generate operational estimates of SWE and snow depth, complementing estimates generated with other microwave sensors flying on other platforms. In this study, we report the results concerning the development and assessment of a new operational algorithm applied to historical AMSR-E data. The new algorithm here proposed makes use of climatological data, electromagnetic modeling and artificial neural networks for estimating snow depth as well as a spatio-temporal dynamic density scheme to convert snow depth to SWE. The outputs of the new algorithm are compared with those of the current AMSR-E operational algorithm as well as in-situ measurements and other operational snow products, specifically the Canadian Meteorological Center (CMC) and GlobSnow datasets. Our results show that the AMSR-E algorithm here proposed generally performs better than the operational one and addresses some major issues identified in the spatial distribution of snow depth fields associated with the evolution of effective grain size. Full article
Show Figures

Graphical abstract

363 KiB  
Editorial
Towards an Integrated Global Land Cover Monitoring and Mapping System
by Martin Herold, Linda See, Nandin-Erdene Tsendbazar and Steffen Fritz
Remote Sens. 2016, 8(12), 1036; https://doi.org/10.3390/rs8121036 - 20 Dec 2016
Cited by 20 | Viewed by 8378
Abstract
Global land cover mapping has evolved in a number of ways over the past two decades including increased activity in the areas of map validation and inter-comparison, which is the main focus of this Special Issue in Remote Sensing. Here we describe [...] Read more.
Global land cover mapping has evolved in a number of ways over the past two decades including increased activity in the areas of map validation and inter-comparison, which is the main focus of this Special Issue in Remote Sensing. Here we describe the major trends in global land cover mapping that have occurred, followed by recent advances as exemplified by the papers in the Special Issue. Finally, we consider what the future holds for global land cover mapping. Full article
(This article belongs to the Special Issue Validation and Inter-Comparison of Land Cover and Land Use Data)
Show Figures

Figure 1

4291 KiB  
Article
Quantitative Retrieval of Organic Soil Properties from Visible Near-Infrared Shortwave Infrared (Vis-NIR-SWIR) Spectroscopy Using Fractal-Based Feature Extraction
by Lanfa Liu, Min Ji, Yunyun Dong, Rongchung Zhang and Manfred Buchroithner
Remote Sens. 2016, 8(12), 1035; https://doi.org/10.3390/rs8121035 - 19 Dec 2016
Cited by 27 | Viewed by 6528
Abstract
Visible and near-infrared diffuse reflectance spectroscopy has been demonstrated to be a fast and cheap tool for estimating a large number of chemical and physical soil properties, and effective features extracted from spectra are crucial to correlating with these properties. We adopt a [...] Read more.
Visible and near-infrared diffuse reflectance spectroscopy has been demonstrated to be a fast and cheap tool for estimating a large number of chemical and physical soil properties, and effective features extracted from spectra are crucial to correlating with these properties. We adopt a novel methodology for feature extraction of soil spectroscopy based on fractal geometry. The spectrum can be divided into multiple segments with different step–window pairs. For each segmented spectral curve, the fractal dimension value was calculated using variation estimators with power indices 0.5, 1.0 and 2.0. Thus, the fractal feature can be generated by multiplying the fractal dimension value with spectral energy. To assess and compare the performance of new generated features, we took advantage of organic soil samples from the large-scale European Land Use/Land Cover Area Frame Survey (LUCAS). Gradient-boosting regression models built using XGBoost library with soil spectral library were developed to estimate N, pH and soil organic carbon (SOC) contents. Features generated by a variogram estimator performed better than two other estimators and the principal component analysis (PCA). The estimation results for SOC were coefficient of determination (R2) = 0.85, root mean square error (RMSE) = 56.7 g/kg, the ratio of percent deviation (RPD) = 2.59; for pH: R2 = 0.82, RMSE = 0.49 g/kg, RPD = 2.31; and for N: R2 = 0.77, RMSE = 3.01 g/kg, RPD = 2.09. Even better results could be achieved when fractal features were combined with PCA components. Fractal features generated by the proposed method can improve estimation accuracies of soil properties and simultaneously maintain the original spectral curve shape. Full article
(This article belongs to the Special Issue Remote Sensing Applied to Soils: From Ground to Space)
Show Figures

Graphical abstract

22299 KiB  
Article
Comparison of Tree Species Classifications at the Individual Tree Level by Combining ALS Data and RGB Images Using Different Algorithms
by Songqiu Deng, Masato Katoh, Xiaowei Yu, Juha Hyyppä and Tian Gao
Remote Sens. 2016, 8(12), 1034; https://doi.org/10.3390/rs8121034 - 19 Dec 2016
Cited by 37 | Viewed by 8914
Abstract
Individual tree delineation using remotely sensed data plays a very important role in precision forestry because it can provide detailed forest information on a large scale, which is required by forest managers. This study aimed to evaluate the utility of airborne laser scanning [...] Read more.
Individual tree delineation using remotely sensed data plays a very important role in precision forestry because it can provide detailed forest information on a large scale, which is required by forest managers. This study aimed to evaluate the utility of airborne laser scanning (ALS) data for individual tree detection and species classification in Japanese coniferous forests with a high canopy density. Tree crowns in the study area were first delineated by the individual tree detection approach using a canopy height model (CHM) derived from the ALS data. Then, the detected tree crowns were classified into four classes—Pinus densiflora, Chamaecyparis obtusa, Larix kaempferi, and broadleaved trees—using a tree crown-based classification approach with different combinations of 23 features derived from the ALS data and true-color (red-green-blue—RGB) orthoimages. To determine the best combination of features for species classification, several loops were performed using a forward iteration method. Additionally, several classification algorithms were compared in the present study. The results of this study indicate that the combination of the RGB images with laser intensity, convex hull area, convex hull point volume, shape index, crown area, and crown height features produced the highest classification accuracy of 90.8% with the use of the quadratic support vector machines (QSVM) classifier. Compared to only using the spectral characteristics of the orthophotos, the overall accuracy was improved by 14.1%, 9.4%, and 8.8% with the best combination of features when using the QSVM, neural network (NN), and random forest (RF) approaches, respectively. In terms of different classification algorithms, the findings of our study recommend the QSVM approach rather than NNs and RFs to classify the tree species in the study area. However, these classification approaches should be further tested in other forests using different data. This study demonstrates that the synergy of the ALS data and RGB images could be a promising approach to improve species classifications. Full article
Show Figures

Graphical abstract

2156 KiB  
Article
A Direct and Fast Methodology for Ship Recognition in Sentinel-2 Multispectral Imagery
by Henning Heiselberg
Remote Sens. 2016, 8(12), 1033; https://doi.org/10.3390/rs8121033 - 19 Dec 2016
Cited by 40 | Viewed by 6816
Abstract
The European Space Agency satellite Sentinel-2 provides multispectral images with pixel sizes down to 10 m. This high resolution allows for ship detection and recognition by determining a number of important ship parameters. We are able to show how a ship position, its [...] Read more.
The European Space Agency satellite Sentinel-2 provides multispectral images with pixel sizes down to 10 m. This high resolution allows for ship detection and recognition by determining a number of important ship parameters. We are able to show how a ship position, its heading, length and breadth can be determined down to a subpixel resolution. If the ship is moving, its velocity can also be determined from its Kelvin waves. The 13 spectrally different visual and infrared images taken using multispectral imagery (MSI) are “fingerprints” that allow for the recognition and identification of ships. Furthermore, the multispectral image profiles along the ship allow for discrimination between the ship, its turbulent wakes, and the Kelvin waves, such that the ship’s length and breadth can be determined more accurately even when sailing. The ship’s parameters are determined by using satellite imagery taken from several ships, which are then compared to known values from the automatic identification system. The agreement is on the order of the pixel resolution or better. Full article
Show Figures

Graphical abstract

19555 KiB  
Article
Ground-Based Hyperspectral Image Analysis of the Lower Mississippian (Osagean) Reeds Spring Formation Rocks in Southwestern Missouri
by Ünal Okyay, Shuhab D. Khan, M. R. Lakshmikantha and Sergio Sarmiento
Remote Sens. 2016, 8(12), 1018; https://doi.org/10.3390/rs8121018 - 19 Dec 2016
Cited by 17 | Viewed by 7418
Abstract
Ground-based hyperspectral imaging is fairly new for studying near-vertical rock exposures where airborne or satellite-based imaging fail to provide useful information. In this study, ground-based hyperspectral image analysis was performed on a roadcut, where diagenetic tripolite facies is observed in southwestern Missouri. Laboratory-based [...] Read more.
Ground-based hyperspectral imaging is fairly new for studying near-vertical rock exposures where airborne or satellite-based imaging fail to provide useful information. In this study, ground-based hyperspectral image analysis was performed on a roadcut, where diagenetic tripolite facies is observed in southwestern Missouri. Laboratory-based reflectance spectroscopy and hyperspectral image analyses were also performed on collected samples. Image classification was performed using Spectral Feature Fitting (SFF) and Mixture-tuned Match Filtering (MTMF) with laboratory- and image-derived end-member spectra. SFF provided thorough yet detailed classification, whereas MTMF provided information on the relative abundances of the lithologies. Ground-based hyperspectral imaging demonstrated its potential to aid geological studies providing valuable information on mineralogical and lithological variations rapidly and with two-dimensional continuity in inaccessible rock faces of near-vertical outcrops. The results showed decreasing tripolite abundance going downward in the investigated vertical succession. Also, a leaching pattern has been observed such that persistent and continuous limestone layers become lenses and patches towards the upper portion of the outcrop. These observations show that the effect of tripolitization decreases when going deeper in the succession, suggesting that the fluid responsible for the weathering of siliceous precursors may have been flowing from top to bottom and thus have had a meteoric origin. Full article
Show Figures

Graphical abstract

4135 KiB  
Article
Detection of the Coupling between Vegetation Leaf Area and Climate in a Multifunctional Watershed, Northwestern China
by Lu Hao, Cen Pan, Peilong Liu, Decheng Zhou, Liangxia Zhang, Zhe Xiong, Yongqiang Liu and Ge Sun
Remote Sens. 2016, 8(12), 1032; https://doi.org/10.3390/rs8121032 - 18 Dec 2016
Cited by 13 | Viewed by 5714
Abstract
Accurate detection and quantification of vegetation dynamics and drivers of observed climatic and anthropogenic change in space and time is fundamental for our understanding of the atmosphere–biosphere interactions at local and global scales. This case study examined the coupled spatial patterns of vegetation [...] Read more.
Accurate detection and quantification of vegetation dynamics and drivers of observed climatic and anthropogenic change in space and time is fundamental for our understanding of the atmosphere–biosphere interactions at local and global scales. This case study examined the coupled spatial patterns of vegetation dynamics and climatic variabilities during the past three decades in the Upper Heihe River Basin (UHRB), a complex multiple use watershed in arid northwestern China. We apply empirical orthogonal function (EOF) and singular value decomposition (SVD) analysis to isolate and identify the spatial patterns of satellite-derived leaf area index (LAI) and their close relationship with the variability of an aridity index (AI = Precipitation/Potential Evapotranspiration). Results show that UHRB has become increasingly warm and wet during the past three decades. In general, the rise of air temperature and precipitation had a positive impact on mean LAI at the annual scale. At the monthly scale, LAI variations had a lagged response to climate. Two major coupled spatial change patterns explained 29% and 41% of the LAI dynamics during 1983–2000 and 2001–2010, respectively. The strongest connections between climate and LAI were found in the southwest part of the basin prior to 2000, but they shifted towards the north central area afterwards, suggesting that the sensitivity of LAI to climate varied over time, and that human disturbances might play an important role in altering LAI patterns. At the basin level, the positive effects of regional climate warming and precipitation increase as well as local ecological restoration efforts overwhelmed the negative effects of overgrazing. The study results offer insights about the coupled effects of climatic variability and grazing on ecosystem structure and functions at a watershed scale. Findings from this study are useful for land managers and policy makers to make better decisions in response to climate change in the study region. Full article
(This article belongs to the Special Issue Remote Sensing of Land Degradation and Drivers of Change)
Show Figures

Graphical abstract

11116 KiB  
Article
High Throughput Field Phenotyping of Wheat Plant Height and Growth Rate in Field Plot Trials Using UAV Based Remote Sensing
by Fenner H. Holman, Andrew B. Riche, Adam Michalski, March Castle, Martin J. Wooster and Malcolm J. Hawkesford
Remote Sens. 2016, 8(12), 1031; https://doi.org/10.3390/rs8121031 - 18 Dec 2016
Cited by 286 | Viewed by 16834
Abstract
There is a growing need to increase global crop yields, whilst minimising use of resources such as land, fertilisers and water. Agricultural researchers use ground-based observations to identify, select and develop crops with favourable genotypes and phenotypes; however, the ability to collect rapid, [...] Read more.
There is a growing need to increase global crop yields, whilst minimising use of resources such as land, fertilisers and water. Agricultural researchers use ground-based observations to identify, select and develop crops with favourable genotypes and phenotypes; however, the ability to collect rapid, high quality and high volume phenotypic data in open fields is restricting this. This study develops and assesses a method for deriving crop height and growth rate rapidly from multi-temporal, very high spatial resolution (1 cm/pixel), 3D digital surface models of crop field trials produced via Structure from Motion (SfM) photogrammetry using aerial imagery collected through repeated campaigns flying an Unmanned Aerial Vehicle (UAV) with a mounted Red Green Blue (RGB) camera. We compare UAV SfM modelled crop heights to those derived from terrestrial laser scanner (TLS) and to the standard field measurement of crop height conducted using a 2 m rule. The most accurate UAV-derived surface model and the TLS both achieve a Root Mean Squared Error (RMSE) of 0.03 m compared to the existing manual 2 m rule method. The optimised UAV method was then applied to the growing season of a winter wheat field phenotyping experiment containing 25 different varieties grown in 27 m2 plots and subject to four different nitrogen fertiliser treatments. Accuracy assessments at different stages of crop growth produced consistently low RMSE values (0.07, 0.02 and 0.03 m for May, June and July, respectively), enabling crop growth rate to be derived from differencing of the multi-temporal surface models. We find growth rates range from −13 mm/day to 17 mm/day. Our results clearly display the impact of variable nitrogen fertiliser rates on crop growth. Digital surface models produced provide a novel spatial mapping of crop height variation both at the field scale and also within individual plots. This study proves UAV based SfM has the potential to become a new standard for high-throughput phenotyping of in-field crop heights. Full article
Show Figures

Graphical abstract

3812 KiB  
Review
Understanding Forest Health with Remote Sensing -Part I—A Review of Spectral Traits, Processes and Remote-Sensing Characteristics
by Angela Lausch, Stefan Erasmi, Douglas J. King, Paul Magdon and Marco Heurich
Remote Sens. 2016, 8(12), 1029; https://doi.org/10.3390/rs8121029 - 18 Dec 2016
Cited by 134 | Viewed by 24791
Abstract
Anthropogenic stress and disturbance of forest ecosystems (FES) has been increasing at all scales from local to global. In rapidly changing environments, in-situ terrestrial FES monitoring approaches have made tremendous progress but they are intensive and often integrate subjective indicators for forest health [...] Read more.
Anthropogenic stress and disturbance of forest ecosystems (FES) has been increasing at all scales from local to global. In rapidly changing environments, in-situ terrestrial FES monitoring approaches have made tremendous progress but they are intensive and often integrate subjective indicators for forest health (FH). Remote sensing (RS) bridges the gaps of these limitations, by monitoring indicators of FH on different spatio-temporal scales, and in a cost-effective, rapid, repetitive and objective manner. In this paper, we provide an overview of the definitions of FH, discussing the drivers, processes, stress and adaptation mechanisms of forest plants, and how we can observe FH with RS. We introduce the concept of spectral traits (ST) and spectral trait variations (STV) in the context of FH monitoring and discuss the prospects, limitations and constraints. Stress, disturbances and resource limitations can cause changes in FES taxonomic, structural and functional diversity; we provide examples how the ST/STV approach can be used for monitoring these FES characteristics. We show that RS based assessments of FH indicators using the ST/STV approach is a competent, affordable, repetitive and objective technique for monitoring. Even though the possibilities for observing the taxonomic diversity of animal species is limited with RS, the taxonomy of forest tree species can be recorded with RS, even though its accuracy is subject to certain constraints. RS has proved successful for monitoring the impacts from stress on structural and functional diversity. In particular, it has proven to be very suitable for recording the short-term dynamics of stress on FH, which cannot be cost-effectively recorded using in-situ methods. This paper gives an overview of the ST/STV approach, whereas the second paper of this series concentrates on discussing in-situ terrestrial monitoring, in-situ RS approaches and RS sensors and techniques for measuring ST/STV for FH. Full article
(This article belongs to the Special Issue Remote Sensing of Forest Health)
Show Figures

Figure 1

8311 KiB  
Article
Building Change Detection Using Old Aerial Images and New LiDAR Data
by Shouji Du, Yunsheng Zhang, Rongjun Qin, Zhihua Yang, Zhengrong Zou, Yuqi Tang and Chong Fan
Remote Sens. 2016, 8(12), 1030; https://doi.org/10.3390/rs8121030 - 17 Dec 2016
Cited by 54 | Viewed by 8777
Abstract
Building change detection is important for urban area monitoring, disaster assessment and updating geo-database. 3D information derived from image dense matching or airborne light detection and ranging (LiDAR) is very effective for building change detection. However, combining 3D data from different sources is [...] Read more.
Building change detection is important for urban area monitoring, disaster assessment and updating geo-database. 3D information derived from image dense matching or airborne light detection and ranging (LiDAR) is very effective for building change detection. However, combining 3D data from different sources is challenging, and so far few studies have focused on building change detection using both images and LiDAR data. This study proposes an automatic method to detect building changes in urban areas using aerial images and LiDAR data. First, dense image matching is carried out to obtain dense point clouds and then co-registered LiDAR point clouds using the iterative closest point (ICP) algorithm. The registered point clouds are further resampled to a raster DSM (Digital Surface Models). In a second step, height difference and grey-scale similarity are calculated as change indicators and the graph cuts method is employed to determine changes considering the contexture information. Finally, the detected results are refined by removing the non-building changes, in which a novel method based on variance of normal direction of LiDAR points is proposed to remove vegetated areas for positive building changes (newly building or taller) and nEGI (normalized Excessive Green Index) is used for negative building changes (demolish building or lower). To evaluate the proposed method, a test area covering approximately 2.1 km2 and consisting of many different types of buildings is used for the experiment. Results indicate 93% completeness with correctness of 90.2% for positive changes, while 94% completeness with correctness of 94.1% for negative changes, which demonstrate the promising performance of the proposed method. Full article
(This article belongs to the Special Issue Fusion of LiDAR Point Clouds and Optical Images)
Show Figures

Graphical abstract

4580 KiB  
Article
Joint Time-Frequency Signal Processing Scheme in Forward Scattering Radar with a Rotational Transmitter
by Raja Syamsul Azmir Raja Abdullah, Azizi Mohd Ali, Mohd Fadlee A. Rasid, Nur Emileen Abdul Rashid, Asem Ahmad Salah and Aris Munawar
Remote Sens. 2016, 8(12), 1028; https://doi.org/10.3390/rs8121028 - 17 Dec 2016
Cited by 4 | Viewed by 5298
Abstract
This paper explores the concept of a Forward Scattering Radar (FSR) system with a rotational transmitter for target detection and localization. Most of the research and development in FSR used a fixed dedicated transmitter; therefore, the detection of stationary and slow moving target [...] Read more.
This paper explores the concept of a Forward Scattering Radar (FSR) system with a rotational transmitter for target detection and localization. Most of the research and development in FSR used a fixed dedicated transmitter; therefore, the detection of stationary and slow moving target is very difficult. By rotating the transmitter, the received signals at the receiver contain extra information carried by the Doppler due to the relative movement of the transmitter-target-receiver. Hence, rotating the transmitter enhances the detection capability especially for a stationary and slow-moving target. In addition, it increases the flexibility of the transmitter to control the signal direction, which broadens the coverage of FSR networks. In this paper, a novel signal processing for the new mode of FSR system based on the signal’s joint time-frequency is proposed and discussed. Additionally, the concept of the FSR system with the rotational transmitter is analyzed experimentally for the detection and localization of a stationary target, at very low speed and a low profile target crossing the FSR baseline. The system acts as a virtual fencing of a remote sensor for area monitoring. The experimental results show that the proposed mode with the new signal processing scheme can detect a human intruder. The potential applications for this system could be used for security and border surveillance, debris detection on an airport runway, ground aerial monitoring, intruder detection, etc. Full article
(This article belongs to the Special Issue Radar Systems for the Societal Challenges)
Show Figures

Figure 1

5579 KiB  
Article
Two Component Decomposition of Dual Polarimetric HH/VV SAR Data: Case Study for the Tundra Environment of the Mackenzie Delta Region, Canada
by Tobias Ullmann, Andreas Schmitt and Thomas Jagdhuber
Remote Sens. 2016, 8(12), 1027; https://doi.org/10.3390/rs8121027 - 16 Dec 2016
Cited by 17 | Viewed by 7403
Abstract
This study investigates a two component decomposition technique for HH/VV-polarized PolSAR (Polarimetric Synthetic Aperture Radar) data. The approach is a straight forward adaption of the Yamaguchi decomposition and decomposes the data into two scattering contributions: surface and double bounce under the assumption of [...] Read more.
This study investigates a two component decomposition technique for HH/VV-polarized PolSAR (Polarimetric Synthetic Aperture Radar) data. The approach is a straight forward adaption of the Yamaguchi decomposition and decomposes the data into two scattering contributions: surface and double bounce under the assumption of a negligible vegetation scattering component in Tundra environments. The dependencies between the features of this two and the classical three component Yamaguchi decomposition were investigated for Radarsat-2 (quad) and TerraSAR-X (HH/VV) data for the Mackenzie Delta Region, Canada. In situ data on land cover were used to derive the scattering characteristics and to analyze the correlation among the PolSAR features. The double bounce and surface scattering features of the two and three component scattering model (derived from pseudo-HH/VV- and quad-polarized data) showed similar scattering characteristics and positively correlated-R2 values of 0.60 (double bounce) and 0.88 (surface scattering) were observed. The presence of volume scattering led to differences between the features and these were minimized for land cover classes of low vegetation height that showed little volume scattering contribution. In terms of separability, the quad-polarized Radarsat-2 data offered the best separation of the examined tundra land cover types and will be best suited for the classification. This is anticipated as it represents the largest feature space of all tested ones. However; the classes “wetland” and “bare ground” showed clear positions in the feature spaces of the C- and X-Band HH/VV-polarized data and an accurate classification of these land cover types is promising. Among the possible dual-polarization modes of Radarsat-2 the HH/VV was found to be the favorable mode for the characterization of the aforementioned tundra land cover classes due to the coherent acquisition and the preserved co-pol. phase. Contrary, HH/HV-polarized and VV/VH-polarized data were found to be best suited for the characterization of mixed and shrub dominated tundra. Full article
Show Figures

Figure 1

3804 KiB  
Article
Dryland Vegetation Functional Response to Altered Rainfall Amounts and Variability Derived from Satellite Time Series Data
by Gregor Ratzmann, Ute Gangkofner, Britta Tietjen and Rasmus Fensholt
Remote Sens. 2016, 8(12), 1026; https://doi.org/10.3390/rs8121026 - 16 Dec 2016
Cited by 14 | Viewed by 6691
Abstract
Vegetation productivity is an essential variable in ecosystem functioning. Vegetation dynamics of dryland ecosystems are most strongly determined by water availability and consequently by rainfall and there is a need to better understand how water limited ecosystems respond to altered rainfall amounts and [...] Read more.
Vegetation productivity is an essential variable in ecosystem functioning. Vegetation dynamics of dryland ecosystems are most strongly determined by water availability and consequently by rainfall and there is a need to better understand how water limited ecosystems respond to altered rainfall amounts and variability. This response is partly determined by the vegetation functional response to rainfall (β) approximated by the unit change in annual vegetation productivity per unit change in annual rainfall. Here, we show how this functional response from 1983 to 2011 is affected by below and above average rainfall in two arid to semi-arid subtropical regions in West Africa (WA) and South West Africa (SWA) differing in interannual variability of annual rainfall (higher in SWA, lower in WA). We used a novel approach, shifting linear regression models (SLRs), to estimate gridded time series of β. The SLRs ingest annual satellite based rainfall as the explanatory variable and annual satellite-derived vegetation productivity proxies (NDVI) as the response variable. Gridded β values form unimodal curves along gradients of mean annual precipitation in both regions. β is higher in SWA during periods of below average rainfall (compared to above average) for mean annual precipitation <600 mm. In WA, β is hardly affected by above or below average rainfall conditions. Results suggest that this higher β variability in SWA is related to the higher rainfall variability in this region. Vegetation type-specific β follows observed responses for each region along rainfall gradients leading to region-specific responses for each vegetation type. We conclude that higher interannual rainfall variability might favour a more dynamic vegetation response to rainfall. This in turn may enhance the capability of vegetation productivity of arid and semi-arid regions to better cope with periods of below average rainfall conditions. Full article
(This article belongs to the Special Issue Remote Sensing of Land Degradation and Drivers of Change)
Show Figures

Graphical abstract

3249 KiB  
Article
Optimizing Multiple Kernel Learning for the Classification of UAV Data
by Caroline M. Gevaert, Claudio Persello and George Vosselman
Remote Sens. 2016, 8(12), 1025; https://doi.org/10.3390/rs8121025 - 16 Dec 2016
Cited by 23 | Viewed by 6615
Abstract
Unmanned Aerial Vehicles (UAVs) are capable of providing high-quality orthoimagery and 3D information in the form of point clouds at a relatively low cost. Their increasing popularity stresses the necessity of understanding which algorithms are especially suited for processing the data obtained from [...] Read more.
Unmanned Aerial Vehicles (UAVs) are capable of providing high-quality orthoimagery and 3D information in the form of point clouds at a relatively low cost. Their increasing popularity stresses the necessity of understanding which algorithms are especially suited for processing the data obtained from UAVs. The features that are extracted from the point cloud and imagery have different statistical characteristics and can be considered as heterogeneous, which motivates the use of Multiple Kernel Learning (MKL) for classification problems. In this paper, we illustrate the utility of applying MKL for the classification of heterogeneous features obtained from UAV data through a case study of an informal settlement in Kigali, Rwanda. Results indicate that MKL can achieve a classification accuracy of 90.6%, a 5.2% increase over a standard single-kernel Support Vector Machine (SVM). A comparison of seven MKL methods indicates that linearly-weighted kernel combinations based on simple heuristics are competitive with respect to computationally-complex, non-linear kernel combination methods. We further underline the importance of utilizing appropriate feature grouping strategies for MKL, which has not been directly addressed in the literature, and we propose a novel, automated feature grouping method that achieves a high classification accuracy for various MKL methods. Full article
(This article belongs to the Special Issue Recent Trends in UAV Remote Sensing)
Show Figures

Graphical abstract

3273 KiB  
Article
L-Band Relative Permittivity of Organic Soil Surface Layers—A New Dataset of Resonant Cavity Measurements and Model Evaluation
by Simone Bircher, François Demontoux, Stephen Razafindratsima, Elena Zakharova, Matthias Drusch, Jean-Pierre Wigneron and Yann H. Kerr
Remote Sens. 2016, 8(12), 1024; https://doi.org/10.3390/rs8121024 - 16 Dec 2016
Cited by 38 | Viewed by 6860
Abstract
Global surface soil moisture products are derived from passive L-band microwave satellite observations. The applied retrieval algorithms include dielectric models (relating soil water content to relative permittivity) developed for mineral soils. First efforts to generate equivalent models for areas where organic surface layers [...] Read more.
Global surface soil moisture products are derived from passive L-band microwave satellite observations. The applied retrieval algorithms include dielectric models (relating soil water content to relative permittivity) developed for mineral soils. First efforts to generate equivalent models for areas where organic surface layers are present such as in the high-latitude regions have recently been undertaken. The objective of this study was to improve our still insufficient understanding of L-band emission of organic substrates in prospect of enhancing soil moisture estimations in the high latitudes undergoing most rapid climatic changes. To this end, L-band relative permittivity measurements using a resonant cavity were carried out on a wide range of organic surface layer types collected at different sites. This dataset was used to evaluate two already existing models for organic substrates. Some samples from underlying mineral layers were considered for comparison. In agreement with theory the bulk relative permittivity measured in organic substrate was decreased due to an increased bound water fraction (where water molecules are rotationally hindered) compared to the measured mineral material and corresponding output of the dielectric model for mineral soils used in satellite algorithms. No distinct differences in dielectric response were detected in the measurements from various organic layer types, suggesting a generally uniform L-band emission behavior. This made it possible to fit a simple empirical model to the data obtained from all collected organic samples. Outputs of the two existing models both based on only one organic surface layer type were found to lie within the spread of our measured data, and in close proximity to the derived simple model. This general consensus strengthened confidence in the validity of all these models. The simple model should be suitable for satellite soil moisture retrieval applications as it is calibrated on a wide range of organic substrate types and the entire wetness range, and does not require any auxiliary input that may be difficult to obtain globally. This renders it generically applicable wherever organic surface layers are present. Full article
Show Figures

Graphical abstract

17819 KiB  
Article
Novel Object-Based Filter for Improving Land-Cover Classification of Aerial Imagery with Very High Spatial Resolution
by Zhiyong Lv, Wenzhong Shi, Jón Atli Benediktsson and Xiaojuan Ning
Remote Sens. 2016, 8(12), 1023; https://doi.org/10.3390/rs8121023 - 15 Dec 2016
Cited by 14 | Viewed by 6420
Abstract
Land cover classification using very high spatial resolution (VHSR) imaging plays a very important role in remote sensing applications. However, image noise usually reduces the classification accuracy of VHSR images. Image spatial filters have been recently adopted to improve VHSR image land cover [...] Read more.
Land cover classification using very high spatial resolution (VHSR) imaging plays a very important role in remote sensing applications. However, image noise usually reduces the classification accuracy of VHSR images. Image spatial filters have been recently adopted to improve VHSR image land cover classification. In this study, a new object-based image filter using topology and feature constraints is proposed, where an object is considered as a central object and has irregular shapes and various numbers of neighbors depending on the nature of the surroundings. First, multi-scale segmentation is used to generate a homogeneous image object and extract the corresponding vectors. Then, topology and feature constraints are proposed to select the adjacent objects, which present similar materials to the central object. Third, the feature of the central object is smoothed by the average of the selected objects’ feature. This proposed approach is validated on three VHSR images, ranging from a fixed-wing aerial image to UAV images. The performance of the proposed approach is compared to a standard object-based approach (OO), object correlative index (OCI) spatial feature based method, a recursive filter (RF), and a rolling guided filter (RGF), and has shown a 6%–18% improvement in overall accuracy. Full article
(This article belongs to the Special Issue Earth Observations for a Better Future Earth)
Show Figures

Graphical abstract

4954 KiB  
Article
Improved Geoarchaeological Mapping with Electromagnetic Induction Instruments from Dedicated Processing and Inversion
by Anders Vest Christiansen, Jesper Bjergsted Pedersen, Esben Auken, Niels Emil Søe, Mads Kähler Holst and Søren Munch Kristiansen
Remote Sens. 2016, 8(12), 1022; https://doi.org/10.3390/rs8121022 - 14 Dec 2016
Cited by 45 | Viewed by 7328
Abstract
Increasingly, electromagnetic induction methods (EMI) are being used within the area of archaeological prospecting for mapping soil structures or for studying paleo-landscapes. Recent hardware developments have made fast data acquisition, combined with precise positioning, possible, thus providing interesting possibilities for archaeological prospecting. However, [...] Read more.
Increasingly, electromagnetic induction methods (EMI) are being used within the area of archaeological prospecting for mapping soil structures or for studying paleo-landscapes. Recent hardware developments have made fast data acquisition, combined with precise positioning, possible, thus providing interesting possibilities for archaeological prospecting. However, it is commonly assumed that the instrument operates in what is referred to as Low Induction Number, or LIN. Here, we detail the problems of the approximations while discussing a best practice for EMI measurements, data processing, and inversion for understanding a paleo-landscape at an Iron Age human bone depositional site (Alken Enge) in Denmark. On synthetic as well as field data we show that soil mapping based on EMI instruments can be improved by applying data processing methodologies from adjacent scientific fields. Data from a 10 hectare study site was collected with a line spacing of 1–4 m, resulting in roughly 13,000 processed soundings, which were inverted with a full non-linear algorithm. The models had higher dynamic range in the retrieved resistivity values, as well as sharper contrasts between structural elements than we could obtain by looking at data alone. We show that the pre-excavation EMI mapping facilitated an archaeological prospecting where traditional trenching could be replaced by a few test pits at selected sites, hereby increasing the chance of finding human bones. In a general context we show that (1) dedicated processing of EMI data is necessary to remove coupling from anthropogenic structures (fences, phone cables, paved roads, etc.), and (2) that carrying out a dedicated full non-linear inversion with spatial coherency constraints improves the accuracy of resistivities and structures over using the data as they are or using the Low Induction Number (LIN) approximation. Full article
(This article belongs to the Special Issue Archaeological Prospecting and Remote Sensing)
Show Figures

Graphical abstract

17559 KiB  
Article
Deformation Monitoring and Analysis of the Geological Environment of Pudong International Airport with Persistent Scatterer SAR Interferometry
by Yanan Jiang, Mingsheng Liao, Hanmei Wang, Lu Zhang and Timo Balz
Remote Sens. 2016, 8(12), 1021; https://doi.org/10.3390/rs8121021 - 14 Dec 2016
Cited by 44 | Viewed by 7209
Abstract
Many coastal cities have undertaken reclamation projects to satisfy the land demands of rapid urbanization. However, the foundations of reclaimed land are susceptible to settlement and can have undesirable environmental impacts that could adversely affect these dense, populated areas. In the case of [...] Read more.
Many coastal cities have undertaken reclamation projects to satisfy the land demands of rapid urbanization. However, the foundations of reclaimed land are susceptible to settlement and can have undesirable environmental impacts that could adversely affect these dense, populated areas. In the case of international airports built on reclaimed areas especially, regional-scale deformation must be monitored to ensure operational security for public safety. Persistent Scatterer SAR Interferometry (PSI) technology has proven to be an effective tool to detect ground deformation in urban areas. However, it is still a challenge to apply PSI to effectively monitor settlement at airports built on newly developed coastal reclamation areas because of the scarcity of identifiable targets. Moreover, additional issues arise as the complicated deformation patterns associated with the underlying geological conditions make it difficult to interpret InSAR-derived results. In this study, a time-series analysis of a high-resolution TerraSAR-X satellite image stack acquired from September 2011 to October 2012 was performed by employing a modified PSI technique to retrieve the mean deformation velocity and time series of surface deformation at Pudong International Airport. Qualitative evaluation of spatial distribution and temporal evolution of deformation was conducted by joint analyses of deformation measurements and local geological data. Detailed analysis of various driving forces for deformation patterns confirmed that the results of deformation monitoring obtained by PSI are reliable and consistent with that of local geological surveys. Since the factors responsible for the subsidence within the airport are still at play, ongoing and routine deformation monitoring is warranted. Full article
(This article belongs to the Special Issue Societal and Economic Benefits of Earth Observation Technologies)
Show Figures

Graphical abstract

12440 KiB  
Article
Land Cover Classification in Complex and Fragmented Agricultural Landscapes of the Ethiopian Highlands
by Michael Eggen, Mutlu Ozdogan, Benjamin F. Zaitchik and Belay Simane
Remote Sens. 2016, 8(12), 1020; https://doi.org/10.3390/rs8121020 - 14 Dec 2016
Cited by 25 | Viewed by 9171
Abstract
Ethiopia is a largely agrarian country with nearly 85% of its employment coming from agriculture. Nevertheless, it is not known how much land is under cultivation. Mapping land cover at finer resolution and global scales has been particularly difficult in Ethiopia. The study [...] Read more.
Ethiopia is a largely agrarian country with nearly 85% of its employment coming from agriculture. Nevertheless, it is not known how much land is under cultivation. Mapping land cover at finer resolution and global scales has been particularly difficult in Ethiopia. The study area falls in a region of high mapping complexity with environmental challenges which require higher quality maps. Here, remote sensing is used to classify a large area of the central and northwestern highlands into eight broad land cover classes that comprise agriculture, grassland, woodland/shrub, forest, bare ground, urban/impervious surfaces, water, and seasonal water/marsh areas. We use data from Landsat spectral bands from 2000 to 2011, the Normalized Difference Vegetation Index (NDVI) and its temporal mean and variance, together with a digital elevation model, all at 30-m spatial resolution, as inputs to a supervised classifier. A Support Vector Machines algorithm (SVM) was chosen to deal with the size, variability and non-parametric nature of these data stacks. In post-processing, an image segmentation algorithm with a minimum mapping unit of about 0.5 hectares was used to convert per pixel classification results into an object based final map. Although the reliability of the map is modest, its overall accuracy is 55%—encouraging results for the accuracy of agricultural uses at 85% suggest that these methods do offer great utility. Confusion among grassland, woodland and barren categories reflects the difficulty of classifying savannah landscapes, especially in east central Africa with monsoonal-driven rainfall patterns where the ground is obstructed by clouds for significant periods of time. Our analysis also points out the need for high quality reference data. Further, topographic analysis of the agriculture class suggests there is a significant amount of sloping land under cultivation. These results are important for future research and environmental monitoring in agricultural land use, soil erosion, and crop modeling of the Abay basin. Full article
Show Figures

Graphical abstract

18096 KiB  
Article
Wind Resource Assessment for High-Rise BIWT Using RS-NWP-CFD
by Hyun-Goo Kim, Wan-Ho Jeon and Dong-Hyeok Kim
Remote Sens. 2016, 8(12), 1019; https://doi.org/10.3390/rs8121019 - 13 Dec 2016
Cited by 10 | Viewed by 9400
Abstract
In this paper, a new wind resource assessment procedure for building-integrated wind turbines (BIWTs) is proposed. The objective is to integrate wind turbines at a 555 m high-rise building to be constructed at the center of Seoul, Korea. Wind resource assessment at a [...] Read more.
In this paper, a new wind resource assessment procedure for building-integrated wind turbines (BIWTs) is proposed. The objective is to integrate wind turbines at a 555 m high-rise building to be constructed at the center of Seoul, Korea. Wind resource assessment at a high altitude was performed using ground-based remote sensing (RS); numerical weather prediction (NWP) modeling that includes an urban canopy model was evaluated using the remote sensing measurements. Given the high correlation between the model and the measurements, we use the model to produce a long-term wind climate by correlating the model results with the measurements for the short period of the campaign. The wind flow over the high-rise building was simulated using computational fluid dynamics (CFD). The wind resource in Seoul—one of the metropolitan cities located inland and populated by a large number of skyscrapers—was very poor, which results in a wind turbine capacity factor of only 7%. A new standard procedure combining RS, NWP, and CFD is proposed for feasibility studies on high-rise BIWTs in the future. Full article
(This article belongs to the Special Issue Remote Sensing of Wind Energy)
Show Figures

Graphical abstract

5004 KiB  
Article
An Algorithm for In-Flight Spectral Calibration of Imaging Spectrometers
by Gerrit Kuhlmann, Andreas Hueni, Alexander Damm and Dominik Brunner
Remote Sens. 2016, 8(12), 1017; https://doi.org/10.3390/rs8121017 - 11 Dec 2016
Cited by 23 | Viewed by 6712
Abstract
Accurate spectral calibration of satellite and airborne spectrometers is essential for remote sensing applications that rely on accurate knowledge of center wavelength (CW) positions and slit function parameters (SFP). We present a new in-flight spectral calibration algorithm that retrieves CWs and SFPs across [...] Read more.
Accurate spectral calibration of satellite and airborne spectrometers is essential for remote sensing applications that rely on accurate knowledge of center wavelength (CW) positions and slit function parameters (SFP). We present a new in-flight spectral calibration algorithm that retrieves CWs and SFPs across a wide spectral range by fitting a high-resolution solar spectrum and atmospheric absorbers to in-flight radiance spectra. Using a maximum a posteriori optimal estimation approach, the quality of the fit can be improved with a priori information. The algorithm was tested with synthetic spectra and applied to data from the APEX imaging spectrometer over the spectral range of 385–870 nm. CWs were retrieved with high accuracy (uncertainty <0.05 spectral pixels) from Fraunhofer lines below 550 nm and atmospheric absorbers above 650 nm. This enabled a detailed characterization of APEX’s across-track spectral smile and a previously unknown along-track drift. The FWHMs of the slit function were also retrieved with good accuracy (<10% uncertainty) for synthetic spectra, while some obvious misfits appear for the APEX spectra that are likely related to radiometric calibration issues. In conclusion, our algorithm significantly improves the in-flight spectral calibration of APEX and similar spectrometers, making them better suited for the retrieval of atmospheric and surface variables relying on accurate calibration. Full article
(This article belongs to the Special Issue Uncertainties in Remote Sensing)
Show Figures

Graphical abstract

7387 KiB  
Article
Characterizing Cropland Phenology in Major Grain Production Areas of Russia, Ukraine, and Kazakhstan by the Synergistic Use of Passive Microwave and Visible to Near Infrared Data
by Woubet G. Alemu and Geoffrey M. Henebry
Remote Sens. 2016, 8(12), 1016; https://doi.org/10.3390/rs8121016 - 11 Dec 2016
Cited by 9 | Viewed by 5874
Abstract
We demonstrate the synergistic use of surface air temperature retrieved from AMSR-E (Advanced Microwave Scanning Radiometer on Earth observing satellite) and two vegetation indices (VIs) from the shorter wavelengths of MODIS (MODerate resolution Imaging Spectroradiometer) to characterize cropland phenology in the major grain [...] Read more.
We demonstrate the synergistic use of surface air temperature retrieved from AMSR-E (Advanced Microwave Scanning Radiometer on Earth observing satellite) and two vegetation indices (VIs) from the shorter wavelengths of MODIS (MODerate resolution Imaging Spectroradiometer) to characterize cropland phenology in the major grain production areas of Northern Eurasia from 2003–2010. We selected 49 AMSR-E pixels across Ukraine, Russia, and Kazakhstan, based on MODIS land cover percentage data. AMSR-E air temperature growing degree-days (GDD) captures the weekly, monthly, and seasonal oscillations, and well correlated with station GDD. A convex quadratic (CxQ) model that linked thermal time measured as growing degree-days to accumulated growing degree-days (AGDD) was fitted to each pixel’s time series yielding high coefficients of determination (0.88 ≤ r2 ≤ 0.98). Deviations of observed GDD from the CxQ model predicted GDD by site corresponded to peak VI for negative residuals (period of higher latent heat flux) and low VI at beginning and end of growing season for positive residuals (periods of higher sensible heat flux). Modeled thermal time to peak, i.e., AGDD at peak GDD, showed a strong inverse linear trend with respect to latitude with r2 of 0.92 for Russia and Kazakhstan and 0.81 for Ukraine. MODIS VIs tracked similar seasonal responses in time and space and were highly correlated across the growing season with r2 > 0.95. Sites at lower latitude (≤49°N) that grow winter and spring grains showed either a bimodal growing season or a shorter unimodal winter growing season with substantial inter-annual variability, whereas sites at higher latitude (≥56°N) where spring grains are cultivated exhibited shorter, unimodal growing seasons. Sites between these extremes exhibited longer unimodal growing seasons. At some sites there were shifts between unimodal and bimodal patterns over the study period. Regional heat waves that devastated grain production in 2007 in Ukraine and in 2010 in Russia and Kazakhstan appear clearly anomalous. Microwave based surface air temperature data holds great promise to extend to parts of the planet where the land surface is frequently obscured by clouds, smoke, or aerosols, and where routine meteorological observations are sparse or absent. Full article
Show Figures

Graphical abstract

22322 KiB  
Article
Development of a Mid-Infrared Sea and Lake Ice Index (MISI) Using the GOES Imager
by Peter Dorofy, Rouzbeh Nazari, Peter Romanov And and Jeffrey Key
Remote Sens. 2016, 8(12), 1015; https://doi.org/10.3390/rs8121015 - 11 Dec 2016
Cited by 10 | Viewed by 5532
Abstract
An automated ice-mapping algorithm has been developed and evaluated using data from the GOES-13 imager. The approach includes cloud-free image compositing as well as image classification using spectral criteria. The algorithm uses an alternative snow index to the Normalized Difference Snow Index (NDSI). [...] Read more.
An automated ice-mapping algorithm has been developed and evaluated using data from the GOES-13 imager. The approach includes cloud-free image compositing as well as image classification using spectral criteria. The algorithm uses an alternative snow index to the Normalized Difference Snow Index (NDSI). The GOES-13 imager does not have a 1.6 µm band, a requirement for NDSI; however, the newly proposed Mid-Infrared Sea and Lake Ice Index (MISI) incorporates the reflective component of the 3.9 µm or mid-infrared (MIR) band, which the GOES-13 imager does operate. Incorporating MISI into a sea or lake ice mapping algorithm allows for mapping of thin or broken ice with no snow cover (nilas, frazil ice) and thicker ice with snow cover to a degree of confidence that is comparable to other ice mapping products. The proposed index has been applied over the Great Lakes region and qualitatively compared to the Interactive Multi-sensor Snow and Ice Mapping System (IMS), the National Ice Center ice concentration maps and MODIS snow cover products. The application of MISI may open additional possibilities in climate research using historical GOES imagery. Furthermore, MISI may be used in addition to the current NDSI in ice identification to build more robust ice-mapping algorithms for the next generation GOES satellites. Full article
Show Figures

Graphical abstract

3248 KiB  
Letter
Preliminary Comparison of Sentinel-2 and Landsat 8 Imagery for a Combined Use
by Emanuele Mandanici and Gabriele Bitelli
Remote Sens. 2016, 8(12), 1014; https://doi.org/10.3390/rs8121014 - 11 Dec 2016
Cited by 181 | Viewed by 14945
Abstract
The availability of new generation multispectral sensors of the Landsat 8 and Sentinel-2 satellite platforms offers unprecedented opportunities for long-term high-frequency monitoring applications. The present letter aims at highlighting some potentials and challenges deriving from the spectral and spatial characteristics of the two [...] Read more.
The availability of new generation multispectral sensors of the Landsat 8 and Sentinel-2 satellite platforms offers unprecedented opportunities for long-term high-frequency monitoring applications. The present letter aims at highlighting some potentials and challenges deriving from the spectral and spatial characteristics of the two instruments. Some comparisons between corresponding bands and band combinations were performed on the basis of different datasets: the first consists of a set of simulated images derived from a hyperspectral Hyperion image, the other five consist instead of pairs of real images (Landsat 8 and Sentinel-2A) acquired on the same date, over five areas. Results point out that in most cases the two sensors can be well combined; however, some issues arise regarding near-infrared bands when Sentinel-2 data are combined with both Landsat 8 and older Landsat images. Full article
Show Figures

Graphical abstract

712 KiB  
Letter
The Impact of Inter-Modulation Components on Interferometric GNSS-Reflectometry
by Weiqiang Li, Antonio Rius, Fran Fabra, Manuel Martín-Neira, Estel Cardellach, Serni Ribó and Dongkai Yang
Remote Sens. 2016, 8(12), 1013; https://doi.org/10.3390/rs8121013 - 11 Dec 2016
Cited by 11 | Viewed by 4401
Abstract
The interferometric Global Navigation Satellite System Reflectometry (iGNSS-R) exploits the full spectrum of the transmitted GNSS signal to improve the ranging performance for sea surface height applications. The Inter-Modulation (IM) component of the GNSS signals is an additional component that keeps [...] Read more.
The interferometric Global Navigation Satellite System Reflectometry (iGNSS-R) exploits the full spectrum of the transmitted GNSS signal to improve the ranging performance for sea surface height applications. The Inter-Modulation (IM) component of the GNSS signals is an additional component that keeps the power envelope of the composite signals constant. This extra component has been neglected in previous studies on iGNSS-R, in both modelling and instrumentation. This letter takes the GPS L1 signal as an example to analyse the impact of the IM component on iGNSS-R ocean altimetry, including signal-to-noise ratio, the altimetric sensitivity and the final altimetric precision. Analytical results show that previous estimates of the final altimetric precision were underestimated by a factor of 1 . 5 1 . 7 due to the negligence of the IM component, which should be taken into account in proper design of the future spaceborne iGNSS-R altimetry missions. Full article
Show Figures

Figure 1

13550 KiB  
Article
Telecouplings in the East–West Economic Corridor within Borders and Across
by Stephen J. Leisz, Eric Rounds, Ngo The An, Nguyen Thi Bich Yen, Tran Nguyen Bang, Souvanthone Douangphachanh and Bounheuang Ninchaleune
Remote Sens. 2016, 8(12), 1012; https://doi.org/10.3390/rs8121012 - 11 Dec 2016
Cited by 19 | Viewed by 8301
Abstract
In recent years, the concepts of teleconnections and telecoupling have been introduced into land-use and land-cover change literature as frameworks that seek to explain connections between areas that are not in close physical proximity to each other. The conceptual frameworks of teleconnections and [...] Read more.
In recent years, the concepts of teleconnections and telecoupling have been introduced into land-use and land-cover change literature as frameworks that seek to explain connections between areas that are not in close physical proximity to each other. The conceptual frameworks of teleconnections and telecoupling seek to explicitly link land changes in one place, or in a number of places, to distant, usually non-physically connected locations. These conceptual frameworks are offered as new ways of understanding land changes; rather than viewing land-use and land-cover change through discrete land classifications that have been based on the idea of land-use as seen through rural–urban dichotomies, path dependencies and sequential land transitions, and place-based relationships. Focusing on the land-use and land-cover changes taking place along the East–West Economic Corridor that runs from Dong Ha City in Quang Tri, Vietnam, through Sepon District, Savannakhet, Lao PDR, into Thailand this paper makes use of data gathered from fieldwork and remote sensing analysis to examine telecouplings between sending, receiving and spill-over systems on both sides of the Vietnam-Lao PDR border. Findings are that the telecouplings are driving changes in rural village and urban systems on both sides of the border, and are enabled by a policy environment that has sought to facilitate the cross-border transportation of goods within the region. Full article
Show Figures

Figure 1

9748 KiB  
Article
Real-Time Anomaly Detection Based on a Fast Recursive Kernel RX Algorithm
by Chunhui Zhao, Xifeng Yao and Bormin Huang
Remote Sens. 2016, 8(12), 1011; https://doi.org/10.3390/rs8121011 - 11 Dec 2016
Cited by 10 | Viewed by 4238
Abstract
Abstract: Real-time anomaly detection has received wide attention in remote sensing image processing because many moving targets must be detected on a timely basis. A widely-used anomaly detection algorithm is the Reed-Xiaoli (RX) algorithm that was proposed by Reed and Yu. The [...] Read more.
Abstract: Real-time anomaly detection has received wide attention in remote sensing image processing because many moving targets must be detected on a timely basis. A widely-used anomaly detection algorithm is the Reed-Xiaoli (RX) algorithm that was proposed by Reed and Yu. The kernel RX algorithm proposed by Kwon and Nasrabadi is a nonlinear version of the RX algorithm and outperforms the RX algorithm in terms of detection accuracy. However, the kernel RX algorithm is computationally more expensive. This paper presents a novel real-time anomaly detection framework based on the kernel RX algorithm. In the kernel RX detector, the inverse covariance matrix and the estimated mean of the background data in the kernel space are non-causal and computationally inefficient. In this work, a local causal sliding array window is used to ensure the causality of the detection system. Using the matrix inversion lemma and the Woodbury matrix identity, both the inverse covariance matrix and estimated mean can be recursively derived without extensive repetitive calculations, and, therefore, the real-time kernel RX detector can be implemented and processed pixel-by-pixel in real time. To substantiate its effectiveness and utility in real-time anomaly detection, real hyperspectral data sets are utilized for experiments. Full article
Show Figures

Figure 1

9736 KiB  
Article
Dynamic Water Surface Detection Algorithm Applied on PROBA-V Multispectral Data
by Luc Bertels, Bruno Smets and Davy Wolfs
Remote Sens. 2016, 8(12), 1010; https://doi.org/10.3390/rs8121010 - 10 Dec 2016
Cited by 11 | Viewed by 5886
Abstract
Water body detection worldwide using spaceborne remote sensing is a challenging task. A global scale multi-temporal and multi-spectral image analysis method for water body detection was developed. The PROBA-V microsatellite has been fully operational since December 2013 and delivers daily near-global synthesis with [...] Read more.
Water body detection worldwide using spaceborne remote sensing is a challenging task. A global scale multi-temporal and multi-spectral image analysis method for water body detection was developed. The PROBA-V microsatellite has been fully operational since December 2013 and delivers daily near-global synthesis with a spatial resolution of 1 km and 333 m. The Red, Near-InfRared (NIR) and Short Wave InfRared (SWIR) bands of the atmospherically corrected 10-day synthesis images are first Hue, Saturation and Value (HSV) color transformed and subsequently used in a decision tree classification for water body detection. To minimize commission errors four additional data layers are used: the Normalized Difference Vegetation Index (NDVI), Water Body Potential Mask (WBPM), Permanent Glacier Mask (PGM) and Volcanic Soil Mask (VSM). Threshold values on the hue and value bands, expressed by a parabolic function, are used to detect the water bodies. Beside the water bodies layer, a quality layer, based on the water bodies occurrences, is available in the output product. The performance of the Water Bodies Detection Algorithm (WBDA) was assessed using Landsat 8 scenes over 15 regions selected worldwide. A mean Commission Error (CE) of 1.5% was obtained while a mean Omission Error (OE) of 15.4% was obtained for minimum Water Surface Ratio (WSR) = 0.5 and drops to 9.8% for minimum WSR = 0.6. Here, WSR is defined as the fraction of the PROBA-V pixel covered by water as derived from high spatial resolution images, e.g., Landsat 8. Both the CE = 1.5% and OE = 9.8% (WSR = 0.6) fall within the user requirements of 15%. The WBDA is fully operational in the Copernicus Global Land Service and products are freely available. Full article
Show Figures

Graphical abstract

Previous Issue
Next Issue
Back to TopTop