Review

Trends in Automatic Individual Tree Crown Detection and Delineation—Evolution of LiDAR Data

1
Department of Forest Management, School of Forestry, Northeast Forestry University, Harbin 150040, China
2
Department of Environmental Resource Engineering, College of Environmental Science and Forestry, State University of New York, Syracuse, NY 13210, USA
3
Department of Forest and Natural Resources Management, College of Environmental Science and Forestry, State University of New York, Syracuse, NY 13210, USA
*
Author to whom correspondence should be addressed.
Remote Sens. 2016, 8(4), 333; https://doi.org/10.3390/rs8040333
Submission received: 30 January 2016 / Revised: 30 March 2016 / Accepted: 12 April 2016 / Published: 15 April 2016

Abstract

:
Automated individual tree crown detection and delineation (ITCD) using remotely sensed data plays an increasingly significant role in efficiently, accurately, and completely monitoring forests. This paper reviews trends in ITCD research from 1990–2015 from several perspectives—data/forest type, method applied, accuracy assessment and research objective—with a focus on studies using LiDAR data. This review shows that active sources are becoming more prominent in ITCD studies. Studies using active data—LiDAR in particular—accounted for 80% of the total increase over the entire time period, those using passive data or fusion of passive and active data comprised relatively small proportions of the total increase (8% and 12%, respectively). Additionally, ITCD research has moved from incremental adaptations of algorithms developed for passive data sources to innovative approaches that take advantage of the novel characteristics of active datasets like LiDAR. These improvements make it possible to explore more complex forest conditions (e.g., closed hardwood forests, suburban/urban forests) rather than a single forest type although most published ITCD studies still focused on closed softwood (41%) or mixed forest (22%). Approximately one-third of studies applied individual tree level (30%) assessment, with only a quarter reporting more comprehensive multi-level assessment (23%). Almost one-third of studies (32%) that concentrated on forest parameter estimation based on ITCD results had no ITCD-specific evaluation. Comparison of methods continues to be complicated by both choice of reference data and assessment metric; it is imperative to establish a standardized two-level assessment framework to evaluate and compare ITCD algorithms in order to provide specific recommendations about suitable applications of particular algorithms. However, the evolution of active remotely sensed data and novel platforms implies that automated ITCD will continue to be a promising technology and an attractive research topic for both the forestry and remote sensing communities.

Graphical Abstract

1. Introduction

Forest management decision-making processes require inventory information describing the volume and growth of trees, forest plots, stands and large areas [1]. Forest inventory was initially completed by expensive and time-consuming field surveys, with important stand level attributes assessed based on integration of individual tree measurements—such as tree location, species, diameter at breast height (DBH), tree height, and crown width—from sample plots [2,3]. Since the mid-20th century, aerial photographs have been applied to forest inventory and analysis [4,5] and while such data sources created new opportunities and improved the efficiency of forest inventory, visual interpretation of such data remained cost- and labor-intensive. Semi- and fully-automated algorithms for detecting and delineating individual tree crowns from remotely sensed imagery now play a critical role in modern forest inventory in terms of obtaining timely, accurate, and complete forest information. Accurately delineated tree crowns are an essential component of precision forestry and can be used to estimate crown size and DBH [6], crown closure [7], canopy structure [8], height and biomass [9], improve tree species classification [10], and evaluate tree growth through measurement over time [11]. Researchers have used many different terms—e.g., stem number estimation [12], single tree detection [13], and automatic tree recognition [14]—while applying tree detection and delineation techniques to address a variety of objectives. Individual tree crown detection and delineation (ITCD) in this paper refers to the general procedure of recognizing individual trees, including tree top/trunk detection and crown boundary delineation.
Research focused on automatic tree detection and delineation dates back to the mid-1980s, first from passive aerial and satellite imagery, then from data derived from active sensors, and more recently from the integration of multiple data sources [1,15]. Aerial imagery was the original and one of the most critical passive remotely sensed data sources for ITCD studies, mainly because of the high spatial resolution required for analysis at the individual tree level. Improvements in spectral and spatial resolution of satellite imagery have recently played a significant role in enhancing automated delineation of tree crowns; QuickBird and IKONOS are commonly used in ITCD studies [16,17]. However, without moving to stereo acquisition, passive sensors are largely limited to creating two-dimensional representations of tree structure. An alternative to passive sensors are active remote sensing devices that emit energy and then receive portions of the energy reflected back from a target. Active sensors can directly capture vertical tree crown structure, providing novel input of height for ITCD studies. The use of active sensors for individual-tree-based forest inventory began in the late 1990s and early 2000s in Europe [18,19]. LiDAR (light detection and ranging) in particular has been broadly applied and has contributed to the efficiency of local-scale inventories over the past decade [20]. Due to the capacity for high spatial resolution, airborne laser scanner (ALS) data provide significant advantages and dominate the active data sources applied to ITCD [21,22]. The potential for combining optical imagery and active remotely sensed data has also been exploited, especially for individual species identification [10,23]. The complementary nature of multi-source data provides great opportunities for modern forest inventory.
In the last two decades, various semi- and fully-automatic algorithms have been developed for individual tree detection and crown delineation. However, even if one method is best for a specific application, it may not be optimal for other situations. For example, many approaches that worked well on softwood stands have demonstrated lower accuracy for hardwood or mixed forests, particularly those with high variation in terms of tree spacing, age or size, or when the crowns have a high degree of overlap [24,25]. It is challenging to assess the accuracy of ITCD results because there is no standardized accuracy assessment procedure [15], which makes it more difficult to compare ITCD algorithms unless multiple approaches are tested on a single study area using the same accuracy metrics [26]. However, researchers have generally had greater successes in implementing ITCD algorithms on even-spaced, even-aged, and even-sized softwood forests [15].
Though significant accomplishments have been achieved by past studies, ITCD research is still developing. One limitation in improving the accuracy and applicability of ITCD algorithms is that most algorithms do not take advantage of the crown structure represented by the spatial covariance of pixel values (either brightness or height) [27]. In addition, most ITCD algorithms focus on characteristics of individual trees presented by remotely sensed data and ignore ecological processes such as competition among trees. ITCD studies would benefit from integration of traditional techniques and ecological processes (e.g., tree competition) and other methods that handle crown overlap [25,28]. Another limitation is that few approaches take full advantage of the information contained within remotely sensed data, e.g., using only one band of multispectral imagery [29] or only the canopy height model derived from LiDAR data [30]. Significant amounts of information are dismissed or neglected during data preparation or processing. The integration of multispectral data and discrete LiDAR data is commonly used to improve tree species classification [10] and fusion of passive and active remotely sensed data may reduce commission and omission errors in ITCD results [31]. In addition to taking full use of multiple data types, ITCD studies may also benefit from applying data from novel platforms, such as unmanned aerial vehicle- (UAV), terrestrial- and mobile-based laser scanning, which provide distinct spatial and temporal advantages [32,33,34].
Several recent papers have provided reviews of ITCD studies and related topics. Ke and Quackenbush [15] reviewed methods for automatic individual tree crown detection and delineation using passive remotely sensed imagery and discussed the relationship of image resolution and tree crown size, forest condition, image preprocessing, and accuracy assessment on ITCD. Hyyppä et al. [1] reviewed methods for extracting forest inventory data in boreal forest using small-footprint ALS data and provided a good comparison of canopy-height-distribution and individual-tree-based methods. Hyyppä et al. [1] did not focus on ITCD and only considered small footprint (0.2 to 2 m) ALS data. Wulder et al. [35] systematically reviewed LiDAR systems applied to large-area forest characterization, including airborne profiling, scanning (discrete and waveform recording) aerial- and space-borne LiDAR, with a focus on vertically distributed forest attributes, such as height, volume, and biomass. However, none of these studies specifically focused on recent ITCD studies using active remotely sensed data. There is a need to understand the prior applications of active data in ITCD studies in order to develop more efficient and effective solutions that take advantage of the unique characteristics of active data. Thus, the concentration of this paper is to explore and evaluate active data sources, especially LiDAR data, used in ITCD studies.
This paper examines 212 ITCD and related studies from peer-review journals, conference proceedings and academic theses to explore the changes of ITCD studies from different perspectives since 1990. The objectives are: (1) to analyze the trends in the published ITCD research, particularly with consideration to the application of active data sources for ITCD; (2) to summarize ITCD algorithms with a special focus on new ITCD techniques applied to active data sources; (3) to summarize ITCD research in different forest conditions; (4) to summarize the various accuracy assessment methods applied to ITCD research and characterize their focus (e.g., algorithm development, application area, method comparison or review); and (5) to provide recommendations for future work in ITCD.

2. Sources of Reviewed Literature

The literature reviewed in this study was published in both peer-reviewed journals and other sources such as conference proceedings from different communities, including the remote sensing and GIScience, forestry, and computer science communities. The key words such as tree detection, crown delineation, tree identification, were used during literation selection. Papers that reported both semi- and fully-automated ITCD procedures were considered. Table 1 summarizes the sources of the reviewed literature, of which 181 are from peer-reviewed literature and 31 are from non-peer-reviewed sources (212 in total). For peer-reviewed literature, most papers (about 72%) came from the remote sensing and GIScience community, 18% were contributed by the forestry community, and rest of them (about 10%) were from computer science and other fields. All journals containing multiple ITCD studies were listed individually, while journals having only one count combined in “Other related journals”.

3. Application of Active Data Sources for ITCD

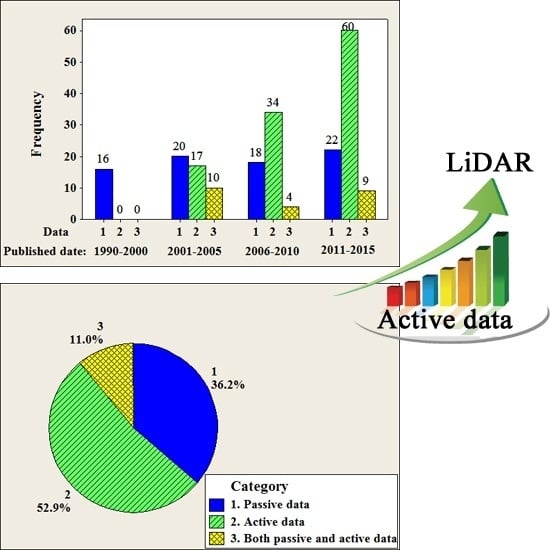
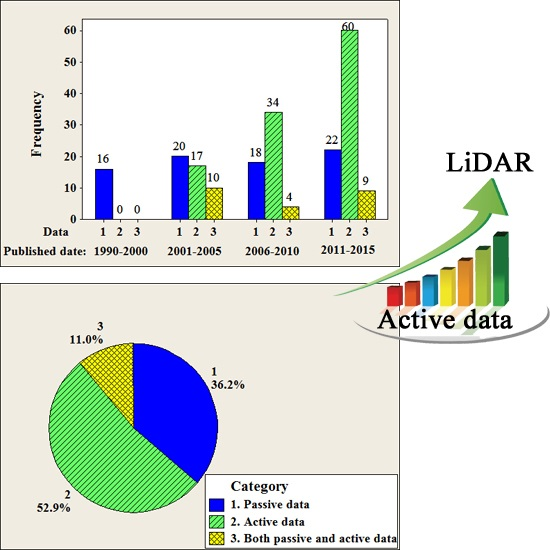
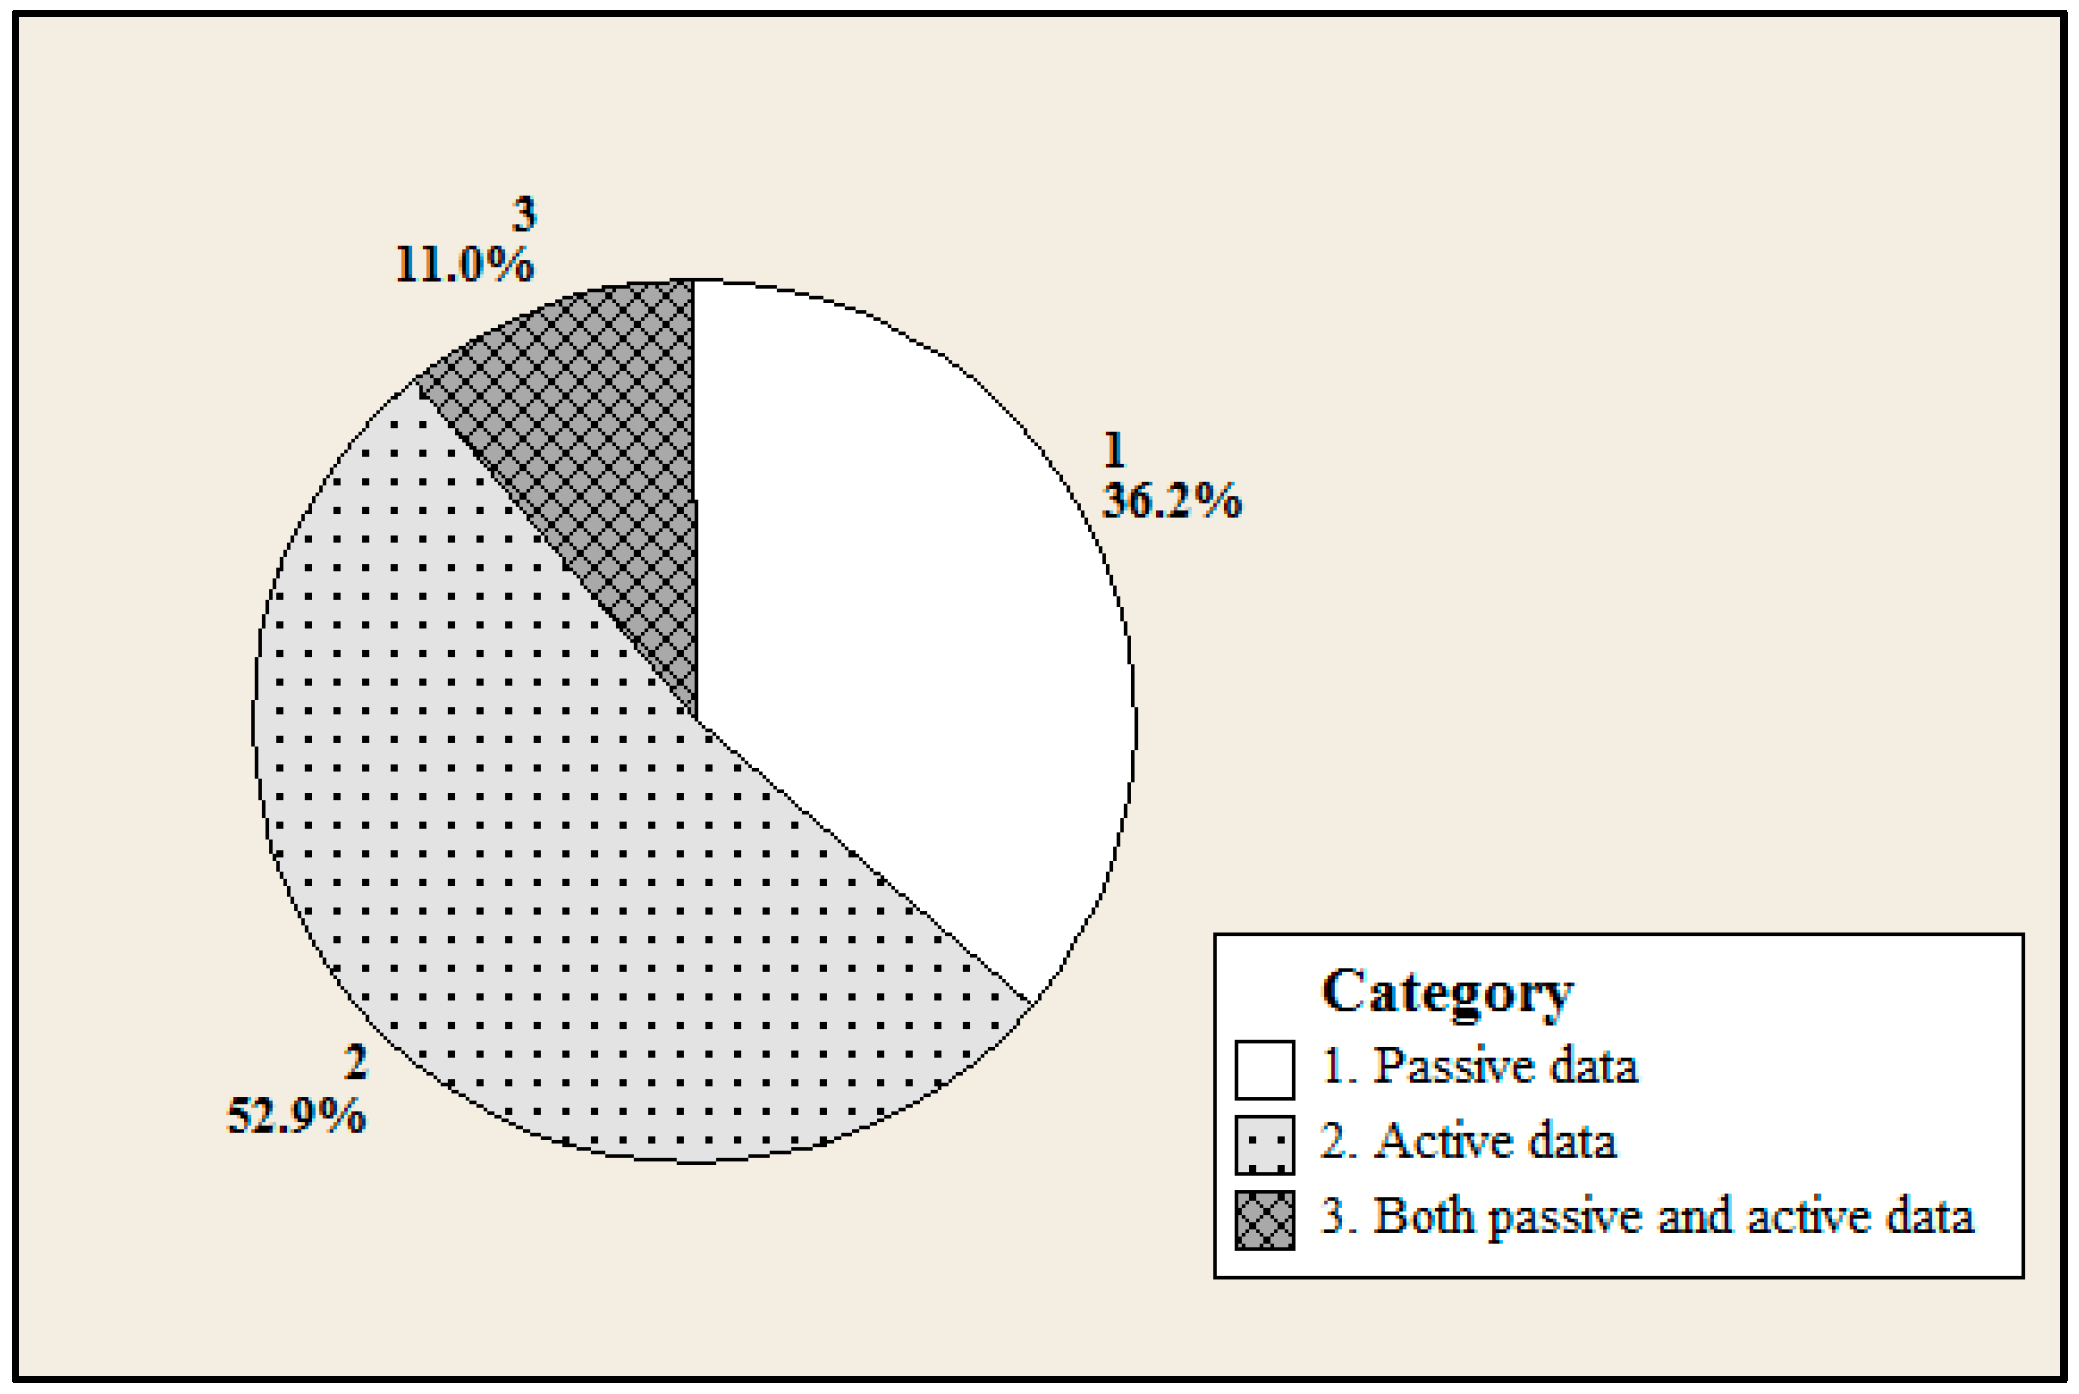
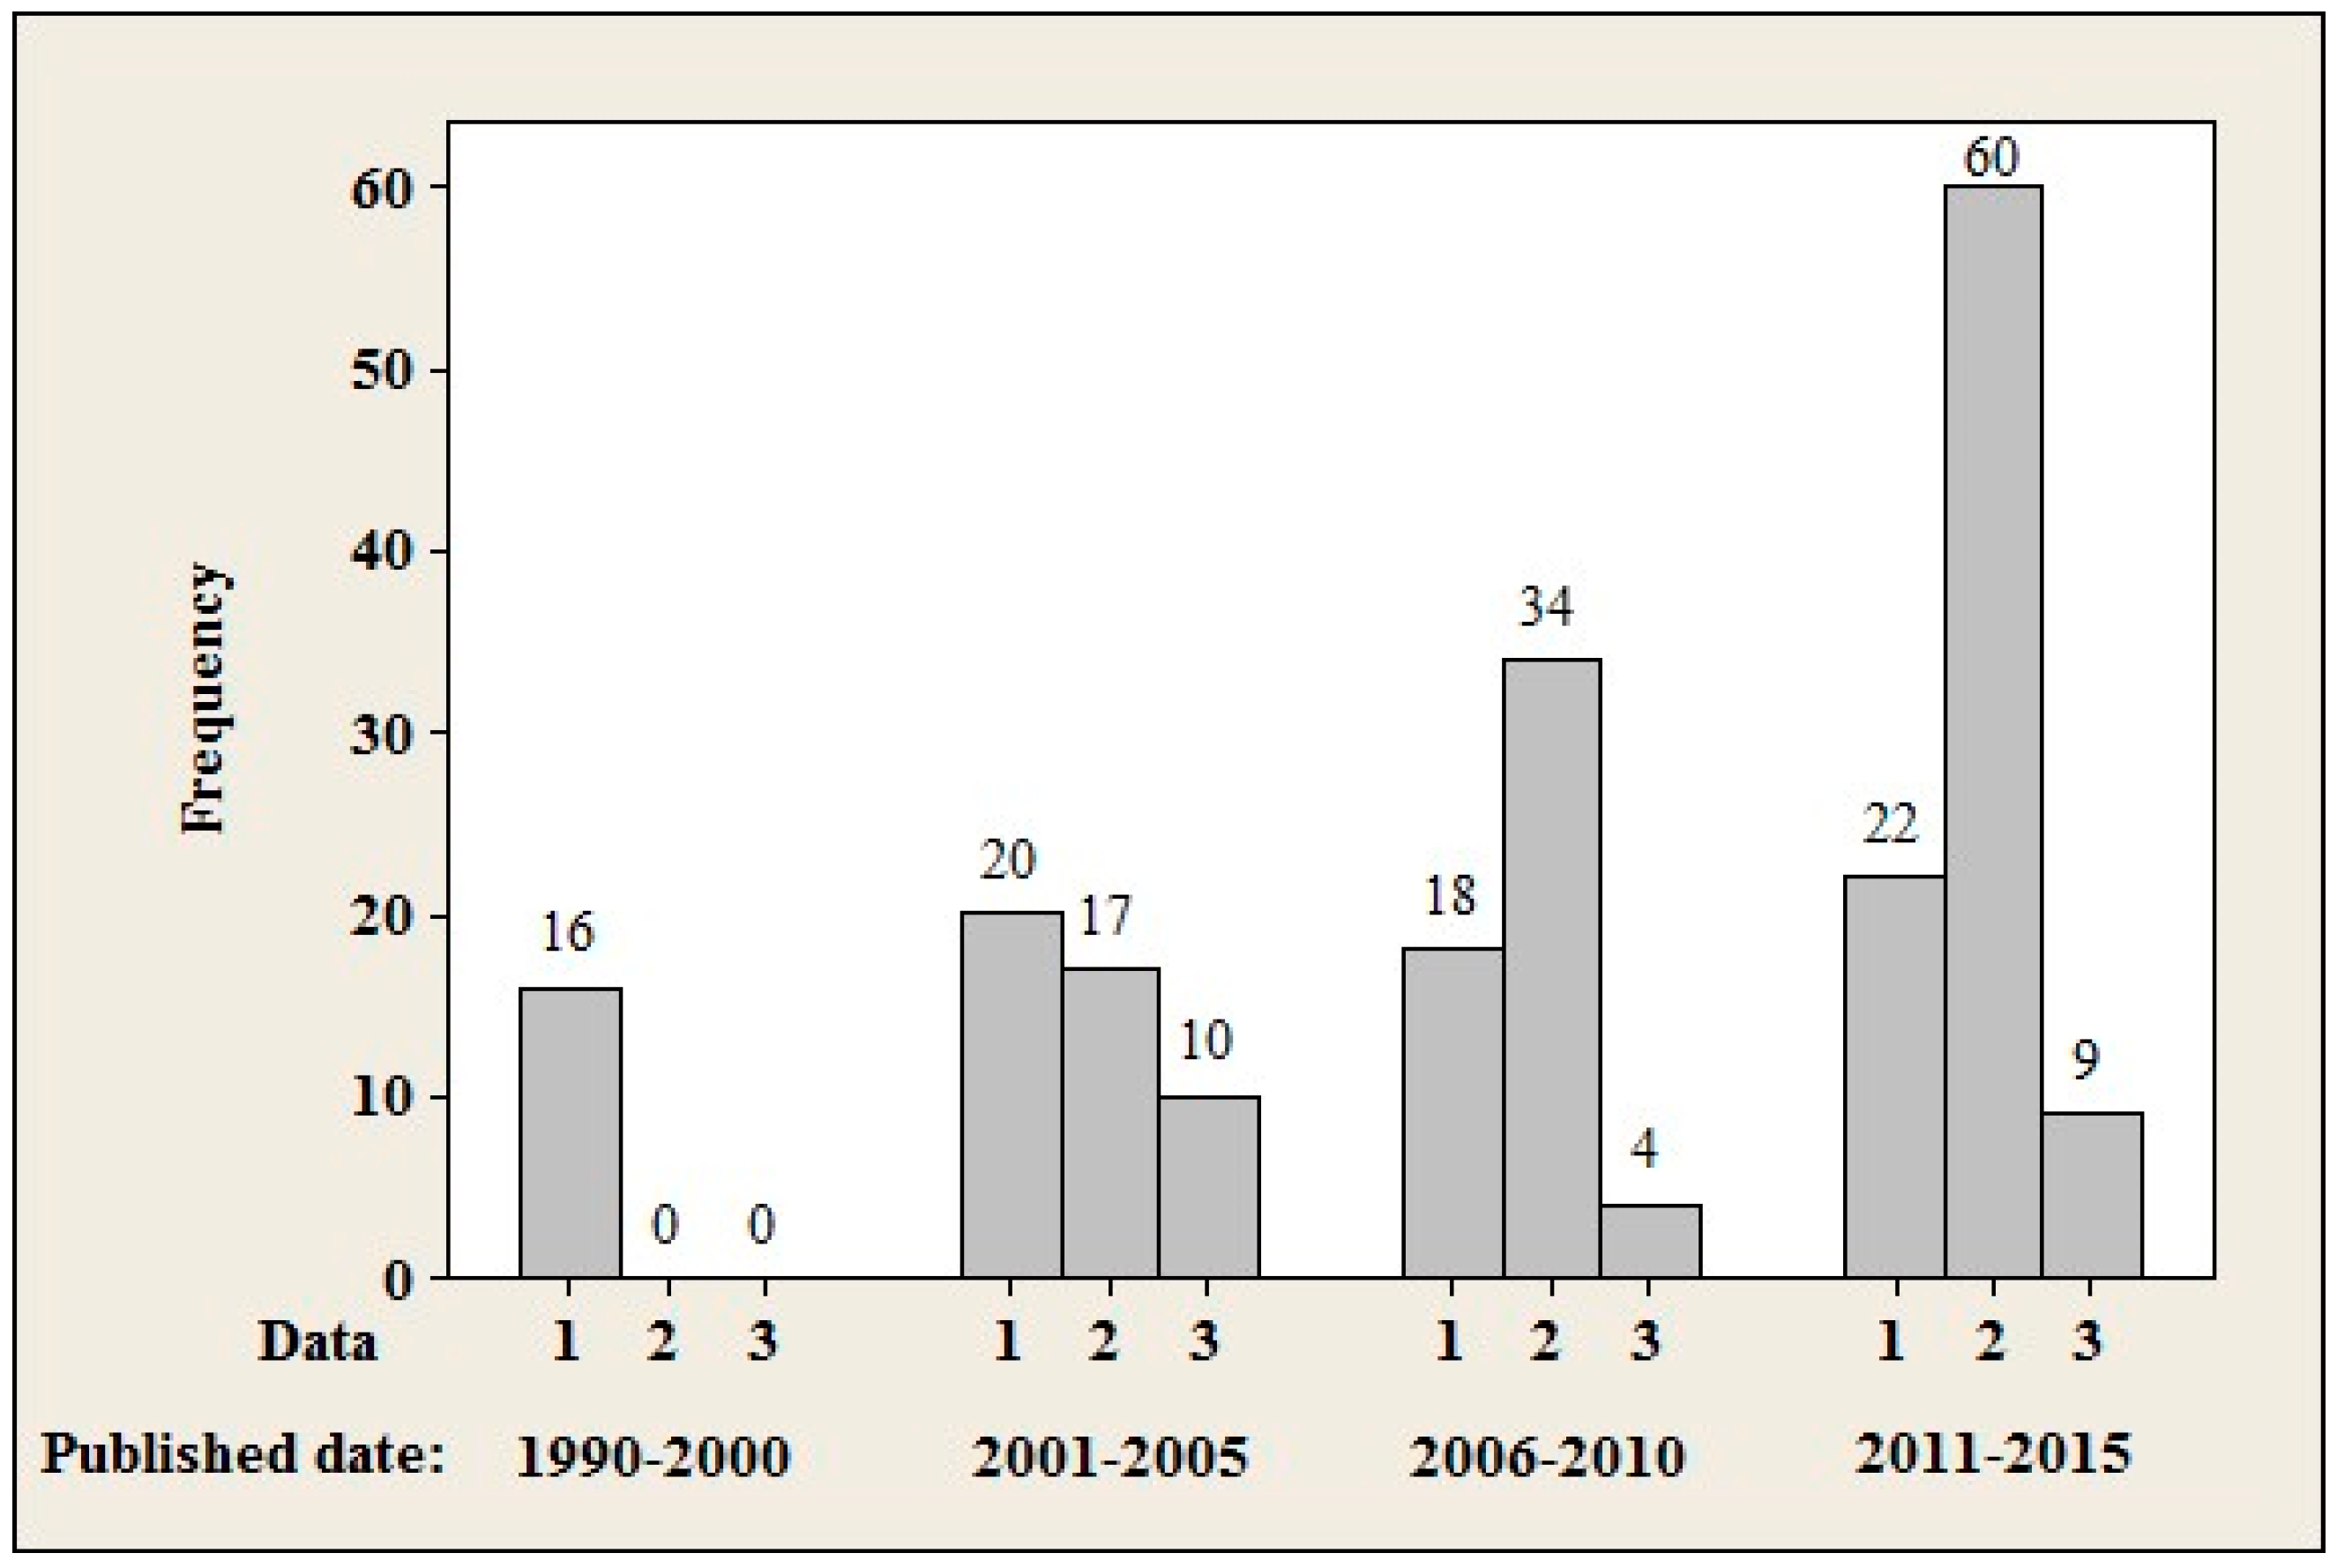
3.1. Trends in Data Applied to ITCD

Researchers have applied a wide variety of datasets to identify and delineate tree crowns. Figure 1 summarized remotely sensed data used in ITCD research as presented in the literature from 1990 to 2015. Review papers that did not consider data for experimentation (2 papers) were excluded in this summary. The data applied in ITCD studies (total number of included papers N = 210) were classified into three categories: passive sources (i.e., multispectral and hyperspectral), active sources (i.e., LiDAR and radar), and studies that fuse passive and active sources. Figure 1 shows that active data applied in ITCD studies account for more than half (52.9%) of the reviewed literature, with passive data applied in about 36.2% of studies, and fusion of passive and active data sources accounting for the remaining 11.0%.
Based on recent published literature, ITCD is increasingly reliant on active data. Figure 2 illustrates the changes in the three categories of input data (i.e., passive, active, and fusion of passive and active data) used from 1990 to 2015 (N = 210). In the 1990s, ITCD studies were very limited and an eleven-year-period (1990–2000) was used. The studies in this period, dominated by passive data and aerial imagery in particular, represented the beginning of ITCD study. Compact Airborne Spectrographic Imager (CASI) and Multi-detector Electro-optical Imaging Sensor (MEIS-II) were the most frequently reported sensor used in the beginning of ITCD studies due to the high spatial resolution [15]. Active data were not reported in ITCD applications until the late 1990s [18,36,37,38]. With the increased availability of higher resolution remotely sensed data, the number of ITCD studies dramatically increased, from 16 (1990–2000) to 47 (2001–2005), to 56 (2006–2010), and then to 91 studies (2011–2015). ITCD studies using active data accounted for 80% of the total increase over the entire time period (75 studies), those using passive and fusion of passive and active data had relative small proportions of the total increase (8% and 12%, respectively). Over the last fifteen years (2001–2015), the use of active data sources in ITCD has had a greater growth (from 17 to 60 studies), compared with the relative stable number of the studies using passive and integration of passive and active data. This increase in studies using active data sources was largely stimulated by the increased availability of data from small-footprint (0.2 to 2 m diameter) airborne laser scanners with high pulse repetition frequency (e.g., 200 kHz) and high pulse density of returns (e.g., >10 points/m2). The high spatial resolution data derived from such systems can meet the ground sampled distance requirements for individual tree measurements [1]. This increased data availability also resulted in great potential for incorporation of passive and active data to extract forest parameters based on individual trees [39].

3.2. Active Data Sources for ITCD

The most widely applied active data source for ITCD in the last decade is discrete return airborne laser scanner data. Three-dimensional ALS data with high spatial resolution facilitate derivation of a large number of statistical features (e.g., tree height, quartile heights, crown base height) that are difficult to generate from spectral imagery. For example, Hyyppä et al. [40] used high-pulse-rate laser scanners to detect single trees in boreal forest zones in order to retrieve important stand attributes (i.e., mean height, basal area and stem volume). Yu et al. [11] used small footprint, high sampling density ALS data to detect harvested trees and estimate tree growth. Forzieri et al. [41] presented a new time- and cost-effective procedure to automatically detect tree position and estimate crown boundaries and plant density using a canopy height model (CHM) with 1 m pixel size derived from ALS data. Brandtberg et al. [42] identified individual deciduous trees using small footprint, high density leaf-off ALS data collected during winter surveys. Although snow is a good reflector of the laser beam, Brandtberg et al. [42] found that this did not confound their analysis because the majority of the return signals came from within the canopy rather than the forest floor.
In addition to discrete LiDAR data, full waveform LiDAR systems are useful for capturing continuous vertical vegetation profiles and reconstructing tree canopy or tree height profiles [8,43] since the full waveform systems record continuous reflected energy. Since full-waveform LiDAR can produce dense point clouds, it is also expected to improve individual tree detection, especially in the case of trees that are not dominant in the canopy [26]. Gupta et al. [44] applied full-waveform LiDAR to extract individual trees/tree crowns using clustering algorithms, but did not quantitatively validate the results due to a lack of field inventory data. While these studies suggest that small footprint full-waveform LiDAR data have high potential to be useful in forest inventory, the data are not as widely available as discrete LiDAR data, has higher costs, and is more challenging to process, thus comprises a minority of published LiDAR ITCD studies.
Although ALS has advantages in terms of deriving individual tree parameters, it can result in large data volumes and high operation costs due to the narrow swath widths and the high sampling rate necessary to achieve high resolution [45], especially when used for large areas. An alternative active data source for covering large areas is synthetic aperture radar (SAR) data. ALS and SAR are both active sensors, with volume measurement capability, but these two sensors record data reflected in fundamentally different wavelengths. SAR applies longer wavelength microwave energy, which has stronger penetration than the visible and near infrared bands used by ALS systems and avoids interference caused by cloud cover [46]. SAR data with appropriate wavelengths can detect tree trunks due to strong canopy penetration and the backscatter has a linear relationship with stocking volume even for dense forests [47,48]. The ability of SAR to penetrate the canopy and detect trunks allows lower spatial resolution to meet the requirements for mapping individual trees compared to that required by ALS or multispectral sensors [45]. For example, Hallberg et al. [45] co-registered and combined multiple SAR images captured with different look directions from the CARABAS (coherent all radio band sensing)-II system to improve detection and measurement of individual trees. However, SAR-based studies have generally focused on stand-level analysis [46,49], and fewer have focused on individual tree-level measurement [45,50]. The characteristics of SAR lead to specific advantages for stem volume estimation [51,52] rather than ITCD algorithm development. By contrast, ALS data can detect tree crowns and provide good estimates of tree height, thus this is the dominant active data source used in ITCD studies and consequently is the focus of the paper.

3.3. Data Integration for ITCD

Active data sources directly enable characterization of the three-dimensional structure of a forested region, but most typically use a single spectral channel and thus do not have the classification capacity inherent in multispectral data. Conversely, passive data sources generally rely on indirect observations, e.g., changes in local illumination effects, to try to identify tree tops. The integration of the two-dimensional spectral information with height information is valuable for researchers studying in the ITCD field. Since 2000, numerous ITCD studies have considered the benefit of integrating passive and active remotely sensed data. This review revealed several characteristics related to the types of data integrated for ITCD applications as well as the ways in which those data were used.
The integration of passive and active data mainly focused on integrating ALS and high resolution aerial or satellite imagery (e.g., QuickBird, IKONOS) due to the spatial resolution requirements for ITCD [31,53,54]. Hyyppä et al. [55] improved the cost-effectiveness (i.e., accuracy of estimates vs. applied costs) of prior crown delineation algorithms using a hybrid of ALS and color infrared images. They found the result of ITCD using aerial imagery was significantly improved by adding tree height from ALS data, and considered this as a potentially cost-effective operational forest inventory method.
Most studies using both high resolution imagery and ALS data focused on using the combined data to derive forest parameters, especially species-related information, on an individual tree level based on ITCD results, rather than integrating the different data types within the ITCD algorithm itself. This is because ALS data with appropriate point density can provide accurate height information, crown shape and size, which complements the spatial geometry and spectral information derived from multispectral imagery that are typically applied for classification of tree species and health [1]. For instance, Breidenbach et al. [23] enhanced ITCD based on the fusion of ALS and aerial imagery and then applied the ITCD results to predict species-specific volume. Chen et al. [56] integrated QuickBird and ALS transects using a geographic object-based image analysis (GEOBIA) method to estimate canopy height, aboveground biomass, and volume based on ITCD results in places where the ALS data were not available. Therefore, the integration of ALS data and high spatial resolution multispectral images has great advantages to support the demands of individual-tree-based forest inventory based on ITCD procedure. However, most of these integrated studies use active data sources for crown delineation and then applied multispectral imagery, e.g., to perform species classification. Only 23 studies actually integrated both active and passive data sources into the ITCD procedure since 2000 (Figure 2). The third data category in Figure 1 and Figure 2 represents research that performed an ITCD procedure using both passive and active data, rather than using only one data source for ITCD and the other data for another purpose.
Although many researchers attempt to improve ITCD results using multiple data sources, the integration of data types for ITCD still has great potential. Leckie et al. [57] applied a valley following approach to isolate individual trees on high resolution digital frame camera imagery and LiDAR data separately, and then combined the two results for estimating tree heights. They found that LiDAR easily eliminated most of the commission errors that often occur in optical imagery of open stands, whereas the optical imagery better isolated crowns in more dense stands than LiDAR. The combination of the two datasets produced good tree isolation and height values. Heinzel and Koch [10] delineated crowns using a watershed-based segmentation of a LiDAR-based surface model, and then addressed the challenge of tree species classification of dense and mixed temperate forest by integrating multiple data sources, including full waveform LiDAR, color infrared imagery and hyperspectral HyMap imagery.
In general, multiple data sources used in ITCD studies can be fused on data [23] or ITCD-product levels [57]. The fusion of LiDAR and passive imagery is often applied to species-specific forest inventory while the fusion of LiDAR and radar data tends to be applied for volume or biomass inventory. Radar data provide a more generalized and mid-canopy response, whereas LiDAR offers a complementary data source that helps to calibrate and refine the radar measurements [35]. However, while studies have integrated SAR and ALS data for biomass inventory (e.g., [58]), height estimation [59], and mapping structure [60], few studies have harnessed the synergy of LiDAR and radar for the ITCD procedure itself due to the high cost and complicated nature of the fusion.

4. ITCD Methodology

4.1. Development of ITCD Methods

Over the last two decades, researchers have developed various semi- and fully-automatic algorithms for detecting and delineating tree crowns. Many ITCD approaches detect tree location prior to delineating crowns, and others combine these fundamental components in a single step [61,62]. The basic assumption of most ITCD studies using multispectral imagery is that the tree top is located at the point with the maximum radiometric value and these values decrease toward the crown boundary [13,63]. In the image domain, classic treetop detection algorithms include local maximum filtering, image binarization or thresholding, and template matching, while classic crown delineation algorithms include valley-following, region-growing, and watershed segmentation [15]. These algorithms, which were initially developed for application to passive data, have undergone a range of improvement efforts in recent years. For example, Hung et al. [64] presented a novel template matching crown detection algorithm using object-shadow relationships and prior knowledge of shadow and tree crown color features on visible band imagery. This method outperformed previously published template matching approaches in open areas where traditional methods work poorly because intensity maxima do not necessarily correspond to tree crowns. Ardila et al. [65] proposed a contextual and probabilistic method for detecting tree crowns in urban areas in very high resolution satellite images to address two main ITCD issues. First, they used a super resolution mapping approach to detect trees that were not evident at the native image resolution; and second, they incorporated contextual information with a Markov random field approach to overcome the mixed pixel effect and the large within-class spectral variance inherent to very high resolution images. Horváth et al. [29] published a theoretical study about higher-order active contours (HOACs) for individual tree extraction based on aerial imagery. They found that HOACs were better at separating tree clusters than classical active contour models. Since the ITCD approaches based on passive data have been well documented [15], this study focuses on ITCD methodologies particularly developed for active data alone or fused with passive datasets.

4.2. ITCD Methods Based on Active and Fused Data

This chapter focuses on algorithms developed to work with LiDAR data, which is the dominant active data type (97%) used in ITCD. ITCD studies using LiDAR data typically utilize a CHM or digital surface model (DSM) and assume the tree top is the point with local maximum height value. Crown boundaries are assumed to be outlines with minimum height value [31,66]. ITCD approaches have been greatly enriched by a number of three-dimensional (3D) methods using LiDAR data, which Koch et al. [67] grouped into four categories: (1) raster-based methods; (2) point cloud based methods; (3) methods combining raster, point, and a priori information; and (4) tree shape reconstruction methods. Figure 3 summarizes the literature related to applying methods within these four ITCD categories to LiDAR data. Only 136 ITCD studies using LiDAR data are included. This figure shows that raster-based methods dominated the LiDAR-based ITCD approaches (66.2%), followed by point cloud-based methods (20.6%), methods combining raster, point and a priori information (9.6%), and then tree shape reconstruction methods (3.7%).
Figure 4 summarizes the application of the four different types of methods using LiDAR data for ITCD based on publication date (N = 136). Although 130 papers used LiDAR data, six of them applied combinations of two methods and are thus double counted, which resulted in N = 136 for Figure 4. In every period, the number of papers using raster-based methods overwhelmed all other methods. Since LiDAR data had not been used in ITCD studies until the beginning of 21st century, it is not surprising that only two types of methods (raster-based method and point cloud-based method) were applied from 2001–2005. All methods had a significant increase after 2005, especially the point cloud-based method (from two to 19 papers).
Table 2 summarizes the characteristics of four methods using LiDAR data in ITCD. The details of each method were explained in Section 4.2.1, Section 4.2.2, Section 4.2.3 and Section 4.2.4.

4.2.1. Raster-Based Methods

Given the fact that passive data dominated the data sources for ITCD studies before 2005 (Figure 2), raster-based methods have a longer development history than other approaches, thus it is not surprising that this is the dominant method for LiDAR inputs. All traditional tree detection and delineation algorithms (e.g., local maximum, template matching, region-growing, and watershed segmentation) can be used on a raster CHM, which is extracted from the laser point cloud, interpolated and smoothed [67]. In addition to the CHM, researchers have also considered other LiDAR-derived products for ITCD. For example, Lee and Lucas [68] proposed the Height-Scaled Crown Openness Index (HSCOI), which typically complemented the CHM and facilitated identification of the location, density, and height of tree stems associated with both the upper and sub-canopy strata. Chen et al. [62] proposed the canopy maximum model (CMM) for eliminating commission error caused by branches within crowns. The CMM was successfully applied in subsequent studies [25]. Using most traditional approaches, tree detection is generally based on finding local maxima within the image, and crown delineation requires outlining minimum valleys regardless of whether the input is a passive image or a CHM/DSM/CMM raster [40,62,63,66].
In recent years, raster-based methods have been incrementally advanced mainly from two perspectives: (1) addressing a specific issue; and (2) incorporating a GEOBIA approach. For the first perspective, there are many examples of studies that seek to improve an algorithm by targeting a specific challenge. For example, Gleason and Im [69] proposed a new method aimed at improving delineation within dense forest conditions. They applied their algorithm—Crown delineation based on Optimized object recognition, Treetop identification, and Hill-climbing (COTH)—to LiDAR data and yielded 72.5% overall areal delineation accuracy for biomass estimation of dense forest. The COTH method uses a genetic algorithm to optimize object recognition to detect tree crown objects, local maxima filtering with variable window size to detect treetops, and a modified hill climbing algorithm to segment crown objects. Liu et al. [70] developed an algorithm called Fishing Net Dragging (FiND) to perform ITCD for complex deciduous forests where trees with varying height exist. Zhen et al. [25] proposed an agent-based region growing based on ALS data that considered ecological processes in the region growing algorithm to address competition when tree crowns touch each other.
The other perspective that has received significant attention, is the advancement of methods that apply geographic object-based image analysis. GEOBIA-based methods provide an effective approach to apply multiple data sources to generate crown-like shape. For example, Suarez et al. [54] segmented individual trees from the fusion of a tree canopy model derived from LiDAR and digital aerial photography based on an object-based method, and then estimated the number of trees and individual tree heights. Heenkenda et al. [71] evaluated several different GEOBIA approaches for isolating mangrove tree crowns using a WorldView-2 image and a DSM generated from true color aerial photographs. They found that the combination of local maxima and region growing using the WorldView-2 image provided the highest accuracy, while the watershed method was only suitable for homogeneous forests with reasonable height variation among trees. The development of GEOBIA has also facilitated the use of multiple scales to delineate individual tree crowns that generally vary in size in imagery with a consistent spatial resolution. Ardila et al. [16] applied GEOBIA at multiple segmentation scale to locate and delineate tree crowns in urban areas using high resolution imagery and successfully detected 70%–80% of the trees in their study area. Mallinis et al. [72] applied GEOBIA multi-resolution segmentation and fuzzy-rule-based classification approach to isolate and delineate tree crown regions from the understory and other land cover classes for canopy fuel load estimation and mapping in heterogeneous pine forests. Chen et al. [56] provided a semi-automatic GEOBIA approach within a multi-resolution algorithm to estimate canopy height, above-ground biomass and volume at individual tree crown or small tree cluster level. However, raster-based methods using active data require extraction, interpolation and smoothing procedures, which all have the potential to cause errors. Thus, point cloud-based methods are considered to avoid the potential errors.

4.2.2. Point Cloud-Based Methods

In the last decade (2006–2015), researchers paid increased attention to point cloud-based methods that directly apply LiDAR point data (see Figure 4). Two classic point cloud-based methods are k-means clustering techniques and voxel-based single tree segmentation [67]. The k-means clustering method is a popular iterative partitioning approach that usually requires seed points and then partitions LiDAR points into a group of clusters using a distance criterion [44]. Morsdorf et al. [73] found that it is feasible to segment single trees in LiDAR point data using cluster analysis with local maxima as seeds points. They derived tree position, tree height, and crown diameter from the segmented clusters and used a geometric reconstruction of the forest scene in physically-based fire behavior models. Gupta et al. [44] compared various k-means clustering methods (normal k-means, modified k-means, and hierarchical clustering) for ITCD. Gupta et al. [44] found that the modified k-means algorithm using external seed points combined with scaling down the height for initialization of the clustering process was the most promising method for the extraction of clusters of individual trees. Li et al. [74] described a 3D point-based method that used the highest points within a threshold distance as seed points and grew the cluster within a threshold moving downwards. This method worked well for mixed coniferous forests, but the performance for natural or uneven-aged stands is unknown. Kandare et al. [75] presented an approach that exploited 2D and 3D k-means clustering techniques from ALS point clouds to detect over- and understory trees. This method provided a greater number of detected trees than field inventory in experimental plots, but was in a good agreement with the field data on an individual tree level.
A voxel or volumetric pixel is a representation of LiDAR data that has been frequently used in ITCD related studies in recent years, and is also a basic 3D element for exploring canopy structures. Popescu and Zhao [76] developed a voxel-based method to estimate crown base height after using local maximum focal filtering from a CHM for ITCD. Wang et al. [77] used voxels to represent canopy layers from different height levels and defined a local voxel space by projecting the normalized points onto a 2D horizontal plane. The projection used by Wang et al. [77] started with the voxels of the top layer and moved downwards layer by layer to create a representation of the distribution of reflections from tree crowns in the corresponding height levels. Wu et al. [34] presented a new Voxel-based Marked Neighborhood Searching (VMNS) method for efficiently identifying street trees and deriving their morphological parameters from mobile laser scanning (MLS) point cloud data. The VMNS method has six components (voxelization, calculating values of voxels, searching and marking neighborhoods, extracting potential trees, deriving morphological parameters, and eliminating pole-like objects other than trees) and achieved promising completeness and correctness with over 98% of street trees detected. Although voxel-based methods provide a convenient way to reflect canopy structure, they are greatly impacted by the density of the LiDAR points. It is normally easier to delineate the uppermost part of individual crowns because of the greater concentration of LiDAR reflections from the tree tops. However, delineation in multi-layer forests becomes more difficult because of both the decrease in reflections in the lower layers and the increase in overlap between neighboring crowns. Data quality and stand characteristics also influence the resolution of voxel layers [67]. Wang et al. [77] found that a resolution between 0.5 and 1 m for the voxel layers provided the best ITCD results, which they generated from LiDAR data with 12 points per m2 in even-aged and multistory old-growth forest.

4.2.3. Combining Raster, Point and a priori Information

With the increase of information and richness of data, many researchers have explored the benefit of integrating raster, point and a priori information in ITCD studies. The integrations were conducted using multiple approaches. Some researchers used methods that adapted ITCD algorithms to take advantage of prior information (like stand density) for segmentation; while other methods combined image and point cloud analyses [67].
The most useful information that can be incorporated into ITCD studies is the expected crown size and stand density [25,67]. Heinzel et al. [78] introduced a prior-knowledge-based watershed segmentation that first classified crown sizes using iterative granulometry and then delineated tree crowns using watershed segmentation. Chen et al. [62] and Zhen et al. [31] employed local maxima methods with variable window size to detect treetops based on crown size estimates. Ene et al. [79] generated CHMs with variable resolutions and selected the most feasible CHM using area-based stem number estimates to guide filter size. Hauglin et al. [80] designed an adaptive approach that initially delineated crowns from a CHM using a marker-based watershed algorithm and then guided final delineation using a priori area-based stem number predictions.
From a data-integration perspective, methods that combine image and point cloud analyses are frequently used. For instance, Reitberger et al. [81] segmented individual tree crowns using conventional watershed algorithm based on CHM and followed this with a 3D segmentation of single trees using normalized cut segmentation based on point cloud data for segmenting small trees that fell below the CHM. Duncanson et al. [82] implemented watershed-based ITCD of a CHM and subsequently refined the results using a LiDAR point cloud. The algorithm performed well not only for dominant and codominant trees, but also for intermediate and suppressed trees, and worked better to detect understory crowns in the conifer-dominated site than in the closed-canopy deciduous site. Tochon et al. [83] proposed a new hyperspectral image segmentation—binary partition tree (BPT) algorithm—for segmenting tree crowns in tropical rainforests. The BPT algorithm moved from an initial segmentation using a LiDAR-derived CHM. However, LiDAR data were only employed to generate initial segmentation results. Like many studies that use only one component of a particular dataset, there is the potential to explore the use of point data to overcome underestimation that Tochon et al. [83] reported.

4.2.4. Tree Shape Reconstruction

Another approach that has potential for ITCD is incorporation of methods that consider tree shape. Three-dimensional crown structure provides critical information for estimating the amount of foliage and photosynthetic activity of trees [84]. Tree shape reconstruction is generally based on successful segmentation of single trees, which requires additional refinement in horizontal and vertical directions [67], and thus has the potential to provide value for ITCD. Tree shape could be reconstructed using several geometric techniques, e.g., convex hull, alpha shapes, superquadrics, and Hough transform.
Convex hull and alpha shapes are common techniques for reconstructing tree shape. The idea of a convex hull is to establish an envelope to represent the outward curving shape that is typical of tree crowns. The success of such algorithms depends on the number of input points that belong to the convex hull [67]. Gupta et al. [44] compared normal k-means clustering, modified k-means clustering, and hierarchical clustering using weighted average distance algorithm for detecting trees, and then applied an adapted convex hull algorithm, called Quick hull (QHull), for 3D single tree shape reconstruction. Gupta et al. [44] reported that LiDAR point density, forest conditions, terrain type, crown cover, and tree density are the main factors that influence the number and shape of extracted trees. Kandare et al. [75] integrated k-means clustering and convex hull algorithms at both 2D and 3D level to detect over- and understory trees, and reached a good agreement with the field data. Based on a 3D triangulation from a convex hull, Vauhkonen et al. [85] presented an alpha shape approach that applied a predefined parameter (alpha) as a size-criterion to determine the level of detail in the obtained triangulation. When an infinitely large alpha value is used, the triangulation represents the convex hull itself; whereas with an infinitely small alpha value, the shape reverts to input point set [67]. Vauhkonen et al. [85,86,87,88] applied the alpha shape technique to select tree objects for predicting a range of parameters including crown base height, species and crown volume, and found that the approach is sensitive to the applied point density.
In addition to convex hull and alpha shape methods, a range of other geometric shapes have been applied to model segmented single trees. Weinacker et al. [89] reconstructed tree shapes using superquadrics that resemble ellipsoids and quadrics. Superquadrics can resemble shapes like cubes, cylinders, and spindles with varying levels of detail and integrate a range of deformations. Van Leeuwen et al. [90] reconstructed canopy surfaces from a LiDAR point cloud using the Hough transform. They developed a parametric height canopy model from which tree crowns were delineated through simple geometric operations. Van Leeuwen et al. [90] found that the Hough transform was effective for fitting basic primitive shapes (cones) to individual trees in the LiDAR point cloud and facilitating modeling at the tree level.
LiDAR, radar interferometry and photogrammetry are three major approaches for surface reconstruction [84]. Tree shape reconstruction algorithms commonly consider individual tree profiles in three dimensions, which provide more details and can provide unique products for forest inventory. Researchers have also found that it is convenient to estimate tree parameters using geometric tree shape reconstruction algorithms. However, it is challenging to reconstruct crown surfaces using photogrammetry because trees located far from the center of the image, where the viewing angle is oblique, are problematic for processing [13,84]. LiDAR that captures height information at nadir direction or small viewing angles has great potential to directly reconstruct tree shapes and derive forest parameters. For example, Kato et al. [91] derived accurate results for various parameters (i.e., tree height, crown width, live crown base, height of the lowest branch, and crown volume) of coniferous and deciduous tree species from ALS data using wrapped surface reconstruction techniques. They found the wrapped surface technique was not sensitive to errors in estimating tree parameters since the radial basis function used in this technique provides exact interpolation. Studies of tree shape reconstruction based on radar interferometry are rare as well. Varekamp and Hoekman [50] applied interferometric SAR image simulation to support automated canopy reconstruction algorithms. Their simulated data could be used for automatic tree-mapping algorithms that detect tree crowns and estimate three-dimensional crown position, size, shape, and backscatter strength. However, this method requires more reference information (e.g., height of the first live branch, location of large branches) compared to other methods, thus the complication of collecting appropriate field data makes it is difficult to validate tree shape reconstruction techniques [44].

5. ITCD for Different Forest Conditions

Figure 5 summarizes the forest types in the ITCD studies reviewed and classifies them into six categories: closed softwood forest, closed hardwood forest, closed mixed forest, urban/suburban forest, other open forest, and multiple types. The other open forest category includes forest-grassland or forest-agriculture areas, and orchards [7,92]. The multiple types refer to the studies that include more than one of the forest types mentioned above [93,94]. Since some studies that did not identify forest types were excluded in this summary, 207 papers in total are counted. Figure 5 shows that most published ITCD studies focus on closed softwood stands (40.6%). Ke and Quackenbush [15] explained two main reasons for this: (1) coniferous forests are the dominant forest resources in high latitude regions where most ITCD studies were conducted; and (2) most algorithms assume a basic conical crown shape, which is more appropriate for conifers. Closed mixed forest accounts for the second largest proportion (21.7%), and studies have addressed forests in various climatic regions—e.g., tropical rain forests [27,95] and temperate forests [10,96,97]. Most of the closed mixed forests are natural forests [13,22]. Studies that implemented ITCD algorithms on multiple forest types [30,70] make up about 16% of the total studies. The remaining studies (~21%) are fairly evenly distributed among the last three forest condition categories—closed hardwood forest, urban/suburban forest, and other open forest. Deciduous trees usually have more complex treetop shapes, frequently with overlapping crowns, which makes them a more challenging target than conifers for treetop detection and crown delineation and may have contributed to the lower proportion of ITCD studies reported for closed hardwood forest.
Figure 6 illustrates the trend in forest condition reported in the ITCD literature over time (N = 207). Closed softwood forest was the major forest type considered in all time periods. From 2001 to 2005, with the increased studies on closed softwood forest, studies on closed hardwood forest, closed mixed forest and multiple forest types also slightly increased. In the last decade (2006–2015), researchers expanded their interests to address a greater variety of forest conditions than in the 1990s, including the more challenging closed hardwood and mixed forests, as well as open forests. The number of ITCD studies that focused on multiple forest types also gradually increased (from 5 to 19). The variability in forest type considered by ITCD studies has gradually increased alongside the development of algorithms and integration of multiple data sources. However, most studies tend to yield higher accuracy in conifer stands than in deciduous stands, in even-aged rather than uneven-aged stands, in pure rather than mixed stands, and in sparse rather than dense canopy conditions [41,98,99]. Researchers still struggle to identify suppressed or bent trees even using LiDAR data with a high sampling density [100].
In addition to increased data types and developed algorithms, the ability for researchers to expand ITCD studies into different forest conditions has been facilitated by the increased richness of remote sensing platforms, like UAV, mobile and terrestrial platforms. For example, Jaakkola et al. [101] performed tree measurement using a low-cost laser scanning system consisting of GPS/IMU positioning system, two laser scanners, a CCD camera, a spectrometer and a thermal camera. They mounted their imaging system on a vehicle-based platform and used the generated data to develop an object extraction algorithm that was able to achieve 90% completeness and 86% correctness for urban forests. This vehicle platform also provides opportunities for performing basic research and new conceptual development, especially with greater potential for multitemporal data recording. Holopainen et al. [33] compared the accuracy and efficiency of airborne, terrestrial and mobile laser scanning measurements in tree mapping in heterogeneous park forests and found that the accuracies of terrestrial and airborne systems were suitable for operational urban tree mapping. Wu et al. [34] presented the first research in automated extraction of morphological parameters of individual street trees based on MLS data. Lin et al. [102] applied oblique UAV imagery for urban forestry and urban greening studies including detection of individual trees in residential environments. The expansion of these increasingly accessible remote sensing platforms provides unprecedented opportunities to detect and delineate individual trees in various forest conditions. Moreover, while many ITCD algorithms will apply broadly, the differences in the nature of the data collected from these newer platforms may lead to development of new platform-specific algorithms.

6. ITCD Accuracy Assessment

Beyond the algorithm used for crown detection or delineation, the approach used to validate results is another significant issue for ITCD studies. Accuracy assessment conducted in ITCD studies typically has one of two main objectives: (1) determine the accuracy of tree detection, including the number and location of trees (point accuracy); or (2) determine the quality of tree crown delineation, i.e., the boundary of tree crowns (polygon accuracy). Both evaluations can be implemented on stand/plot or individual tree levels. Stand/plot level accuracy is a non-site specific measurement, like detection rate or relative error of crown area, which aggregates accuracy for a stand/plot and avoids the need to match tree locations [31]. Individual tree level accuracy considers site-specific measurements in which the detected treetops or delineated crowns and reference treetops or crowns are compared on a location-by-location basis [103]. Individual accuracy might include measures of commission (tree detected by algorithm does not exist on the ground) and omission (reference tree is not detected by the algorithm) errors. Table 3 summarizes the characteristics of ITCD validation approaches and lists examples of accuracy metrics based on the validation level and target accuracy.
Figure 7 partitions ITCD studies into four categories according to the accuracy assessment method applied: stand/plot level assessment, individual tree level assessment, assessment at both levels, and no validation reported. The total number of papers considered is 210 since two review papers were excluded. Most studies applied individual tree level (30.0%) or multi-level assessment (23.3%), which evaluate the results more comprehensively than using stand/plot level accuracy alone (14.3%). However, it is surprising that almost a third of the studies reported no evaluation (32.4% of the total). Such studies often focused on applying ITCD results for forest parameter estimation, and thus paid more attention to assessment of the parameters derived as opposed to the ITCD accuracy. Figure 8 illustrates the relationship between ITCD validation and the focus of the study (N = 210). ITCD and related literature are summarized into four focus types: (1) research that concentrated on ITCD algorithm development [70,96]; (2) research that concentrated on applying ITCD results for forest parameter estimation or comparing different datasets using published ITCD algorithms [32,108,109]; (3) research considering both algorithm development and application (e.g., [110,111]); and (4) research that concentrated on comparing different ITCD algorithms or reviewing current ITCD studies [112,113]. From Figure 8, it is apparent that most of the ITCD studies (55 papers) without validation fall in the application-focused category. Many of these studies seek to use the ITCD result, with less care about algorithm performance comparing to method-focused ITCD studies. Individual tree level accuracy assessment dominates the method-focused ITCD studies (38 papers) (Figure 8).
Figure 9 summarizes the focus of ITCD related literature by publication date (N = 212). This figure shows that the few ITCD studies from 1999–2000 (16) were mainly focused on the ITCD process. However, from 2001–2005, the major focus became application studies, including estimating individual tree parameters (e.g., tree crown size, DBH, crown closure, and tree volume), conducting stand level analysis, and performing species-level classification. This trend was likely supported by the increasing availability and application of active remotely sensed data (as shown in Figure 2), which provide particular benefits in terms of height and volume determination. From 2006–2010, the focus on ITCD algorithm development rebounded with a comparable number of studies as that of application-focused studies. This trend has continued with ITCD algorithm development being the major objective after 2011. The increase in all ITCD studies in the last five years mirrors the increase in the usage of active data that was shown in Figure 2.

7. Conclusions

Individual tree crown delineation is an important topic for researchers in the forestry, remote sensing, and computer vision communities. This paper reviewed 212 ITCD related studies published over the last two and a half decades (1990–2015) and considered their contributions from various perspectives, including remotely sensed data type, methodology, forest conditions, accuracy assessment, and objective, with a focus on the evolution of active data sources in this analysis. This review enables several conclusions to be drawn from this ITCD research.

7.1. Increasing Transition toward Active Data Sources

After an early focus of ITCD studies on passive remotely sensed data, recent studies are showing a great transition toward the use of active sources and a small increase in the integration of high spatial resolution active and passive data. Since active and passive data sources can provide complementary vertical (e.g., height) and horizontal (e.g., spatial geometry and spectral) information, the fusion of active and passive imagery was often applied for species-specific forest inventory using ITCD results [114,115].
The transition in data type is significantly attributed to the development of remote sensing instruments and increased data availability, especially the increasing application of active sensors. Some researchers fused LiDAR and radar data for volume or biomass inventory [58] because the strong penetration ability of radar can detect trunks, which are highly related to volume or biomass. However, while reports of fusion research have slightly increased, most studies performed fusion on a product level, with few studies using data driven fusion. Thus, it appears that investigation of directly fusing complementary data sources in ITCD algorithms is an attractive area for continued ITCD research [116]. The more complete use of diverse remotely sensed data will further promote development of novel techniques, and support next-generation tree height and canopy delineation approaches.

7.2. Improvements to ITCD Algorithms

ITCD algorithms have advanced from two perspectives: the improvement of traditional algorithms to address specific issues, and the development of novel algorithms taking advantages of active data source or integration of passive and active data sources. However, ITCD algorithms are generally still challenged when applied to complicated forest conditions (e.g., closed hardwood forest and closed softwood–hardwood mixed forest). Additionally, it is often challenging to apply an algorithm developed in one forest type to another area.
Comparison of ITCD algorithms is challenging when there are differences in study focus, study area, data applied, and accuracy assessment method used. Before 2005, the few studies that compared methods generally tested approaches on a common dataset. In the last decade, the number of studies that focused on method comparison and review slightly increased (Figure 9). Comparative studies first concentrated on ITCD algorithms using passive remotely sensed data [117,118], and then moved to those using active remotely sensed data [26]. Good accuracy and simple implementation are significant characters of a valuable ITCD algorithm. Researchers also paid attention to the relationship between algorithm performance and data quality for different forest types. For example, Vauhkonen et al. [85] tested six different ITCD algorithms including raster-based and point-based methods on ALS datasets under different types of forest. Their study addressed the significance of data acquisition parameters such as sampling density, showing that the single-tree approach performed best with dense laser scanning (5–10 laser pulses per m2), while for older trees with large canopies even as few as 2 pulses per m2 may be sufficient. Kaartinen et al. [26] found that optimal point density for ITCD was greatly dependent on tree size and stand density, although ITCD could be implemented with point density of 2 points per m2; for sapling stands, a point density of 10 points per m2 or higher was expected to increase the accuracy. However, none of ITCD algorithms perform optimally for all forest conditions, and the success of tree detection was found to be strongly related to stand density and spatial pattern of trees [25,31].
One potential area for improvement in ITCD algorithms is the utilization of crown structure represented by the spatial covariance of either the spectral (for passive imagery) or height (for LiDAR data) vector. Clark et al. [27] realized that crown structure will influence the spatial covariance structure of the spectral information in each crown, but this spatial component is typically not included in spectral-based analysis. Researchers have also found that the characteristic parameters of image variograms are closely related to forest canopy structures, where the sill is related to the crown density in the scene [119,120]. However, this type of spatial analysis has not been applied to the procedure of individual tree crown delineation.
Another potential improvement area for ITCD algorithm enhancement for complex forests is developing techniques to deal with overlapping crowns [105]. As crowns grow and overlap, the shape of individual crowns will change due to competition. Most current ITCD algorithms focus on the characteristics of individual trees as they appear in remotely sensed data and ignore ecological processes such as tree competition. Researchers have considered a variety of perspectives to incorporate such processes. Zhen et al. [25] proposed an agent-based region growing (ABRG) algorithm that considers both growth and competition mechanisms based on tree height and density. They found that the ABRG algorithm resulted in a statistically significant improvement in the accuracy of individual tree delineations for conifers and deciduous trees, providing a novel approach for integrating traditional ITCD techniques and ecological processes. Hyyppä et al. [121] found that the surface model generated from the LiDAR last pulse presented a more obvious drop in elevation between overlapping trees than that generated from the first pulse. Thus, Hyyppä et al. [121] implemented an individual tree detection procedure using last pulse LiDAR data with an improvement of 6% compared to using first pulse returns. Reitberger et al. [81] combined conventional watershed segmentation with a stem detection method that detected stem positions by hierarchically clustering points below the crown base height, reconstructing the stems with a robust RANSAC-based estimation, and segmenting 3D single trees with normalized cut segmentation. This method could efficiently detect small trees below the canopy. Strîmbu and Strîmbu [122] applied a bottom-up strategy in a graph-based segmentation algorithm that was based on several quantifiable cohesion criteria and a system of weights that balanced the contribution of each criterion. The novel algorithm provided an efficient way to accommodate various forest structures. Lu et al. [28] also proposed a bottom-up method based on the intensity and 3D structure of leaf-off LiDAR point data, and found that it was more efficient to extract tree trunks using their bottom-up method than to detect deciduous tree tops using the more common “top-down” method. However, tree tops are not always in exactly the same location as detected tree trunks. In natural deciduous forests, a tree top can be several meters away from the center of tree trunk at breast height due to natural causes such as wind damage. The impact that this variation in definition of tree location using different ITCD methods could have on subsequent forestry applications has not been well explored.

7.3. Expanding ITCD Application to Address Various Forest Conditions

Although ITCD and related studies have largely been performed on closed softwood forest, researchers have taken up the challenge to develop methods that deal with more complicated forest conditions, such as closed hardwood forest and softwood–hardwood mixed forest. This advancement is due not only to the development of algorithms, but also to the increased availability of different remotely sensed data types and the expansion of remote sensing platforms. However, the exploration of other forest conditions, e.g., forest-agriculture landscape, suburban/urban forests, or orchards, can also greatly enrich ITCD in traditional applications.

7.4. Need for ITCD Accuracy Standardization

While most ITCD studies evaluate accuracy, there is no standardized assessment framework for the field, which makes it difficult to evaluate and compare different studies. The challenges associated with evaluation of accuracy in ITCD studies is complicated by both access to reference data and to the choice of assessment metric applied. Reference data for ITCD assessment is commonly derived from visual interpretation of the imagery used in the analysis or from data collected in the field [15]. Both sources are prone to bias and are somewhat ill-defined, e.g., it is not an easy task to define crown boundaries in the field nor to register tree locations measured in the field with tree locations identified from imagery, even for well-trained personnel. Further, the assessment metrics vary among different studies: plot level accuracy for reporting the quality of tree counts [123]; accuracy indices including both commission and omission errors [117]; root mean square error (RMSE) for comparing arithmetic average of delineated tree crown diameter and the average ground-diameter estimates [105]; delineation accuracy indicators, including over-identification, under-identification, and total delineation error indicator [16]. The inconsistency of evaluation brings challenges not only in performing assessment within an ITCD study but also complicates comparison across different ITCD studies. We recommend a standardized system that addresses the two-levels of accuracy assessment, i.e., both plot and individual tree levels.

7.5. Recommendation for Future Work

Though current ITCD studies greatly contribute to forest inventory needs, there is still room for further development and improvement, particularly with the increased availability of active remotely sensed data. Accuracy of ITCD is not only reliant on algorithm performance, but depends greatly on data quality and characteristics, as well as forest condition. A simple, repeatable assessment procedure is vital to estimate ITCD accuracy with consistency across projects. With continuous development and enhancement of technologies, a software application that incorporates a complete set of ITCD algorithms and selects an appropriate method according to the provided remote sensing data and forest condition could facilitate practical forest inventory. This integration would require broad cooperation and contribution of experts from forestry, remote sensing and computer science communities. The ITCD algorithms applied to date are currently not robust enough for wide-scale application in complicated forest conditions; however, we are incrementally moving toward the point where automated individual tree crown delineation will be sufficiently reliable to support generalized forest inventory.

Acknowledgments

We thank project “Three dimensional individual tree crown delineation based on multiple remotely sensed data sources and tree competition mechanism (31400491)” supported by National Natural Science Foundation of China for financing this paper.

Author Contributions

Zhen Zhen wrote the paper; Lindi J. Quackenbush revised the paper; and Lianjun Zhang contributed comments and suggestions on the paper.

Conflicts of Interest

The authors declare no conflict of interest.

Abbreviations

The following abbreviations are used in this manuscript:
ITCDIndividual tree crown detection and delineation
DBHDiameter at breast height
MODISModerate resolution imaging spectroradiometer
LiDARLight detection and ranging
ALSAirborne laser scanning
UAVUnmanned aerial vehicle
CASICompact airborne spectrographic imager
MEIS-IIMulti-detector electro-optical imaging sensor
CHMCanopy height model
SARSynthetic aperture radar
CARABASCoherent all radio band sensing
GEOBIAGeographic object-based image analysis
HOACsHigher-order active contours
DSMDigital surface model
3DThree-dimensional
HSCOIHeight-scaled crown openness index
CMMCanopy maximum model
COTHCrown delineation based on optimized object recognition, treetop identification, and hill-climbing
FiNDFishing net dragging
VMNSVoxel-based marked neighborhood searching
MLSMobile laser scanning
BPTBinary partition tree
QHullQuick hull
ABRGAgent-based region growing
RMSERoot mean square error

References

  1. Hyyppä, J.; Hyyppä, H.; Leckie, D.; Gougeon, F.; Yu, X.; Maltamo, M. Review of methods of small-footprint airborne laser scanning for extracting forest inventory data in boreal forests. Int. J. Remote Sens. 2008, 29, 1339–1366. [Google Scholar] [CrossRef]
  2. Breidenbach, J.; Astrup, R. Forestry Applications of Airborne Laser Scanning; Maltamo, M., Næsset, E., Vauhkonen, J., Eds.; Springer: Dordrecht, The Netherlands, 2014; Chapter 6; p. 113. [Google Scholar]
  3. Hyyppä, J.; Hyyppä, H.; Inkinen, M.; Engdahl, M.; Linko, S.; Zhu, Y.H. Accuracy comparison of various remote sensing data sources in the retrieval of forest stand attributes. For. Ecol. Manag. 2000, 128, 109–120. [Google Scholar] [CrossRef]
  4. Alemdag, I.S. Estimating oven–dry mass of trembling aspen and white birch using measurements from aerial photographs. Can. J. Remote Sens. 1986, 16, 163–165. [Google Scholar]
  5. Pitt, D.G.; Glover, G.R. Large–scale 35–mm aerial photographs for assessment of vegetation–management research plots in eastern Canada. Can. J. For. Res. 1993, 23, 2159–2169. [Google Scholar] [CrossRef]
  6. Zhang, W.; Ke, Y.; Quackenbush, L.J.; Zhang, L. Using error-in-variable regression to predict tree diameter and crown width from remotely sensed imagery. Can. J. For. Res. 2010, 40, 1095–1108. [Google Scholar] [CrossRef]
  7. Bai, Y.; Walsworth, N.; Roddan, B.; Hill, D.A.; Broersma, K.; Thompson, D. Quantifying tree cover in the forest-grassland ecotone of British Columbia using crown delineation and pattern detection. For. Ecol. Manag. 2005, 212, 92–100. [Google Scholar] [CrossRef]
  8. Harding, D.J.; Lefsky, M.A.; Parker, G.G.; Blair, J.B. Laser altimeter canopy height profiles methods and validation for closed-canopy, broadleaf forests. Remote Sens. Environ. 2001, 76, 283–297. [Google Scholar] [CrossRef]
  9. Popescu, S.C. Estimating biomass of individual pine trees using airborne LiDAR. Biomass Bioenergy 2007, 31, 646–655. [Google Scholar] [CrossRef]
  10. Heinzel, J.; Koch, B. Investigating multiple data sources for tree species classification in temperate forest and use for single tree delineation. Int. J. Appl. Earth Observ. Geoinf. 2012, 18, 101–110. [Google Scholar] [CrossRef]
  11. Yu, X.; Hyyppä, J.; Kaartinen, H.; Maltamo, M. Automatic detection of harvested trees and determination of forest growth using airborne laser scanning. Remote Sens. Environ. 2004, 90, 451–462. [Google Scholar] [CrossRef]
  12. Dralle, K.; Rudemo, M. Stem number estimation by kernel smoothing of aerial photos. Can. J. Remote Sens. 1996, 26, 1228–1236. [Google Scholar] [CrossRef]
  13. Hirschmugl, M.; Ofner, M.; Raggam, J.; Schardt, M. Single tree detection in very high resolution remote sensing data. Remote Sens. Environ. 2007, 110, 533–544. [Google Scholar] [CrossRef]
  14. Leckie, D.G.; Gougeon, F.A.; Tinis, S.; Nelson, T.; Burnett, C.N.; Paradine, D. Automated tree recognition in old growth conifer stands with high resolution digital imagery. Remote Sens. Environ. 2005, 94, 311–326. [Google Scholar] [CrossRef]
  15. Ke, Y.; Quackenbush, L.J. A review of methods for automatic individual tree crown detection and delineation from passive remote sensing. Int. J. Remote Sens. 2011, 32, 4725–4747. [Google Scholar] [CrossRef]
  16. Ardila, J.P.; Bijker, W.; Tolpekin, V.A.; Stein, A. Context-sensitive extraction of tree crown objects in urban areas using VHR satellite images. Int. J. Appl. Earth Observ. Geoinf. 2012, 15, 57–69. [Google Scholar] [CrossRef]
  17. Song, C.; Dickinson, M.B.; Su, L.; Zhang, S.; Yaussey, D. Estimating average tree crown size using spatial information from Ikonos and QuickBird images: Across-sensor and across-site comparisons. Remote Sens. Environ. 2010, 114, 1099–1107. [Google Scholar] [CrossRef]
  18. Hyyppä, J.; Inkinen, M. Detecting and estimating attributes for single trees using laser scanner. Photogramm. J. Finl. 1999, 16, 27–42. [Google Scholar]
  19. Hyyppä, J.; Schardt, M.; Haggrén, H.; Koch, B.; Lohr, U.; Scherrer, H.U.; Paananen, R.; Luukkonen, H.; Ziegler, M.; Hyyppä, H.; et al. HIGH-SCAN: The first European-wide attempt to derive single-tree information from laser scanner data. Photogramm. J. Finl. 2001, 17, 58–68. [Google Scholar]
  20. Næsset, E. Airborne laser scanning as a method in operational forest inventory: Status of accuracy assessments accomplished in Scandinavia. Scand. J. For. Res. 2007, 22, 433–442. [Google Scholar] [CrossRef]
  21. Koch, B.; Heyder, U.; Weinacker, H. Detection of individual trees crowns in airborne LiDAR data. Photogramm. Eng. Remote Sens. 2006, 72, 357–363. [Google Scholar] [CrossRef]
  22. Solberg, S.; Næsset, E.; Bollandsas, O.M. Single tree segmentation using airborne laser scanner data in a structurally heterogeneous spruce forest. Photogramm. Eng. Remote Sens. 2006, 72, 1369–1378. [Google Scholar] [CrossRef]
  23. Breidenbach, J.; Næsset, E.; Lien, V.; Gobakken, T.; Solberg, S. Prediction of species specific forest inventory attributes using a nonparametric semi-individual tree crown approach based on fused airborne laser scanning and multispectral data. Remote Sens. Environ. 2010, 114, 911–924. [Google Scholar] [CrossRef]
  24. Larsen, M.; Eriksson, M.; Descombes, X.; Perrin, G.; Brandtberg, T.; Gougeon, F.A. Comparison of six individual tree crown detection algorithms evaluated under varying forest conditions. Int. J. Remote Sens. 2011, 32, 5827–5852. [Google Scholar] [CrossRef]
  25. Zhen, Z.; Quackenbush, L.J.; Stehman, S.V.; Zhang, L. Agent-based region growing for individual tree crown delineation from airborne laser scanning (ALS) data. Int. J. Remote Sens. 2015, 36, 1965–1993. [Google Scholar] [CrossRef]
  26. Kaartinen, H.; Hyyppä, J.; Yu, X.; Vastaranta, M.; Hyyppä, H. An international comparison of individual tree detection and extraction using airborne laser scanning. Remote Sens. 2012, 4, 950–974. [Google Scholar] [CrossRef] [Green Version]
  27. Clark, M.L.; Roberts, D.A.; Clark, D.B. Hyperspectral discrimination of tropical rain forest tree species at leaf to crown scales. Remote Sens. Environ. 2005, 96, 375–398. [Google Scholar] [CrossRef]
  28. Lu, X.; Guo, Q.; Li, W.; Flanagan, J. A bottom-up approach to segment individual deciduous trees using leaf-off LiDAR point cloud data. ISPRS J. Photogramm. 2014, 94, 1–12. [Google Scholar] [CrossRef]
  29. Horváth, P.; Jermyn, I.H.; Kato, Z.; Zerubia, J. A higher-order active contour model of a “gas of circles” and its application to tree crown extraction. Pattern Recogn. 2009, 42, 699–709. [Google Scholar] [CrossRef] [Green Version]
  30. Lin, C.; Thomson, G.; Lo, C.; Yang, M. A multi-level morphological active contour algorithm for delineating tree crowns in mountainous forest. Photogramm. Eng. Remote. Sens. 2011, 77, 241–249. [Google Scholar] [CrossRef]
  31. Zhen, Z.; Quackenbush, L.J.; Zhang, L. Impact of tree-oriented growth order in marker-controlled region growing for individual tree crown delineation using airborne laser scanner (ALS) data. Remote Sens. 2014, 6, 555–579. [Google Scholar] [CrossRef]
  32. Díaz-Varela, R.A.; Rosa, R.; León, L.; Zarco-Tejada, J. High-resolution airborne UAV imagery to assess Olive tree crown parameters using 3D photo reconstruction: Application in breeding trials. Remote Sens. 2015, 7, 4213–4232. [Google Scholar] [CrossRef]
  33. Holopainen, M.; Kankare, V.; Vastaranta, M.; Liang, X.; Lin, Y.; Vaaja, M.; Yu, X.; Hyyppä, J.; Hyyppä, H.; Kaartinen, H.; et al. Tree mapping using airborne, terrestrial and mobile laser scanning–A case study in a heterogeneous urban forest. Urban For. Urban Green. 2013, 12, 546–553. [Google Scholar] [CrossRef]
  34. Wu, B.; Yu, B.; Yue, W.; Shu, S.; Tan, W.; Hu, C.; Huang, Y.; Wu, J.; Liu, H. A voxel-based method for automated identification and morphological parameters estimation of individual street trees from mobile laser scanning data. Remote Sens. 2013, 5, 581–611. [Google Scholar] [CrossRef]
  35. Wulder, M.A.; White, J.C.; Nelson, R.F.; Næsset, E.; Ørka, H.O.; Coops, N.C.; Hilker, T.; Bater, C.W.; Gobakken, T. LiDAR sampling for large-area forest characterization: A review. Remote Sens. Environ. 2012, 121, 196–209. [Google Scholar] [CrossRef]
  36. Borgefors, G.; Brandtberg, T.; Walter, F. Forest parameter extraction from airborne sensors. Int. Arch. Photogramm. Remote Sens. 1999, 32, 151–158. [Google Scholar]
  37. Hyyppä, H.; Hyyppä, J. Comparing the accuracy of laser scanner with other optical remote sensing data sources for stand attributes retrieval. Photogramm. J. Finl. 1999, 16, 5–15. [Google Scholar]
  38. Pyysalo, U. A method to create a three-dimensional forest model from laser scanning data. Photogramm. J. Finl. 2000, 17, 34–42. [Google Scholar]
  39. Koukoulas, S.; Blackburn, G. Mapping individual tree location, height and species in broadleaved deciduous forest using airborne LiDAR and multi-spectral remotely sensed data. Int. J. Remote Sens. 2005, 26, 431–455. [Google Scholar] [CrossRef]
  40. Hyyppä, J.; Kelle, O.; Lehikoinen, M.; Inkinen, M. A segmentation-based method to retrieve stem volume estimates from 3D tree height models produced by laser scanners. IEEE Trans. Geosci. Remote Sens. 2001, 39, 969–975. [Google Scholar] [CrossRef]
  41. Forzieri, G.; Guarnieri, L.; Vivoni, E.R.; Castelli, F.; Preti, F. Multiple attribute decision making for individual tree detection using high-resolution laser scanning. For. Ecol. Manag. 2009, 258, 2501–2510. [Google Scholar] [CrossRef]
  42. Brandtberg, T.; Warner, T.A.; Landenberger, R.E.; McGraw, J.B. Detection and analysis of individual leaf-off tree crowns in small footprint, high sampling density LiDAR data from the eastern deciduous forest in North America. Remote Sens. Environ. 2003, 85, 290–303. [Google Scholar] [CrossRef]
  43. Lefsky, M.A.; Hudak, A.T.; Cohen, W.B.; Acker, S.A. Patterns of covariance between forest stand and canopy structure in the Pacific Northwest. Remote Sens. Environ. 2005, 95, 517–531. [Google Scholar] [CrossRef]
  44. Gupta, S.; Weinacker, H.; Koch, B. Comparative analysis of clustering-based approaches for 3-D single tree detection using airborne fullwave LiDAR data. Remote Sens. 2010, 2, 968–989. [Google Scholar] [CrossRef]
  45. Hallberg, B.; Smith-Jonforsen, G.; Ulander, L.M.H. Measurements on individual trees using multiple VHF SAR images. IEEE Trans. Geosci. Remote Sens. 2005, 43, 2261–2269. [Google Scholar] [CrossRef]
  46. Fransson, J.E.S.; Smith, G.; Walter, F.; Gustavsson, A.; Ulander, L.M.H. Estimation of forest stem volume in sloping terrain using CARABAS-II VHF SAR data. Can. J. Remote Sens. 2004, 30, 651–660. [Google Scholar] [CrossRef]
  47. Fransson, J.E.S.; Walter, F.; Ulander, L.M.H. Estimation of forest parameters using CARABAS-II VHF SAR data. IEEE Trans. Geosci. Remote Sens. 2000, 38, 720–727. [Google Scholar] [CrossRef]
  48. Melon, P.; Martinez, J.M.; Toan, T.L.; Ulander, L.M.H.; Beaudoin, A. On the retrieving of forest stem volume from VHF SAR data: Observation and modeling. IEEE Trans. Geosci. Remote Sens. 2001, 39, 2364–2372. [Google Scholar] [CrossRef]
  49. Karjalainen, M.; Kankare, V.; Vastaranta, M.; Holopainen, M.; Hyyppä, J. Prediction of plot-level forest variables using TerraSAR-X stereo SAR data. Remote Sens. Environ. 2012, 117, 338–347. [Google Scholar] [CrossRef]
  50. Varekamp, C.; Hoekman, D.H. High-resolution InSAR image simulation for forest canopies. IEEE Trans. Geosci. Remote Sens. 2002, 40, 1648–1655. [Google Scholar] [CrossRef]
  51. Gama, F.F.; Santos, J.R.; Mura, J.C. Eucalyptus biomass and volume estimation using interferometric and polarimetric SAR data. Remote Sens. 2010, 2, 939–956. [Google Scholar] [CrossRef]
  52. Kononov, A.A.; Ka, M. Model-associated forest parameter retrieval using VHF SAR data at the individual tree level. IEEE Trans. Geosci. Remote Sens. 2008, 46, 69–84. [Google Scholar] [CrossRef]
  53. Katoh, M.; Gougeon, F.A. Improving the precision of tree counting by combining tree detection with crown delineation and classification on homogeneity guided smoothed high resolution (50 cm) multispectral airborne digital data. Remote Sens. 2012, 4, 1411–1424. [Google Scholar] [CrossRef]
  54. Suarez, J.C.; Ontiveros, C.; Smith, S.; Snape, S. Use of airborne LiDAR and aerial photography in the estimation of individual tree heights in forestry. Comput. Geosci. 2005, 31, 253–262. [Google Scholar] [CrossRef]
  55. Hyyppä, J.; Mielonen, T.; Hyyppä, H.; Maltamo, M.; Yu, X.; Honkavaara, E.; Kaartinen, H. Using individual tree crown approach for forest volume extraction with aerial images and laser point clouds. In Proceedings of the International Archives of the Photogrammetry, Remote Sensing and Spatial Information Sciences 36 (3/W19), Enschede, The Netherlands, 12–14 September 2005; pp. 144–149.
  56. Chen, G.; Hay, G.J.; St-Onge, B. A GEOBIA framework to estimate forest parameters from LiDAR transects, Quickbird imagery and machine learning: A case study in Quebec, Canada. Int. J. Appl. Earth Observ. Geoinf. 2012, 3, 28–37. [Google Scholar] [CrossRef]
  57. Leckie, D.; Gougeon, F.; Hill, D.; Quinn, R.; Armstrong, L.; Shreenan, R. Combined high-density LiDAR and multispectral imagery for individual tree crown analysis. Can. J. Remote Sens. 2003, 29, 1–17. [Google Scholar] [CrossRef]
  58. Solberg, S.; Astrup, R.; Gobakken, T.; Næsset, E.; Weydahl, D.J. Estimating spruce and pine biomass with interferometric X-band SAR. Remote Sens. Environ. 2010, 114, 2353–2360. [Google Scholar] [CrossRef]
  59. Breidenbach, J.; Koch, B.; Kandler, G.; Kleusberg, A. Quantifying the influence of slope, aspect, crown shape and stem density on the estimation of tree height at plot level using LiDAR and InSAR data. Int. J. Remote Sens. 2008, 29, 1511–1536. [Google Scholar] [CrossRef]
  60. Hyde, P.; Dubayah, R.; Walker, W.; Blair, J.B.; Hofton, M.; Hunsaker, C. Mapping forest structure for wildlife habitat analysis using multi-sensor (LiDAR, SAR/InSAR, ETM+, Quickbird) synergy. Remote Sens. Environ. 2006, 102, 63–73. [Google Scholar] [CrossRef]
  61. Wang, L.; Gong, P.; Biging, G.S. Individual tree-crown delineation and treetop detection in high-spatial-resolution aerial imagery. Photogramm. Eng. Remote Sens. 2004, 70, 351–357. [Google Scholar] [CrossRef]
  62. Chen, Q.; Baldocchi, D.; Gong, P.; Kelly, M. Isolating individual trees in a Savanna woodland using small footprint LiDAR data. Photogramm. Eng. Remote Sens. 2006, 72, 923–932. [Google Scholar] [CrossRef]
  63. Wulder, M.; Niemann, K.O.; Goodenough, D.G. Local maximum filtering for the extraction of tree locations and basal area from high spatial resolution imagery. Remote Sens. Environ. 2000, 73, 103–114. [Google Scholar] [CrossRef]
  64. Hung, C.; Bryson, M.; Sukkarieh, S. Multi-class predictive template for tree crown detection. ISPRS J. Photogramm. 2012, 68, 170–183. [Google Scholar] [CrossRef]
  65. Ardila, J.P.; Tolpekin, V.A.; Bijker, W.; Stein, A. Markov-random-field-based super-resolution mapping for identification of urban trees in VHR images. ISPRS J. Photogramm. 2011, 66, 762–775. [Google Scholar] [CrossRef]
  66. Véga, C.; Durrieu, S. Multi-level filtering segmentation to measure individual tree parameters based on LiDAR data: Application to a mountainous forest with heterogeneous stands. Int. J. Appl. Earth Observ. Geoinf. 2011, 13, 646–656. [Google Scholar] [CrossRef] [Green Version]
  67. Koch, B.; Kattenborn, T.; Straub, C.; Vauhkonen, J. Forestry Applications of Airborne Laser Scanning; Maltamo, M., Næsset, E., Vauhkonen, J., Eds.; Springer: Dordrecht, The Netherland, 2014; Chapter 5; p. 89. [Google Scholar]
  68. Lee, A.C.; Lucas, R.M. A LiDAR-derived canopy density model for tree stem and crown mapping in Australian forests. Remote Sens. Environ. 2007, 111, 493–518. [Google Scholar] [CrossRef]
  69. Gleason, C.; Im, J. A fusion approach for tree crown delineation from LiDAR data. Photogramm. Eng. Remote Sens. 2012, 78, 679–692. [Google Scholar] [CrossRef]
  70. Liu, T.; Im, J.; Quackenbush, L. A novel transferable individual tree crown delineation model based on Fishing Net Dragging and boundary classification. ISPRS J. Photogramm. 2015, 110, 34–47. [Google Scholar] [CrossRef]
  71. Heenkenda, M.K.; Joyce, K.E.; Maier, S.W. Comparing digital object based approaches for mangrove tree crown delineation using WorldView-2 satellite imagery. South-East. Eur. J. Earth Observ. Geomat. 2014, 3, 169–172. [Google Scholar]
  72. Mallinis, G.; Mitsopoulos, I.; Stournara, P.; Patias, P.; Dimitrakopoulos, A. Canopy fuel load mapping of mediterranean pine sites based on individual tree-crown delineation. Remote Sens. 2013, 5, 6461–6480. [Google Scholar] [CrossRef]
  73. Morsdorf, F.; Meiera, E.; Kӧtza, B.; Ittena, K.I.; Dobbertinc, M.; Allgӧwer, B. LiDAR-based geometric reconstruction of boreal type forest stands at single tree level for forest and wildland fire management. Remote Sens. Environ. 2004, 92, 353–362. [Google Scholar] [CrossRef]
  74. Li, W.; Guo, Q.; Jakubowski, M.K.; Kelly, M. A new method for segmenting individual trees from the LiDAR point cloud. Photogramm. Eng. Remote Sens. 2012, 78, 75–84. [Google Scholar] [CrossRef]
  75. Kandare, K.; Dalponte, M.; Gianelle, D.; Chan, J.C. A new procedure for identifying single trees in understory layer using discrete LiDAR data. In Proceedings of the 2014 IEEE International Geoscience and Remote Sensing Symposium (IGARSS), Quebue, QC, Canada, 13–18 July 2014; pp. 1357–1360.
  76. Popescu, S.C.; Zhao, K. A voxel-based LiDAR method for estimating crown base height for deciduous and pine trees. Remote Sens. Environ. 2008, 112, 767–781. [Google Scholar] [CrossRef]
  77. Wang, Y.; Weinacker, H.; Koch, B. A LiDAR point cloud based procedure for vertical canopy structure analysis and 3D single tree modeling in forest. Sensors 2008, 8, 3938–3950. [Google Scholar] [CrossRef]
  78. Heinzel, J.; Weinacker, H.; Koch, B. Prior knowledge-based single-tree extraction. Int. J. Remote Sens. 2011, 32, 4999–5020. [Google Scholar] [CrossRef]
  79. Ene, L.; Næsset, E.; Gobakken, T. Single tree detection in heterogeneous boreal forests using airborne lasers canning and area-based stem number estimates. Int. J. Remote Sens. 2012, 33, 5171–5193. [Google Scholar] [CrossRef]
  80. Hauglin, M.; Gobakken, T.; Astrup, R.; Ene, L.; Næsset, E. Estimating single-tree crown biomass of Norway spruce by airborne laser scanning: A comparison of methods with and without the use of terrestrial laser scanning to obtain the ground reference data. Forests 2014, 5, 384–403. [Google Scholar] [CrossRef]
  81. Reitberger, J.; Schnörr, Cl.; Krzystek, P.; Stilla, U. 3D segmentation of single trees exploiting full waveform LiDAR data. ISPRS J. Photogramm. 2009, 64, 561–574. [Google Scholar] [CrossRef]
  82. Duncanson, L.I.; Cook, B.D.; Hurtt, G.C.; Dubayah, R.O. An efficient, multi-layered crown delineation algorithm for mapping individual tree structure across multiple ecosystem. Remote Sens. Environ. 2014, 154, 378–386. [Google Scholar] [CrossRef]
  83. Tochon, G.; Féret, J.B.; Valero, S.; Martin, R.E.; Knapp, D.E.; Salembier, P.; Chanussot, J.; Asner, G.P. On the use of binary partition trees for the tree crown segmentation of tropical rainforest hyperspectral images. Remote Sens. Environ. 2015, 159, 318–331. [Google Scholar] [CrossRef] [Green Version]
  84. Sheng, Y.; Gong, P.; Blglng, G.S. Model-based conifer-crown surface reconstruction from high-resolution aerial images. Photogramm. Eng. Remote Sens. 2001, 67, 957–965. [Google Scholar]
  85. Vauhkonen, J.; Seppänen, A.; Packalén, P.; Tokola, T. Improving species-specific plot volume estimates based on airborne laser scanning and image data using alpha shape metrics and balanced field data. Remote Sens. Environ. 2012, 124, 534–541. [Google Scholar] [CrossRef]
  86. Vauhkonen, J.; Tokola, T.; Maltamo, M.; Packalén, P. Effects of pulse density on predicting characteristics of individual trees of Scandinavian commercial species using alpha shape metrics based on airborne laser scanning data. Can. J. Remote Sens. 2008, 34, S441–S459. [Google Scholar] [CrossRef]
  87. Vauhkonen, J.; Tokola, T.; Packalén, P.; Maltamo, M. Identification of Scandinavian commercial species of individual trees from airborne laser scanning data using alpha shape metrics. For. Sci. 2009, 55, 37–47. [Google Scholar]
  88. Vauhkonen, J.; Korpela, I.; Maltamo, M.; Tokola, T. Imputation of single-tree attributes using airborne laser scanning-based height, intensity, and alpha shape metrics. Remote Sens. Environ. 2010, 114, 1263–1276. [Google Scholar] [CrossRef]
  89. Weinacker, H.; Koch, B.; Heyder, U.; Weinacker, R. Development of filtering, segmentation and modelling modules for LiDAR and multispectral data as a fundamental of an automatic forest inventory system. ISPRS J. Photogramm. 2004, 36, 50–55. [Google Scholar]
  90. Van Leeuwen, M.; Coops, N.C.; Wulder, M.A. Canopy surface reconstruction from a LiDAR point cloud using Hough transform. Remote Sens. Lett. 2010, 1, 125–132. [Google Scholar] [CrossRef]
  91. Kato, A.; Moskal, L.M.; Schiess, P.; Swanson, M.E.; Calhoun, D.; Stuetzle, W. Capturing tree crown formation through implicit surface reconstruction using airborne LiDAR data. Remote Sens. Environ. 2009, 113, 1148–1162. [Google Scholar] [CrossRef]
  92. Jang, J.D.; Payan, V.; Viau, A.A.; Devost, A. The use of airborne LiDAR for orchard tree inventory. Int. J. Remote Sens. 2008, 29, 1767–1780. [Google Scholar] [CrossRef]
  93. Mongus, D.; Zalik, B. An efficient approach to 3D single tree-crown delineation in LiDAR data. ISPRS J. Photogramm. 2015, 108, 219–233. [Google Scholar] [CrossRef]
  94. Vega, C.; Hamrouni, A.; Mokhtari, S.E.; Morel, J.; Bock, J.; Renaud, J.-P.; Bouvier, M.; Durrieu, S. PTrees: A point-based approach to forest tree extraction from LiDAR data. Int. J. Appl. Earth Observ. Geoinf. 2014, 33, 98–108. [Google Scholar] [CrossRef]
  95. Hoekman, D.H.; Varekamp, C. Observation of tropical rain forest trees by airborne high-resolution interferometric Radar. IEEE Trans. Geosci. Remote Sens. 2001, 39, 584–594. [Google Scholar] [CrossRef]
  96. Bunting, P.; Lucas, R. The delineation of tree crowns in Australian mixed species forests using hyperspectral Compact Airborne Spectrographic Imager (CASI) data. Remote Sens. Environ. 2006, 101, 230–248. [Google Scholar] [CrossRef]
  97. Jing, L.; Hu, B.; Noland, T.; Li, J. An individual tree crown delineation method based on multi-scale segmentation of imagery. ISPRS J. Photogramm. 2012, 70, 88–98. [Google Scholar] [CrossRef]
  98. Gougeon, F.A.; Leckie, D.G. The individual tree crown approach applied to Ikonos images of a coniferous plantation area. Photogramm. Eng. Remote Sens. 2006, 72, 1287–1297. [Google Scholar] [CrossRef]
  99. Pouliot, D.A.; King, D.J.; Pitt, D.G. Development and evaluation of an automated tree detection-delineation algorithm for monitoring regenerating coniferous forests. Can. J. For. Res. 2005, 35, 2332–2345. [Google Scholar] [CrossRef]
  100. Hirata, Y.; Furuya, N.; Suzuki, M.; Yamamoto, H. Airborne laser scanning in forest management: Individual tree identification and laser pulse penetration in a stand with different levels of thinning. For. Ecol. Manag. 2009, 258, 752–760. [Google Scholar] [CrossRef]
  101. Jaakkola, A.; Hyyppä, J.; Kukko, A.; Yu, X.; Kaartinen, H.; Lehtomäki, M.; Lin, Y. A low-cost multi-sensoral mobile mapping system and its feasibility for tree measurements. ISPRS J. Photogramm. 2010, 65, 514–522. [Google Scholar] [CrossRef]
  102. Lin, Y.; Jiang, M.; Yao, Y.; Zhang, L.; Lin, J. Use of UAV oblique imaging for the detection of individual trees in residential environments. Urban For. Urban Gree. 2015, 14, 404–412. [Google Scholar] [CrossRef]
  103. Stehman, S.V.; Foody, G.M. The SAGE Handbook of Remote Sensing; Warner, T.A., Nellis, M.D., Foody, G.M., Eds.; Sage: Thousand Oaks, CA, USA, 2009; Volume Chapter 21, p. 297. [Google Scholar]
  104. Mora, B.; Wulder, M.; White, J. Segment-constrained regression tree estimation of forest stand height from very high spatial resolution panchromatic imagery over a boreal environment. Remote Sens. Environ. 2010, 114, 2474–2484. [Google Scholar] [CrossRef]
  105. Pouliot, D.A.; King, D.J.; Bell, F.W.; Pitt, D.G. Automated tree crown detection and delineation in high-resolution digital camera imagery of coniferous forest regeneration. Remote Sens. Environ. 2002, 82, 322–334. [Google Scholar] [CrossRef]
  106. Korpela, I.; Anttila, P.; Pitkänen, J. The performance of a local maxima method for detecting individual tree tops in aerial photographs. Int. J. Remote Sens. 2006, 27, 1159–1175. [Google Scholar] [CrossRef]
  107. Erikson, M. Segmentation of individual tree crowns in colour aerial photographs using region growing supported by fuzzy rules. Can. J. For. Res. 2003, 33, 1557–1563. [Google Scholar] [CrossRef]
  108. Vauhkonen, J. Estimating crown base height for Scots pine by means of the 3D geometry of airborne laser scanning data. Int. J. Remote Sens. 2010, 31, 1213–1226. [Google Scholar] [CrossRef]
  109. Wang, L.; Birt, A.G.; Lafon, C.W.; Cairns, D.M.; Coulson, R.N.; Tchakerian, M.D.; Xi, W.; Popescu, S.C.; Guldin, J.M. Computer-based synthetic data to assess the tree delineation algorithm from airborne LiDAR survey. Geoinformatica 2013, 17, 35–61. [Google Scholar] [CrossRef]
  110. Lee, H.; Slatton, K.C.; Roth, B.E.; Cropper, J.R. Adaptive clustering of airborne LiDAR data to segment individual tree crowns in managed pine forests. Int. J. Remote Sens. 2010, 31, 117–139. [Google Scholar] [CrossRef]
  111. Persson, A.; Holmgren, J.; Soderman, U. Detecting and measuring individual trees using an airborne laser scanner. Photogramm. Eng. Remote Sens. 2002, 68, 925–932. [Google Scholar]
  112. Dalponte, M.; Reyes, F.; Kandare, K.; Gianelle, D. Delineation of individual tree crowns from ALS and hyperspectral data: A comparison among four methods. Eur. J. Remote Sens. 2015, 48, 365–382. [Google Scholar] [CrossRef]
  113. Eysn, L.; Hollaus, M.; Lindberg, E.; Berger, F.; Monnet, J.; Dalponte, M.; Kobal, M.; Pellegrini, M.; Lingua, E.; Mongus, D.; et al. A benchmark of LiDAR-based single tree detection methods using heterogeneous forest data from the Alpine space. Forests 2015, 6, 1721–1747. [Google Scholar] [CrossRef] [Green Version]
  114. Zhang, C.; Qiu, F. Mapping individual tree species in an urban forest using airborne LiDAR data and hyperspectral imagery. Photogramm. Eng. Remote Sens. 2012, 78, 1079–1087. [Google Scholar] [CrossRef]
  115. Dalponte, M.; Ørka, H.O.; Ene, L.T.; Gobakken, T.; Næsset, E. Tree crown delineation and tree species classification in boreal forests using hyperspectral and ALS data. Remote Sens. Environ. 2014, 140, 306–317. [Google Scholar] [CrossRef]
  116. Coops, N.C.; Wulder, M.A.; Culvenor, D.S.; St-Onge, B. Comparison of forest attributes extracted from fine spatial resolution multispectral and LiDAR data. Can. J. Remote Sens. 2004, 30, 855–866. [Google Scholar] [CrossRef]
  117. Pouliot, D.; King, D. Approaches for optimal automated individual tree crown detection in regenerating coniferous forests. Can. J. For. Res. 2005, 31, 255–267. [Google Scholar] [CrossRef]
  118. Ke, Y.; Quackenbush, L.J. A comparison of three methods for automatic tree crown detection and delineation methods from high spatial resolution imagery. Int. J. Remote Sens. 2011, 32, 3625–3647. [Google Scholar] [CrossRef]
  119. Cohen, W.B.; Spies, T.A.; Bradshaw, G.A. Semivariograms of digital imagery for analysis of conifer canopy structure. Remote Sens. Environ. 1990, 34, 167–178. [Google Scholar] [CrossRef]
  120. Song, C.; Woodcock, C.E. Estimating tree crown size from multiresolution remotely sensed imagery. Photogramm. Eng. Remote Sens. 2003, 69, 1263–1270. [Google Scholar] [CrossRef]
  121. Hyyppä, J.; Yu, X.; Hyyppä, H.; Vastaranta, M.; Holopainen, M.; Kukko, A.; Kaartinen, H.; Jaakkola, A.; Vaaja, M.; Koskinen, J.; et al. Advances in forest inventory using airborne laser scanning. Remote Sens. 2012, 4, 1190–1207. [Google Scholar] [CrossRef]
  122. Strîmbu, V.F.; Strîmbu, B.M. A graph-based segmentation algorithm for tree crown extraction using airborne LiDAR data. ISPRS J. Photogramm. 2015, 104, 30–43. [Google Scholar] [CrossRef]
  123. Ke, Y.; Zhang, W.; Quackenbush, L.J. Active contour and hill climbing for tree crown detection and delineation. Photogramm. Eng. Remote Sens. 2010, 76, 1169–1181. [Google Scholar] [CrossRef]
Figure 1. Summary of remotely sensed data used in individual tree crown detection and delineation (ITCD) and related literature from 1990–2015 (N = 210).
Remotesensing 08 00333 g001
Figure 2. Summary of remotely sensed data (1: passive; 2: active; 3: both passive and active data) used in ITCD and related literature by publication date (N = 210).
Remotesensing 08 00333 g002
Figure 3. Summary of ITCD methods using LiDAR data in ITCD and related literature (N = 136).
Remotesensing 08 00333 g003
Figure 4. Summary of type of methods using LiDAR data for ITCD (1: raster-based method; 2: point cloud-based method; 3: methods combining raster, point, and a priori information; 4: tree shape reconstruction method) reported in the literature by publication date (N = 136).
Remotesensing 08 00333 g004
Figure 5. Summary of forest types in ITCD and related research (N = 207).
Remotesensing 08 00333 g005
Figure 6. Summary of forest conditions of ITCD and related literature by publication date (Forest code-1: closed softwood forest; 2: closed hardwood forest; 3: closed mixed forest; 4: urban/suburban forest; 5: other open forest; 6: Multiple types) (N = 207).
Remotesensing 08 00333 g006
Figure 7. Summary of validation in ITCD and related research (N = 210).
Remotesensing 08 00333 g007
Figure 8. Summary of validation of ITCD and related literature by research focus (Validation code-1: Stand/plot level; 2: Individual tree level; 3: Both levels; 4: No validation; Focus code-a: Algorithm development; b: Application; c: Both algorithm development and application; d: Method comparison or review) (N = 210).
Remotesensing 08 00333 g008
Figure 9. Summary of focus of ITCD and related literature by publication date (Focus code-a: Algorithm development; b: Application; c: Both algorithm development and application; d: Method comparison or review) (N = 212).
Remotesensing 08 00333 g009
Table 1. Summary of literature sources from peer reviewed journal reviewed in this study.
CommunityNameCountTotal 1
Remote sensing and GIScienceCanadian Journal of Remote Sensing7131
GIScience and Remote Sensing3
IEEE Transactions on Geoscience and Remote Sensing6
International Journal of Applied Earth Observation and Geoinformation.7
International Journal of Remote Sensing20
ISPRS Journal of Photogrammetry and Remote Sensing15
Photogrammetric Engineering & Remote Sensing16
The Photogrammetric Journal of Finland3
Remote Sensing17
Remote Sensing of Environment31
Sensors3
Other related journals3
ForestryCanadian Journal of Forest Research932
Forests3
Forest Ecology and Management9
Scandinavian Journal of Forest Research2
Urban Forestry & Urban Greening3
Other related journals6
Computer science and othersComputers and Electronics in Agriculture218
Computer & Geosciences4
Mathematical and Computer Modeling2
Machine Vision and Applications3
Silvilaser2
Other related journals5
1 Total of reviewed literature is 212, including 181 from peer reviewed journal and 31 from non-peer reviewed conference/thesis/report. The “other related journals” category represents a summation of related ITCD studies in journals that have only one count.
Table 2. The characteristics of the four methods using LiDAR data for ITCD.
Method GroupExample of Specific Algorithms/MethodsAdvantagesDisadvantages
Raster-based methodTreetop detection: local maximum, image binarization, template matching
  • Well developed;
  • Easy to be used and improved;
  • Easy to use multiple data sources if using GEOBIA-based method;
  • Easy to use multiple scales if using GEOBIA-based method.
  • Missing information or causing potential errors from extraction, interpolation and smoothing procedures.
Crown delineation: valley-following, region-growing, watershed segmentation
GEOBIA-based method
Point cloud-based methodK-means clustering technique
  • Easy to use 3D information;
  • Easy to reflect canopy structure;
  • Could detect understory trees or small trees.
  • Harder to implement than raster-based method;
  • Greatly depend on point density of LiDAR data.
Voxel-based single tree segmentation
Methods combining raster, point, and a priori informationClassic ITCD algorithms + prior information (crown size/stand density)
  • Benefit to use historical data;
  • Easy to integrate remotely sensed data and GIS data;
  • Could use both spectral and height information.
  • Depend on prior information;
  • May have difficulties in registration of different data sources.
Imagery + point cloud
Tree shape reconstructionConvex hull
  • Further delineation of crown;
  • Provide 3D individual tree profiles;
  • Provide information for estimating foliage and photosynthetic activity;
  • Allow further application of modeling tree growth
  • Difficult to implement;
  • Sometimes depend on successful segmentation of single trees;
  • Difficult to collect field data for validation
Alpha shape
Superquadrics
Hough transform
Table 3. Summary of the characteristics of ITCD validation.
Validation LevelTarget AccuracyExamples of Accuracy MetricsCharacteristics
Stand/plot levelTreetop detection (point accuracy)Detection rate/percentage [94]Non-site specific measurement; Avoids the need to match tree locations;
Easy to implement;
Not a comprehensive evaluation for ITCD algorithms.
Crown delineation (polygon accuracy)Crown closure, mean and quartile crown size [104];
Relative error of crown area [25]
Individual tree levelTreetop detection (point accuracy)Precision recall curve that includes precision and recall [64];
Accuracy index, commission/omission error [105];
RMSE for a positioning error vector, N-accuracy base on commission point, unique hit or multiple hit [106];
Site specific measurements;
Difficult to acquire precise tree location and crown boundary in field as reference;
Difficult to link detected trees or delineated crowns to reference tree locations and crowns;
Difficult to implement;
Comprehensive evaluation for ITCD algorithms.
Crown delineation (boundary accuracy)20 categories of iso-ground reference delineation overlap [14];
RMSE of the crown diameters [105];
Absolute accuracy for tree isolation [62];
1:1, x:1,1:x [107];
Overall accuracy, producer’s accuracy, user’s accuracy, nine cases of overlap [25,70]

