
Detection of Drought-Induced Hickory Disturbances in Western Lin An County, China, Using Multitemporal Landsat Imagery

Abstract
:
1. Introduction
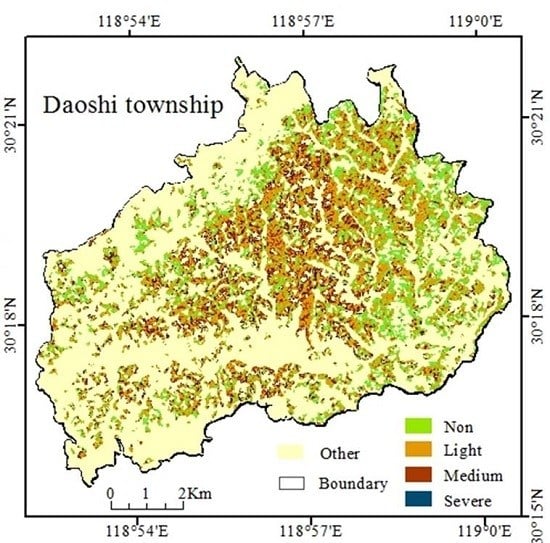
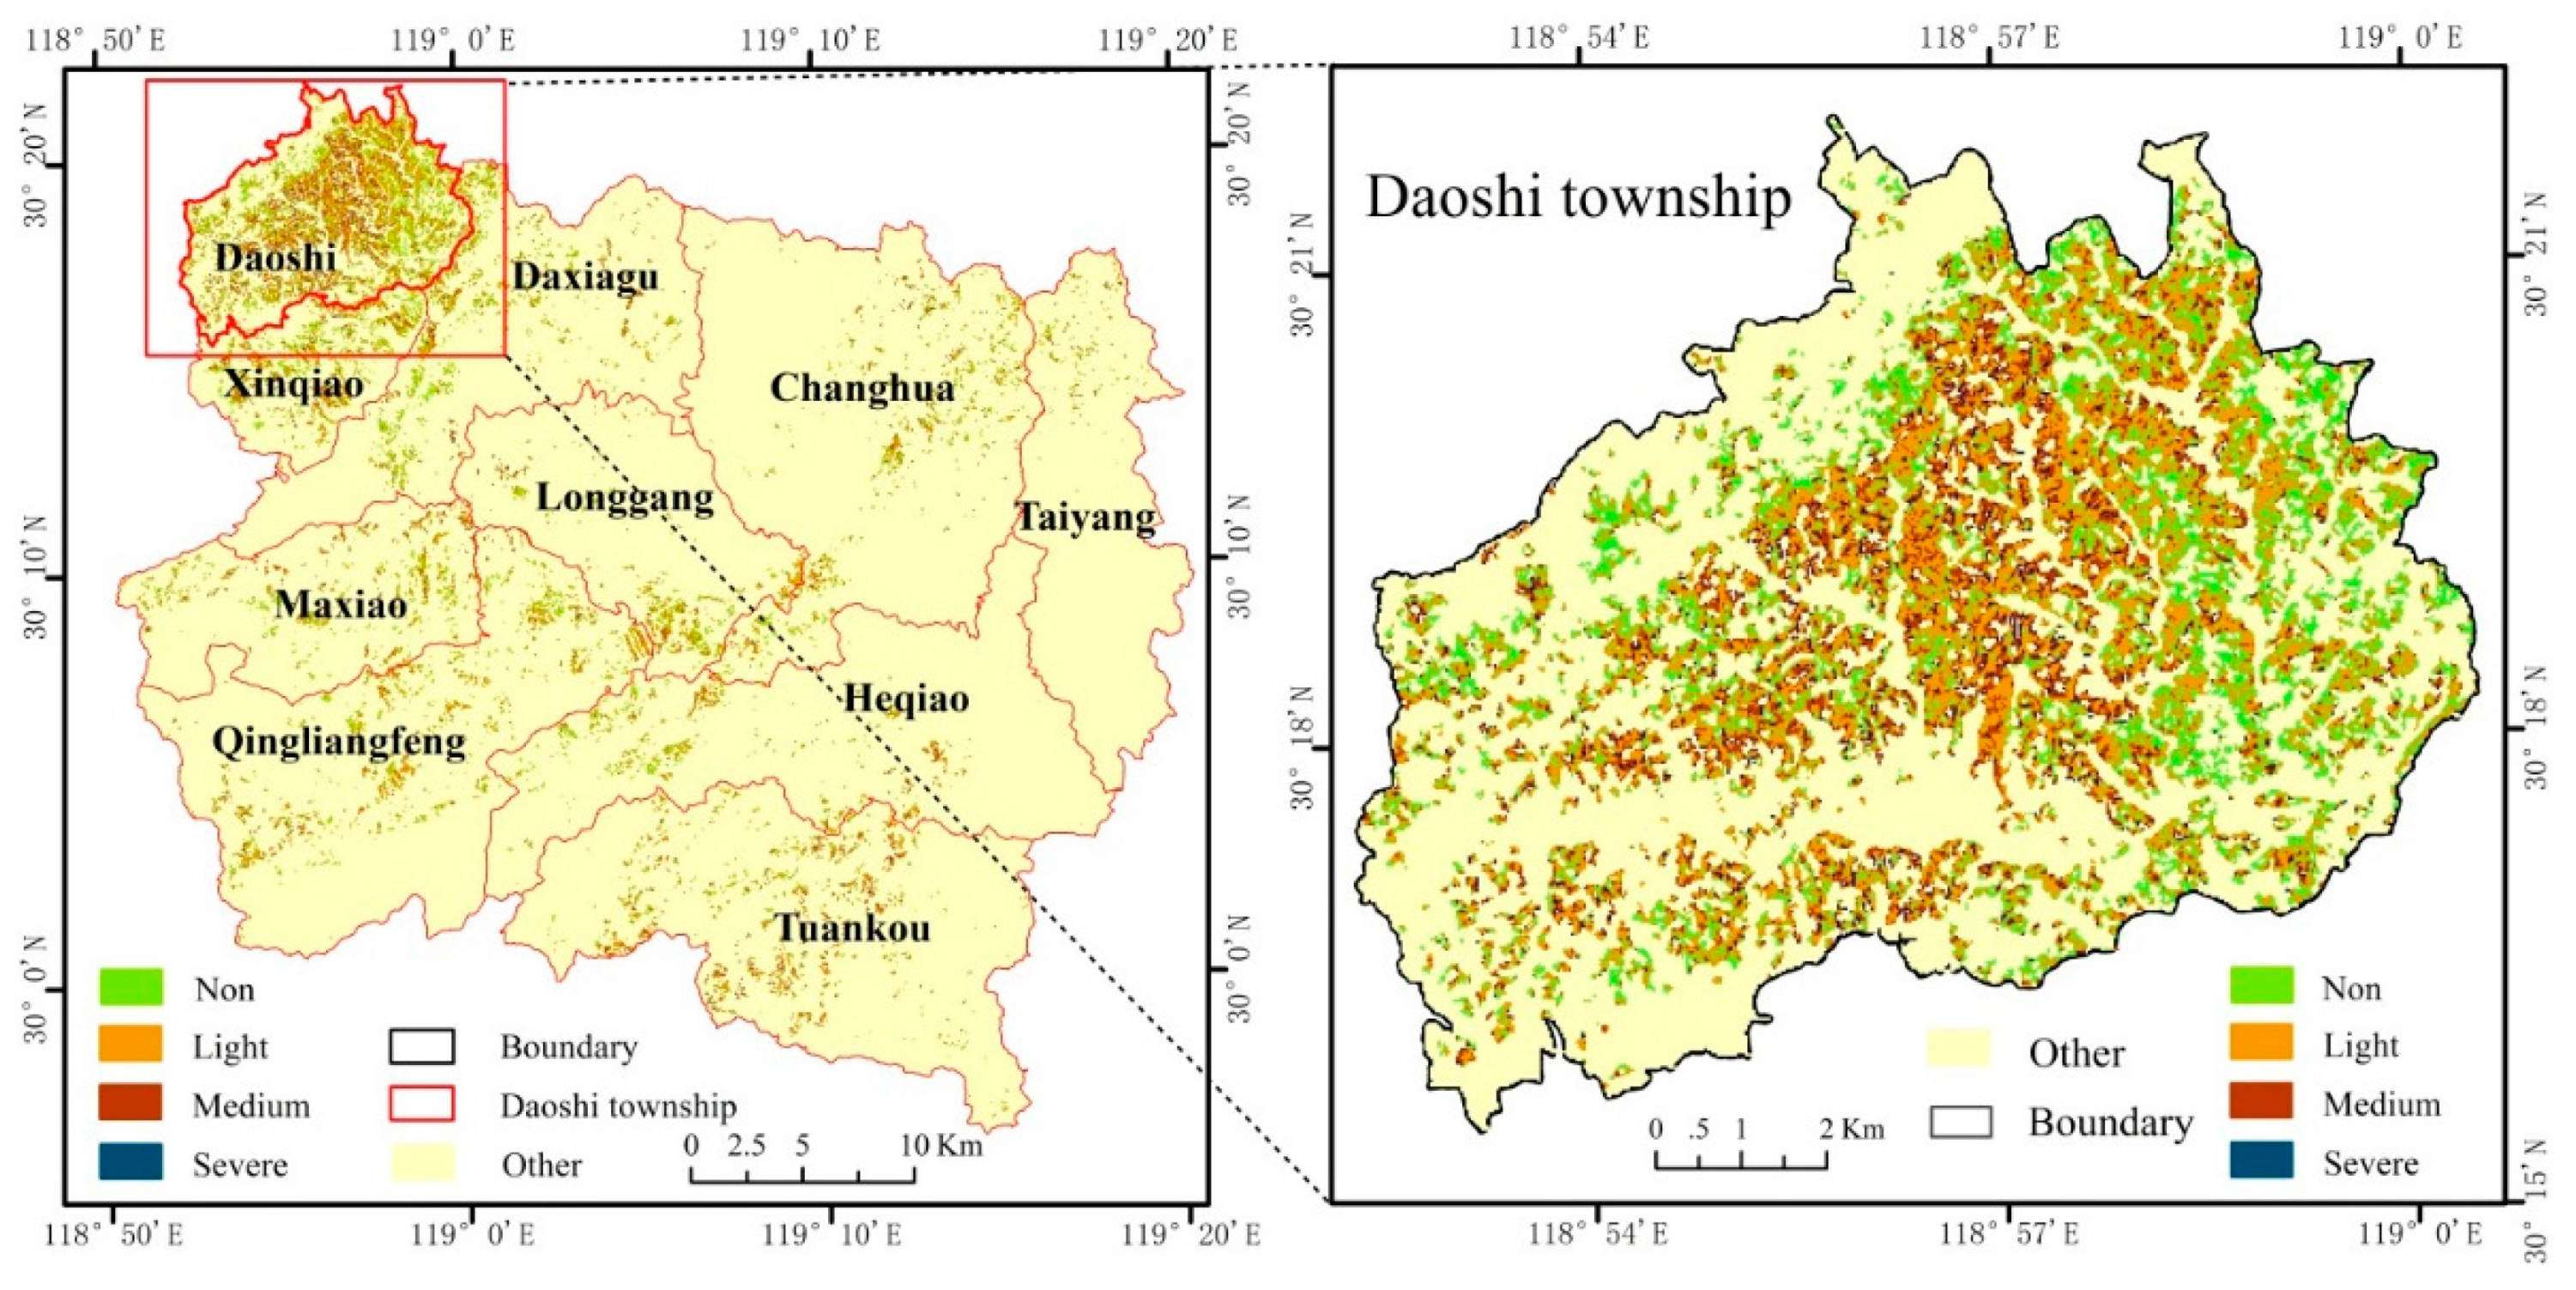
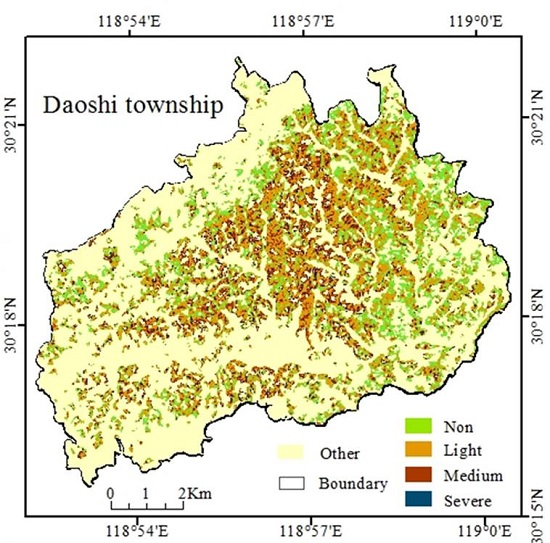
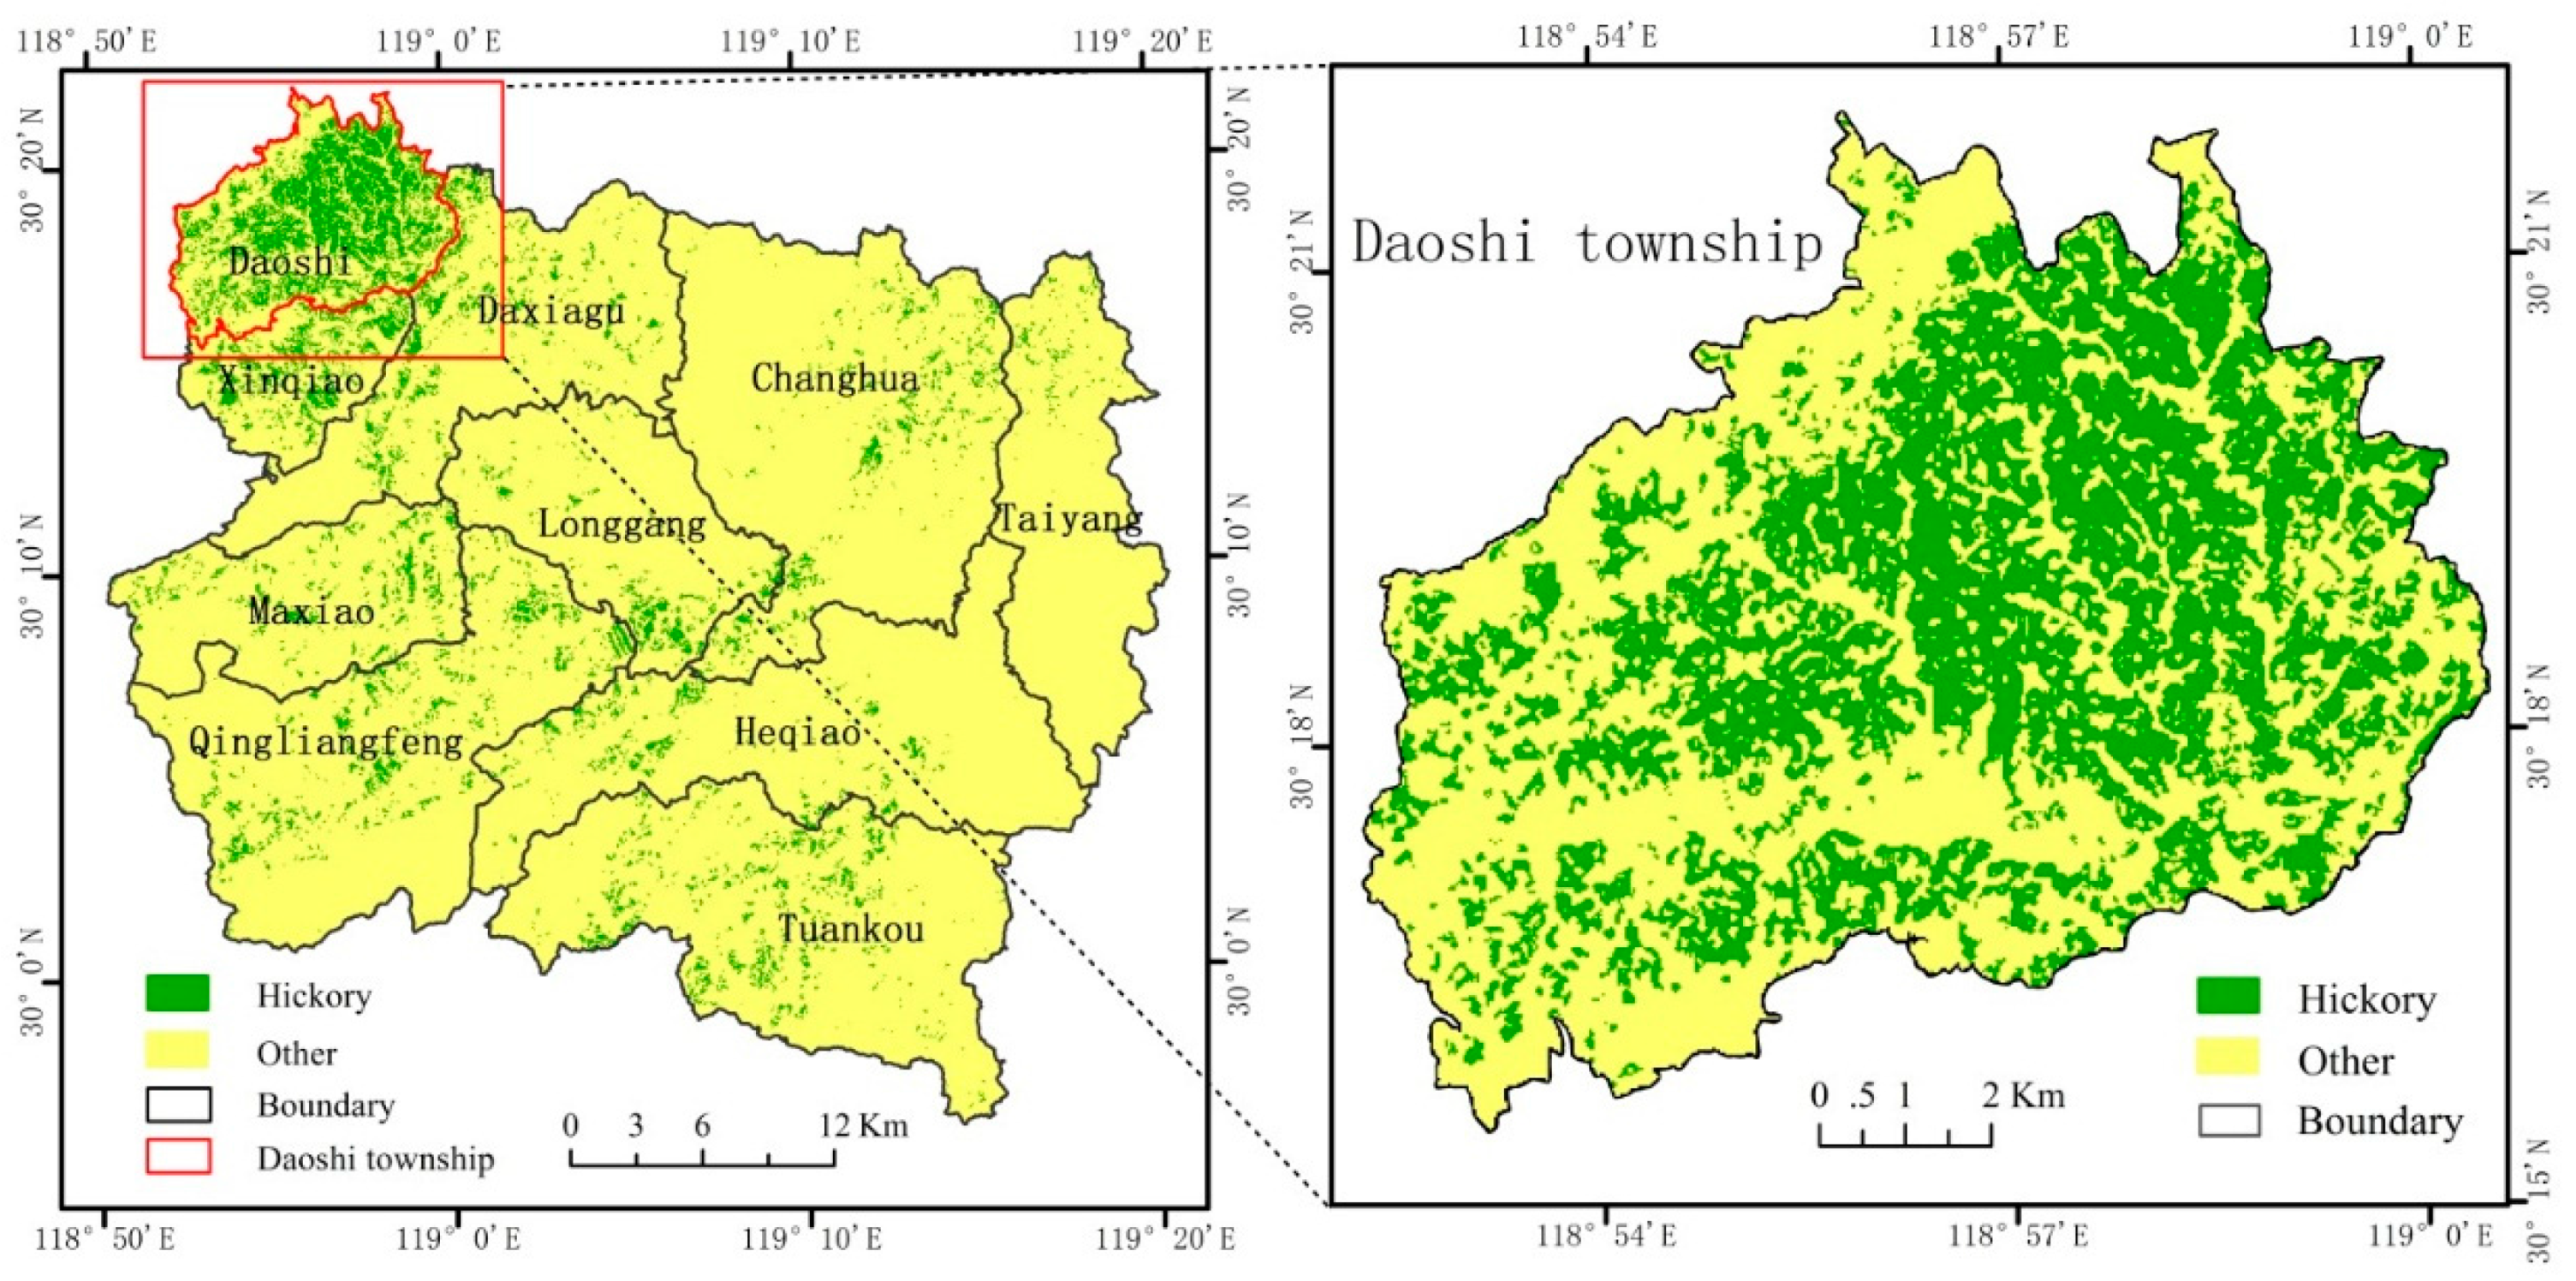
2. Study Area
3. Methods
3.1. Data Collection and Preprocessing
- (1)
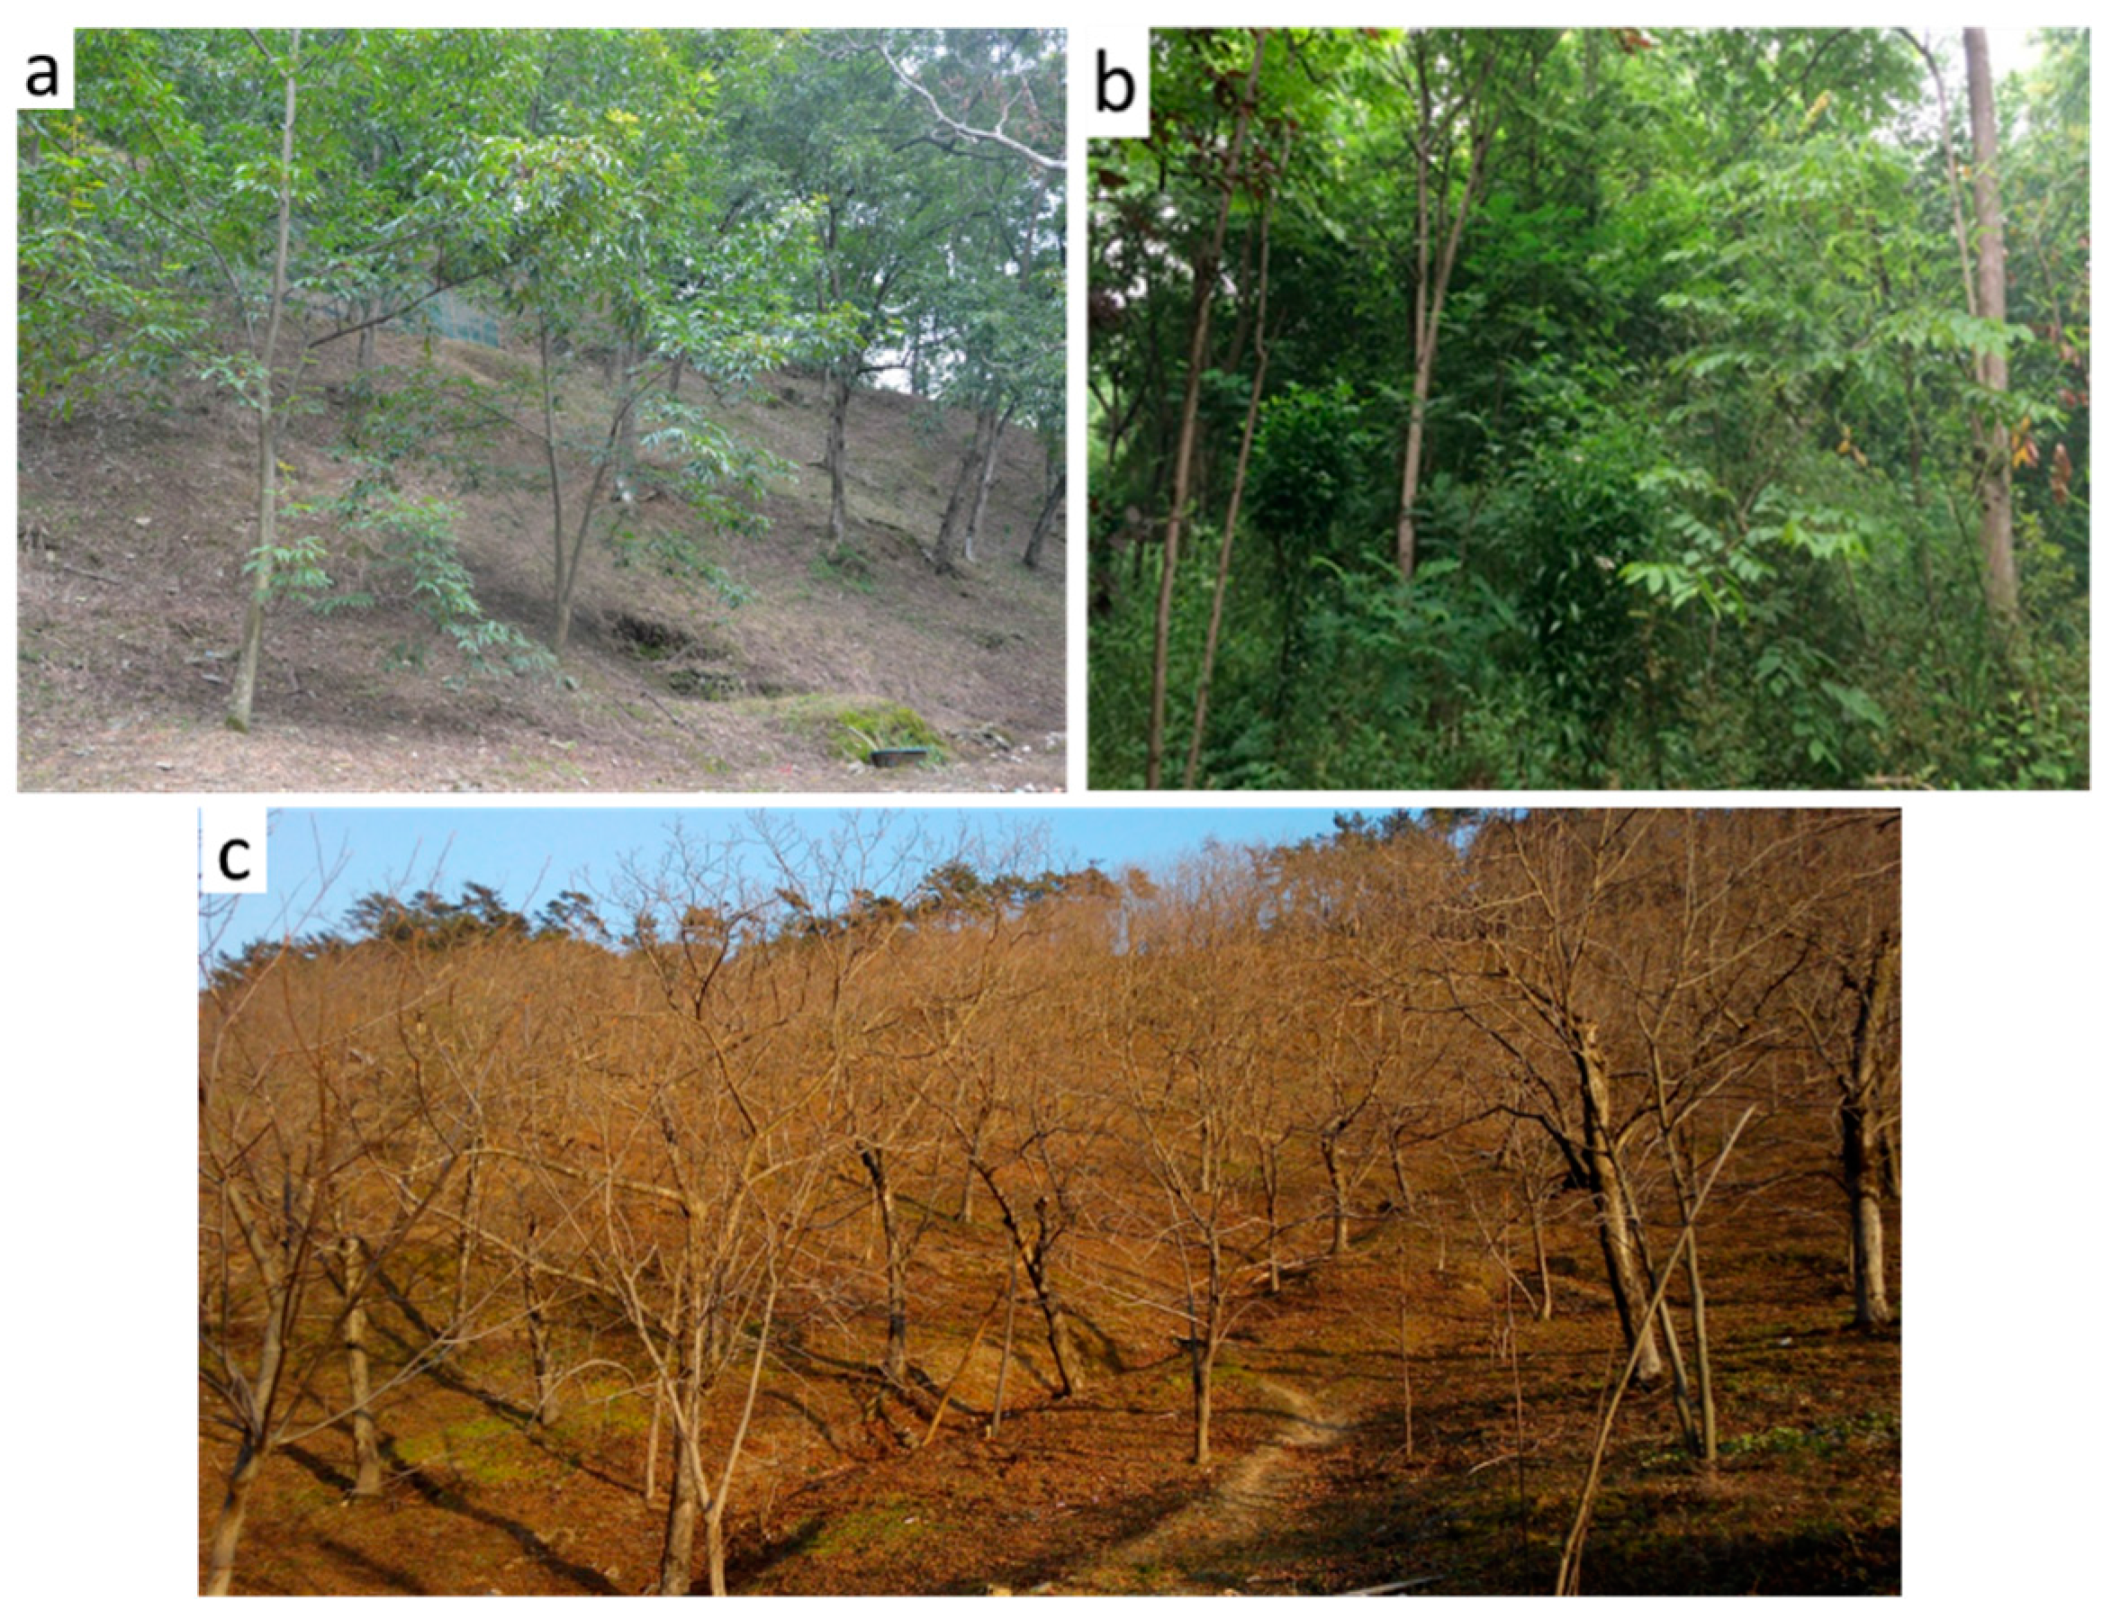
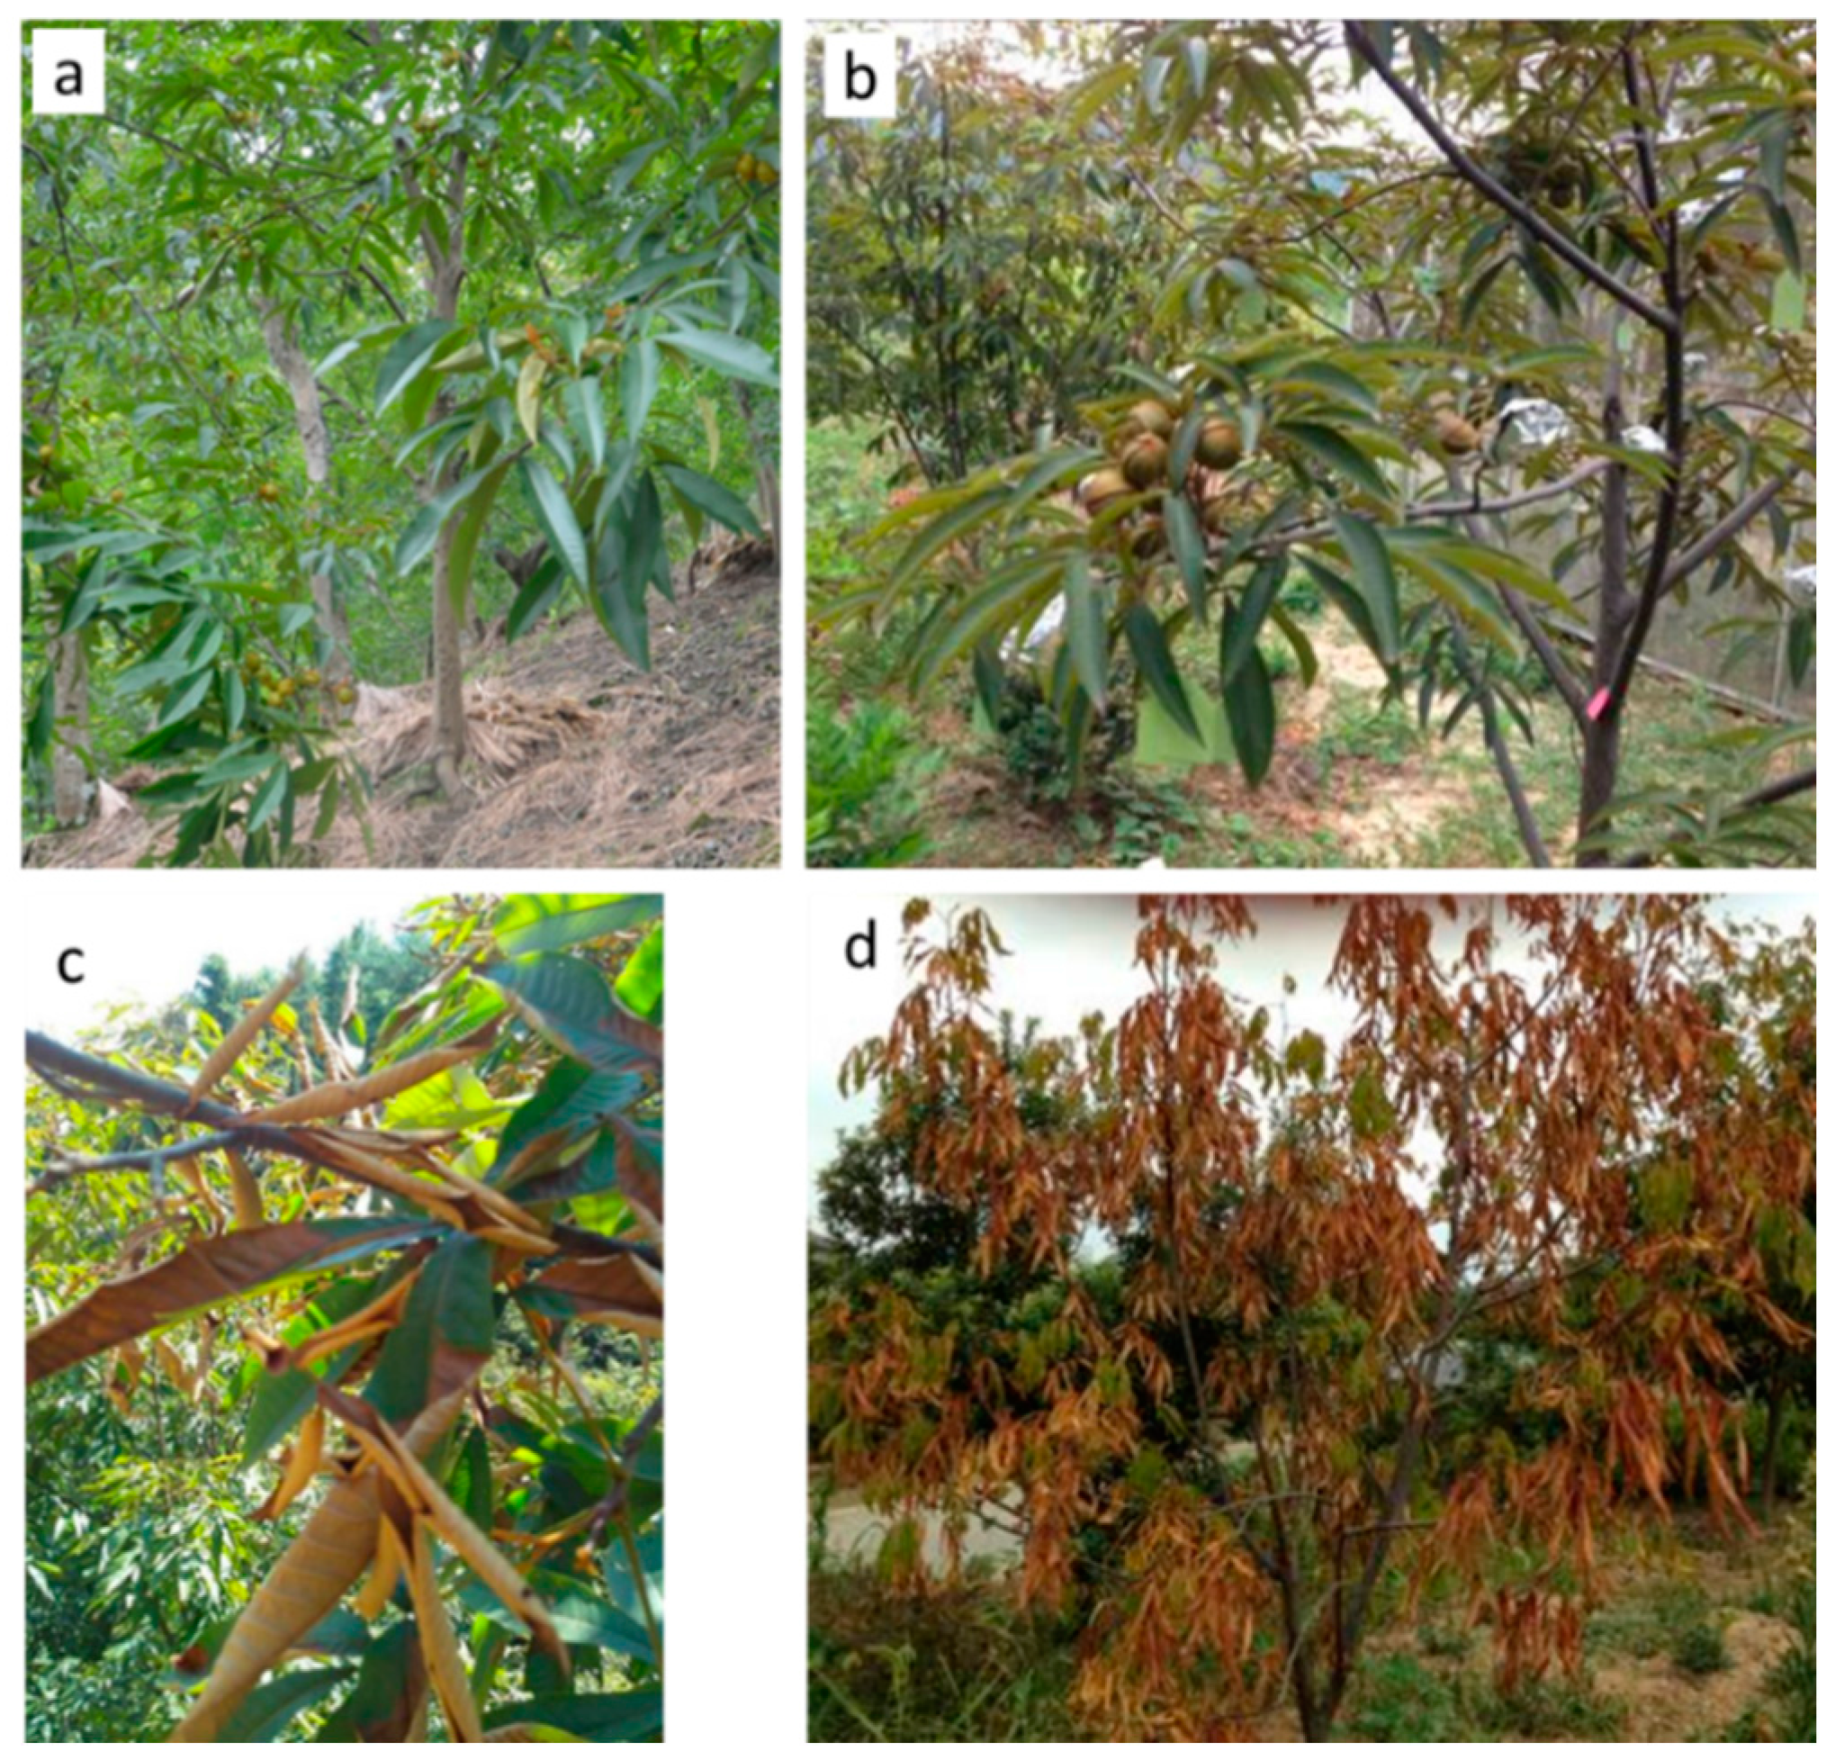
- Non-disturbance means that the hickory trees grew normally without influence from this drought event (Figure 5a). This situation is mainly located at lower elevations of mountainous regions or in valleys with good soil conditions and moisture.
- (2)
- Light disturbance means that some leaves became yellow due to moisture loss in the hickory leaves, but they would be restored in a short time if sufficient moisture were available (Figure 5b). We define the light level for those sites where at least half of the hickory trees in a hectare had yellow leaves in early September (just after the drought event).
- (3)
- Medium disturbance means that some leaves and branches in the upper part of a tree died but most of the leaves and branches in the lower part of a tree were still alive (see Figure 5c). We define the medium level for those sites where at least half of the hickory trees in a hectare had dead leaves in early September (just after the drought event).
- (4)
- Severe disturbance means that the leaves became red and died due to moisture loss caused by the drought event (see Figure 5d). This situation often occurred in the areas with very poor soil conditions. During the field survey, we did not find this category because only a few trees were dead in a hectare due to the drought event.
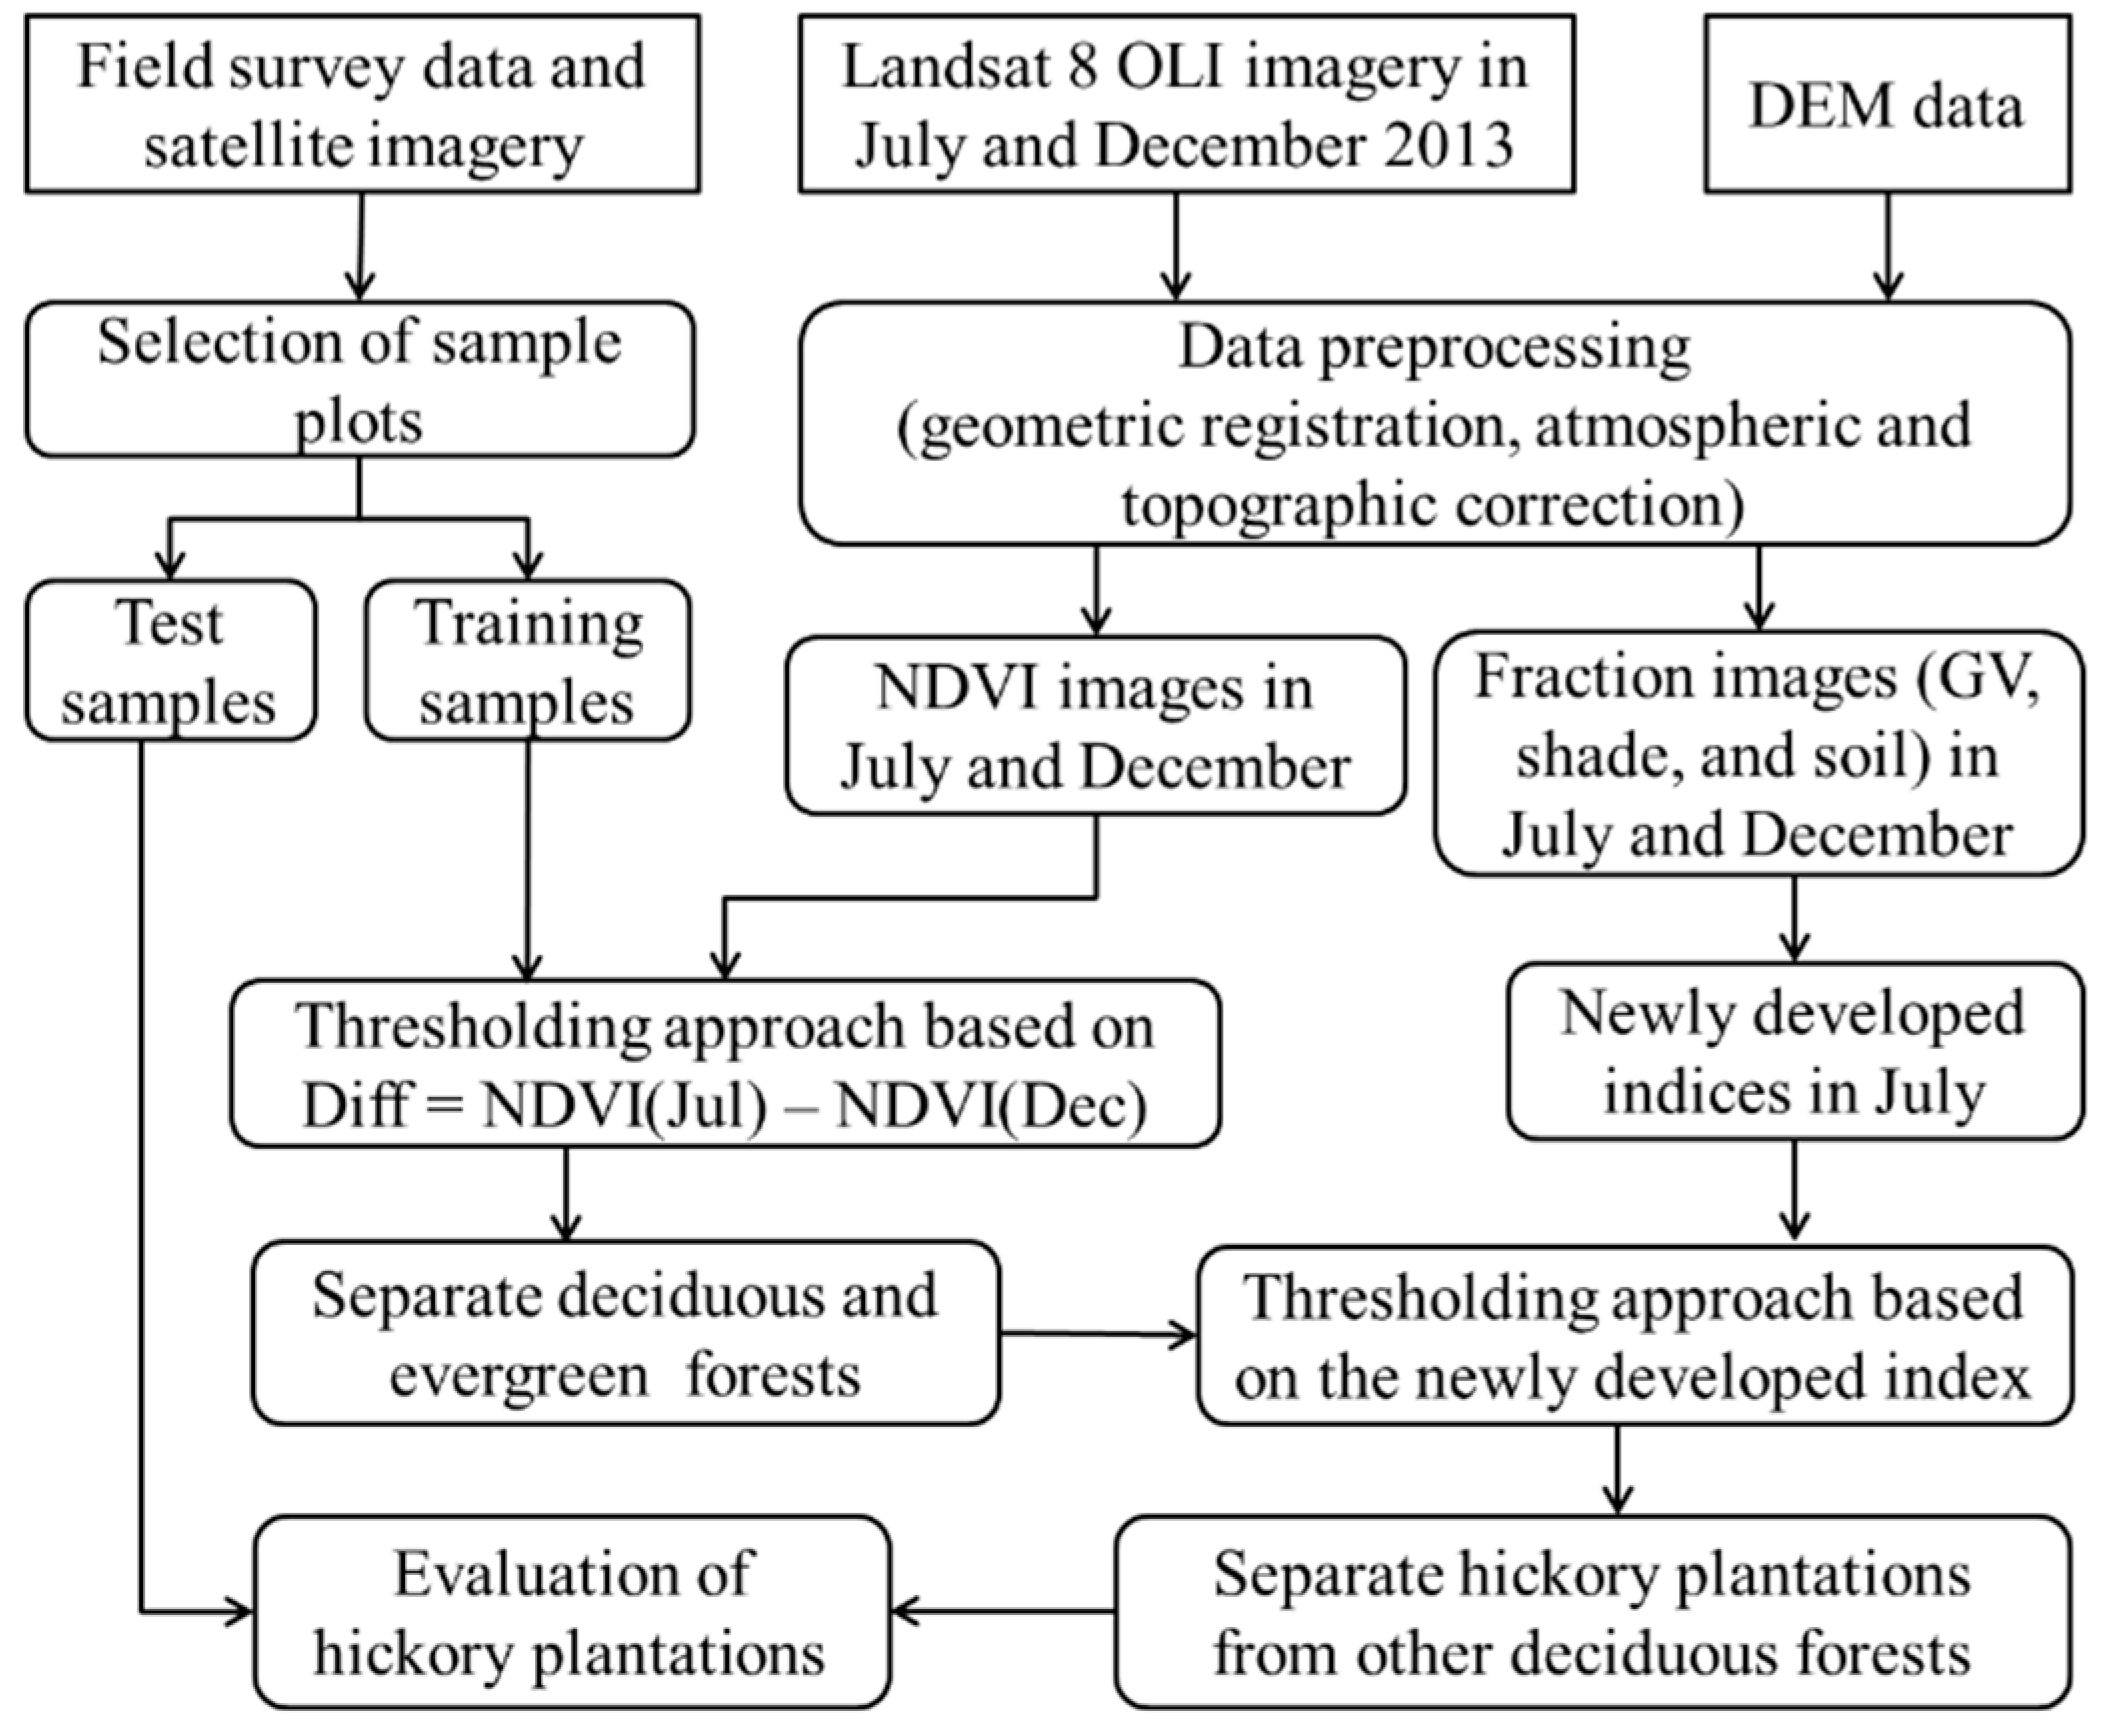
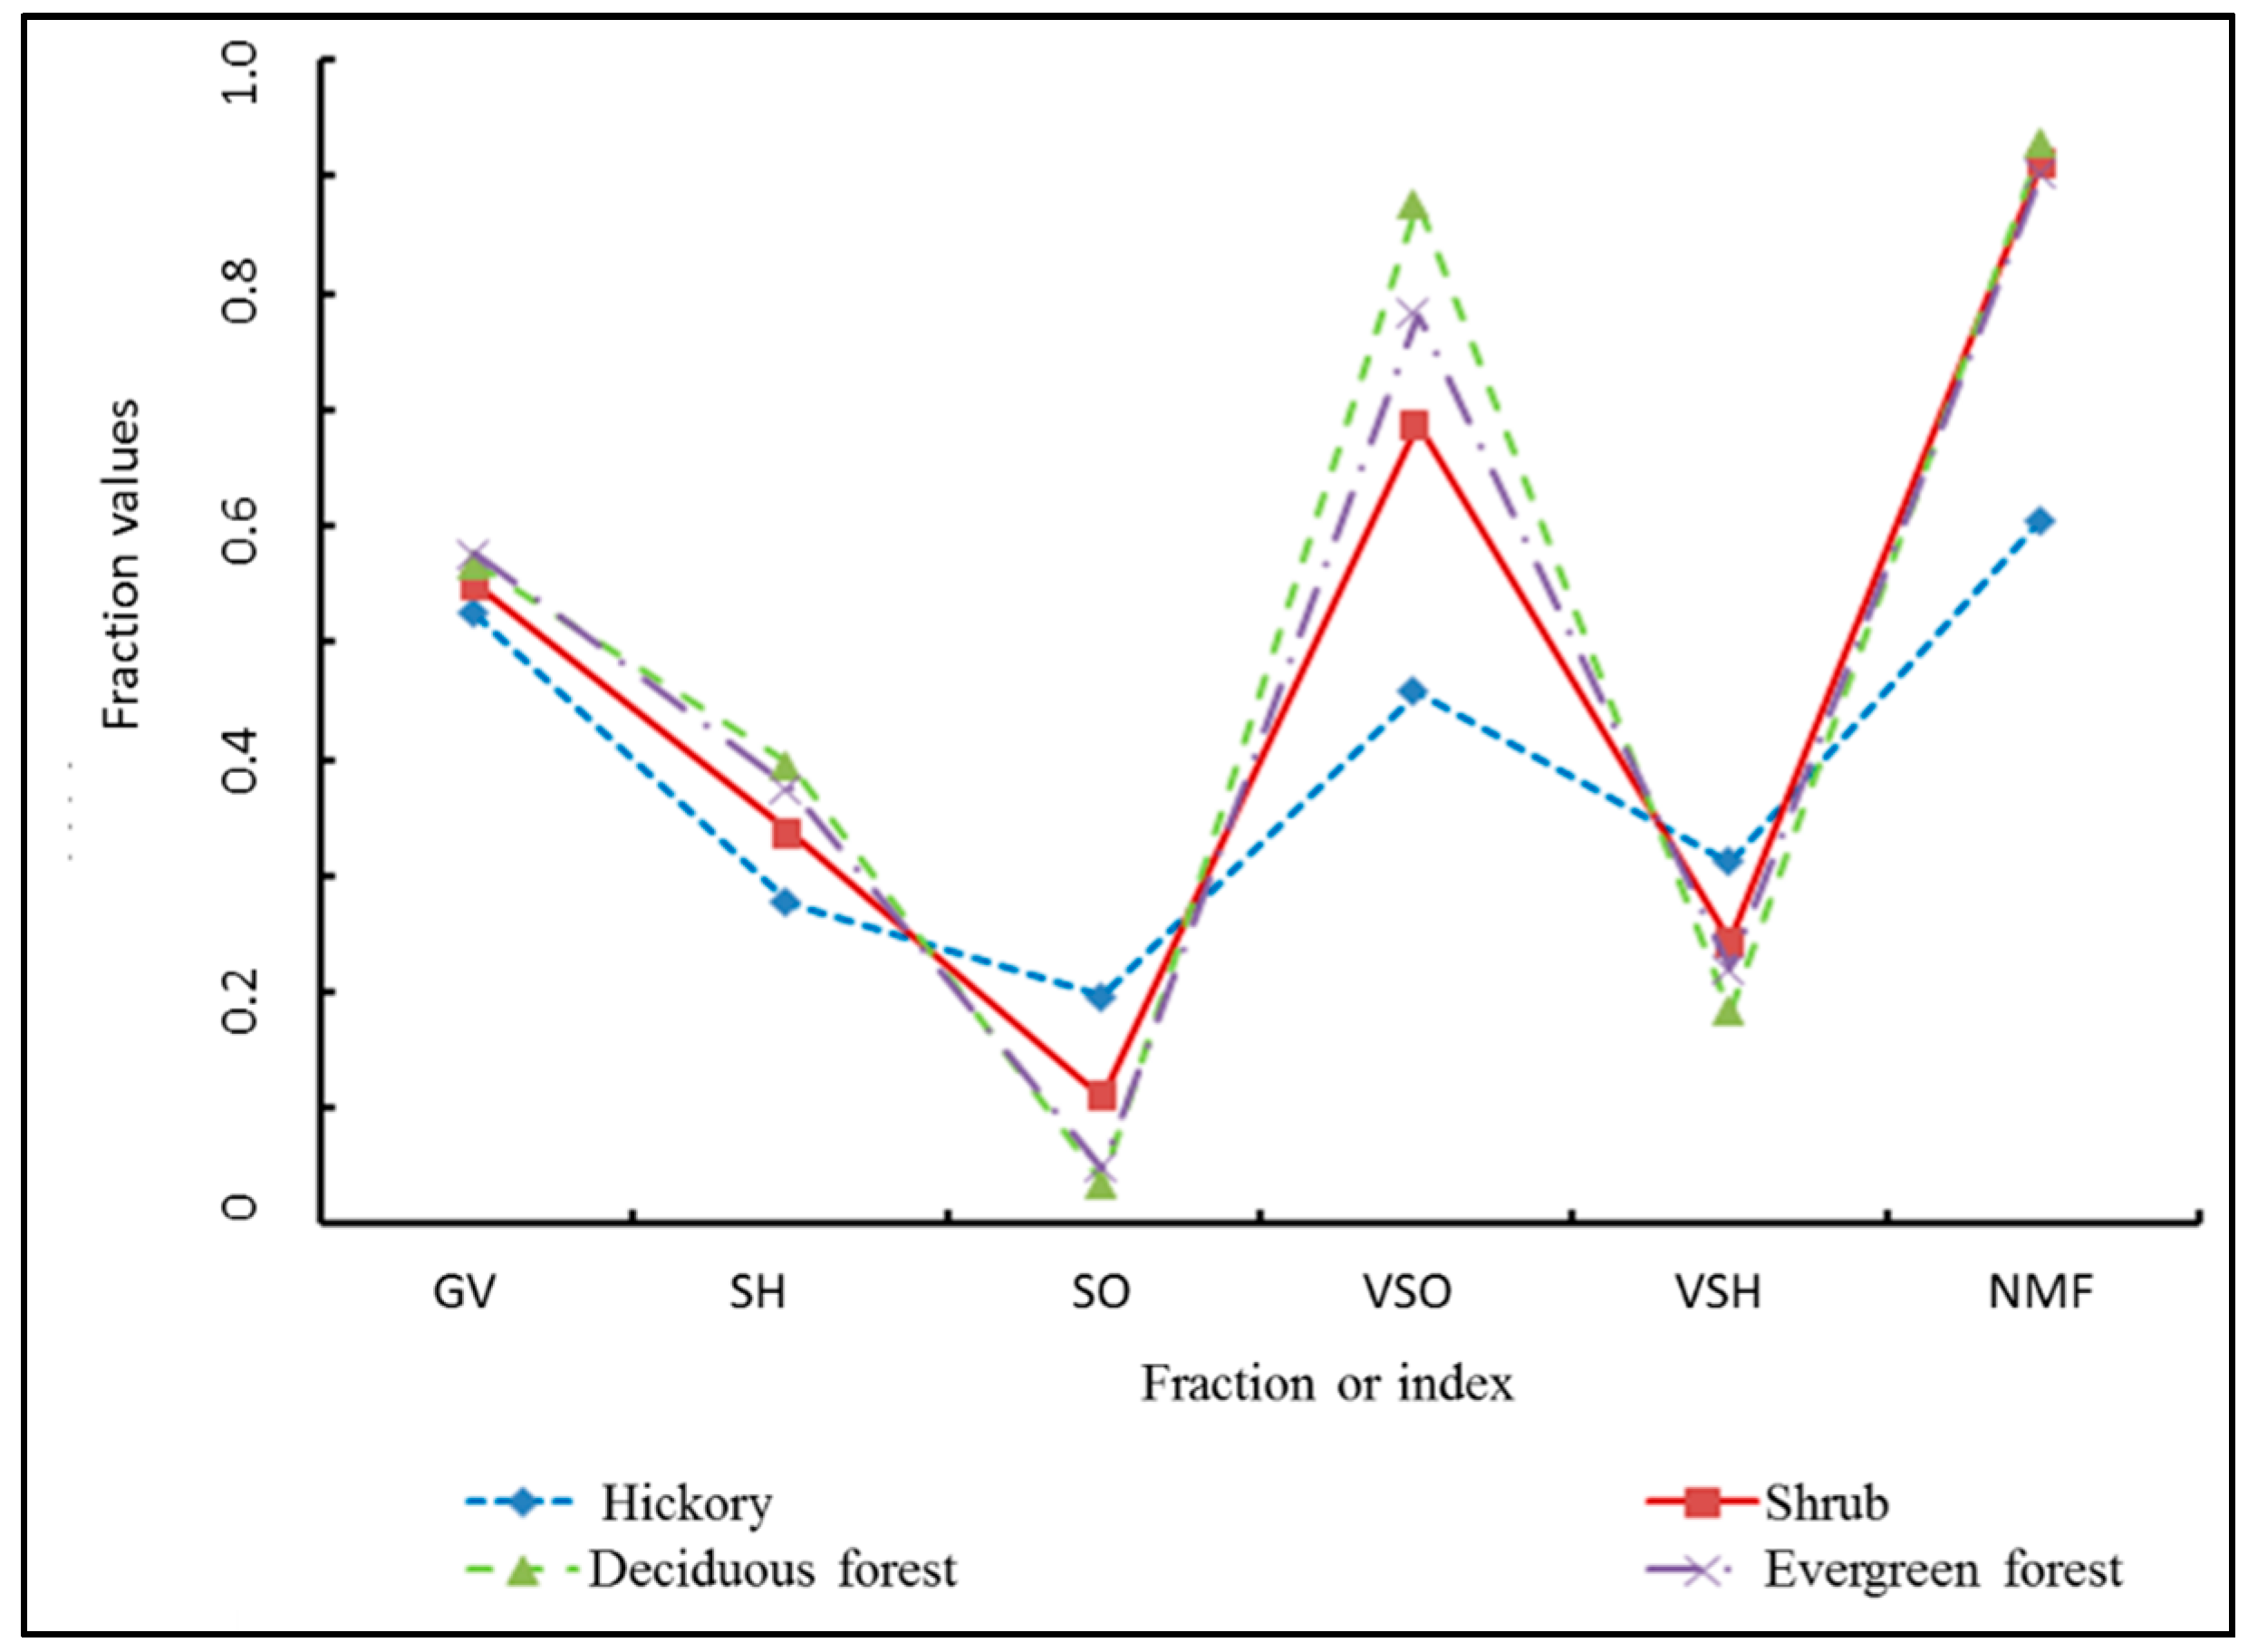
3.2. Mapping Hickory Plantation Distribution
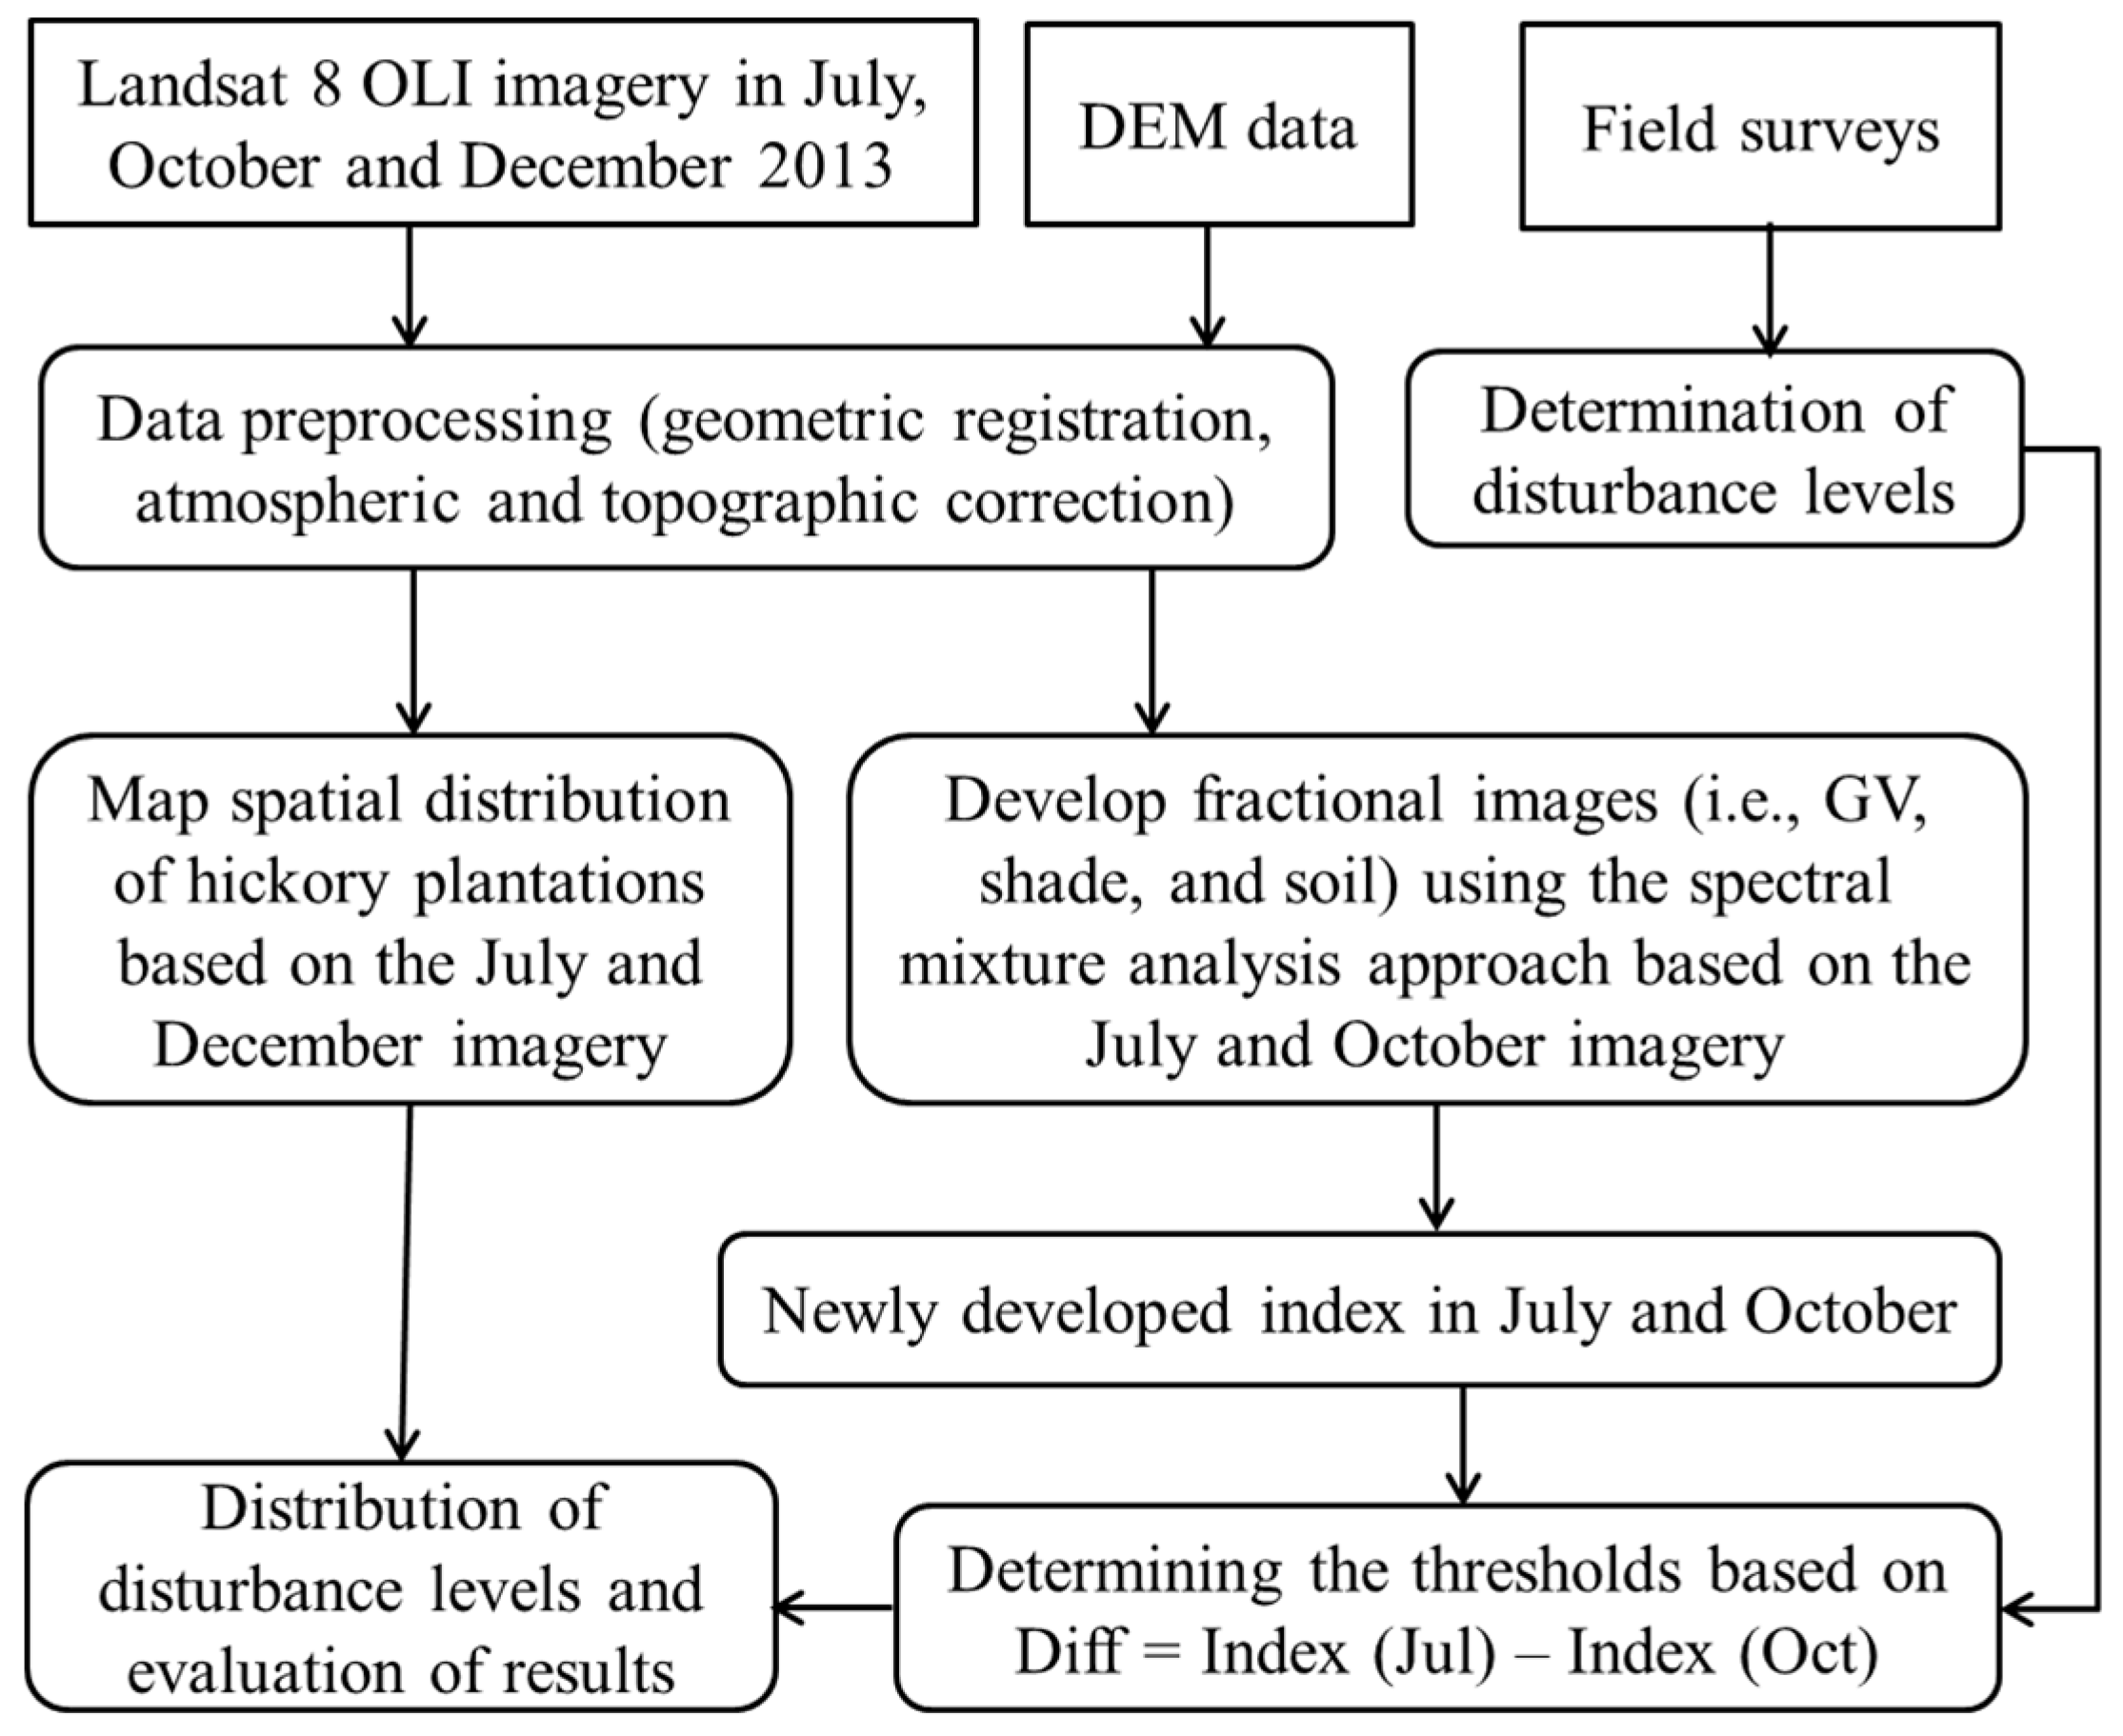
3.3. Detecting Drought-Induced Disturbances of Hickory Plantations
4. Results
5. Discussion
5.1. Selection of Suitable Image Acquisition Dates for Forest Disturbance Detection
5.2. Determination of Disturbance Levels and Evaluation of Disturbance Results
5.3. Development of Proper Algorithms for Specific Forest Disturbance
6. Conclusions
Acknowledgments
Author Contributions
Conflicts of Interest
References
- Huang, J.Q.; Lu, D.; Li, J.; Wu, J.S.; Chen, S.Q.; Zhao, W.M.; Ge, H.L.; Huang, X.Z.; Yan, X.J. Integration of remote sensing and GIS for evaluating soil erosion risk in Northwestern Zhejiang, China. Photogramm. Eng. Remote Sens. 2012, 78, 935–946. [Google Scholar] [CrossRef]
- Drought, Heatwaves Affect Tea Plantations in East China. Available online: http://www.globaltimes.cn/content/804594.shtml (accessed on 21 February 2106).
- Mullen, J. Heat Wave Kills People, Crops, Fish, and Hopes in China. Available online: http://www.desdemonadespair.net/2013/08/heat-wave-kills-people-crops-fish-and.html (accessed on 21 February 2016).
- Zhang, L.S.; Xue, J.J.; Wang, W.G.; Sun, J. Comparative analysis of extreme high temperature weather in the summers of 2013 and 2003. Atmos. Ocean. Sci. Lett. 2014, 7, 132–136. [Google Scholar]
- Yuan, W.P.; Cai, W.W.; Chen, Y.; Liu, S.G.; Dong, W.J.; Zhang, H.C.; Yu, G.R.; Chen, Z.Q.; He, H.L.; Guo, W.D.; et al. Severe summer heatwave and drought strongly reduced carbon uptake in Southern China. Sci. Rep. 2016, 18813. [Google Scholar] [CrossRef] [PubMed]
- Lu, D.S.; Li, G.Y.; Moran, E. Current situation and needs of change detection techniques. Int. J. Image Data Fusion 2014, 5, 13–38. [Google Scholar] [CrossRef]
- Healey, S.P.; Cohen, W.B.; Yang, Z.; Krankina, O.N. Comparison of tasseled Cap-based Landsat data structures for use in forest disturbance detection. Remote Sens. Environ. 2005, 97, 301–310. [Google Scholar] [CrossRef]
- Jin, S.; Sader, S.A. Comparison of time series tasseled cap wetness and the normalized difference moisture index in detecting forest disturbances. Remote Sens. Environ. 2005, 94, 364–372. [Google Scholar] [CrossRef]
- Masek, J.G.; Huang, C.Q.; Wolfe, R.; Cohen, W.; Hall, F.; Kutler, J.; Nelson, P. North American forest disturbance mapped from a decadal Landsat record. Remote Sens. Environ. 2008, 112, 2914–2926. [Google Scholar] [CrossRef]
- Cohen, W.B.; Yang, Z.Q.; Kennedy, R. Detecting trends in forest disturbance and recovery using yearly Landsat time series: 2. TimeSync—Tools for calibration and validation. Remote Sens. Environ. 2010, 114, 2911–2924. [Google Scholar] [CrossRef]
- Huang, C.Q.; Goward, S.N.; Masek, J.G.; Thomas, N.; Zhu, Z.L.; Vogelmann, J.E. An automated approach for reconstructing recent forest disturbance history using dense Landsat time series stacks. Remote Sens. Environ. 2010, 114, 183–198. [Google Scholar] [CrossRef]
- Kennedy, R.E.; Yang, Z.Q.; Cohen, W.B. Detecting trends in forest disturbance and recovery using yearly Landsat time series: 1. LandTrendr-Temporal segmentation algorithms. Remote Sens. Environ. 2010, 114, 2897–2910. [Google Scholar] [CrossRef]
- Thomas, N.E.; Huang, C.Q.; Goward, S.N.; Powell, S.; Rishmawi, K.; Schleeweis, K.; Hinds, A. Validation of North American forest disturbance dynamics derived from Landsat time series stacks. Remote Sens. Environ. 2011, 115, 19–32. [Google Scholar] [CrossRef]
- Zhu, Z.; Woodcock, C.E.; Olofsson, P. Continuous monitoring of forest disturbance using all available Landsat imagery. Remote Sens. Environ. 2012, 122, 75–91. [Google Scholar] [CrossRef]
- Masek, J.G.; Goward, S.N.; Kennedy, R.E.; Cohen, W.B.; Moisen, G.G.; Schleeweis, K.; Huang, C. United States forest disturbance trends observed using Landsat time series. Ecosystems 2013, 16, 1087–1104. [Google Scholar] [CrossRef]
- Richard, R.; Heim, J.R. A review of twentieth-century drought indices used in the United States. Am. Meteorol. Soc. 2002, 83, 1149–1165. [Google Scholar]
- Coops, N.C.; Wulder, M.A.; Iwanicka, D. Large area monitoring with a MODIS-based Disturbance Index (DI) sensitive to annual and seasonal variations. Remote Sens. Environ. 2009, 113, 1250–1261. [Google Scholar] [CrossRef]
- Hilker, T.; Wulder, M.A.; Coops, N.C.; Linke, J.; McDermid, G.; Masek, J.G.; Gao, F.; White, J.C. A new data fusion model for high spatial- and temporal-resolution mapping of forest disturbance based on Landsat and MODIS. Remote Sens. Environ. 2009, 113, 1613–1627. [Google Scholar] [CrossRef]
- Kennedy, R.E.; Yang, Z.; Cohen, W.B.; Pfaff, E.; Braaten, J.; Nelson, P. Spatial and temporal patterns of forest disturbance and regrowth within the area of the Northwest Forest Plan. Remote Sens. Environ. 2012, 122, 117–133. [Google Scholar] [CrossRef]
- Loboda, T.V.; Zhang, Z.; O’Neal, K.J.; Sun, G.; Csiszar, I.A.; Shugart, H.H.; Sherman, N.J. Reconstructing disturbance history using satellite-based assessment of the distribution of land cover in the Russian Far East. Remote Sens. Environ. 2012, 118, 241–248. [Google Scholar] [CrossRef]
- Sulla-Menashe, D.; Kennedy, R.E.; Yang, Z.; Braaten, J.; Krankina, O.N.; Friedl, M.A. Detecting forest disturbance in the Pacific Northwest from MODIS time series using temporal segmentation. Remote Sens. Environ. 2014, 151, 114–123. [Google Scholar] [CrossRef]
- Vicente-Serrano, S.M.; Cabello, D.; Tomás-Burguera, M.; Martín-Hernández, N.; Beguería, S.; Azorin-Molina, C.; Kenawy, A. Drought variability and land degradation in semiarid regions: Assessment using remote sensing data and drought indices (1982–2011). Remote Sens. 2015, 7, 4391–4423. [Google Scholar] [CrossRef]
- Huang, C.Q.; Goward, S.N.; Schleeweis, K.; Thomas, N.; Masek, J.G.; Zhu, Z.L. Dynamics of national forests assessed using the Landsat record: Case studies in eastern United States. Remote Sens. Environ. 2009, 113, 1430–1442. [Google Scholar] [CrossRef]
- Kennedy, R.E.; Cohen, W.B.; Schroeder, T.A. Trajectory-based change detection for automated characterization of forest disturbance dynamics. Remote Sens. Environ. 2007, 110, 370–386. [Google Scholar] [CrossRef]
- Xia, H.; Wu, J.J.; Liu, Y.N.; Fan, J.L. Progress on drought monitoring by remote sensing in China. Remote Sens. Inf. 2005, 1, 55–58. [Google Scholar]
- Zarch, M.A.A.; Malekinezhad, H.; Mobin, M.H.; Dastorani, M.T.; Kousari, M.R. Drought monitoring by reconnaissance drought index (RDI) in Iran. Water Resour. Manag. 2011, 25, 3485–3504. [Google Scholar] [CrossRef]
- Qu, G.; Yang, G.; Wang, Y. Drought remote sensing monitoring method. Agric. Sci. Technol. Equip. 2013, 5, 42–44. [Google Scholar]
- Tucker, C.J.; Choudhury, B.J. Satellite remote sensing of drought conditions. Remote Sens. Environ. 1987, 23, 243–251. [Google Scholar] [CrossRef]
- Peters, A.J.; Walter-Shea, E.A.; Ji, L.; Vina, A.; Hayes, M.; Svoboda, M.D. Drought monitoring with NDVI-based standardized vegetation index. Photogramm. Eng. Remote Sens. 2002, 68, 71–75. [Google Scholar]
- Fensholt, R.; Sandholt, I. Derivation of a shortwave infrared water stress index from MODIS near-and shortwave infrared data in a semiarid environment. Remote Sens. Environ. 2003, 87, 111–121. [Google Scholar] [CrossRef]
- Ghulam, A.; Qin, Q.; Teyip, T.; Li, Z.L. Modified perpendicular drought index (MPDI): A real-time drought monitoring method. ISPRS J. Photogramm. Remote Sens. 2007, 62, 150–164. [Google Scholar] [CrossRef]
- Gu, Y.X.; Hunt, E.; Wardlow, B.; Basara, J.B.; Brown, J.F.; Verdin, J.P. Evaluation of MODIS NDVI and NDWI for vegetation drought monitoring using Oklahoma Mesonet soil moisture data. Geophys. Res. Lett. 2008, 35. [Google Scholar] [CrossRef]
- McVicar, T.R.; Jupp, D.L. The current and potential operational uses of remote sensing to aid decisions on drought exceptional circumstances in Australia: A review. Agric. Syst. 1998, 57, 399–468. [Google Scholar] [CrossRef]
- Carlson, T.N.; Gillies, R.R.; Perry, E.M. A method to make use of thermal infrared temperature and NDVI measurements to infer surface soil water content and fractional vegetation cover. Remote Sens. Rev. 1994, 9, 161–173. [Google Scholar] [CrossRef]
- Kogan, F.N. Application of vegetation index and brightness temperature for drought detection. Adv. Space Res. 1995, 15, 91–100. [Google Scholar] [CrossRef]
- Wang, P.X.; Li, X.W.; Gong, J.Y.; Song, C.S. Vegetation temperature condition index and its application for drought monitoring. In Proceedings of the IEEE 2001 International Geoscience and Remote Sensing Symposium, Sydney, Australia, 9–13 July 2001; Volume 1, pp. 141–143.
- Wan, Z.; Wang, P.; Li, X. Using MODIS land surface temperature and normalized difference vegetation index products for monitoring drought in the southern Great Plains, USA. Int. J. Remote Sens. 2004, 25, 61–72. [Google Scholar] [CrossRef]
- Karnieli, A.; Agam, N.; Pinker, R.T.; Anderson, M.; Imhoff, M.L.; Gutman, G.G.; Panov, N.; Goldberg, A. Use of NDVI and land surface temperature for drought assessment: Merits and limitations. J. Clim. 2010, 23, 618–633. [Google Scholar] [CrossRef]
- Liu, Q.; Li, S.; Wu, W. The input–output status and farmer’s willingness of hickory ecological management. Issues For. Econ. 2011, 6, 520–525. [Google Scholar]
- Zhan, S.; Zhao, W.; Ye, L.; Sun, Z.; Zhou, P.; Xu, C. The series study on the alternate bearing phenomenon of Carya cathayensis in Lin An. East China Forest Manag. 2004, 4, 13–16. (In Chinese) [Google Scholar]
- Li, M.Y. A study on changes of forest landscape patterns of Lin An in Zhejiang province. J. Nanjing For. Univ. 1999, 23, 71–74. [Google Scholar]
- Using the USGS Landsat 8 Product. Available online: http://landsat.usgs.gov/Landsat8_Using_Product.php (accessed on 21 February 2016).
- Chander, G.; Markham, B.L.; Helder, D.L. Summary of current radiometric calibration coefficients for Landsat MSS, TM, ETM+, and EO-1 ALI sensors. Remote Sens. Environ. 2009, 113, 893–903. [Google Scholar] [CrossRef]
- Lu, D.; Ge, H.L.; He, S.; Xu, A.; Zhou, G.M.; Du, H.Q. Pixel-based Minnaert correction method for reducing topographic effects on the Landsat 7 ETM+ image. Photogramm. Eng. Remote Sens. 2008, 74, 1343–1350. [Google Scholar]
- Heather, R.; Hakan, O. C-correction of optical satellite data over Alpine vegetation areas: A comparison of sampling strategies for determining the empirical c-parameter. Remote Sens. Environ. 2011, 115, 1387–1400. [Google Scholar]
- Li, C.; Fan, J.; Fu, X.; Fan, H. Analysis and comparison test on C-correction strategies and their scale effects with TM images in rugged mountainous terrain. J. Geo Inf. Sci. 2014, 16, 134–141. [Google Scholar]
- Lu, D.; Moran, E.; Batistella, M. Linear mixture model applied to Amazonian vegetation classification. Remote Sens. Environ. 2003, 87, 456–469. [Google Scholar] [CrossRef] [Green Version]
- Mustard, J.F.; Sunshine, J.M. Spectral analysis for earth science: Investigations using remote sensing data. Remote Sens. Earth Sci. Man. Remote Sens. 1999, 3, 251–307. [Google Scholar]
- Van der Meer, F.; de Jong, S.M. Improving the results of spectral unmixing of Landsat Thematic Mapper imagery by enhancing the orthogonality of end-members. Int. J. Remote Sens. 2000, 21, 2781–2797. [Google Scholar] [CrossRef]
- Xi, Z.Y.; Liu, L.J.; Lu, D.; Ge, H.L.; Chen, Y.L. Mapping of Carya cathayensis spatial distribution with linear spectral mixture model. Forest Sci. 2015, 51, 43–52. (In Chinese) [Google Scholar]
- Qi, J.; Chehbouni, A.; Huete, A.R.; Kerrt, Y.H.; Sorooshian, S. A modified soil adjusted vegetation index. Remote Sens. Environ. 1994, 48, 119–126. [Google Scholar] [CrossRef]
- Liu, H.Q.; Huete, A.R. A feedback based modification of the NDVI to minimize canopy background and atmospheric noise. IEEE Trans. Geosci. Remote Sens. 1995, 457–465. [Google Scholar] [CrossRef]
- Congalton, R.G.; Green, K. Assessing the Accuracy of Remotely Sensed Data: Principles and Practice, 2nd ed.; CRC Press, Taylor & Francis Group: Boca Raton, FL, USA, 2008. [Google Scholar]
- Lu, D.; Weng, Q. A survey of image classification methods and techniques for improving classification performance. Int. J. Remote Sens. 2007, 28, 823–870. [Google Scholar] [CrossRef]
- Lu, D.; Mausel, P.; Brondízio, E.; Moran, E. Change detection techniques. Int. J. Remote Sens. 2004, 25, 2365–2407. [Google Scholar] [CrossRef]
- Lu, D.; Batistella, M.; Moran, E. Integration of Landsat TM and SPOT HRG images for vegetation change detection in the Brazilian Amazon. Photogramm. Eng. Remote Sens. 2008, 74, 421–430. [Google Scholar] [CrossRef]
- Lu, D.; Batistella, M.; Moran, E. Multitemporal spectral mixture analysis for Amazonian land-cover change detection. Can. J. Remote Sens. 2004, 30, 87–100. [Google Scholar] [CrossRef]
- Lehmann, E.A.; Caccetta, P.A.; Zhou, Z.S.; McNeill, S.J.; Wu, X.L.; Mitchell, A.L. Joint processing of Landsat and ALOS-PALSAR data for forest mapping and monitoring. IEEE Trans. Geosci. Remote Sens. 2012, 50, 55–67. [Google Scholar] [CrossRef]
- Dong, J.W.; Xiao, X.M.; Chen, B.Q.; Torbick, N.; Jin, C.; Zhang, G.L.; Biradar, C. Mapping deciduous rubber plantations through integration of PALSAR and multi-temporal Landsat imagery. Remote Sens. Environ. 2013, 134, 392–402. [Google Scholar] [CrossRef]
- Kou, W.L.; Xiao, X.M.; Dong, J.W.; Gan, S.; Zhai, D.L.; Zhang, G.L.; Qin, Y.W.; Li, L. Mapping deciduous rubber plantation areas and stand ages with PALSAR and Landsat images. Remote Sens. 2015, 7, 1048–1073. [Google Scholar] [CrossRef]
- Li, L.; Dong, J.W.; Tenku, S.N.; Xiao, X.M. Mapping oil palm plantations in Cameroon using PALSAR 50-m Orthorectified Mosaic images. Remote Sens. 2015, 7, 1206–1224. [Google Scholar] [CrossRef]
- Anjos, D.; Lu, D.; Dutra, L.; Sant’Anna, S. Change detection techniques using multisensor data. In Remote Sensing Handbook—Data, Characterization, Classification and Accuracies; Thenkabail, P.S., Ed.; Taylor and Francis Inc.: Oxford, UK, 2015; Volume 1, pp. 377–397. [Google Scholar]
- Lambin, E.F. Monitoring forest degradation in tropical regions by remote sensing: Some methodological issues. Glob. Ecol. Biogeogr. 1999, 8, 191–198. [Google Scholar] [CrossRef]


| Dataset | Acquisition Data | Azimuth | Sun Elev. Angle | Note |
|---|---|---|---|---|
| Landsat 8 OLI (path/row:120/39) | 10 July 2013 | 105.64 | 68.00 | This image is the only cloud-free image available close to pre-drought event |
| 14 October 2013 | 152.60 | 47.91 | This image is the only cloud-free image available close to post-drought event | |
| 1 December 2013 | 158.42 | 34.96 | The image in leaf-off season is used to map distribution of hickory plantations | |
| RapidEye images | The RapidEye images in 2012 were used mainly for selection of more training samples for urban, water, and agricultural lands | |||
| ASTER GDEM | These data with 30-m spatial resolution were registered into the same coordinate system as Landsat 8 OLI data and are used to conduct topographic correction of Landsat imagery. | |||
| Field surveys | Fieldwork was conducted in June 2013–August 2014. A total number of 84 vegetation samples were collected, including 20 for hickory plantations, 30 for evergreen forests, 20 for other deciduous broadleaf forests, and 14 for shrubs. | |||
| Disturbance Levels | Threshold | % | Spatial Patterns |
|---|---|---|---|
| Non | <1.88 | 29.7 | Mainly located at the foot of mountains and in valleys with good soil conditions. |
| Light | 1.89–3.10 | 58.8 | Mainly distributed in Daoshi Township where hickory plantations account for a large proportion of their mountainous areas and plantation owners had intensive management, including irrigation during the drought period |
| Medium | 3.11–4.07 | 8.7 | Mainly located at mountain ridges with poor soil conditions |
| Severe | >4.08 | 2.7 | Dispersed in some mountain ridges without obvious spatial patterns |
© 2016 by the authors; licensee MDPI, Basel, Switzerland. This article is an open access article distributed under the terms and conditions of the Creative Commons Attribution (CC-BY) license (http://creativecommons.org/licenses/by/4.0/).
Share and Cite
Xi, Z.; Lu, D.; Liu, L.; Ge, H. Detection of Drought-Induced Hickory Disturbances in Western Lin An County, China, Using Multitemporal Landsat Imagery. Remote Sens. 2016, 8, 345. https://doi.org/10.3390/rs8040345
Xi Z, Lu D, Liu L, Ge H. Detection of Drought-Induced Hickory Disturbances in Western Lin An County, China, Using Multitemporal Landsat Imagery. Remote Sensing. 2016; 8(4):345. https://doi.org/10.3390/rs8040345
Chicago/Turabian StyleXi, Zhenyuan, Dengsheng Lu, Lijuan Liu, and Hongli Ge. 2016. "Detection of Drought-Induced Hickory Disturbances in Western Lin An County, China, Using Multitemporal Landsat Imagery" Remote Sensing 8, no. 4: 345. https://doi.org/10.3390/rs8040345