Article

Integration of Ground and Multi-Resolution Satellite Data for Predicting the Water Balance of a Mediterranean Two-Layer Agro-Ecosystem

1
Istituto di Biometeorologia (IBIMET), Consiglio Nazionale delle Ricerche, 50145 Firenze, Italy
2
Istituto Valorizzazione Legno e Specie Arboree (IVALSA), Consiglio Nazionale delle Ricerche, 50019 Sesto Fiorentino (FI), Italy
3
Istituto per la Protezione Sostenibile delle Piante (IPSP), Consiglio Nazionale delle Ricerche, 50019 Sesto Fiorentino (FI), Italy
4
Dipartimento di Bioscienze e Territorio, Università del Molise, 86090, Pesche (IS), Italy
*
Author to whom correspondence should be addressed.
Remote Sens. 2016, 8(9), 731; https://doi.org/10.3390/rs8090731
Submission received: 8 June 2016 / Revised: 26 August 2016 / Accepted: 29 August 2016 / Published: 5 September 2016

Abstract

:
The estimation of site water budget is important in Mediterranean areas, where it represents a crucial factor affecting the quantity and quality of traditional crop production. This is particularly the case for spatially fragmented, multi-layer agricultural ecosystems such as olive groves, which are traditional cultivations of the Mediterranean basin. The current paper aims at demonstrating the effectiveness of spatialized meteorological data and remote sensing techniques to estimate the actual evapotranspiration (ETA) and the soil water content (SWC) of an olive orchard in Central Italy. The relatively small size of this orchard (about 0.1 ha) and its two-layer structure (i.e., olive trees and grasses) require the integration of remotely sensed data with different spatial and temporal resolutions (Terra-MODIS, Landsat 8-OLI and Ikonos). These data are used to drive a recently proposed water balance method (NDVI-Cws) and predict ETA and then site SWC, which are assessed through comparison with sap flow and soil wetness measurements taken in 2013. The results obtained indicate the importance of integrating satellite imageries having different spatio-temporal properties in order to properly characterize the examined olive orchard. More generally, the experimental evidences support the possibility of using widely available remotely sensed and ancillary datasets for the operational estimation of ETA and SWC in olive tree cultivation systems.

Graphical Abstract

1. Introduction

Actual evapotranspiration (ETA) is a key parameter of the Earth’s hydrological cycle linked to mass and energy exchanges, knowledge of which is fundamental for environmental, economic and social analysis at different spatial and temporal scales [1,2]. An accurate quantification of ETA is critical for water use efficiency evaluation and, consequently, enhancement in agriculture, forestry and local resource management [3]. This is particularly relevant in semi-arid environments, where information on water consumption rates can play a significant role in local policy-making process [4,5]. At present, the Mediterranean region could save 35% of water by implementing more efficient irrigation and conveyance systems, in particular for agricultural trees, which consume more water than annual crops [6]. Moreover, recent studies have shown that climate change can affect the water needs of traditional Mediterranean crops, increasing temperature and transpiration as well as increasing duration and intensity of dry periods [6,7,8].
In the last few years, innovative approaches have been developed to improve ETA detection and quantification, using space, air or ground-based instrumentation [9,10]. Although some of these approaches can potentially improve traditional measurement systems, in particular reducing costs for data acquisition, management and delivery [11], one of the main problems remains the degree of precision of the provided estimation [12,13]. In general, Earth Observation (EO) techniques represent an efficient tool to obtain relatively frequent, low-cost updating of information at different temporal and spatial scales. These techniques provide increasingly satisfactory spatial and temporal coverage, offering good solutions for meeting cross-sectoral needs [14,15]. A comprehensive review of the available EO techniques developed to estimate ETA in different contexts can be found in [16]. Novel approaches range from simple empirical to physically-based methods, such as land surface models [17,18]. Unfortunately, most of these methods require high computational power and technical expertise for their parameterization and/or local downscaling [1], limiting their use to a restricted community of final users.
Recent research has, therefore, focused on the development of operational EO products to monitor ETA at continental or global scales [19,20]. Data sources for operational ETA estimation, utilizing sun-synchronous polar orbiting satellites, have included the Moderate Resolution Imaging Spectroradiometer (MODIS) product [21]. Within this research line Maselli et al. [22] have proposed a new operational water balance method based on the combination of MODIS Normalized Difference Vegetation Index (NDVI) and meteorological data (NDVI-Cws), which overcomes most limitations of preceding approaches. The method was successfully applied to predict the ETA of various vegetation types, including forests and annual crops, in Central Italy.
The introduction of the NDVI-Cws method, as well as the use of spatial information to guide more detailed analyses, is potentially useful to monitor the water requirement of Mediterranean semi-arid agricultural systems [11]. The approach, however, has not been tested in rainfed multi-layer agricultural ecosystems, such as olive groves and vineyards, that are widely cultivated in the Mediterranean basin [23]. Olive groves, in particular, need efficient tools to provide practically useful advices to farmers, starting from a limited number of basic information and datasets [24,25]. Unfortunately, a reliable quantification of the evapotranspiration rate is complex in these woody crops, due to a number of environmental and technical factors [26,27]. Olive groves are, in fact, composed of variable proportion of trees and grasses and are grown following extremely diversified agricultural practices [23]. In spite of this, Marino et al. [28] observed that NDVI is informative on the photosynthesis as well as on the stomata conductance and leaf water potential of olive plants, under wet and dry regimes.
The NDVI-Cws method is therefore potentially useful for monitoring the water resources of Mediterranean olive groves. To reach this objective, however, the method should be adapted to cope with the spatially fragmented, two-layer structure of these groves. Contemporaneously, the method should be fed with widely available conventional and remote sensing datasets, without the need for a site-specific calibration which would limit its operational applicability. The current paper aims at evaluating this possibility using an experimental olive orchard in Central Italy. The proper characterization of this orchard requires the integration of remote sensing data with different spatial and temporal resolutions (i.e., MODIS, Landsat 8-OLI and Ikonos imagery). The olive tree transpiration estimates are first evaluated against daily sap flow measurements taken during part of the examined growing season (2013). Then, the ETA estimates of trees and grasses are combined with precipitation data to obtain a simplified site water balance, which is assessed through comparison with daily measurements of soil water content (SWC).

2. Materials and Methods
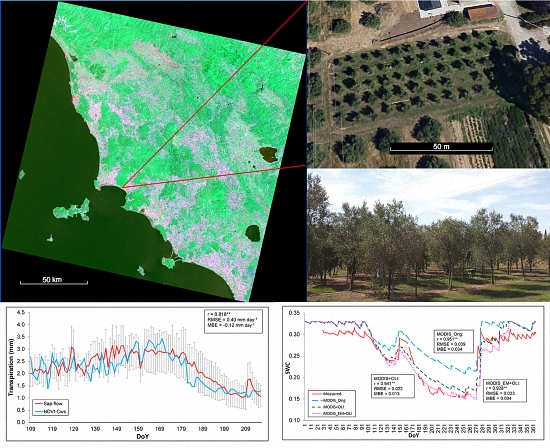
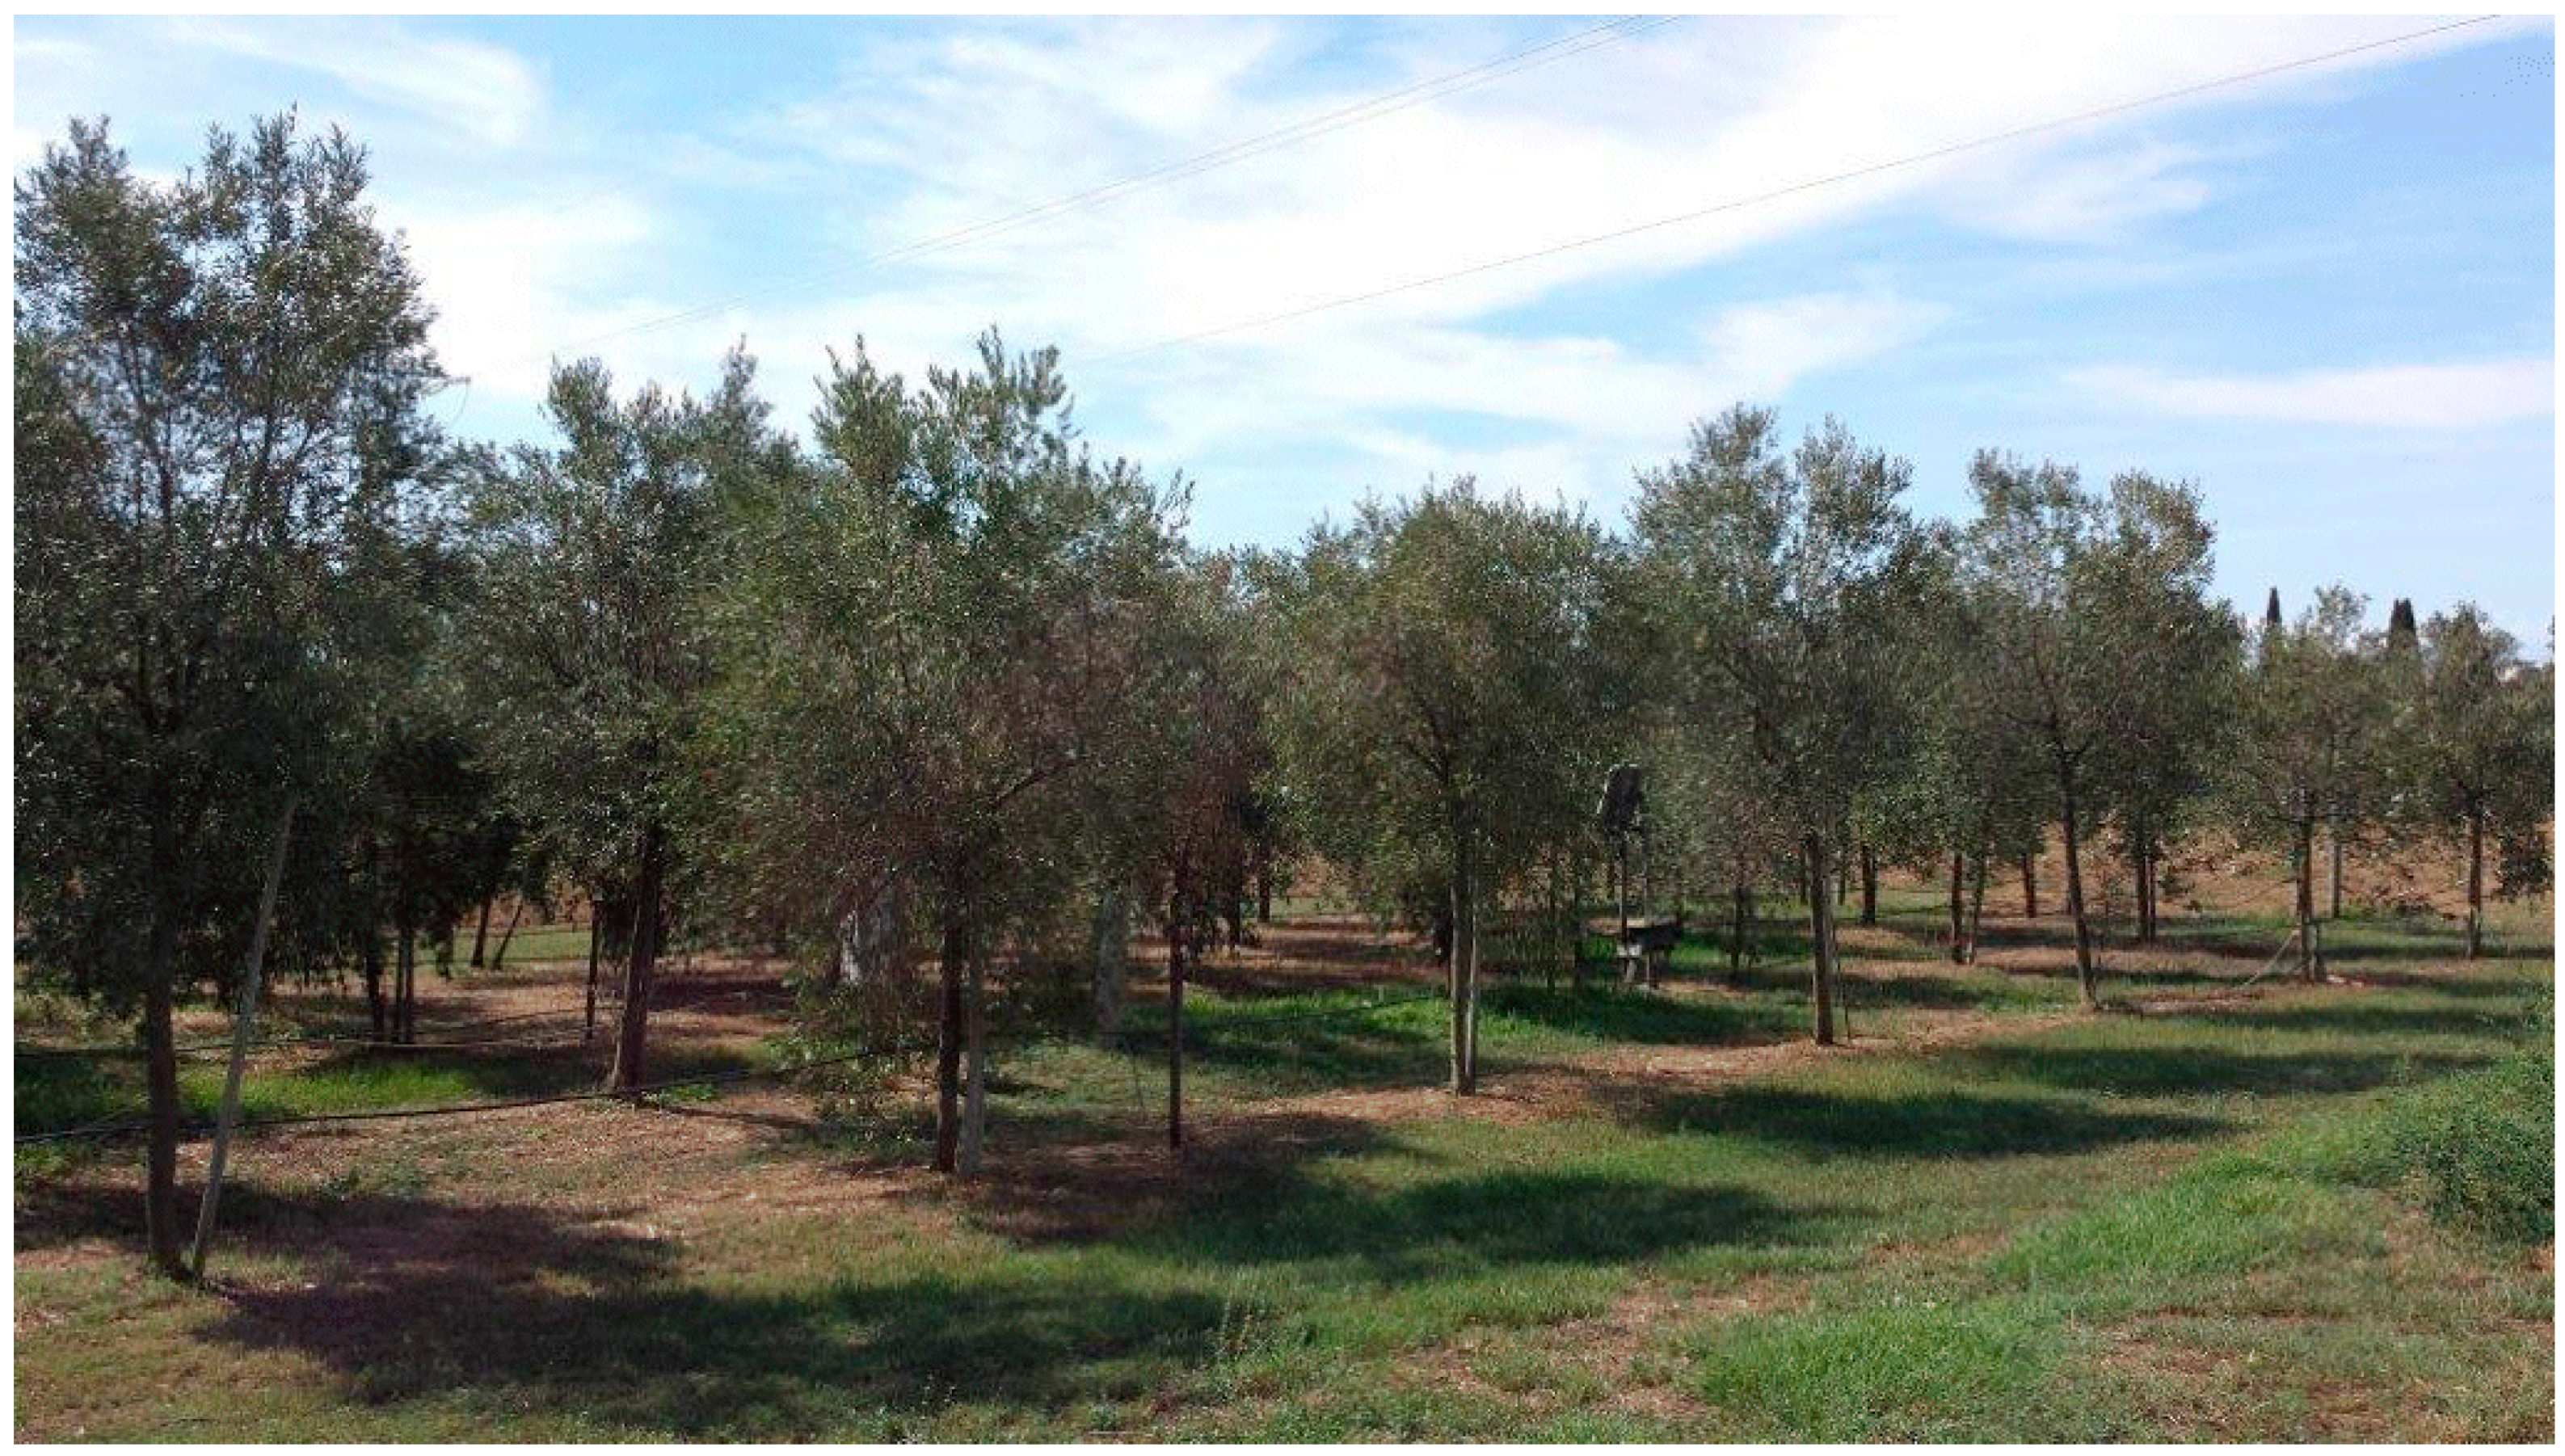
2.1. Study Area

The study was conducted on an experimental olive orchard (Olea europaea L., cv. Leccino) situated in an agricultural area near Follonica, Tuscany (Central Italy, 42°55′58″N, 10°45′51″E; 17 m a.s.l.) (Figure 1). The area shows a typical sub arid Mediterranean climate with a mean annual air temperature of 16 °C. January is the coldest (9 °C) and July the warmest month (24 °C) and the mean diurnal thermal range is 9–10 °C. The mean annual precipitation is 650 mm, mostly concentrated in autumn and spring, while in summer precipitation is very scarce. Soil has a total depth of about 3 m; its surface layer (about 0.5 m) is silty loam, with a low amount of organic matter.
This olive orchard has been the subject of numerous studies, during which it has been fully characterized from an eco-physiological point of view (e.g. [28,29]). The orchard is mostly surrounded by other olive groves having varying tree densities and ages and extends over an area of about 0.1 ha, which was planted in 2003 with a 4 m × 4 m spacing [29]. In 2013, the mean height of the olive trees was about 3 m (Figure 2). Inter-tree areas are generally covered by several herbaceous native species. The olive orchard, usually grown in rainfed conditions, is managed with low intensity pruning of the canopy performed in February every year, while the herbaceous coverage of the soil is controlled by three to four passages made by a lawn mower along the vegetative season. The natural grass coverage results almost completely dried during the summer period.

2.2. Datasets

The current study utilized two datasets. The first, composed of satellite images and spatialized ancillary data, was used to drive the model applications; the second, composed of ground observations, was used to assess the model estimates.

2.2.1. Model Drivers

Standard meteorological data (i.e., air temperature and precipitation) were retrieved from a complete 1-km dataset of the Environmental Modelling and Monitoring Laboratory for Sustainable Development (LaMMA Consortium, Tuscany Region). These data were interpolated from the regional meteorological network applying the DAYMET algorithm [30].
Soil information on texture and depth was derived from the soil map of Tuscany produced by Tuscany Regional administration (see http://sit.lamma.rete.toscana.it/websuoli/).
MODIS NDVI images of 2013 were freely downloaded in a pre-processed format from the USGS database (http://lpdaac.usgs.gov). These images have a 250 m spatial resolution and are composited over 16-day periods.
Landsat 8 OLI images were also freely downloaded in a pre-processed format from http://landsat.usgs.gov/landsat8.php. For 2013, only five scenes were completely free from atmospheric disturbances over the study area: 13 April, 16 June, 3 August, 4 September and 7 November. These images, having a spatial resolution of 30 m, were already geometrically and atmospherically corrected, which allowed the computation of NDVI from bands 4 and 5.
A high spatial resolution image of the study olive grove was derived from Google Earth (https://earth.google.com/). This corresponded to an IKONOS pan-fused image collected on 5 June 2013, having a nominal spatial resolution around 1 m.

2.2.2. Ground Observations

Plant transpiration was assessed by means of five Granier-type sensors [31], measuring hourly sap flow. The sensors were radially inserted 20 mm depth into the stems of five olive trees, at 1.3 m height [32]. Hourly data were collected and further elaborated to retrieve daily transpiration rate for the years 2011–2013. The collection periods were not continuous, and covered only about 110 days during the 2013 growing season. In this year the sensors of one olive tree were affected by malfunctioning, and their measurements were excluded from the current analysis.
Soil water content (SWC) was measured on a hourly basis by means of Decagon 10HS sensors [33,34], installed at a depth of 30 cm within the study olive orchard at the beginning of 2013. The sensor positioning (i.e., the distance from trees and the depth in the soil) was defined taking into account plant age and development, with the aim to detect the most active olive tree rooting zone [35,36,37]. Consequently, the collected measurements were assumed to be representative of the mean water content in the soil layer most explored by olive tree roots.

2.3. Data Processing

2.3.1. Pre-Processing of Meteorological and Soil Data

The interpolated daily values of minimum and maximum temperature were used to drive a version of the Hargreaves-Samani (HS) equation suitable for Mediterranean coastal environments [38,39] and predict daily potential evapotranspiration (ET0, mm·day−1).
The soil water capacity and the wilting point were derived from the available soil map of Tuscany following [40].

2.3.2. Estimation and Assessment of Olive Tree Transpiration

A full description of the NDVI-Cws method is provided in [22]. In summary, NDVI is used to estimate fractional vegetation cover (FVC), which indicates the quantity of green transpiring biomass sensitive to long-term water stress. The estimation of FVC allows the independent simulation of crop transpiration and soil evaporation, which are both limited by short-term water stress. The effect of this stress is accounted for by two meteorological factors, which are applied to vegetated and un-vegetated cover fractions for predicting actual transpiration (TrA) and evaporation (EvA), respectively, according to the formulas:
TrA = ET0 × FVC × KcVeg × Cws
EvA = ET0 × (1 − FVC) × KcSoil × AW
where KcVeg and KcSoil are maximum Kc values of vegetation and soil, respectively, and Cws (Coefficient of water stress) and AW (Available Water) are the two meteorological factors. As explained by [22], KcVeg is differentiated for woody and non-woody vegetation types (0.7 and 1.2, respectively), while KcSoil is fixed to 0.2. Cws and AW are calculated from the ratio between precipitation and ET0 cumulated over periods which vary from one to two months depending on the prevalence of woody components. The ranges of Cws and AW are 0.5–1 and 0–1, respectively, based on the assumption that the presence of green leaf biomass as seen by NDVI/FVC implies a certain transpiration level, while this is not the case for soil evaporation [22]. The two water stress factors are always activated for rainfed ecosystems, while for the other ecosystems these factors are deactivated in summer when a FVC higher than 0.6 indicates the provision of water by irrigation or from a water table.
The low spatial resolution of the MODIS NDVI imagery (250 m) was not sufficient to properly characterize the study olive orchard and to identify its main components, olive trees and grasses. Thus, specific integration methods were applied and tested to obtain annual NDVI datasets with the needed spatial and temporal details. First, all collected MODIS images were pre-processed as described in [41] and 16-day NDVI values were extracted from the pixel corresponding to the study olive orchard. Next, the same orchard was identified in the five available Landsat OLI images. The OLI NDVI values of the corresponding pixel were used to linearly recalibrate the 16-day MODIS NDVI values for the whole growing season. As a third trial, the spatially variable endmember identification method proposed by [42] was applied to extract separate NDVI values of olive trees and grasses. This method estimates different NDVI endmembers for each low-resolution image pixel based on a higher spatial resolution map and was currently applied as described in [43]. In this way 16-day NDVI endmembers of olive trees and grasses were predicted, whose average was adjusted to the five OLI NDVI values as done previously.
All mentioned 16-day profiles were temporally interpolated on a daily basis, filtered by a 11-day moving average and converted into corresponding daily FVC values by applying the linear equation proposed by [44], with NDVImin = 0.15 and NDVImax = 0.9 [22]. The estimation of olive tree transpiration through Equation (1) was first driven by the original MODIS NDVI values (MODIS_Orig) and the MODIS NDVI values recalibrated on the OLI imagery (MODIS + OLI). In both these cases, a KcVeg equal to 1 was utilized, which is intermediate between those of trees and grasses. Next, the same estimation was carried out separately for olive trees and grasses using the respective recalibrated NDVI endmembers (MODIS_EM1+OLI and MODIS_EM2+OLI, respectively) and relevant maximum Kc (i.e., 0.7 and 1.2).
Olive tree transpiration was simulated also by the use of a widely known bio-geochemical model, BIOME-BGC [45]. This model, which simulates all main processes of terrestrial ecosystems based on site descriptors of vegetation and soil and daily meteorological data, was tuned for olive groves in Tuscany by [43]. The tuned model version was applied using the available meteorological and ancillary data to simulate daily olive tree transpiration for 2013.
The transpiration estimates obtained using the NDVI-Cws method driven by different NDVI values (MODIS_Orig, MODIS+OLI and MODIS_EM1+OLI) and BIOME-BGC were assessed versus the available sap flow measurements. In all cases the accuracy of the estimates was summarized using common statistics, i.e., the correlation coefficient (r), the root mean square error (RMSE) and the mean absolute error (MBE).

2.3.3. Estimation and Assessment of Site SWC

The total olive grove ETA was predicted by summing the TrA and corresponding EvA estimates obtained by Equations (1) and (2) using the described NDVI datasets (i.e., MODIS_Orig, MODIS+OLI and MODIS_EM+OLI). Estimated ETA was then used to drive a simplified simulation of site water balance through the following formula [46]:
Vi = Vi−1 + Preci − ETAi − DPi
where Vt = volumetric soil water content, ranging from the soil surface to the depth explored by plant roots; Prect = precipitation; ETAt = actual evapotranspiration; DPt = deep percolation or runoff, assumed to equal the outflow occurring when water exceeds the maximum soil water holding capacity; all referred to day i.
The maximum soil water holding capacity was determined considering a soil depth equal to the olive tree rooting depth (1 m) and a field capacity derived from the available soil map (330 cm3·cm−3). The daily Vt estimates obtained were converted into fractional SWC (dimensionless) by division for this maximum soil water holding capacity. The final SWC estimates were assessed through comparison with the daily SWC obtained by aggregating the hourly measurements; these comparisons were summarized using the same accuracy statistics as above.

3. Results

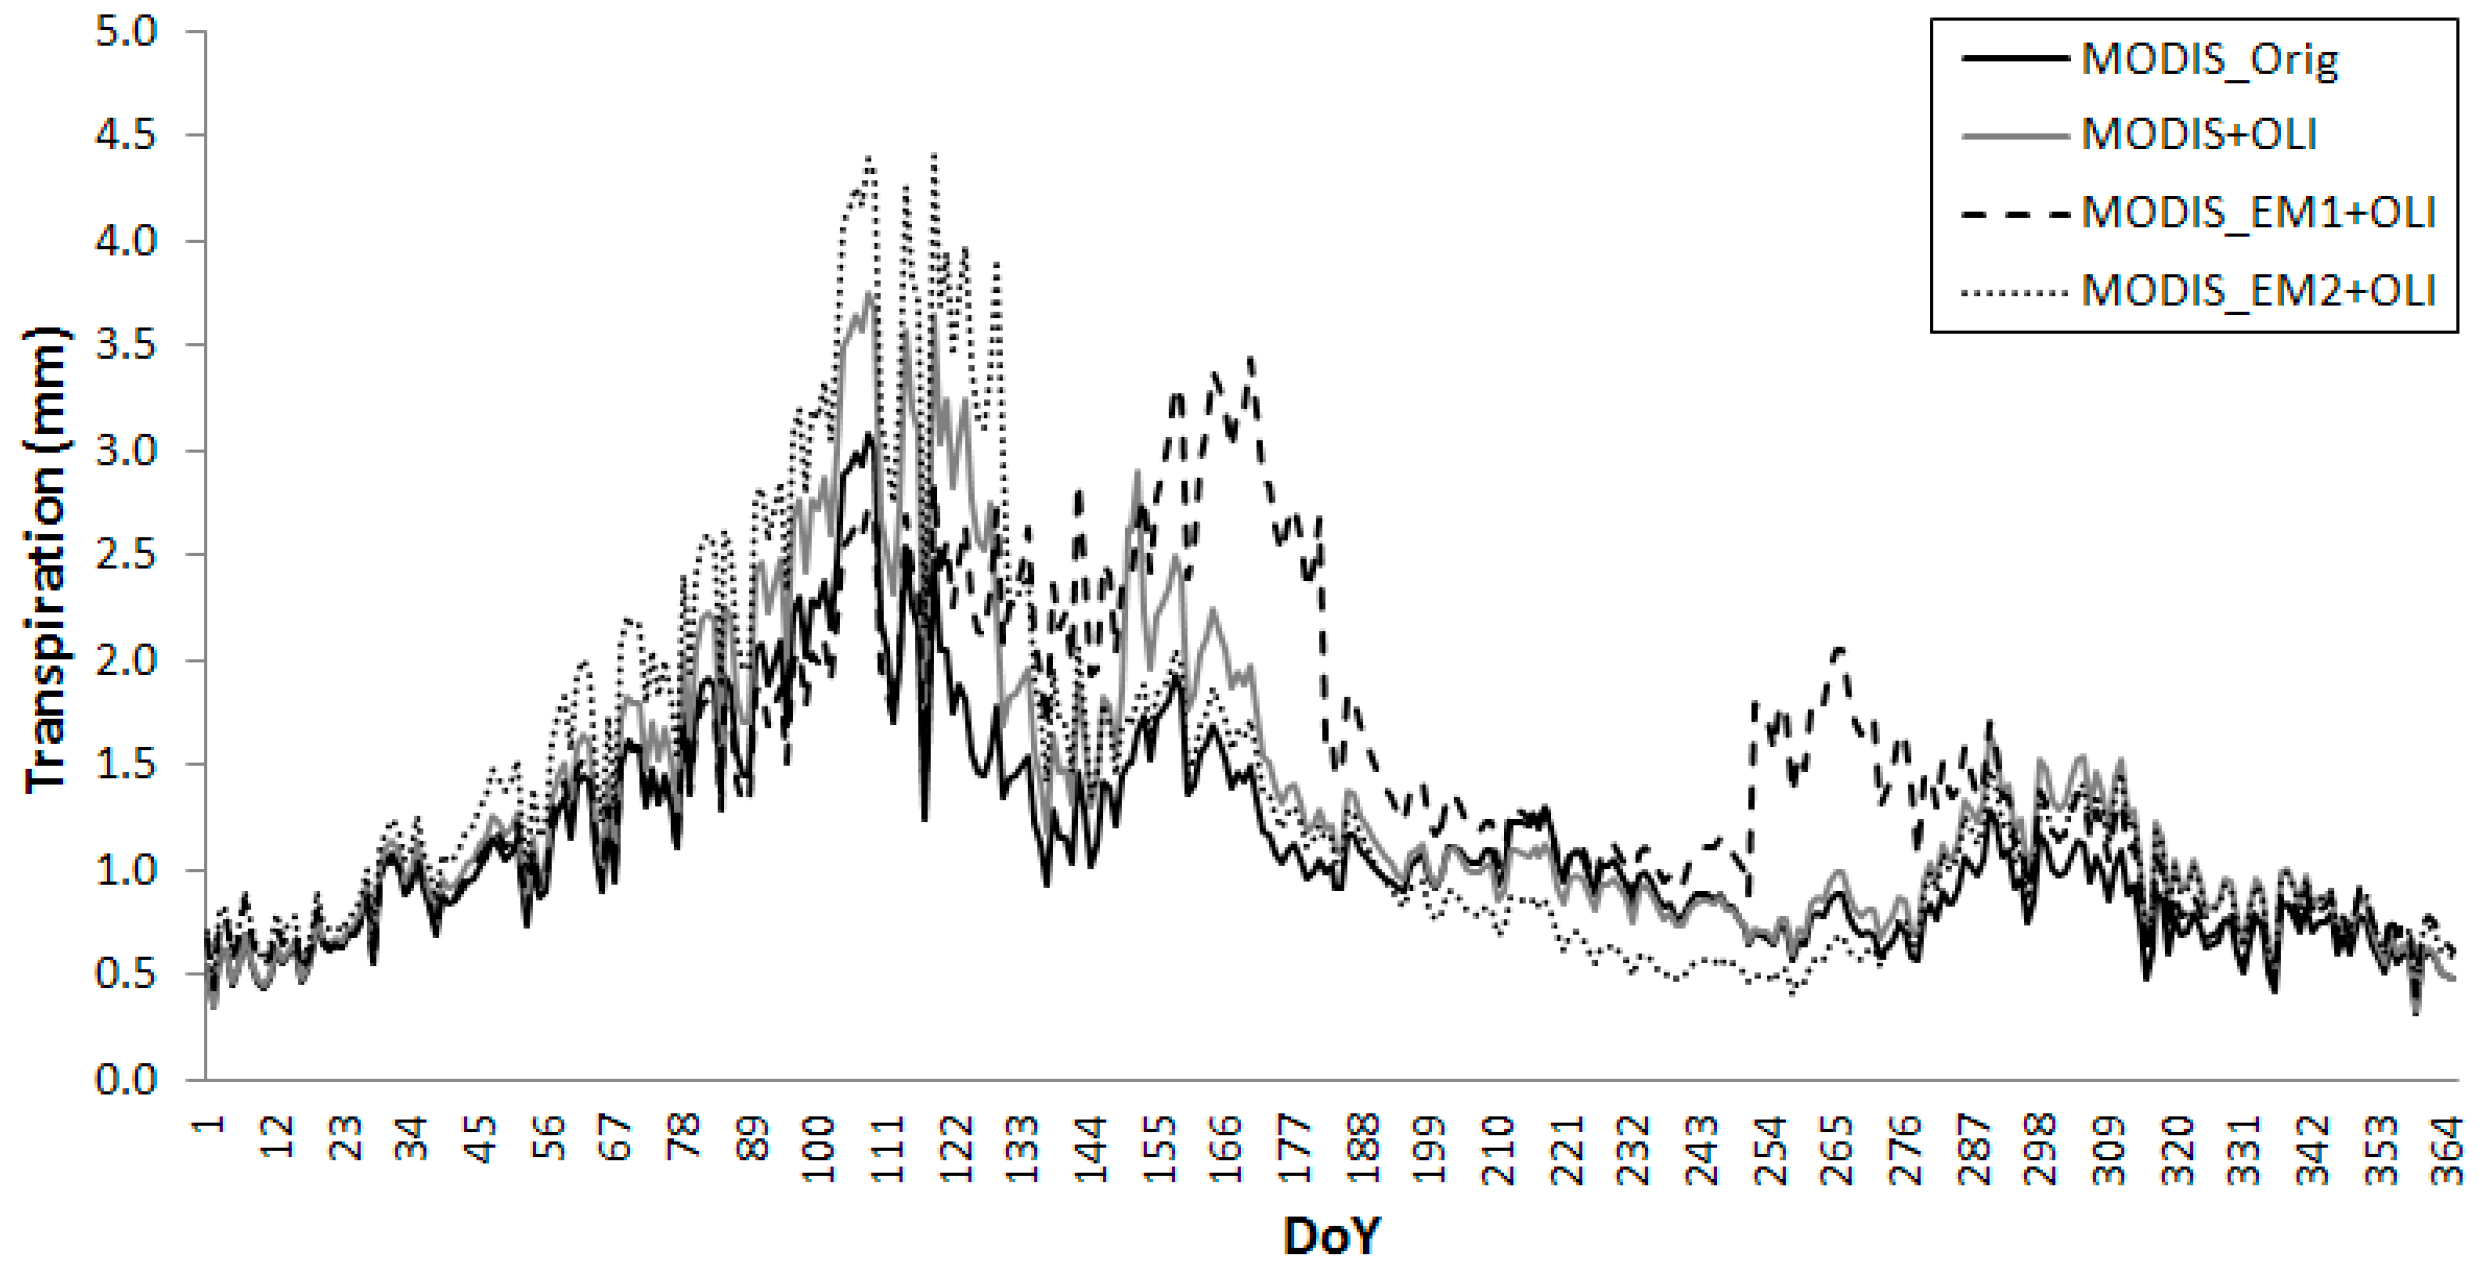
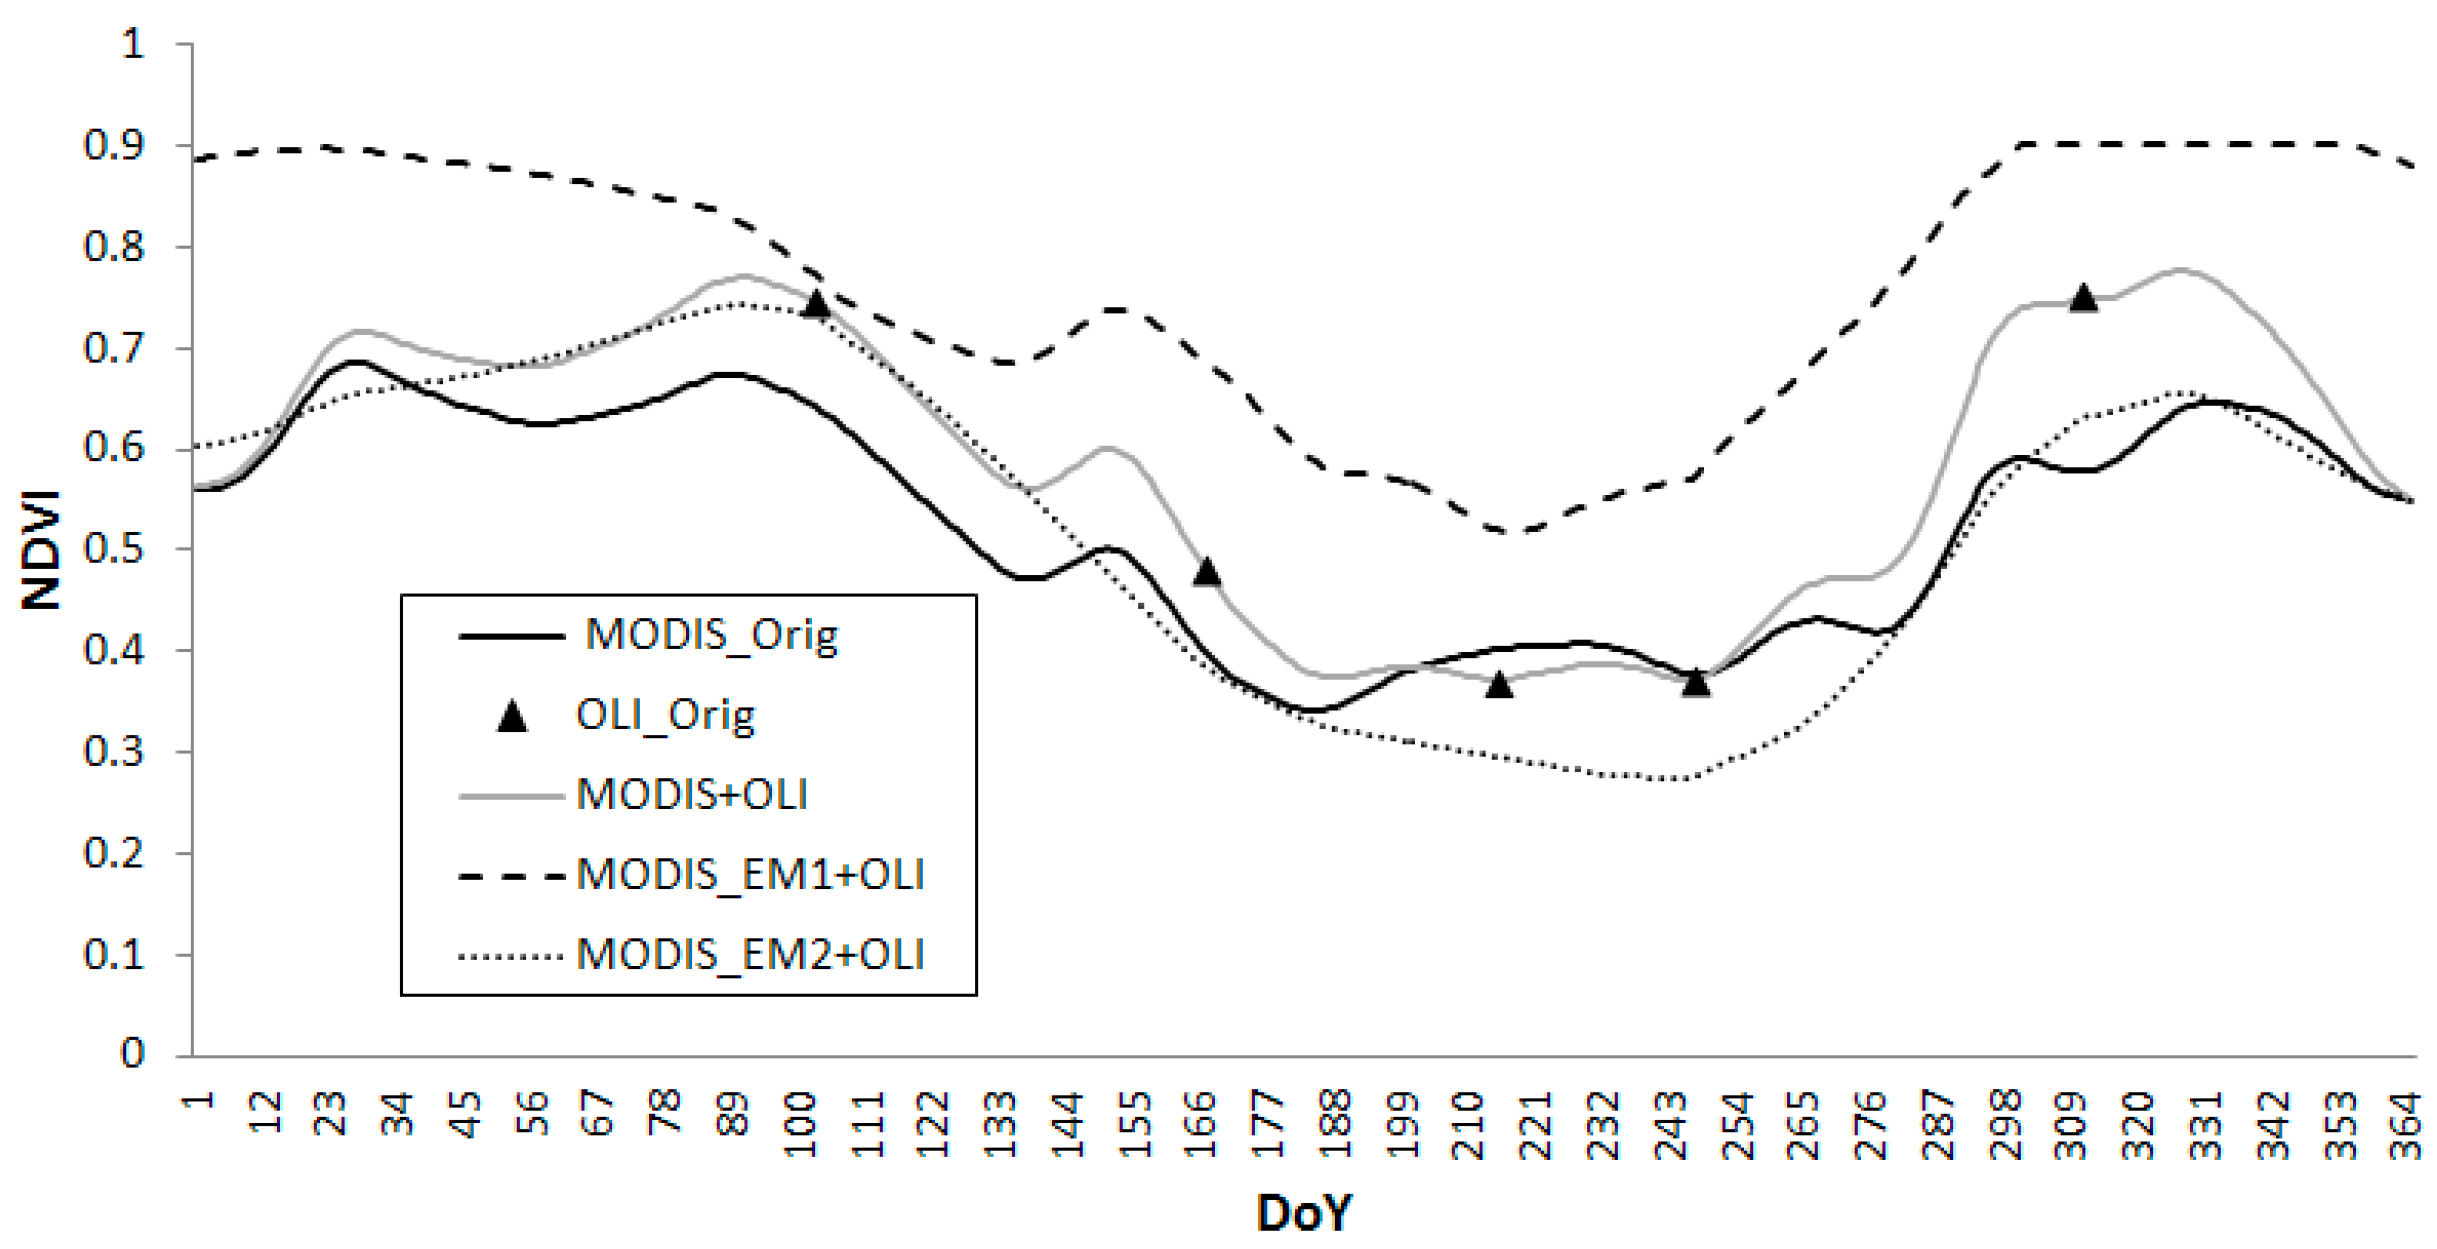
3.1. Estimation of Olive Tree Transpiration

The daily precipitation and ET0 values obtained from interpolated data are shown in Figure 3. Rainfall almost stops from the end of May till the end of September, while the highest ET0 is reached in summer. This creates a critical water deficit period from June to September, in coincidence with the Mediterranean dry season. This pattern is clearly visible from the evolution of the Cws water stress factor, which was computed accumulating rainfall and ET0 over a period intermediate between those of trees and grasses (45 days). Cws is close to 1 in winter and early spring, when there is no water stress. Next, there is a first Cws drop followed by a partial recovery due to May rainfalls. The water stress factor then drops close to the minimum (0.5) from early July to early October, when heavy fall rainfalls occur. A similar evolution characterizes the water stress factor used to estimate Ev, (AW), which, however, ranges from 0 to 1.
The multitemporal NDVI profiles of Figure 4 show the effects of this seasonal meteorology on the vegetation activity of the olive orchard. The original MODIS NDVI time series shows a reduction of green leaf biomass and vegetation activity in late spring-summer, followed by a recovery in autumn. The summer minimum is amplified by the five OLI images, which have higher early-spring and autumn NDVI values. Similar trends are evident in the NDVI endmembers of olive trees and grasses, but with different intensities; olive trees, in fact, exhibit NDVI values higher than grasses during the whole year and are less affected by summer water stress.
The daily TrA estimates obtained using the three NDVI data series are shown in Figure 5. The estimates from the original MODIS data show a clear early-spring peak, which is followed by a decrease and a subsequent recovery due to the precipitation fallen in May (Figure 3). During summer there is a clear TrA decrease, followed by a fall recovery after the typical rainy events. The same evolution is shown when using the MODIS+OLI data series, but in this case, the peak TrA values are higher than those obtained previously (i.e., 3.6 mm·day−1 versus 2.9 mm·day−1).
When feeding the method with the NDVI endmembers, the TrA of grasses, which are more responsive than trees to soil water availability, reaches high values early in spring and is then rapidly affected by water shortage. Grass TrA is always very low during summer and recovers only in October. On the contrary, olive trees show a smaller TrA peak in early spring, but higher TrA values in late spring and summer. A clear recovery is evident after the first rainy events at the end of summer.
Table 1 reports the accuracy statistics of the MODIS_Orig and MODIS+OLI TrA time series compared to the sap flow measurements. A marked TrA underestimation occurs when using the original and recalibrated MODIS data series, due to the previously noted low NDVI values. A good prediction is instead obtained when using the olive tree NDVI endmember (Figure 6). In this last case, the transpiration estimates show the same temporal evolution of the measurements and fall almost completely within the standard errors of these. Accordingly, a high correlation coefficient and low errors are obtained (r = 0.818, RMSE = 0.40 mm·day−1, MBE = −0.12 mm·day−1).
The accuracy obtained by BIOME-BGC is also reported in Table 1. The model estimates are again less accurate than those produced by the optimally driven NDVI-Cws method, due to both a poorer reproduction of daily variability and a greater underestimation of TrA.

3.2. Estimation of SWC

The available SWC measurements show a temporal evolution which is strictly related to the previous meteorological and eco-physiological observations (Figure 7). In particular, soil water is first depleted during a spring dry spell and partly recovers after the May rainfall events. Next, a long SWC minimum is present in summer as a consequence of the scarce rainfall and high ET0 occurring in this season. In particular, SWC decreases close to the wilting point (0.15) during summer, and quickly recovers in September after heavy rainfall events.
The results of the SWC simulations carried out using the ETA estimates driven by different NDVI values (MODIS_Orig, MODIS+OLI, MODIS_EM+OLI) are shown in Figure 7. The use of MODIS_Orig NDVI leads to a clear SWC overestimation, which can be logically attributed to a corresponding strong ETA underestimation. This problem is mostly overcome by the use of MODIS+OLI NDVI, which produces an only marginal SWC overestimation, still likely due to a ETA underestimation. These ETA patterns basically confirm the previous findings about olive tree transpiration, which are variably underestimated (Table 1).
The visual analysis of the Ikonos image indicated an olive tree canopy cover fraction equal to 0.33. The ETA estimates obtained separately for olive trees and grasses were therefore combined using cover proportions of 0.33 and 0.67, respectively. The use of these estimates in the SWC simulation produces an accuracy which is nearly equivalent to that obtained using MODIS+OLI NDVI (Figure 7).

4. Discussion

The method proposed by [22] to predict ETA based on MODIS NDVI and ancillary data is proven to be straightforward and operational. That method, in fact, relies on the well-known concept of crop coefficient (the ratio of ETA to ET0) to constrain daily ET0 accounting for both short-term and long-term effects of water stress. In particular, NDVI is used as an estimate of transpiring green biomass, and is complemented by a meteorological factor, which accounts for short-term water stress. The obtained transpiration is finally combined with soil evaporation, which is predicted for un-vegetated cover fractions constrained by a similar water stress factor.
A major strength of this semi-empirical approach is the direct consideration of a biophysical parameter, green foliage density, which is related to ETA under a given set of meteorological conditions. Indeed, the canopies of olive trees have numerous gaps through which the grass layer is visible, which makes ETA related to the light absorbed by both vegetation layers as measured by NDVI. NDVI alone, however, cannot fully constrain ET0 in the simulation of ETA. Olive trees, in fact, have a fine control over water loss, and rainfed trees are overall more coupled to the atmosphere than well-watered ones [27], with the result that transpiration is less dependent on the radiation term and more dependent on the vapor pressure deficit (and temperature). Actually, vapor pressure deficit acts in synergy with soil water availability in determining stomata closure and, more generally, total plant resistance, which is a major regulator of transpiration. This enhances the importance of including in the simulation of ETA meteorological factors accounting for short-term variations in atmospheric and soil water status [13,41]. When water stress lasts for relatively long periods, the effect of these factors adds to that of green biomass (NDVI/FVC) reduction, leading to a significant decrease in predicted ETA.
The advantages and limitations of this method applied to relatively large, homogeneous, single-layer agricultural or forest ecosystems are widely discussed in [22]. The application of the method to spatially fragmented, multi-layer agricultural ecosystems is more complex and requires addressing additional challenges. The first is due to the spatial size of these ecosystems, which is commonly far below the resolution of MODIS NDVI data (i.e., about 6 ha). Most European olive groves, vineyards and, more generally, tree plantations are, in fact, distributed over irregular terrain and occupy small unit areas (around 0.1–0.5 ha). This spatial resolution issue can be addressed by the integration of MODIS data with higher spatial resolution imagery, such as that taken by Landsat 8 OLI. This is confirmed by the current experimental results, which indicate that such integration yields a clear improvement in the prediction of TrA and SWC.
The second issue instead requires more complex processing operations aimed at separating the NDVI contributions of the different ecosystem components, i.e., trees and grasses. The NDVI endmember identification method currently applied, whose details are fully provided in [42], is suitable to address this issue. This method requires a map of olive canopy cover over larger areas, which can be derived from the combination of high and very high resolution imagery [43]. The method is capable of providing NDVI values more informative on olive tree functions than those obtained from the entire olive orchard, which leads to a decisive improvement in the prediction of olive tree transpiration. This is particularly important for assessing the effect of water stress on olive trees while minimizing the influence of other ecosystem components. This effect is a major determinant of olive fruit yield and must therefore be primarily taken into consideration for regional scale monitoring applications [43]. The same olive tree transpiration estimates better reproduce the sap flow measurements than those obtained from a model of ecosystem processes, BIOME-BGC, which was specifically tuned for this ecosystem type. This finding is mainly related to an imperfect simulation of water stress effects by this model, which does not consider direct estimates of green leaf biomass such as those derivable from NDVI data [45]. The separate treatment of olive trees and grasses, however, does not improve the simulation of SWC over the entire olive orchard. In this case a correction of the MODIS multitemporal NDVI profiles with the OLI NDVI values is sufficient to account for the small size of the olive orchard.
The current simulation experiment remains partly affected by problems of under-sampling in space and time due to the satellite imageries used. These limitations could be overcome by the availability of remote sensing products having enhanced spatial and temporal features, which could theoretically be obtained by new satellite missions and/or acquired from aircraft or proximal remote sensing platforms. In the near future, however, such products will hardly have all characteristics desirable for monitoring the fragmented, multi-layer ecosystems which are typical of Mediterranean areas (i.e., sub-meter spatial resolution and daily revisiting time). This supports the relevance of developing and applying suitable spatio-temporal NDVI integration methods, which is an open field of investigation [47].
All simulations performed are obviously also dependent on method and data used to estimate ET0. ET0 was currently predicted by the HS equation, which is often preferred to other more complicated methods since it requires only maximum and minimum air temperatures and is reasonably accurate [48]. The ET0 estimated by the HS equation have been compared to the ET0 computed with the Penman-Monteith equation (PM-ET0) equation [11], using full datasets, or to grass lysimeter data, indicating that the HS method performs well in most climatic regions, with the exception of humid areas [49,50,51,52]. The used version of the HS equation was suggested for Mediterranean coastal areas by [39], who recognized its superiority over other temperature methods in water limited ecosystems. The current lack of meteorological measurements collected in the olive grove prevented an accuracy assessment versus an independent dataset. The used meteorological data, however, can be presumed to be very accurate, due to the proximity (few hundred meters) of the olive grove to a ground station, which is included in the regional network used by DAYMET. This algorithm, in fact, utilizes a weighting function, which gives preferential consideration to the spatially closest training stations, thus reducing errors in proximity of these [53]. This property is expected to be particularly effective for rainfall, which is characterized by high spatial variability and is obviously very influential on site water balance.
Similar observations can be made for the information about major soil characteristics, such as depth and texture, which determine the maximum soil water holding capacity and are essential for the correct calculation of site water balance. This information is not easy attainable at the desirable spatial scale (i.e., few tens meters), due to the high geographical variability in soil characteristics, which is particularly common in heterogeneous Mediterranean landscapes [46]. This high variability depends both on main pedogenetic factors, such as lithology, physiography, climate, vegetation, etc., and on relevant processes. Soil mapping, based on the soil-landscape paradigm [54], identifies and delineates land units similar for factors and pedogenetic processes and, thus, partly succeeds in addressing soil variability at different spatial scales. However, local uncertainty can have a detrimental effect on the accuracy of the site water balance. Further approximations are brought by the current use of a simplified soil water budget equation, which does not take into account several relevant factors (surface runoff, infiltration rate, multi-layer soil structure, etc.). A more complex modeling approach, however, would presumably bring little benefit to the scope of the paper, where the SWC simulations are used for inter-comparing the impacts of different NDVI datasets.

5. Conclusions

This study concerned the integration of ground and remote sensing datasets with different spatial and temporal properties for simulating the water balance of a complex Mediterranean agro-ecosystem. These datasets have been used to drive an ETA modeling method, NDVI-Cws, which was originally conceived for the operational monitoring of water dynamics at the ecosystem level. In view of this, some methodological adaptations were required to address the peculiar spatial structure of olive groves. The study, however, did not comprise a site specific calibration of the method, which would have improved its accuracy at the expense of its general applicability.
The results obtained support the capability of the NDVI-Cws method to estimate daily olive tree TrA and site SWC in complex, multi-layer Mediterranean agricultural ecosystems. This capability is critically dependent on the quality of the used drivers, particularly concerning the NDVI datasets. The spatially fragmented and two-layer nature of olive groves, in fact, requires a separate estimation of NDVI for trees and grasses, which can be obtained by applying proper statistical operations to satellite imagery with different spatio-temporal properties. This confirms the importance of NDVI datasets having these properties, whose availability will be expanded by foreseen satellite missions (e.g., Sentinels 2 and 3).

Acknowledgments

The authors want to thank Luca Fibbi and Luca Angeli for their assistance in preprocessing the meteorological and MODIS data, respectively. This work has been partly funded by the National Research Council of Italy (projects RSTL: AG.P04.019.004). The authors also want to thank three anonymous RS reviewers and one Academic Editor, whose thoughtful comments improved the quality of the original manuscript.

Author Contributions

P.B. coordinated the experiment and the integration of the datasets; M.C. processed and analyzed the remote sensing data; B.R. and M.R. collected and analyzed the soil data; C.C., A.G., and C.C. collected and elaborated the sap flow data; R.T. and F.M. designed the experiment and wrote the paper.

Conflicts of Interest

The authors declare no conflict of interest.

References

  1. Srivastava, P.K.; Han, D.; Rico-Ramirez, M.A.; Al-Shrafany, D.; Islam, T. Data fusion techniques for improving soil moisture deficit using SMOS satellite and WRF-NOAH land surface model. Water Resour. Manag. 2013, 27, 5069–5087. [Google Scholar] [CrossRef]
  2. Oki, T.; Kanae, S. Global hydrological cycles and world water resources. Science 2006, 313, 1068–1072. [Google Scholar] [CrossRef] [PubMed]
  3. Srivastava, P.K.; Han, D.; Rico-Ramirez, M.A.; Al-Shrafany, D.; Islam, T. Sensitivity and uncertainty analysis of mesoscale model downscaled hydro-meteorological variables for discharge prediction. Hydrol. Process. 2014, 28, 4419–4432. [Google Scholar] [CrossRef]
  4. Rana, G.; Katerji, N. Measurement and estimation of actual evapotranspiration in the field under Mediterranean climate: A review. Eur. J. Agron. 2010, 13, 125–153. [Google Scholar] [CrossRef]
  5. Sun, Z.; Gebremichael, M.; Ardö, J.; de Bruin, H.A.R. Mapping daily evapotranspiration and dryness index in the East African highlands using MODIS and SEVIRI data. Hydrol. Earth Syst. Sci. 2011, 15, 163–170. [Google Scholar] [CrossRef]
  6. Fader, M.; Shi, S.; von Bloh, W.; Bondeau, A.; Cramer, W. Mediterranean irrigation under climate change: More efficient irrigation needed to compensate increases in irrigation water requirements. Hydrol. Earth Syst. Sci. Discuss. 2015, 12, 8459–8504. [Google Scholar] [CrossRef]
  7. Grouillet, B.; Fabre, J.; Ruelland, D.; Dezetter, A. Historical reconstruction and 2050 projections of water demand under anthropogenic and climate changes in two contrasted Mediterranean catchments. J. Hydrol. 2015, 522, 684–696. [Google Scholar] [CrossRef]
  8. Kingston, D.G.; Todd, M.C.; Taylor, R.G.; Thompson, J.R.; Arnell, N.W. Uncertainty in the estimation of potential evapotranspiration under climate change. Geophys. Res. Lett. 2009, 36, L20403. [Google Scholar] [CrossRef]
  9. Glenn, E.P.; Huete, A.R.; Nagler, P.L.; Hirschboeck, K.K.; Brown, P. Integrating remote sensing and ground methods to estimate evapotranspiration. Crit. Rev. Plant Sci. 2007, 26, 139–168. [Google Scholar] [CrossRef]
  10. Petropoulos, G.P.; Ireland, G.; Cass, A.; Srivastava, P.K. Performance assessment of the SEVIRI evapotranspiration operational product: Results over diverse Mediterranean ecosystems. IEEE Sens. J. 2015, 15, 3412–3423. [Google Scholar] [CrossRef]
  11. Allen, R.G.; Pereira, L.S.; Raes, D.; Smith, M. Crop Evapotranspiration—Guidelines for Computing Crop Water Requirements—FAO Irrigation and Drainage Paper 56; FAO—Food and Agriculture Organization of the United Nations: Rome, Italy, 1998. [Google Scholar]
  12. Cammalleri, C.; Anderson, M.C.; Ciraolo, G.; D’Urso, G.; Kustas, W.P.; La Loggia, G. Applications of a remote sensing-based two-source energy balance algorithm for mapping surface fluxes without in situ air temperature observations. Remote Sens. Environ. 2012, 124, 502–515. [Google Scholar] [CrossRef]
  13. Senay, G.B.; Bohms, S.; Verdin, J.P. Remote sensing of evapotranspiration for operational drought monitoring using principles of water and energy balance. In Remote Sensing of Drought: Innovative Monitoring Approaches; Wardlow, B.D., Anderson, M.C., Verdin, J.P., Eds.; Taylor and Francis Group, CRC Press: Boca Raton, FL, USA, 2012; pp. 123–144. [Google Scholar]
  14. Marshall, M.; Tu, K.; Funk, C.; Michaelsen, J.; Williams, P.; Williams, C.; Ardö, J.; Boucher, M.; Cappelaere, B.; de Grandcourt, A.; et al. Improving operational land surface model canopy evapotranspiration in Africa using a direct remote sensing approach. Hydrol. Earth Syst. Sci. 2013, 17, 1079–1091. [Google Scholar] [CrossRef]
  15. Mueller, B.; Seneviratne, S.I.; Jimenez, C.; Corti, T.; Hirschi, M.; Balsamo, G.; Ciais, P.; Dirmeyer, P.; Fisher, J.B.; Guo, Z.; et al. Evaluation of global observations-based evapotranspiration datasets and IPCC AR4 simulations. Geophys. Res. Lett. 2011, 38, L06402. [Google Scholar] [CrossRef]
  16. Li, Z.-L.; Tang, R.; Wan, Z.; Bi, Y.; Zhou, C.; Tang, B.; Yan, G.; Zhang, X. A review of current methodologies for regional evapotranspiration estimation from remotely sensed data. Sensors 2009, 9, 3801–3853. [Google Scholar] [CrossRef] [PubMed]
  17. Ishak, A.M.; Remesan, R.; Srivastava, P.K.; Islam, T.; Han, D. Error correction modelling of wind speed through hydro-meteorological parameters and mesoscale model: A hybrid approach. Water Resour. Manag. 2013, 27, 1–23. [Google Scholar] [CrossRef]
  18. Srivastava, P.K.; Han, D.; Rico-Ramirez, M.A.; Al-Shrafany, D.; Islam, T. Comparative assessment of evapotranspiration derived from NCEP and ECMWF global datasets through weather research and forecasting model. Atmos. Sci. Lett. 2013, 14, 118–125. [Google Scholar] [CrossRef]
  19. Cristóbal, J.; Anderson, M.C. Validation of a meteosat second generation solar radiation dataset over the northeastern Iberian Peninsula. Hydrol. Earth Syst. Sci. 2013, 17, 163–175. [Google Scholar] [CrossRef]
  20. Ghilain, N.; Arboleda, A.; Gellens-Meulenberghs, F. Evapotranspiration modelling at large scale using near-real time MSG SEVIRI derived data. Hydrol. Earth Syst. Sci. 2011, 15, 771–786. [Google Scholar] [CrossRef]
  21. Mu, Q.; Heinsch, F.A.; Zhao, M.; Running, S.W. Development of a global evapotranspiration algorithm based on MODIS and global meteorology data. Remote Sens. Environ. 2007, 111, 519–536. [Google Scholar] [CrossRef]
  22. Maselli, F.; Papale, D.; Chiesi, M.; Matteucci, G.; Angeli, L.; Raschi, A.; Seufert, G. Operational monitoring of daily evapotranspiration by the combination of MODIS NDVI and ground meteorological data: Application and evaluation in Central Italy. Remote Sens. Environ. 2014, 152, 279–290. [Google Scholar] [CrossRef]
  23. Vossen, P. Olive oil: History, production, and characteristics of the world’s classic oils. Hortic. Sci. 2007, 42, 1093–1100. [Google Scholar]
  24. Chiraz, M.C. Growth of young olive trees: Water requirements in relation to canopy and root development. Am. J. Plant Sci. 2013, 4, 1316–1344. [Google Scholar] [CrossRef]
  25. Rallo, G.; Agnese, C.; Minacapilli, M.; Provenzano, G. Assessing AQUACROP water stress function to evaluate the transpiration reductions of olive mature tree. Ital. J. Agrometeorol. 2012, 17, 21–28. [Google Scholar]
  26. Centritto, M.; Loreto, F.; Massacci, A.; Pietrini, F.; Villani, M.C.; Zacchini, M. Improved growth and water use efficiency of cherry saplings under reduced light intensity. Ecol. Res. 2000, 15, 385–392. [Google Scholar] [CrossRef]
  27. Tognetti, R.; Giovannelli, A.; Lavini, A.; Morelli, G.; Fragnito, F.; D’Andria, R. Assessing environmental controls over conductances through the soil-plant-atmosphere continuum in an experimental olive tree plantation of southern Italy. Agric. For. Meteorol. 2009, 149, 1229–1243. [Google Scholar] [CrossRef]
  28. Marino, G.; Pallozzi, E.; Cocozza, C.; Tognetti, R.; Giovannelli, A.; Cantini, C.; Centritto, M. Assessing gas exchange, sap flow and water relations using tree canopy spectral reflectance indices in irrigated and rainfed Olea europaea L. Environ. Exp. Bot. 2014, 99, 43–52. [Google Scholar] [CrossRef]
  29. Cocozza, C.; Giovannelli, A.; Lasserre, B.; Cantini, C.; Lombardi, F.; Tognetti, R. A novel mathematical procedure to interpret the stem radius variation in olive trees. Agric. For. Meteorol. 2012, 161, 80–93. [Google Scholar] [CrossRef]
  30. Thornton, P.E.; Running, S.W.; White, M.A. Generating surfaces of daily meteorological variables over large regions of complex terrain. J. Hydrol. 1997, 190, 214–251. [Google Scholar] [CrossRef]
  31. Granier, A. A new method of sap flow measurement in tree stems. Ann. For. Sci. 1985, 42, 193–200. [Google Scholar] [CrossRef]
  32. Cocozza, C.; Marino, G.; Giovannelli, A.; Cantini, C.; Centritto, M.; Tognetti, R. Simultaneous measurements of stem radius variation and sap flux density reveal synchronization of water storage and transpiration dynamics in olive trees. Ecohydrology 2015, 8, 33–45. [Google Scholar] [CrossRef]
  33. Cobos, D. Measurement volume of Decagon volumetric water content sensors. In Application Note Decagon Devices; Decagon Devices Inc.: Pullman, WA, USA, 2015; pp. 1–4. [Google Scholar]
  34. Spelman, D.; Kinzli, K.; Kunberger, T. Calibration of the 10HS soil moisture sensor for southwest Florida agricultural soils. J. Irrig. Drain. Eng. 2013, 139, 965–971. [Google Scholar] [CrossRef]
  35. Palomo, M.J.; Moreno, F.; Fernandez, J.E.; Diaz-Espejo, A.; Giron, I.F. Determining water consumption in olive orchards using the water balance approach. Agric. Water Manag. 2002, 55, 15–35. [Google Scholar] [CrossRef]
  36. Martínez-Cob, A.; Faci, J.M. Evapotranspiration of an hedge-pruned olive orchard in a semiarid area of NE Spain. Agric. Water Manag. 2010, 97, 410–418. [Google Scholar] [CrossRef] [Green Version]
  37. Ojha, T.; Misra, S.; Raghuwanshi, N.S. Wireless sensor networks for agriculture: The state-of-the-art in practice and future challenges. Comput. Electron. Agric. 2015, 118, 66–84. [Google Scholar] [CrossRef]
  38. Hargreaves, G.H.; Samani, Z.A. Reference crop evapotranspiration from temperature. Trans. ASAE 1985, 1, 96–99. [Google Scholar] [CrossRef]
  39. Todorovic, M.; Karic, B.; Pereira, L.S. Reference evapotranspiration estimate with limited weather data across a range of Mediterranean climates. J. Hydrol. 2013, 481, 166–176. [Google Scholar] [CrossRef]
  40. Saxton, K.E.; Rawls, W.J.; Romberger, J.S.; Papendick, R.I. Estimating generalized soil water characteristics from texture. Soil Sci. Soc. Am. J. 1986, 50, 1031–1035. [Google Scholar] [CrossRef]
  41. Maselli, F.; Papale, D.; Puletti, N.; Chirici, G.; Corona, P. Combining remote sensing and ancillary data to monitor the gross productivity of water-limited forest ecosystems. Remote Sens. Environ. 2009, 113, 657–667. [Google Scholar] [CrossRef] [Green Version]
  42. Maselli, F. Definition of spatially variable spectral end-members by locally calibrated multivariate regression analyses. Remote Sens. Environ. 2001, 75, 29–38. [Google Scholar] [CrossRef]
  43. Maselli, F.; Chiesi, M.; Brilli, L.; Moriondo, M. Simulation of olive fruit yield in Tuscany through the integration of remote sensing and ground data. Ecol. Model. 2012, 244, 1–12. [Google Scholar] [CrossRef]
  44. Gutman, G.; Ignatov, A. The derivation of the green vegetation fraction from NOAA/AVHRR data for use in numerical weather prediction models. Int. J. Remote Sens. 1998, 19, 1533–1543. [Google Scholar] [CrossRef]
  45. Running, S.W.; Hunt, E.R. Generalization of a forest ecosystem process model for other biomes, BIOME-BGC, and an application for global-scale models. In Scaling Physiological Processes: Leaf to Globe; Ehleringer, J.R., Field, C.B., Eds.; Academic Press: San Diego, CA, USA, 1993; pp. 141–158. [Google Scholar]
  46. Gardin, L.; Battista, P.; Bottai, L.; Chiesi, M.; Fibbi, L.; Rapi, B.; Romani, M.; Maselli, F. Improved simulation of soil water content by the combination of ground and remote sensing data. Eur. J. Remote Sens. 2014, 47, 739–751. [Google Scholar] [CrossRef]
  47. Liao, L.; Song, J.; Wang, J.; Xiao, Z.; Wang, J. Bayesian method for building frequent Landsat-like NDVI datasets by integrating MODIS and Landsat NDVI. Remote Sens. 2016, 8, 452. [Google Scholar] [CrossRef]
  48. Hargreaves, G.H.; Allen, R.G. History and evaluation of Hargreaves evapotranspiration equation. J. Irrig. Drain. Eng. 2003, 129, 53–63. [Google Scholar] [CrossRef]
  49. Nandagiri, L.; Kovoor, G.M. Sensitivity of the Food and Agriculture Organization Penman-Monteith evapotranspiration estimates to alternative procedures for estimation of parameters. J. Irrig. Drain. Eng. 2006, 131, 238–248. [Google Scholar] [CrossRef]
  50. Raziei, T.; Pereira, L. Estimation of ETo with Hargreaves-Samani and FAO-PM temperature methods for a wide range of climate in Iran. Agric. Water Manag. 2013, 121, 1–18. [Google Scholar] [CrossRef]
  51. Tabari, H. Evaluation of reference crop evapotranspiration equation in various climates. Water Res. Manag. 2010, 24, 2311–2337. [Google Scholar] [CrossRef]
  52. Martí, P.; Zarzo, M.; Vanderlinden, K.; Girona, J. Parametric expressions for the adjusted Hargreaves coefficient in Eastern Spain. J. Hydrol. 2015, 529, 1713–1724. [Google Scholar] [CrossRef]
  53. Thornton, P.E.; Hasenauer, H.; White, M.A. Simultaneous estimation of daily solar radiation and humidity from observed temperature and precipitation: An application over complex terrain in Austria. Agric. For. Meteorol. 2000, 104, 255–271. [Google Scholar] [CrossRef]
  54. Hewitt, A.E. Predictive modelling in soil survey. Soils Fertil. 1993, 56, 305–314. [Google Scholar]
Figure 1. Landsat OLI frame of Tuscany taken on 16 June 2013 with position of the study area; the top left box shows the position of the frame in Italy, while the top right box shows a Google Earth IKONOS pan-fused image of the examined olive orchard taken on 5 June 2013.
Remotesensing 08 00731 g001
Figure 2. Experimental olive orchard.
Remotesensing 08 00731 g002
Figure 3. Daily rainfall, potential evapotranspiration and Cws derived from the interpolated meteorological data during 2013 (* and ** correspond to rainfall of 98 and 47 mm, respectively); ET0 is computed by applying the HS method, while Cws is obtained from a simplified site water budget as described in [22,41].
Remotesensing 08 00731 g003
Figure 4. NDVI values of 2013 obtained from MODIS and OLI data ((MODIS_Orig and OLI_Orig, respectively) and integrating OLI with the original MODIS data (MODIS+OLI) and the MODIS endmembers of olive trees and grasses (MODIS_EM1+OLI and MODIS_EM2+OLI, respectively) (see text for details).
Remotesensing 08 00731 g004
Figure 5. Daily olive tree transpiration estimated by the NDVI-Cws method driven by the different NDVI multitemporal profiles (the data series are the same as in Figure 4, see text for details).
Remotesensing 08 00731 g005
Figure 6. Daily olive tree transpiration measured by sap-flow (average and standard error from the four sampled trees) and estimated by the NDVI-Cws method driven by the olive tree NDVI endmembers. Data are collected, from 19 April to 8 August 2013 (** = highly significant correlation, p < 0.01).
Remotesensing 08 00731 g006
Figure 7. Daily fractional SWC (dimensionless) measured at 30 cm depth and estimated by driving Equation (3) with the different NDVI values considered (see text for details) (** = highly significant correlation, p < 0.01).
Remotesensing 08 00731 g007
Table 1. Accuracy statistics of the daily olive transpiration estimates obtained applying the NDVI-Cws method with different NDVI datasets and BIOME-BGC (see text for details) (** = highly significant correlation, p < 0.01).
Data/ModelrRMSE (mm·day−1)MBE (mm·day−1)
MODIS_Orig0.269 **1.09−0.89
MODIS+OLI0.415 **0.87−0.49
BIOME-BGC0.548 **0.91−0.41

