Article

The Variations and Trends of MODIS C5 & C6 Products’ Errors in the Recent Decade over the Background and Urban Areas of North China

1
Key Laboratory for Aerosol-Cloud-Precipitation of China Meteorological Administration, School of Atmospheric Physics, Collaborative Innovation Center on Forecast and Evaluation of Meteorological Disasters, Nanjing University of Information Science and Technology, Nanjing 210044, Jiangsu, China
2
LAPC, Institute of Atmospheric Physics, Chinese Academy of Sciences, Beijing 100029, China
*
Authors to whom correspondence should be addressed.
Remote Sens. 2016, 8(9), 754; https://doi.org/10.3390/rs8090754
Submission received: 20 June 2016 / Revised: 22 August 2016 / Accepted: 8 September 2016 / Published: 13 September 2016
(This article belongs to the Special Issue Uncertainties in Remote Sensing)

Abstract

:
With ten-year (2004–2013) ground-based observations of Beijing Forest (BJF) and Beijing City (BJC) sites in North China, we validated the high-quality MODerate resolution Imaging Spectroradiometer (MODIS) Collection 5 (C5) and Collection 6 (C6) Aerosol Optical Depth (AOD) products’ precision and discussed the sensors degradation issues. The annual mean AOD and Angstrom exponent (α) were 0.20 ± 0.02 and 0.83 ± 0.15 in the background over the past ten years, and they were 0.59 ± 0.07 and 1.13 ± 0.08 in the urban, respectively. Ground-based AOD had both slightly declining trends, with variations of 0.023 and 0.057 over the past decade in the background and urban, respectively. There were large differences among the eight kinds of MODIS AOD products (Terra vs. Aqua, C5 vs. C6, DT (Deep Target) vs. DB (Deep Blue), and DTDB in the background and urban areas), but all the products’ monthly errors had larger variations in the spring and summer, and smaller ones in the autumn and winter. In the background, more than 62% of DT matchups for C5 and C6 products were within NASA’s expected error (EE) envelope. In the urban, 69%~72% of C6 DB retrievals were falling within EE envelope. The new dataset named C6 DTDB had better performance in the background, whereas it overestimated by 37%~41% in the urban caused by surface reflectivity estimation error. The range of monthly average error varied from −0.21 to 0.28 in the background and from −0.63 to 0.48 in the urban. From the background to the urban areas, the retrieval errors of Terra and Aqua had slightly increased by 0.0023~0.0158 and 0.0011~0.0124 per year, respectively, which implied that the two MODIS instruments had degraded slowly.

Graphical Abstract

1. Introduction

As we all know, aerosols are important components in the Earth system [1], and have significant influences on global climate [2], air quality [3] and human health [4] through the direct and indirect radiation forcing [5,6]. Aerosol Optical Depth (AOD) and the Angstrom exponent (α) are both important aerosol optical property parameters, generally, they have been used to reflect aerosol column loading and particle size, respectively [7,8]. Recently, satellite remote sensing and ground-based observations have been widely applied to monitor aerosol spatial-temporal distributions on both the global and local scales [9]. The twin MODerate resolution Imaging Spectroradiometer (MODIS) aboard the Terra and Aqua satellites has operated over 10 years since 1999 and 2002, crossing the equator at a local solar time of approximately 10:30 a.m. and 1:30 p.m., respectively [10]. Although aerosol retrieval algorithms are identical for Terra and Aqua MODIS radiation data, the aerosol products of the two sensors are kind of different due to the disparities in spectral channels, samples selection time, radiometric calibration and other factors [11,12,13]. There are two separate types of MODIS AOD retrieval algorithms over land, one is Dark Target (DT) algorithm, which retrieves over dark land [14,15,16,17], another one is Deep Blue (DB) algorithm, which is developed initially to work on bright surfaces [18,19,20]. When the retrieval algorithms were improved, there was a new generation of MODIS product. In the latest MODIS Collection 6 (C6) product, DT algorithm, is based on the same methodology as Collection 5 (C5) DT but with some important modifications such as updating cloud mask to retrieve aerosol product in heavy smoke conditions, adjusting the aerosol model which is a function of seasons and locations, revising Quality Assurance (QA) logic and so on. DB algorithm also modifies the aerosol models, clouding screening, etc., but the main update is expanding the coverage to all cloud-free and snow-free surfaces; and a new merged dataset named C6 DTDB, which consists of DT and DB retrievals, and their average values in order to provide a more complete data product than the individual algorithm [16,21,22].
Since MODIS aerosol products are retrieved from sensor radiation observations, there are inevitably systematic errors mainly caused by the assumptions of Earth’s surface and aerosol types, additionally, the sensor aging over time can also lead to the certain uncertainties of the aerosol products [16,23]. However, the uncertainty of ground-based observations such as Aerosol Robotic Network (AERONET) measurements is only about 0.01~0.02, thus they are widely used as one of the ground-truth observations to validate the MODIS retrieval algorithms [24,25]. In the global validation of the latest C6 AOD products, DT algorithm has much improvement in the low-AOD bins, while the systematic biases are notable in high-AOD conditions; the data volume of C6 DB retrievals increased markedly because of the expanded coverage over bright and dark land surfaces, and DB algorithm performs better over vegetated regions than the complicated ones; C6 DTDB dataset not only covered over both dark and bright surfaces, but also modified the AOD retrievals as expected [16,17,21,22].
Recently, the haze days and air pollution have markedly increased over North China [26,27], where aerosol properties are extremely complicated and influenced by both anthropogenic activities and natural processes [28]. The validations of MODIS AOD in China were mostly discussed for short periods of time, and they seldom mentioned the long-term error variations and trends, which are related to the sensor degradation issues [29,30,31]. In this study, we compared the typical aerosol distributions and variations in background and urban areas of North China, evaluated the high-quality MODIS C5 and C6 AOD products, and discussed the sensor degradation issues, during nearly ten years (from August 2004 to December 2013).

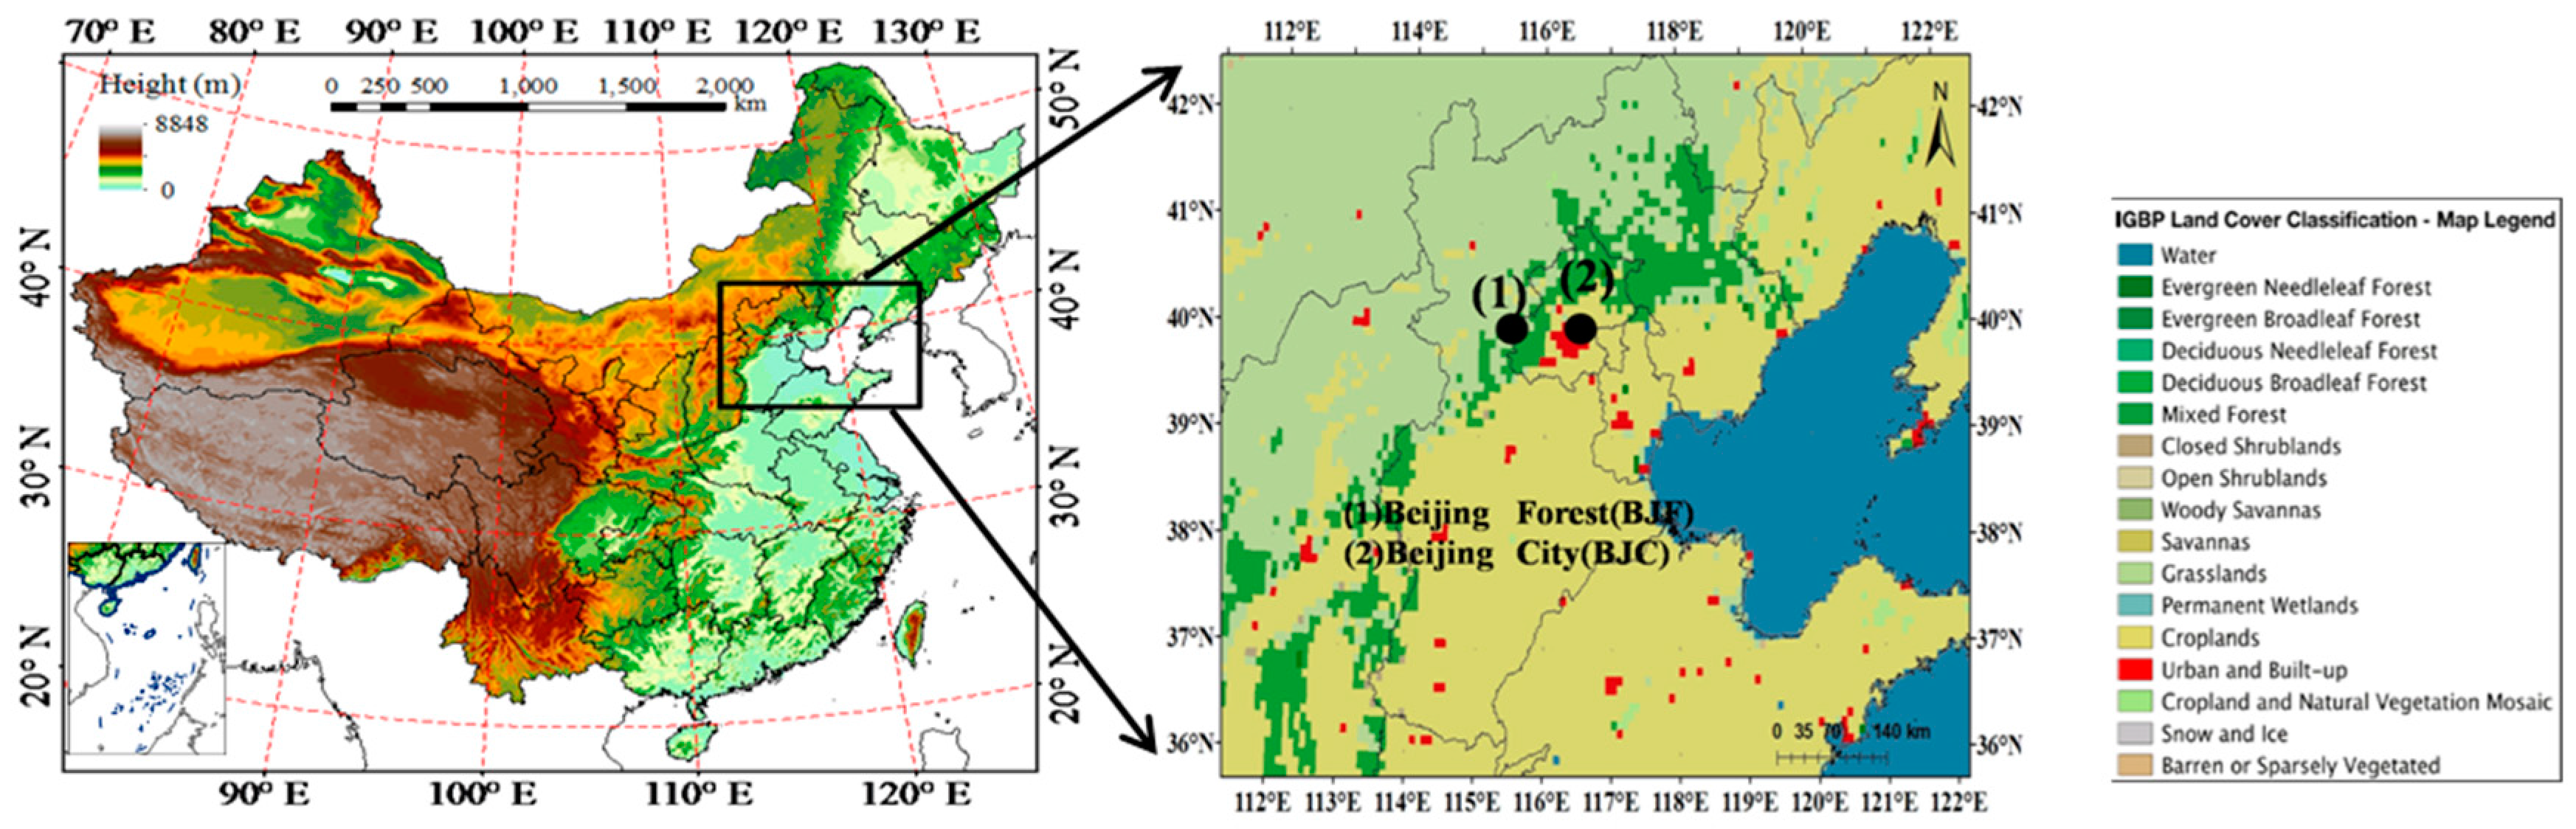
2. Materials and Methods

2.1. The MODIS Product

In order to monitor Earth’s systems, including atmospheric aerosols, NASA’s Earth Observing System (EOS) program launched the Terra and Aqua satellites on 18 December 1999 and 4 May 2002, respectively [10,13]. Two MODerate resolution Imaging Spectroradiometers (MODIS) mounted on the satellites provide a global detection every one or two days, by using 36 bands in 0.4~14 μm, a 2330 km wide swath, and three different spatial resolutions of 250 m, 500 m and 1 km [16]. The basic principle of retrieving AOD products is to find the optimal precalculated top of atmosphere (TOA) radiance data, which has the smallest fitting error with the observed ones. The Deep Target (DT) algorithm retrieves aerosol product in red (0.66 μm), blue (0.47 μm) and shortwave IR (2.12 μm) channels over land. Firstly, the pixels are filtered out through gas correcting (for H2O, O3 and CO2) and discarding clouds, snow, water, the darkest 20% and the brightest 50% ones, and the remaining part is thought to properly represent the initial conditions which can retrieve aerosol properties. They are then averaged in resolution of 10 km × 10 km from the original 500 m × 500 m. Then the final observed TOA reflectance field is used to match the values within Look-up-table (LUT). The LUT can represent aerosol optical conditions, and is made up of precalculated spectrally TOA reflectance, aerosol model types, surface reflectance, etc. The surfaces reflectance is a dynamic function related to regions, seasons, scattering angle and normalized difference vegetation index (NDVI). Additionally, there are five aerosol types over land, which consist of a mixture of fine and coarse models, determined by season and location [8,17,32]. The Deep Blue (DB) algorithm is initially developed to retrieve aerosol properties over bright surface in blue channels (0.412, 0.47 and 0.65 μm), where the surface reflectance is much smaller than that for longer channels. Similarly, the pixels of clouds, snow and ice surfaces need to be eliminated, but DB algorithm retrieves aerosol at a resolution of 1 km × 1 km and then aggregates to nominal 10 km × 10 km, which is different from DT algorithm [18]. Compared to Collection 5 (C5) product, the newest Collection 6 (C6) products over land have mainly changed in: (a) updating the upstream products which act as the input data, including updating the radiometric calibration, geolocation and cloud mask; and (b) modifying the assumptions of aerosol model and surface reflectivity, correcting bugs in quality flags and so on [17]. Besides, in order to provide a more comprehensive AOD dataset and reduce the gap of land coverage, there is a new merged dataset in C6, shortly named C6 DTDB, which is simply constituted by DT and DB retrievals and their average values according to the NDVI product and Quality Assurance (QA) values of the region, described in detail by Levy et al. [17]. QA represents the quality of the MODIS retrievals, with QA = 3, 2, 1, 0, indicating progressively lower accuracy [16]. Here, MODIS AOD retrievals were collected from Collection 5.1 (C5.1) and Collection 6 (C6) products Level 2 geophysical products for Terra and Aqua satellites. Since Collection 5.1 is the same as Collection 5 adding the DB product, we use C5 to represent C5.1 for simplicity here. High-quality MODIS AOD retrievals are beneficial for scientific study [21,33], thus, we use high-quality datasets with QA (DT) = 3 and QA (DB) ≥ 2 over land [22], including C5 DT, C6 DT, C6 DB and C6 DTDB AOD products at 550 nm for both Terra and Aqua satellites, and the C5 DB is not involved due to the low-quality and deficient retrievals.

2.2. The CSHNET Data

The AERONET sites in China are sporadic and extremely short- of long-term observations, so in order to understand the spatial and temporal variations of aerosol optical properties in the region, the Chinese Sun Hazemeter Network (CSHNET) was established in 2004 and constituted by 25 stations across China. Moreover, the observations of CSHNET show a good agreement with AERONET, which has been validated by Xin et al. and Li et al. [34,35]. The CSHNET uses Hand-held LED hazemeters and Microtops II solar photometers and observes between 10:00 a.m. and 2:00 p.m. (Beijing time), which coincides with the satellite crossing time; the detailed instrument calibrations are described in Xin et al. [34]. The AOD at 550 nm is calculated by AOD at 650 nm and 500 nm with the log-log linear interpolation algorithm lnτ = alnλ + b, where τ is the AOD, and λ is the wavelength [24]. Since we used AOD at 550 nm of MODIS product and ground-observed data, the AOD represented AOD at 550 nm for simplicity throughout the study. The Angstrom exponent (α) is estimated by applying the AOD at three wavelengths (405 nm, 500 nm and 650 nm). α is related to the size of aerosol particles, with values usually between 0.0~2.0, for which larger values correspond to smaller aerosol particle sizes [7]. Because the MODIS Angstrom exponent products over land have no assured values [17], the Angstrom exponent is not validated here. We used two sites of CSHNET, namely, Beijing Forest (BJF) and Beijing City (BJC) to represent the typical background and urban aerosol distribution in Beijing region, respectively. Figure 1 shows the corresponding geographical locations. BJF is located at Donglingshan Mountain (39.97°N, 115.43°E, altitude of 1130 m), with a typical warm temperate semi-humid monsoon climate. BJC is located at the Institute of Atmospheric Physics (39.98°N, 116.37°E, altitude of 58 m) and is close to the northern third ring of Beijing.
We employed the spatio-temporal approach introduced by Icholu et al. [25], which averaged the MODIS retrievals in a square box of 50 km × 50 km with CSHNET stations in the middle. The valid matchups (CSHNET/MODIS AOD) required at least two measurements a day accompanied with a standard deviation less than 0.5. Moreover, to directly and clearly compare the performance of different MODIS retrieval algorithms, a unified Expected Error (EE) of ±(0.05 + 0.15τ) introduced by MODIS aerosol science team, was applied in this study, where τ was the ground-observed AOD [8,16,23].

3. Results

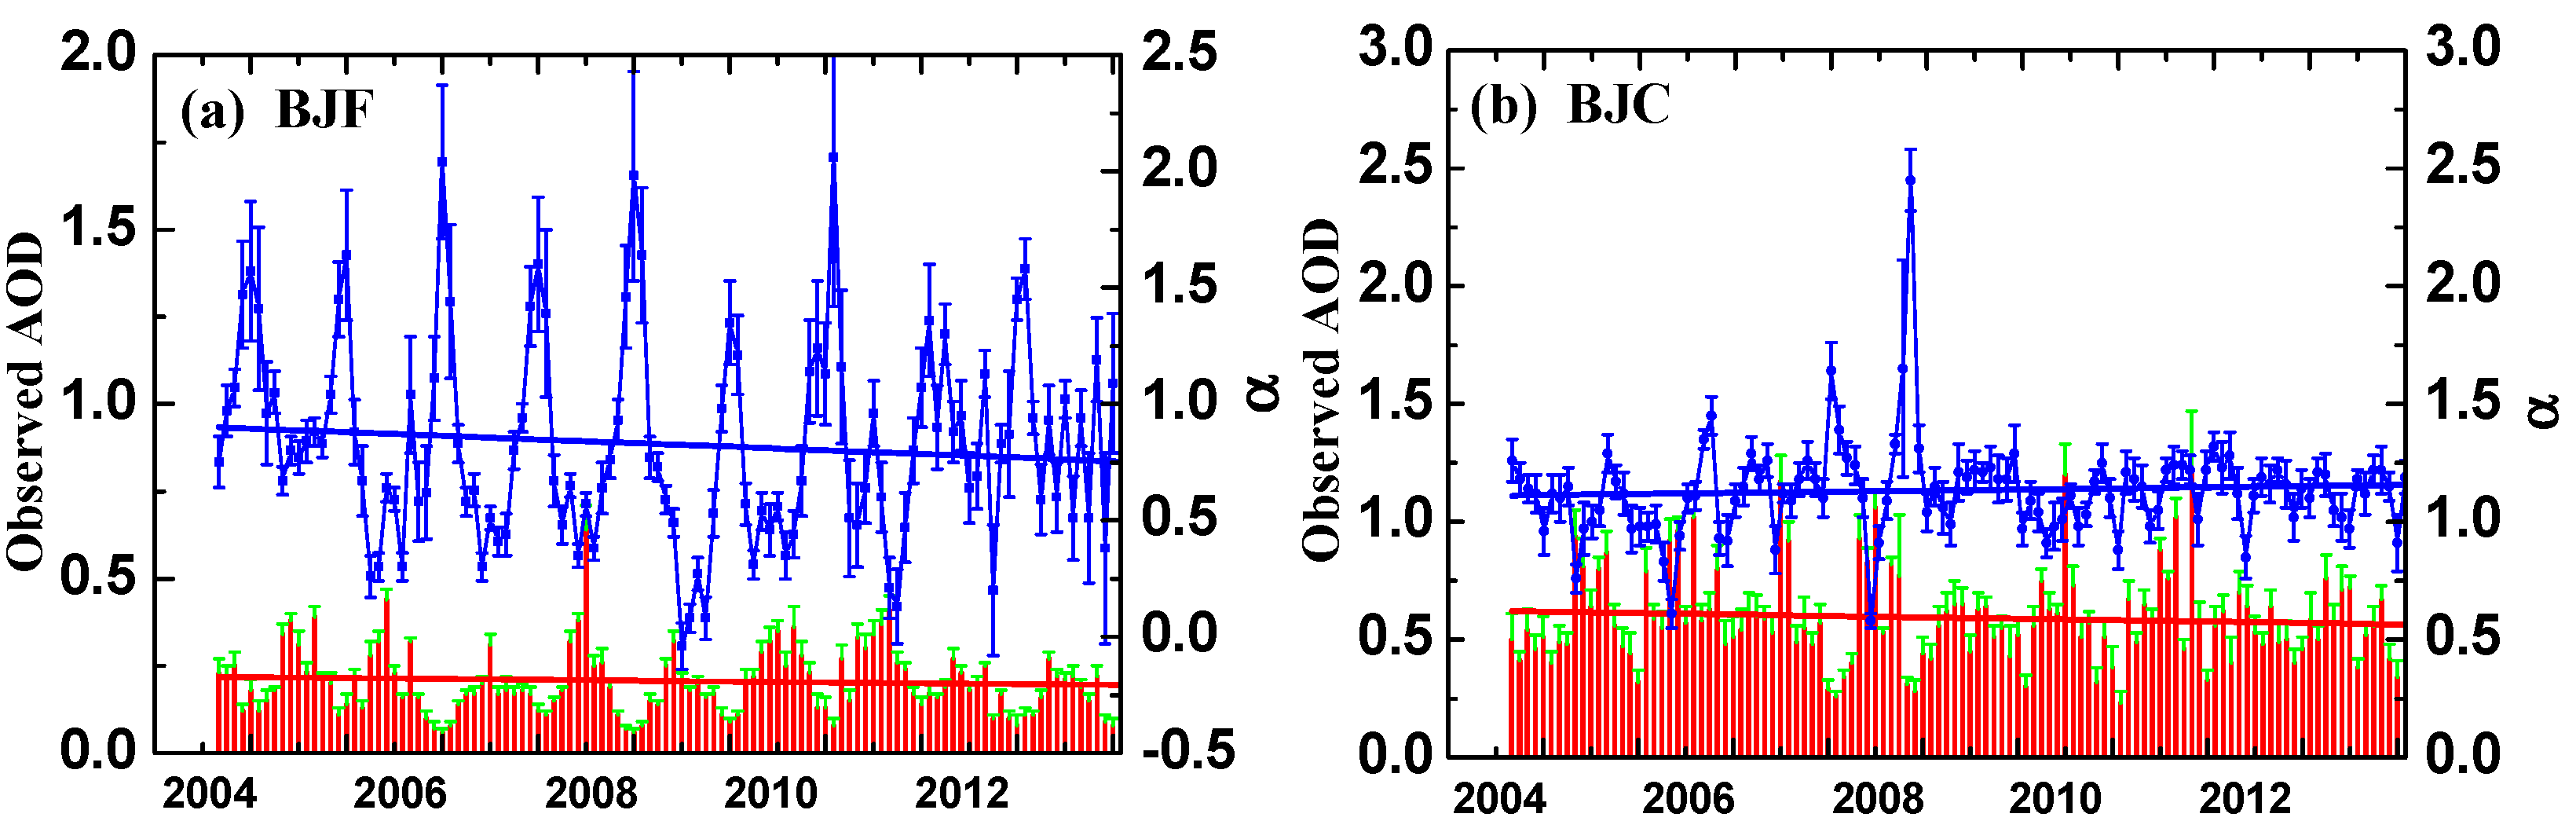
3.1. Aerosol Optical Properties at Background and Urban Sites

Figure 2 shows the monthly ground-based averaged AOD and α as well as their trend variations, from August 2004 to December 2013. The annual mean values of AOD and α at BJF were 0.20 ± 0.02 and 0.83 ± 0.15, respectively, whereas at BJC, they were 0.59 ± 0.07 and 1.13 ± 0.08, respectively. As we all know, atmospheric circulation varying and anthropogenic activities emission greatly influence aerosol concentrations in Eastern China [35,36]. In spring and summer (from March to August), the aerosol loading and particle size both increase notably, the maximum average AOD of 0.89 was found in summer and the minimum average α was −0.75 in spring, which is related to the dust aerosol transportation, local soil emission, and swelling effect that can lead to aerosol hygroscopic growth [35,37], whereas in autumn and winter (from September to February), both AOD and α have decreased, as shown in Figure 1, the minimum average AOD of 0.10 occurred in winter and the maximum α of 1.80 was found in autumn. On the one hand, smoke and soot particles from combustion of fossil fuels and biomass increase a lot in colder seasons due to heating supply, on the other hand, coarse-mode particles emission reduces because of the snow and ice coverage on the ground [34,38,39]. At BJF, AOD has slightly decreased by 0.023 over a decade, while α had an obvious decrease of 0.388 from 2004 to 2010, which was also proven by Xin et al. [40], but it has increased by 0.137 from 2011 to 2013. At BJC, AOD had a small decrease of 0.057 over the ten years, while α has distinctly increased by 0.213 from 2004 to 2008, and it showed a more stable increase of 0.018 from 2009 to 2013.

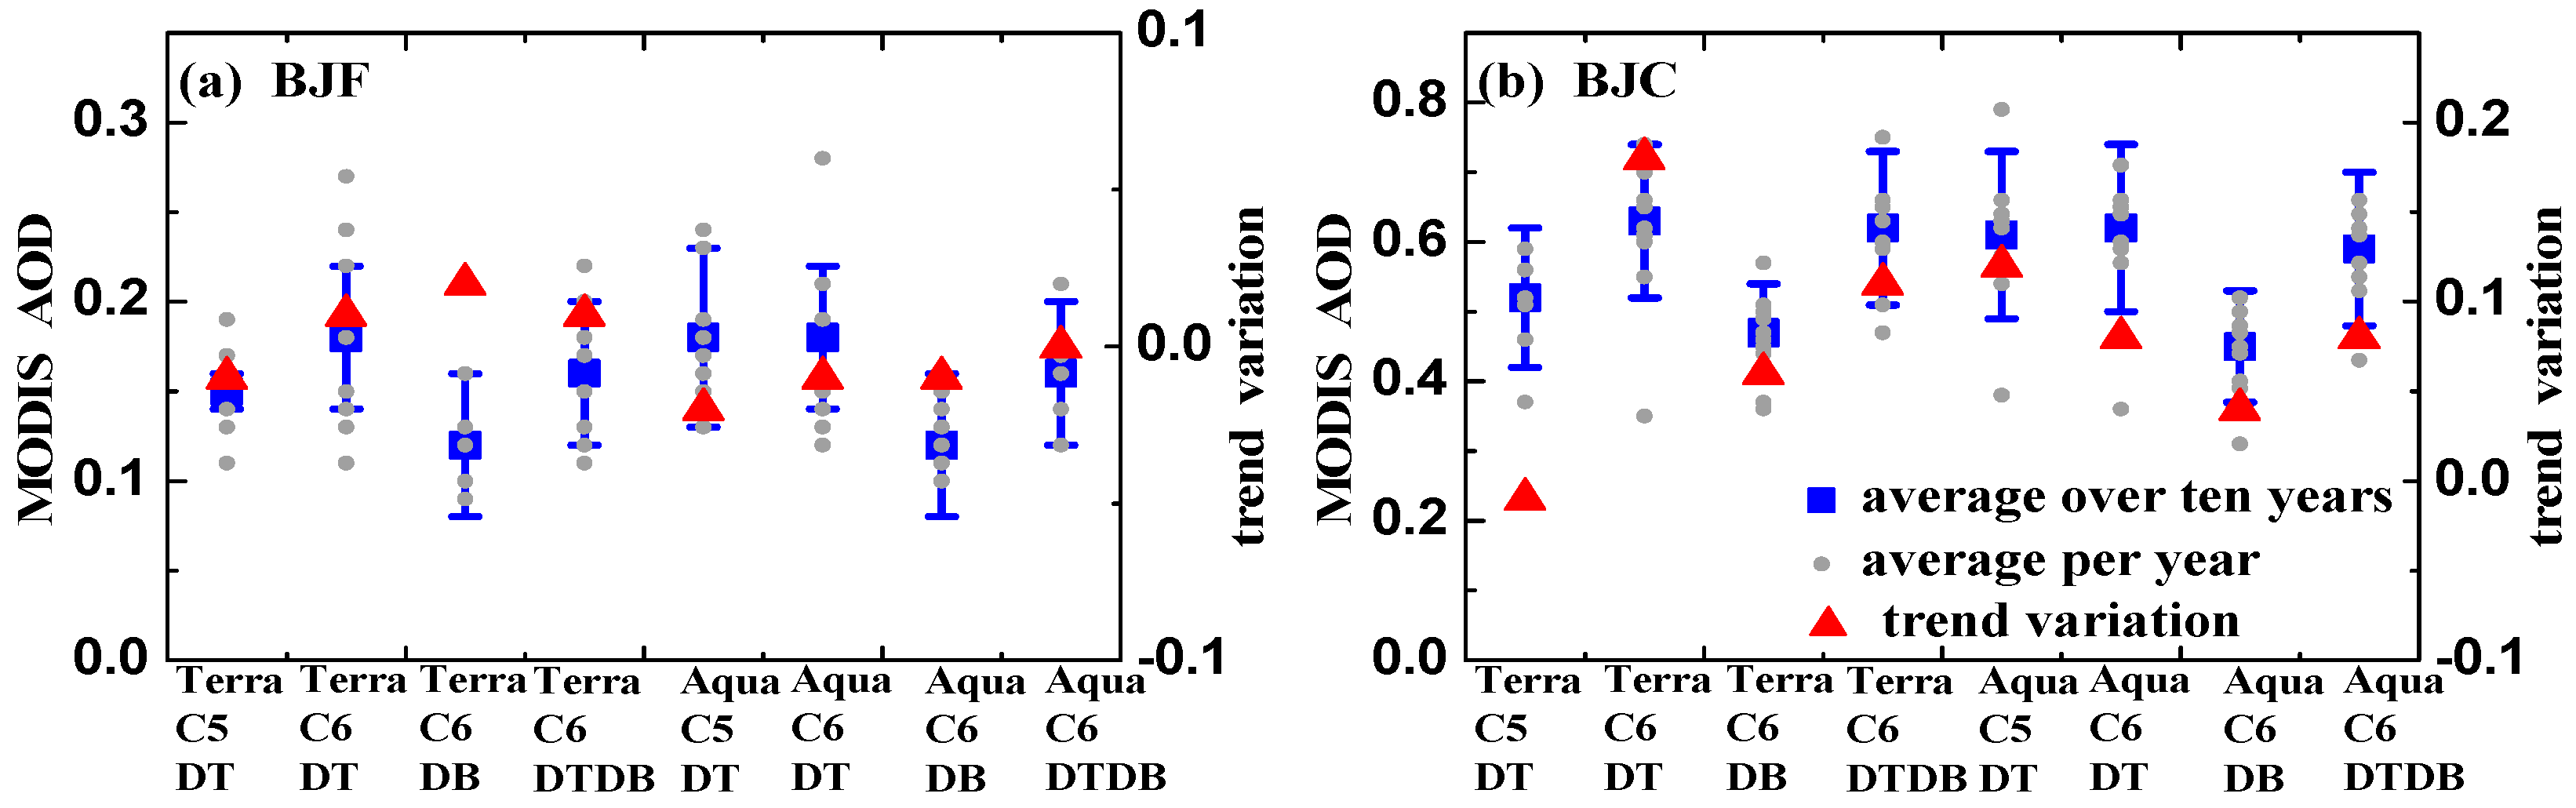
3.2. The Annual Average MODIS AOD at Background and Urban Sites

Figure 3 depicts the annual average MODIS AOD and their trend variations over ten years, including eight kinds of different AOD products for both Terra and Aqua satellites. At BJF, the annual average MODIS AOD during ten years was in the range of 0.12~0.18 for all the products we studied here, which was less than the ground-based ones of 0.20 shown above. Terra AOD showed an increase of 0.01~0.02 over ten years at BJF (excluding C5 DT for a decrease of 0.01); on the contrary, Aqua AOD showed a similar decreased trends with ground observations, with a range of 0~0.02 over ten years. At BJC, the annual average MODIS AOD during ten years had a wider range of 0.45~0.63, while neither Terra nor Aqua AOD products properly showed the decreased trends as discussed above, on the opposite, they had an increase of 0.04~0.18 (excluding C5 DT for a decrease of 0.01). Since there were large disparities from different retrieval algorithms, shown above for Terra and Aqua satellites, we need to deeply analyze their performance at the two typical sites.

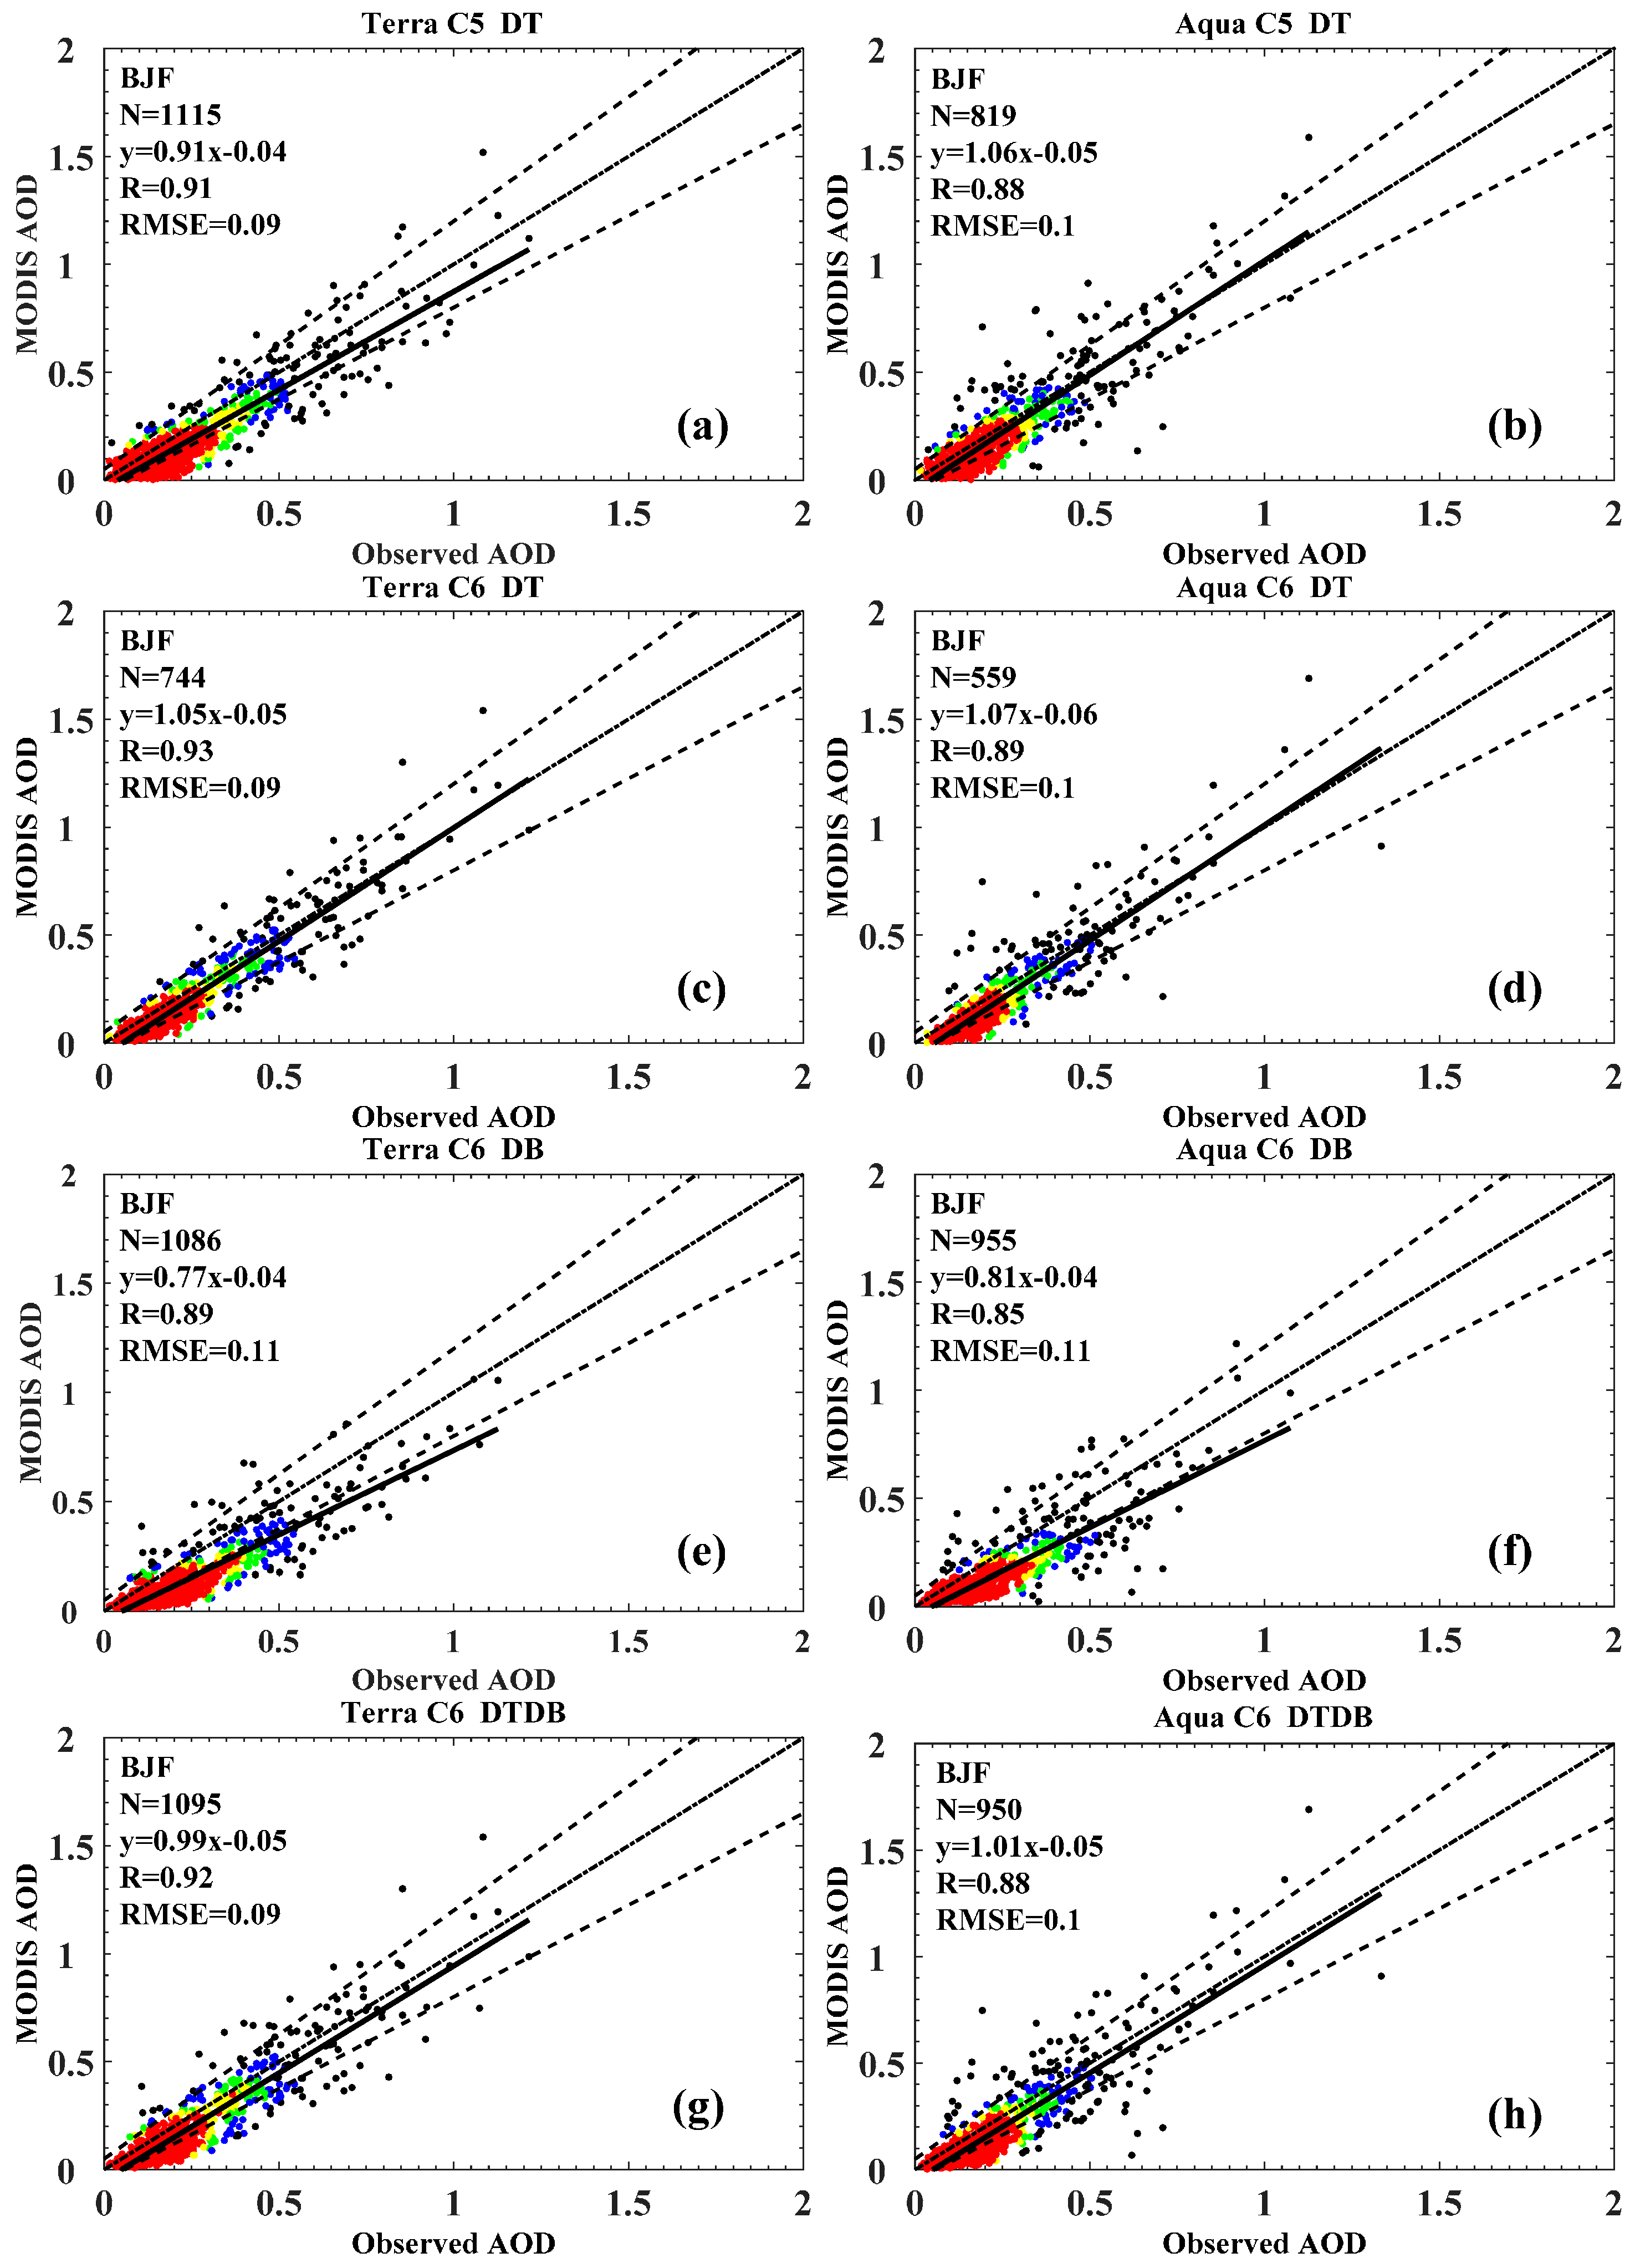
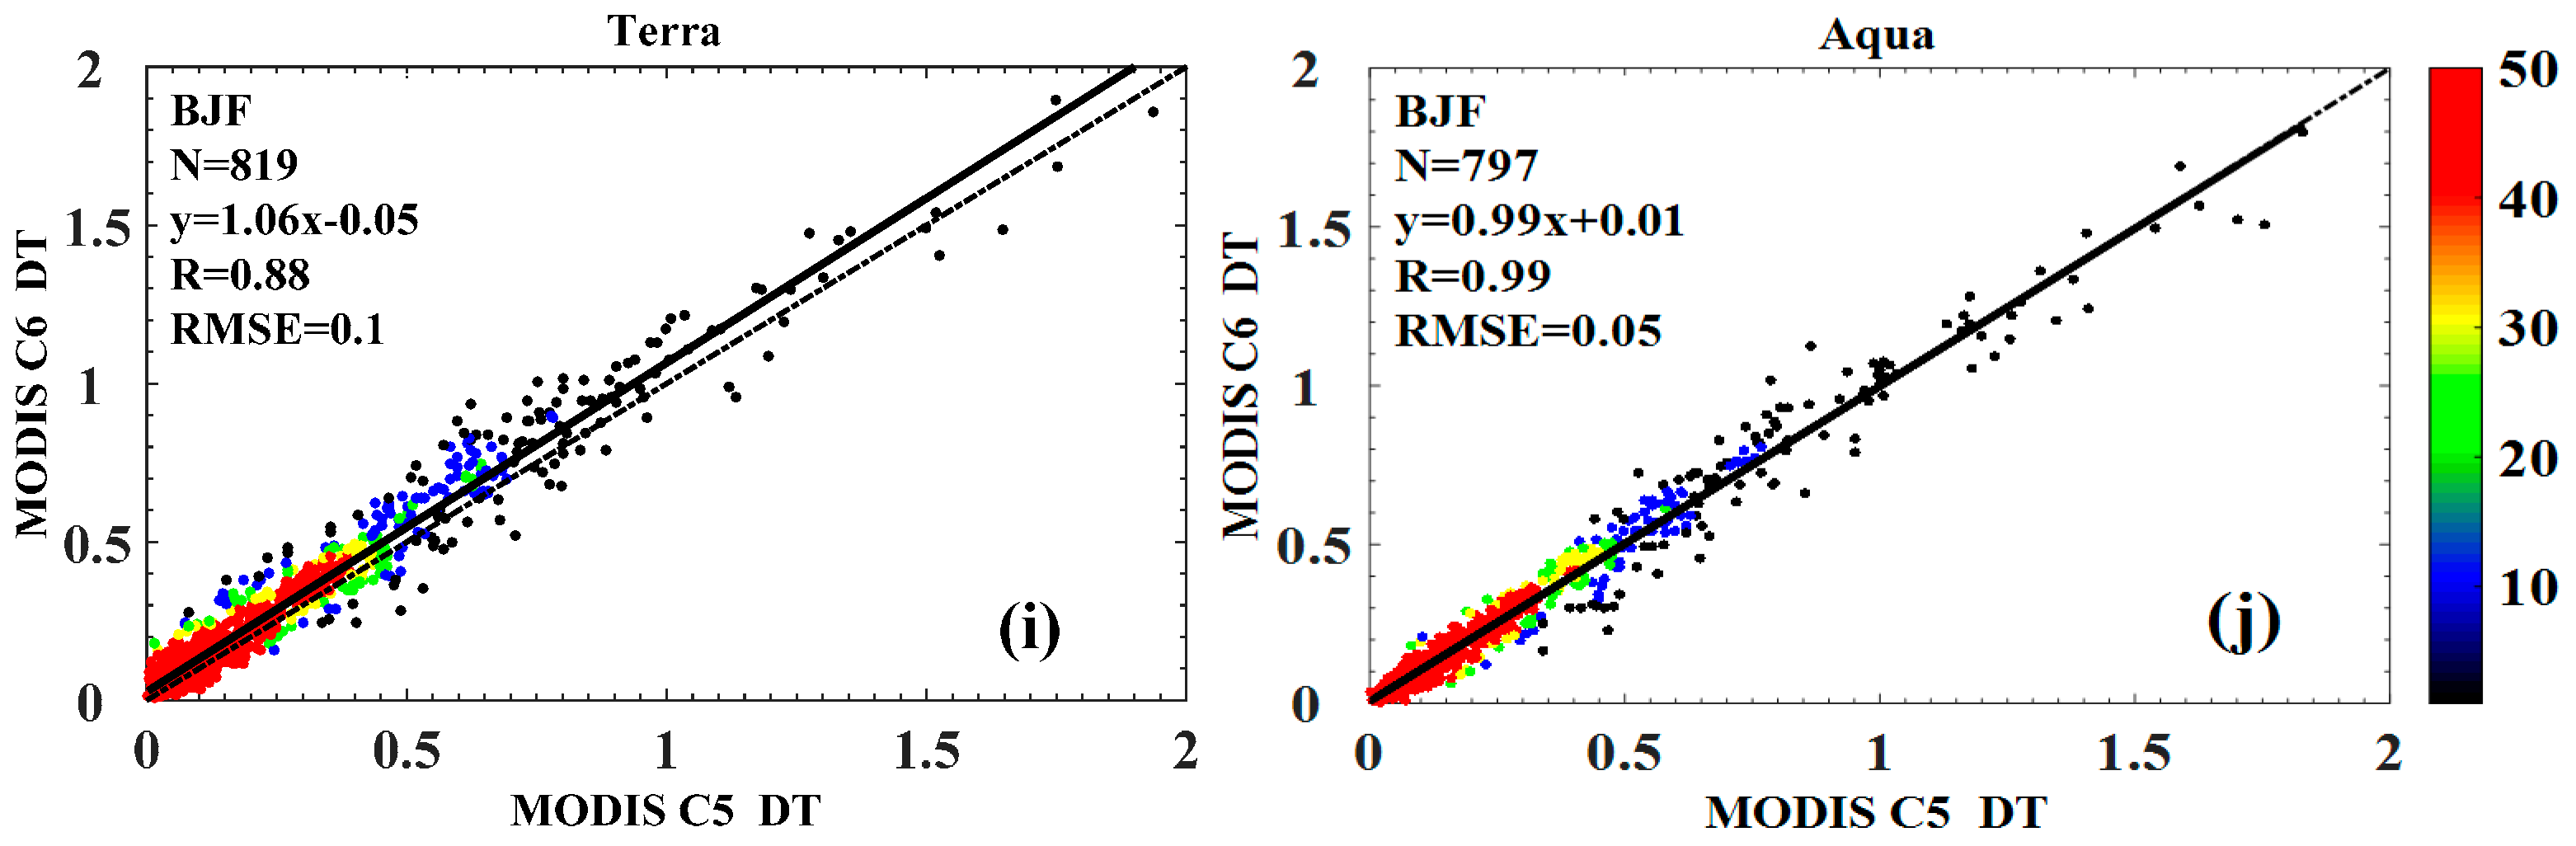
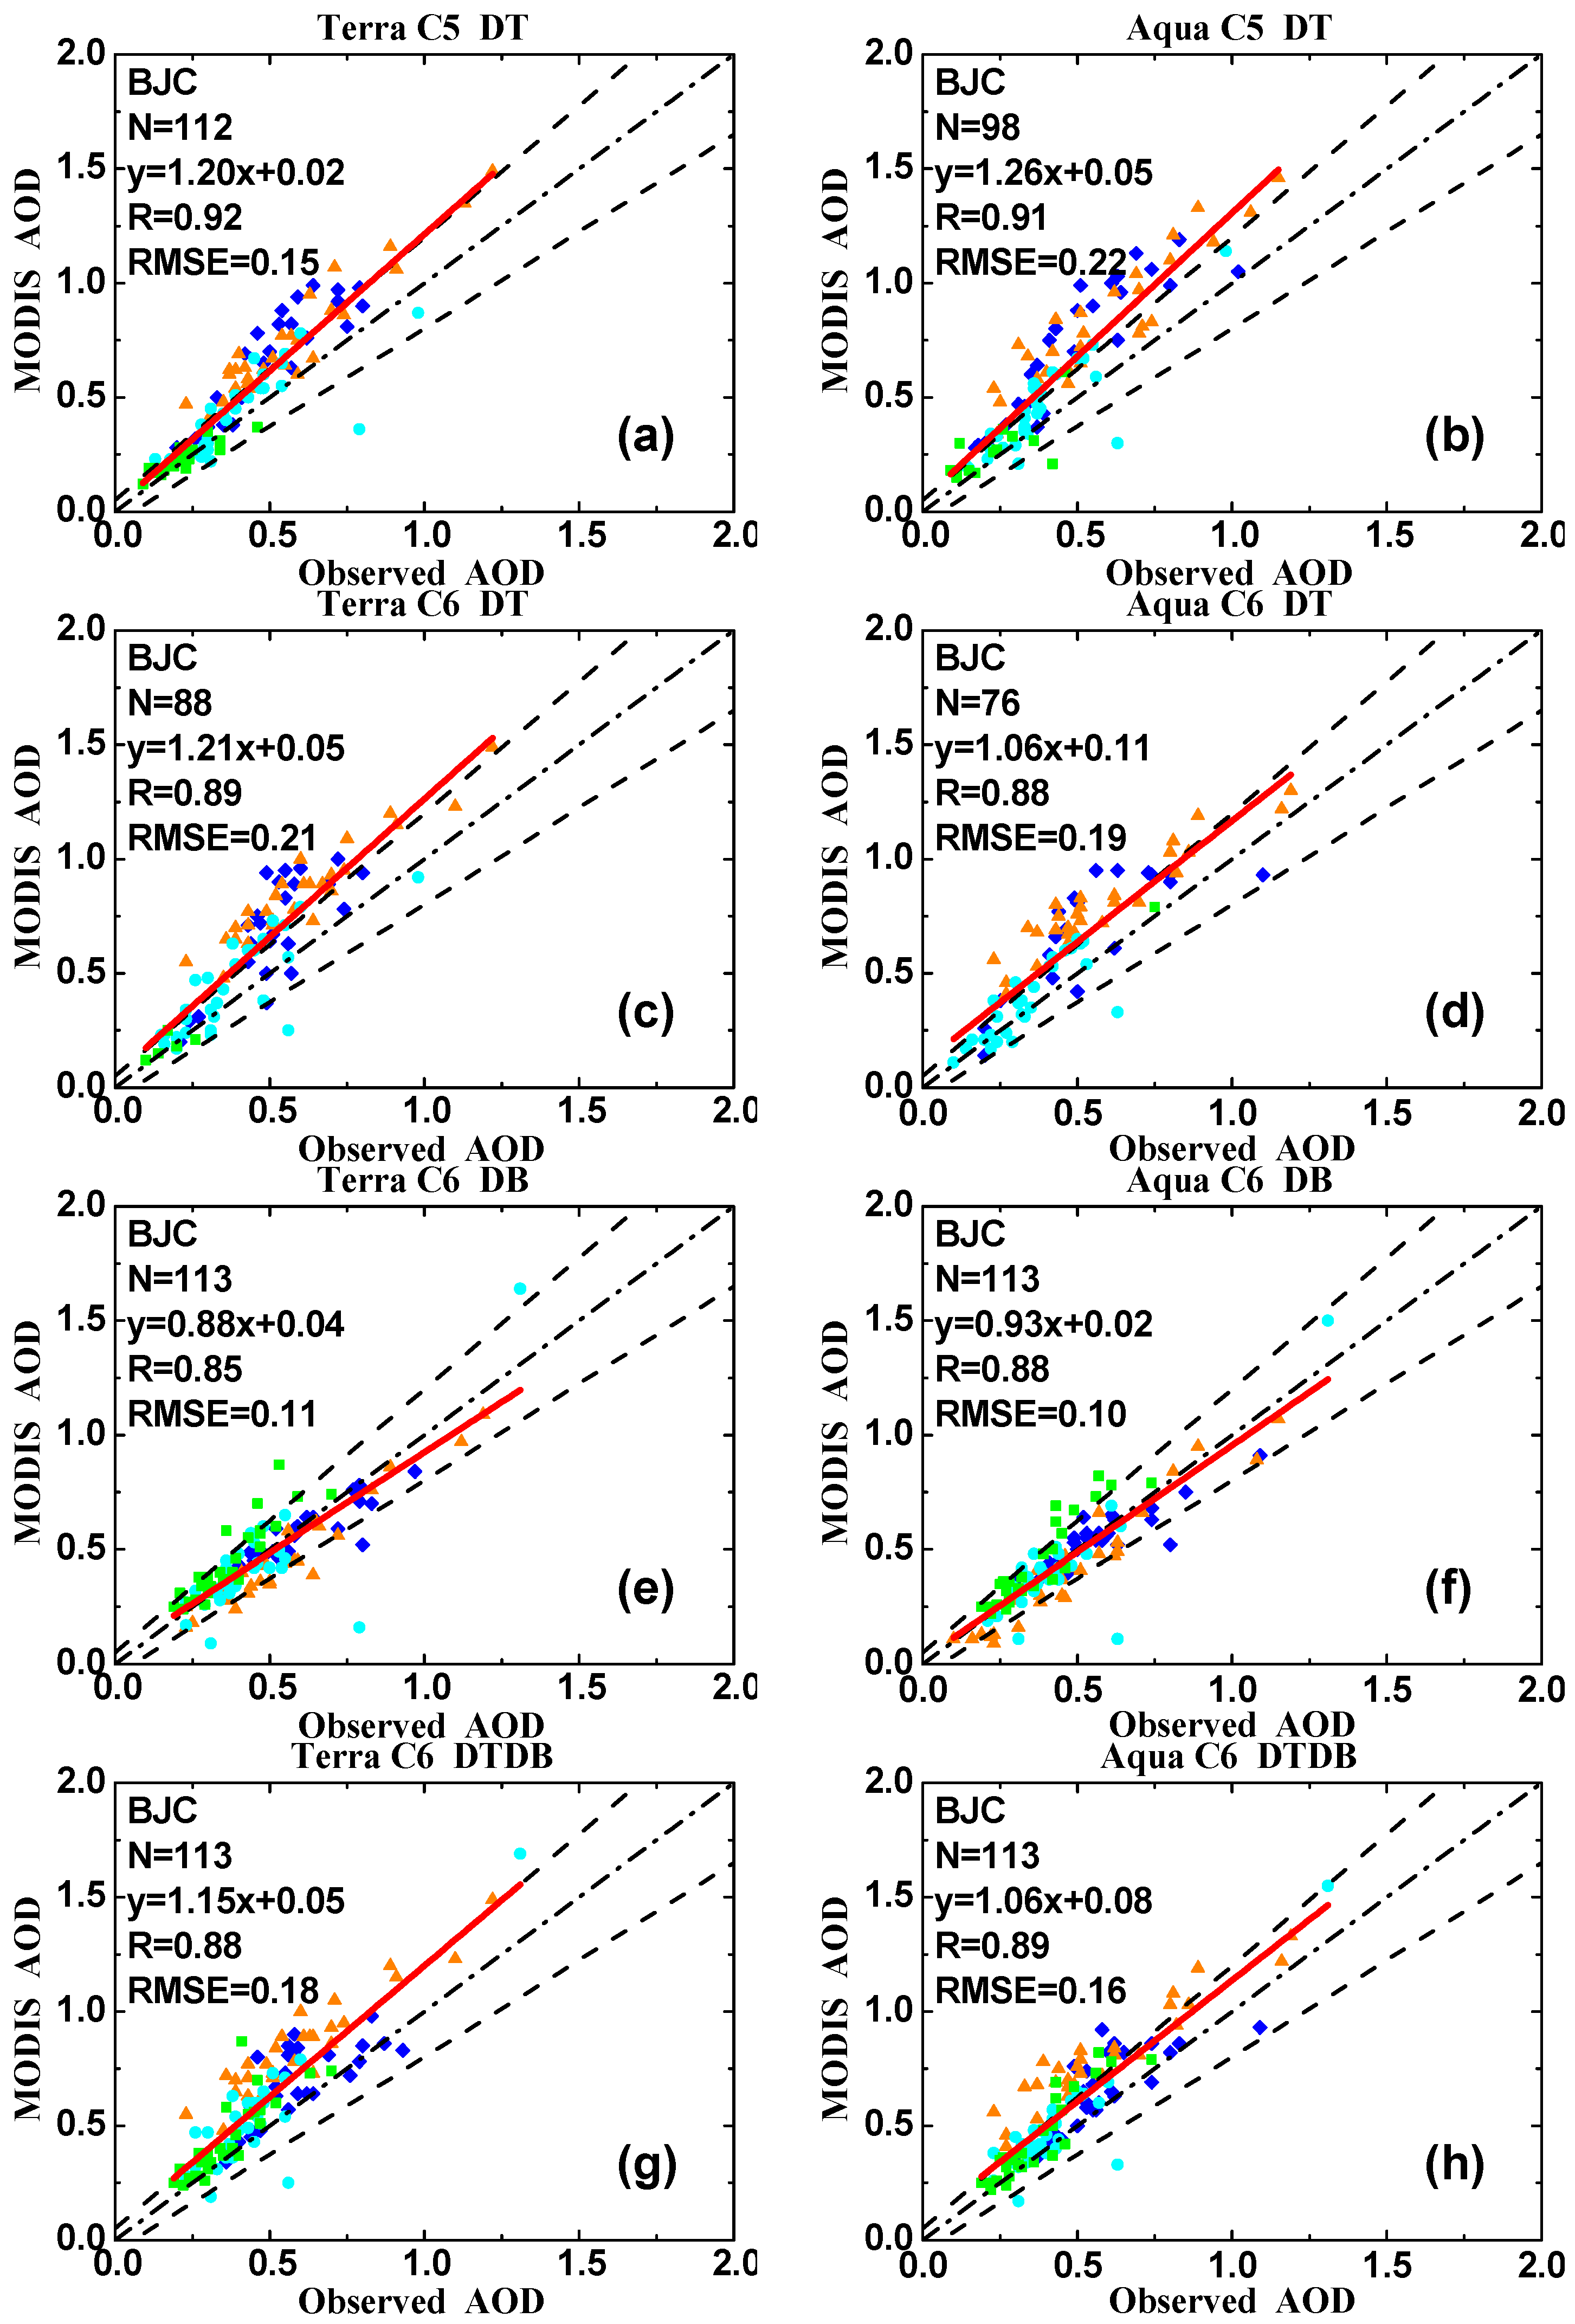
3.3. The Comparison of MODIS C5 and C6 Products at the Background Site

In Figure 4a–h, we can see that the collected AOD (CSHNET/MODIS) mainly concentrated in the range of 0~0.3 at BJF. There were 14%~36% more matchups with ground-observed AOD for Terra than Aqua. Since the retrieval algorithm is the same for the two satellites, this may be caused by the different aerosol properties in the morning and afternoon [17]. Both C5 and C6 DT retrievals had a good performance, with a slope of 0.91~1.05, a small intercept of −0.04~0.05, an R of 0.88~0.93, an RMSE of less than 0.1, and more than 62% of data falling within EE envelope. The matchups of C6 DT significantly decreased by approximately 32% compared to C5 DT, possibly due to the QA = 3 cases revision in C6 [17]. However, there was no obvious improvement of C6 retrieval accuracy shown by the similar statistical metrics with C5 DT, which is also illustrated in Figure 4i,j by the little difference between C5 DT and C6 DT, especially for Aqua satellite, with slope and intercept closing to 1 and 0, respectively. Since C6 DB has covered all dark and bright surfaces, except for snow and ice, the matchups were 1086 and 955 for Terra and Aqua, respectively, which were much larger than those of C6 DT, but it had a considerable underestimation caused by biases in aerosol model assumptions, shown by slopes of only 0.77~0.81, and the percentage of data falling below EE approaching 52%. Significantly, since 55% of C6 DTDB retrievals derived from C6 DT, they had a good consistency with ground-based observations, accompanied by the abundant matchups, the slopes and intercepts for both satellites being closed to 1 and 0, and more than 61% of data falling within EE envelope.
As we all know, the quality of MODIS AOD retrievals is closely related to aerosol types, particle size and surface reflectivity, which all have strong seasonal cycles [32,39]. Therefore, we compared the monthly average MODIS AOD with ground-observed ones in different seasons in Figure 5a–h, which was similar to the daily-scale analysis. Compared to C5 DT, the accuracy of C6 DT improved a lot, with slope notably increasing from 0.78 to 0.99, and from 0.88 to 1.02, for Terra and Aqua, respectively. The underestimation of C6 DB was more severe as for monthly averages, the slopes were only 0.62 and 0.63, with the intercepts of -0.01 and 0, R values of 0.84 and 0.78, for Terra and Aqua, respectively. Remarkably, C6 DTDB retrievals for both satellites fully showed their advantages, with slopes of over 0.98 and intercepts of −0.04.
The DT algorithm is limited to retrieve on dark-soiled/vegetated surfaces, removing snow and ice [15,23]; however, the vegetation coverage at BJF in winter is small and the land surface is possibly covered by snow and ice, resulting that the matchups in winter were very small (Figure 5a–d), and even less than 1% (25% of one season in theory) in C6 DT for both satellites. On the contrary, the matchups of C6 DB in winter remarkably increased by approximately 14% comparing with DT, along with more than 66% of the retrievals falling within EE envelope, owing to the modification of expanded coverage [20]. Moreover, DT, DB and DTDB retrievals usually performed best in autumn, with more matchups and higher proportion falling within EE, followed by spring, summer and winter. Interestingly, when considering the aerosol type sorted by ground-base α (α < 0.5 and α > 1.5 represent coarse mode dominated and fine mode dominated aerosol types, respectively, according to Wang et al. [10]), all the products we studied here had better performance in fine mode dominated condition (α > 1.5), with 78%~91% of data falling into EE envelope(figures not shown), which further proved the better performance of AOD products in autumn.

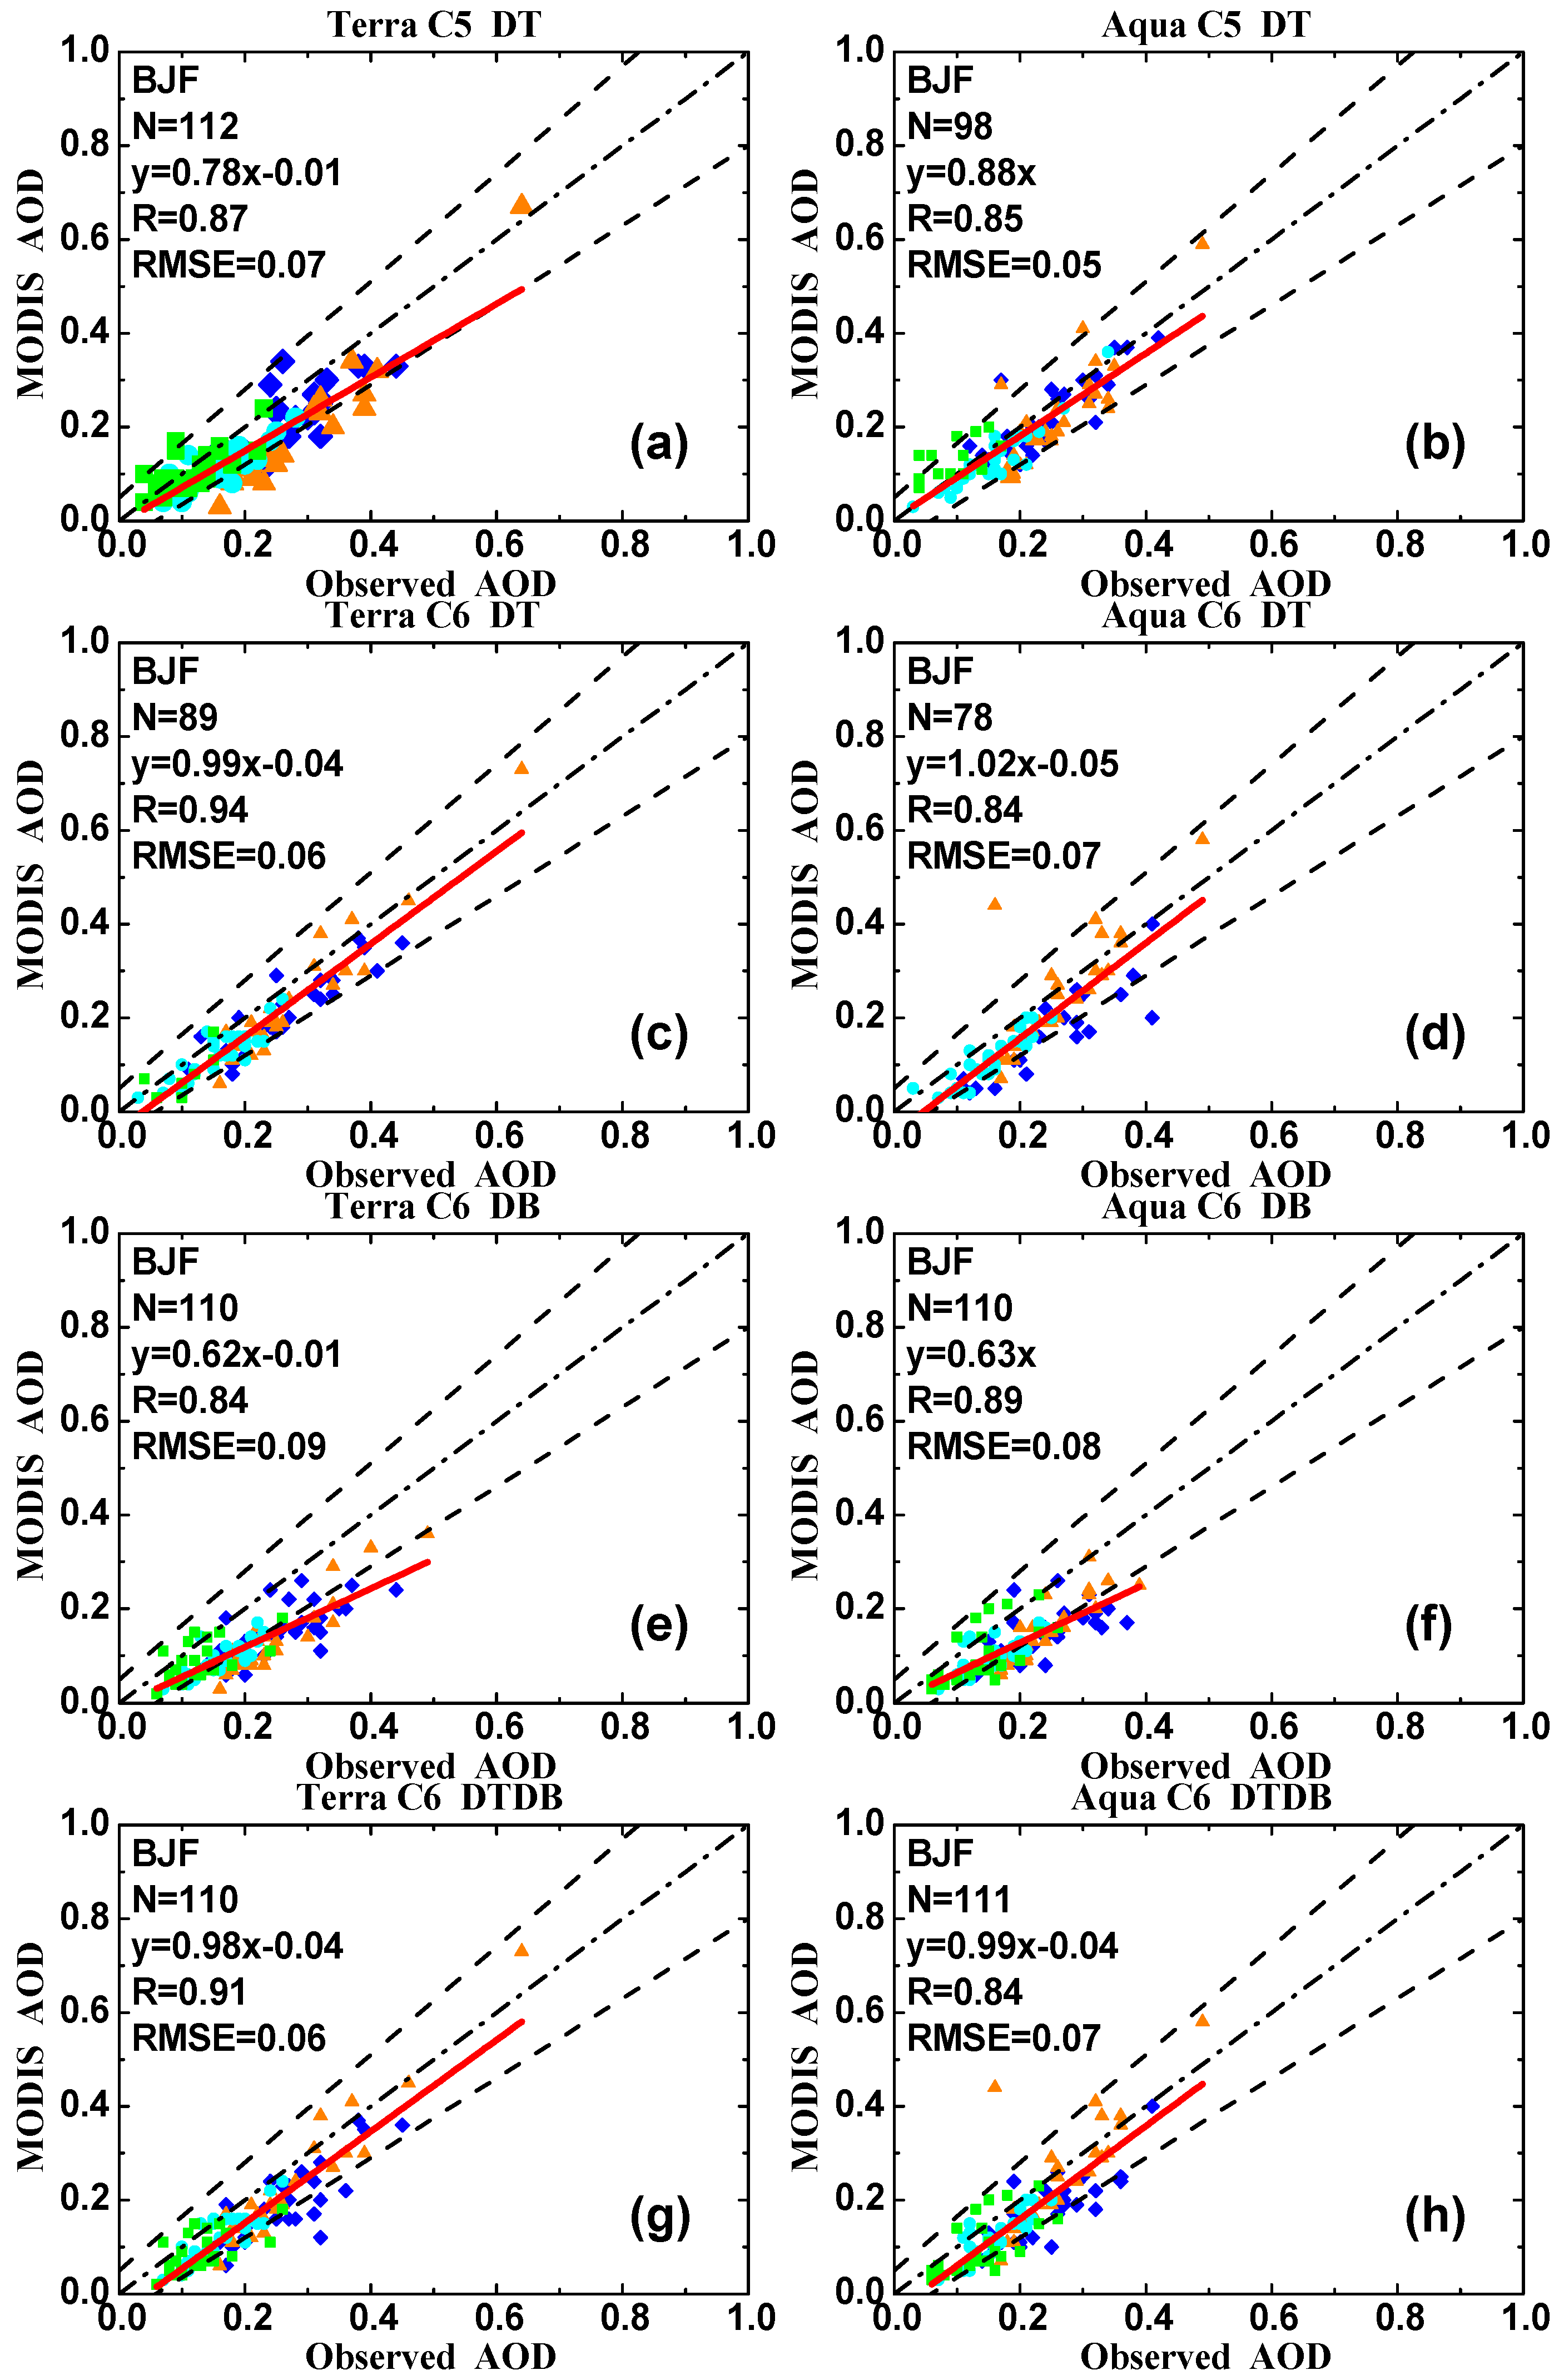
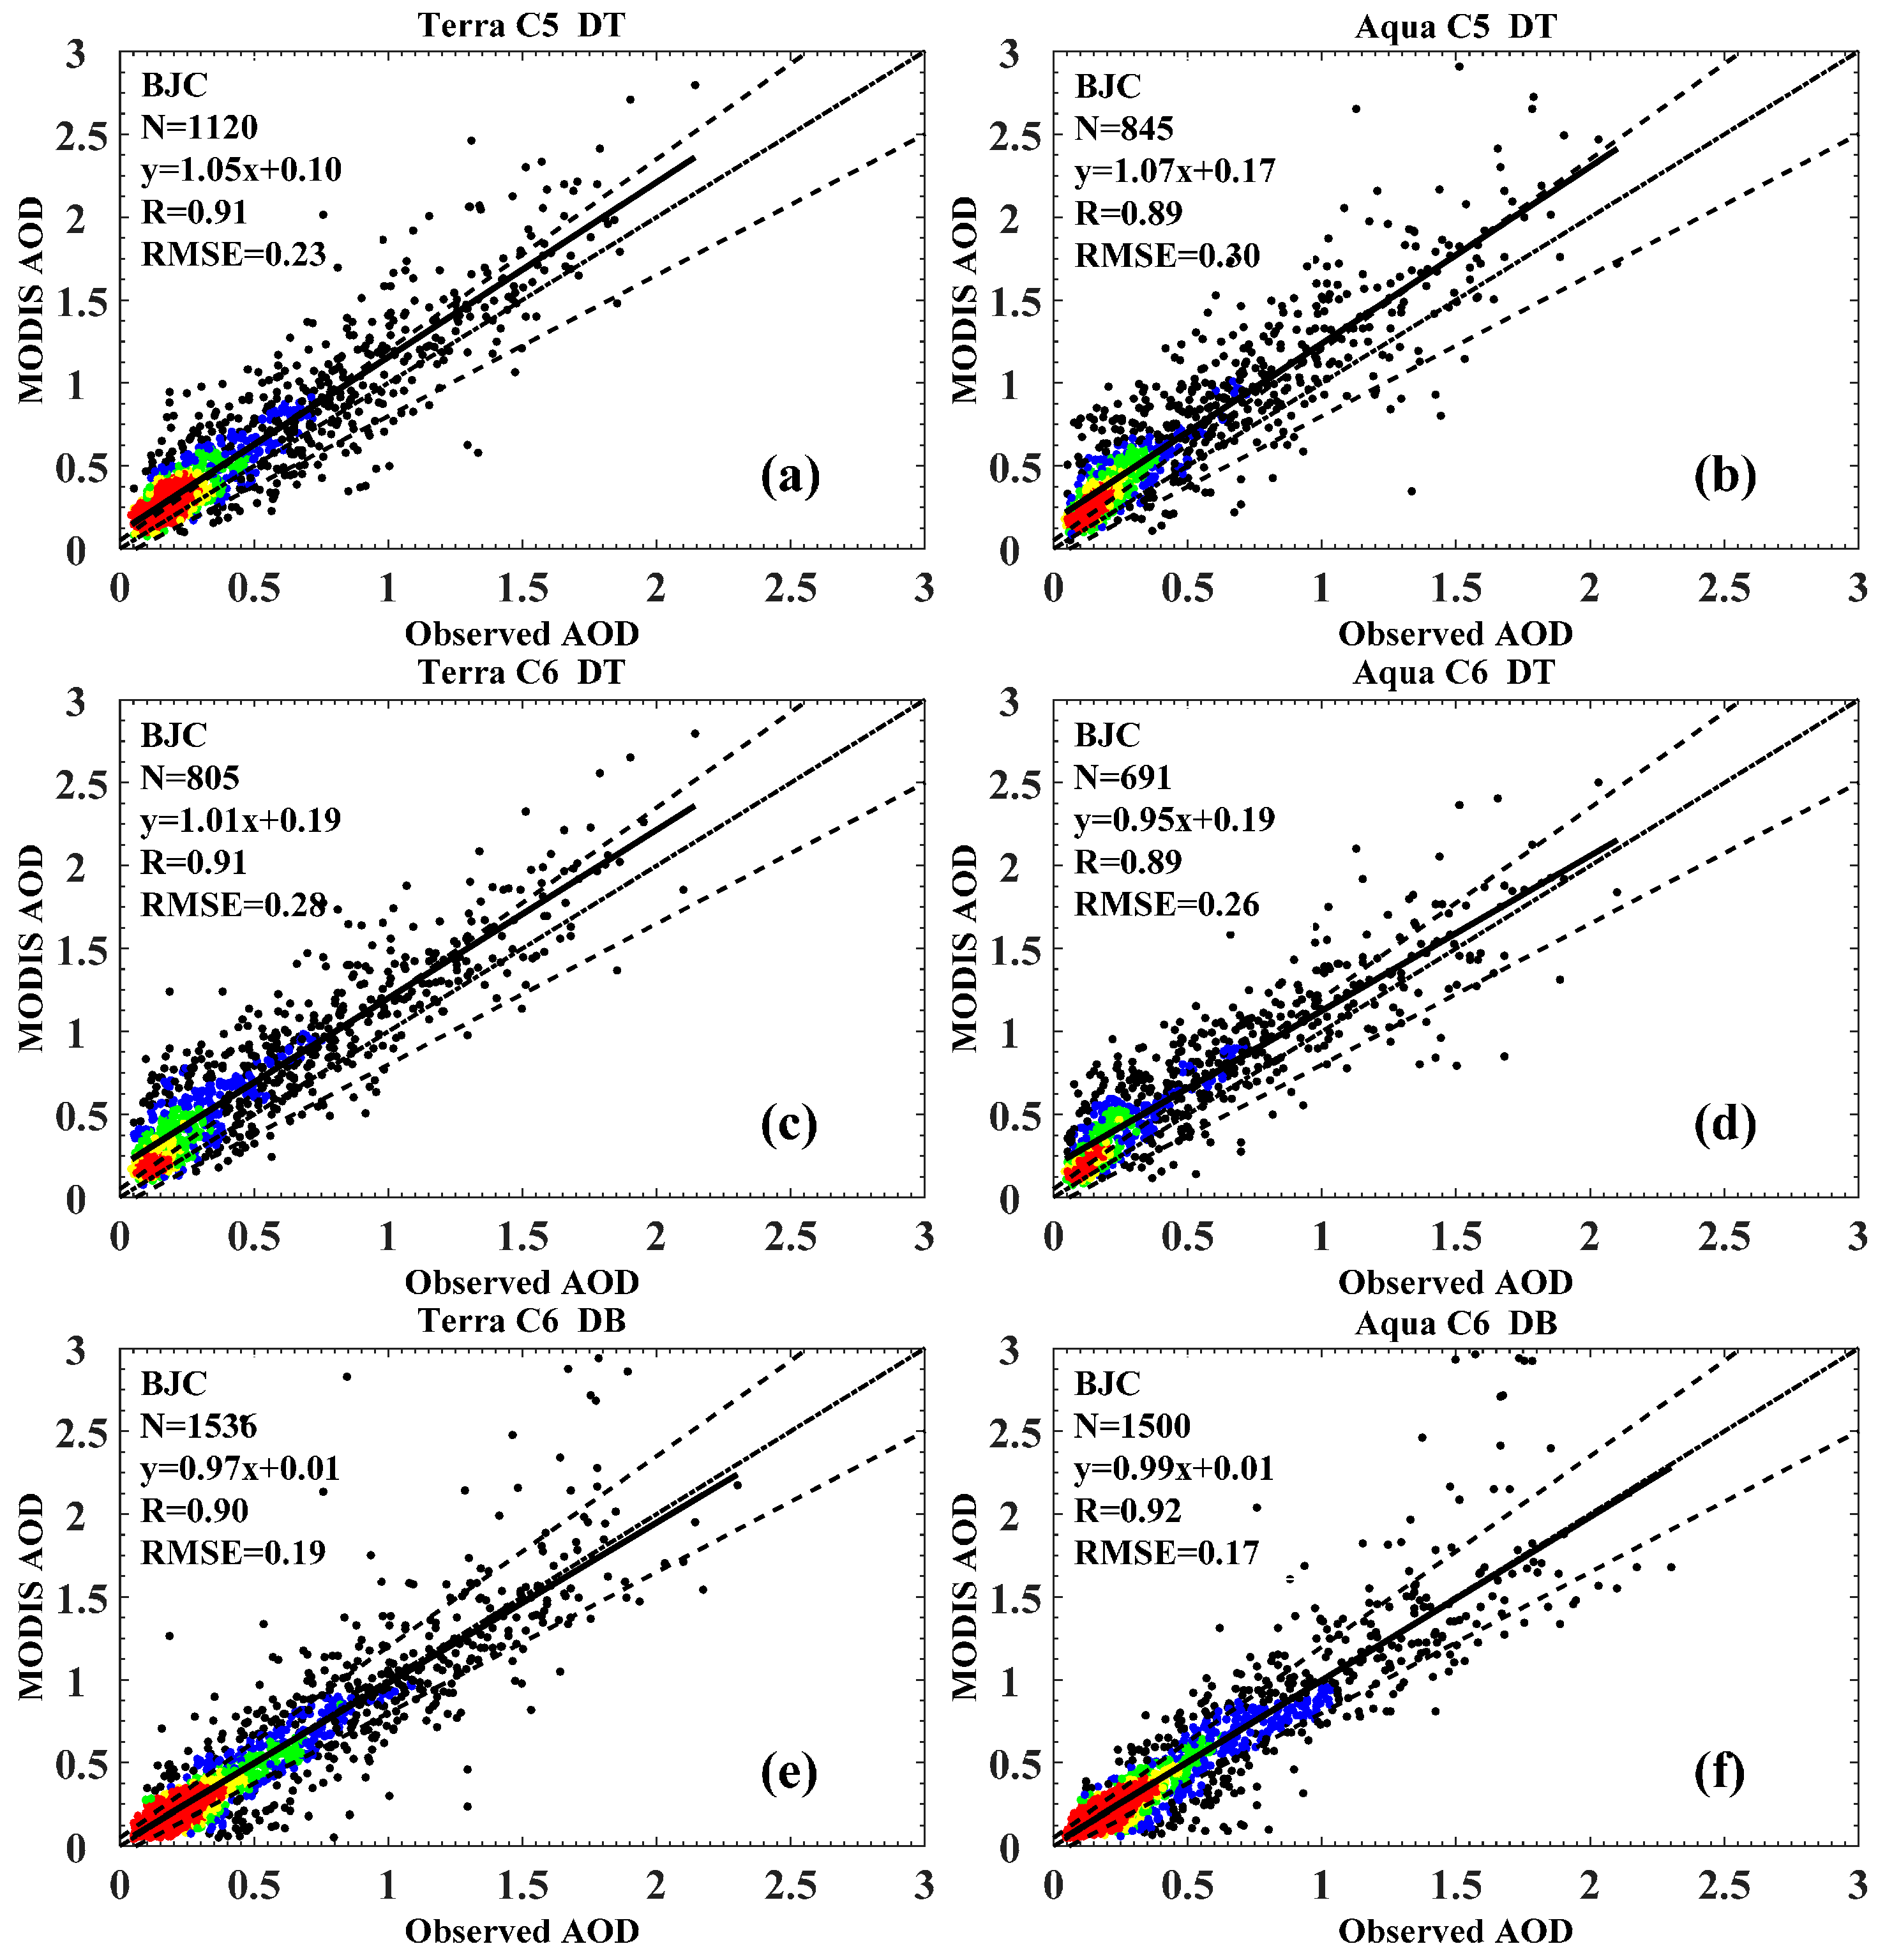
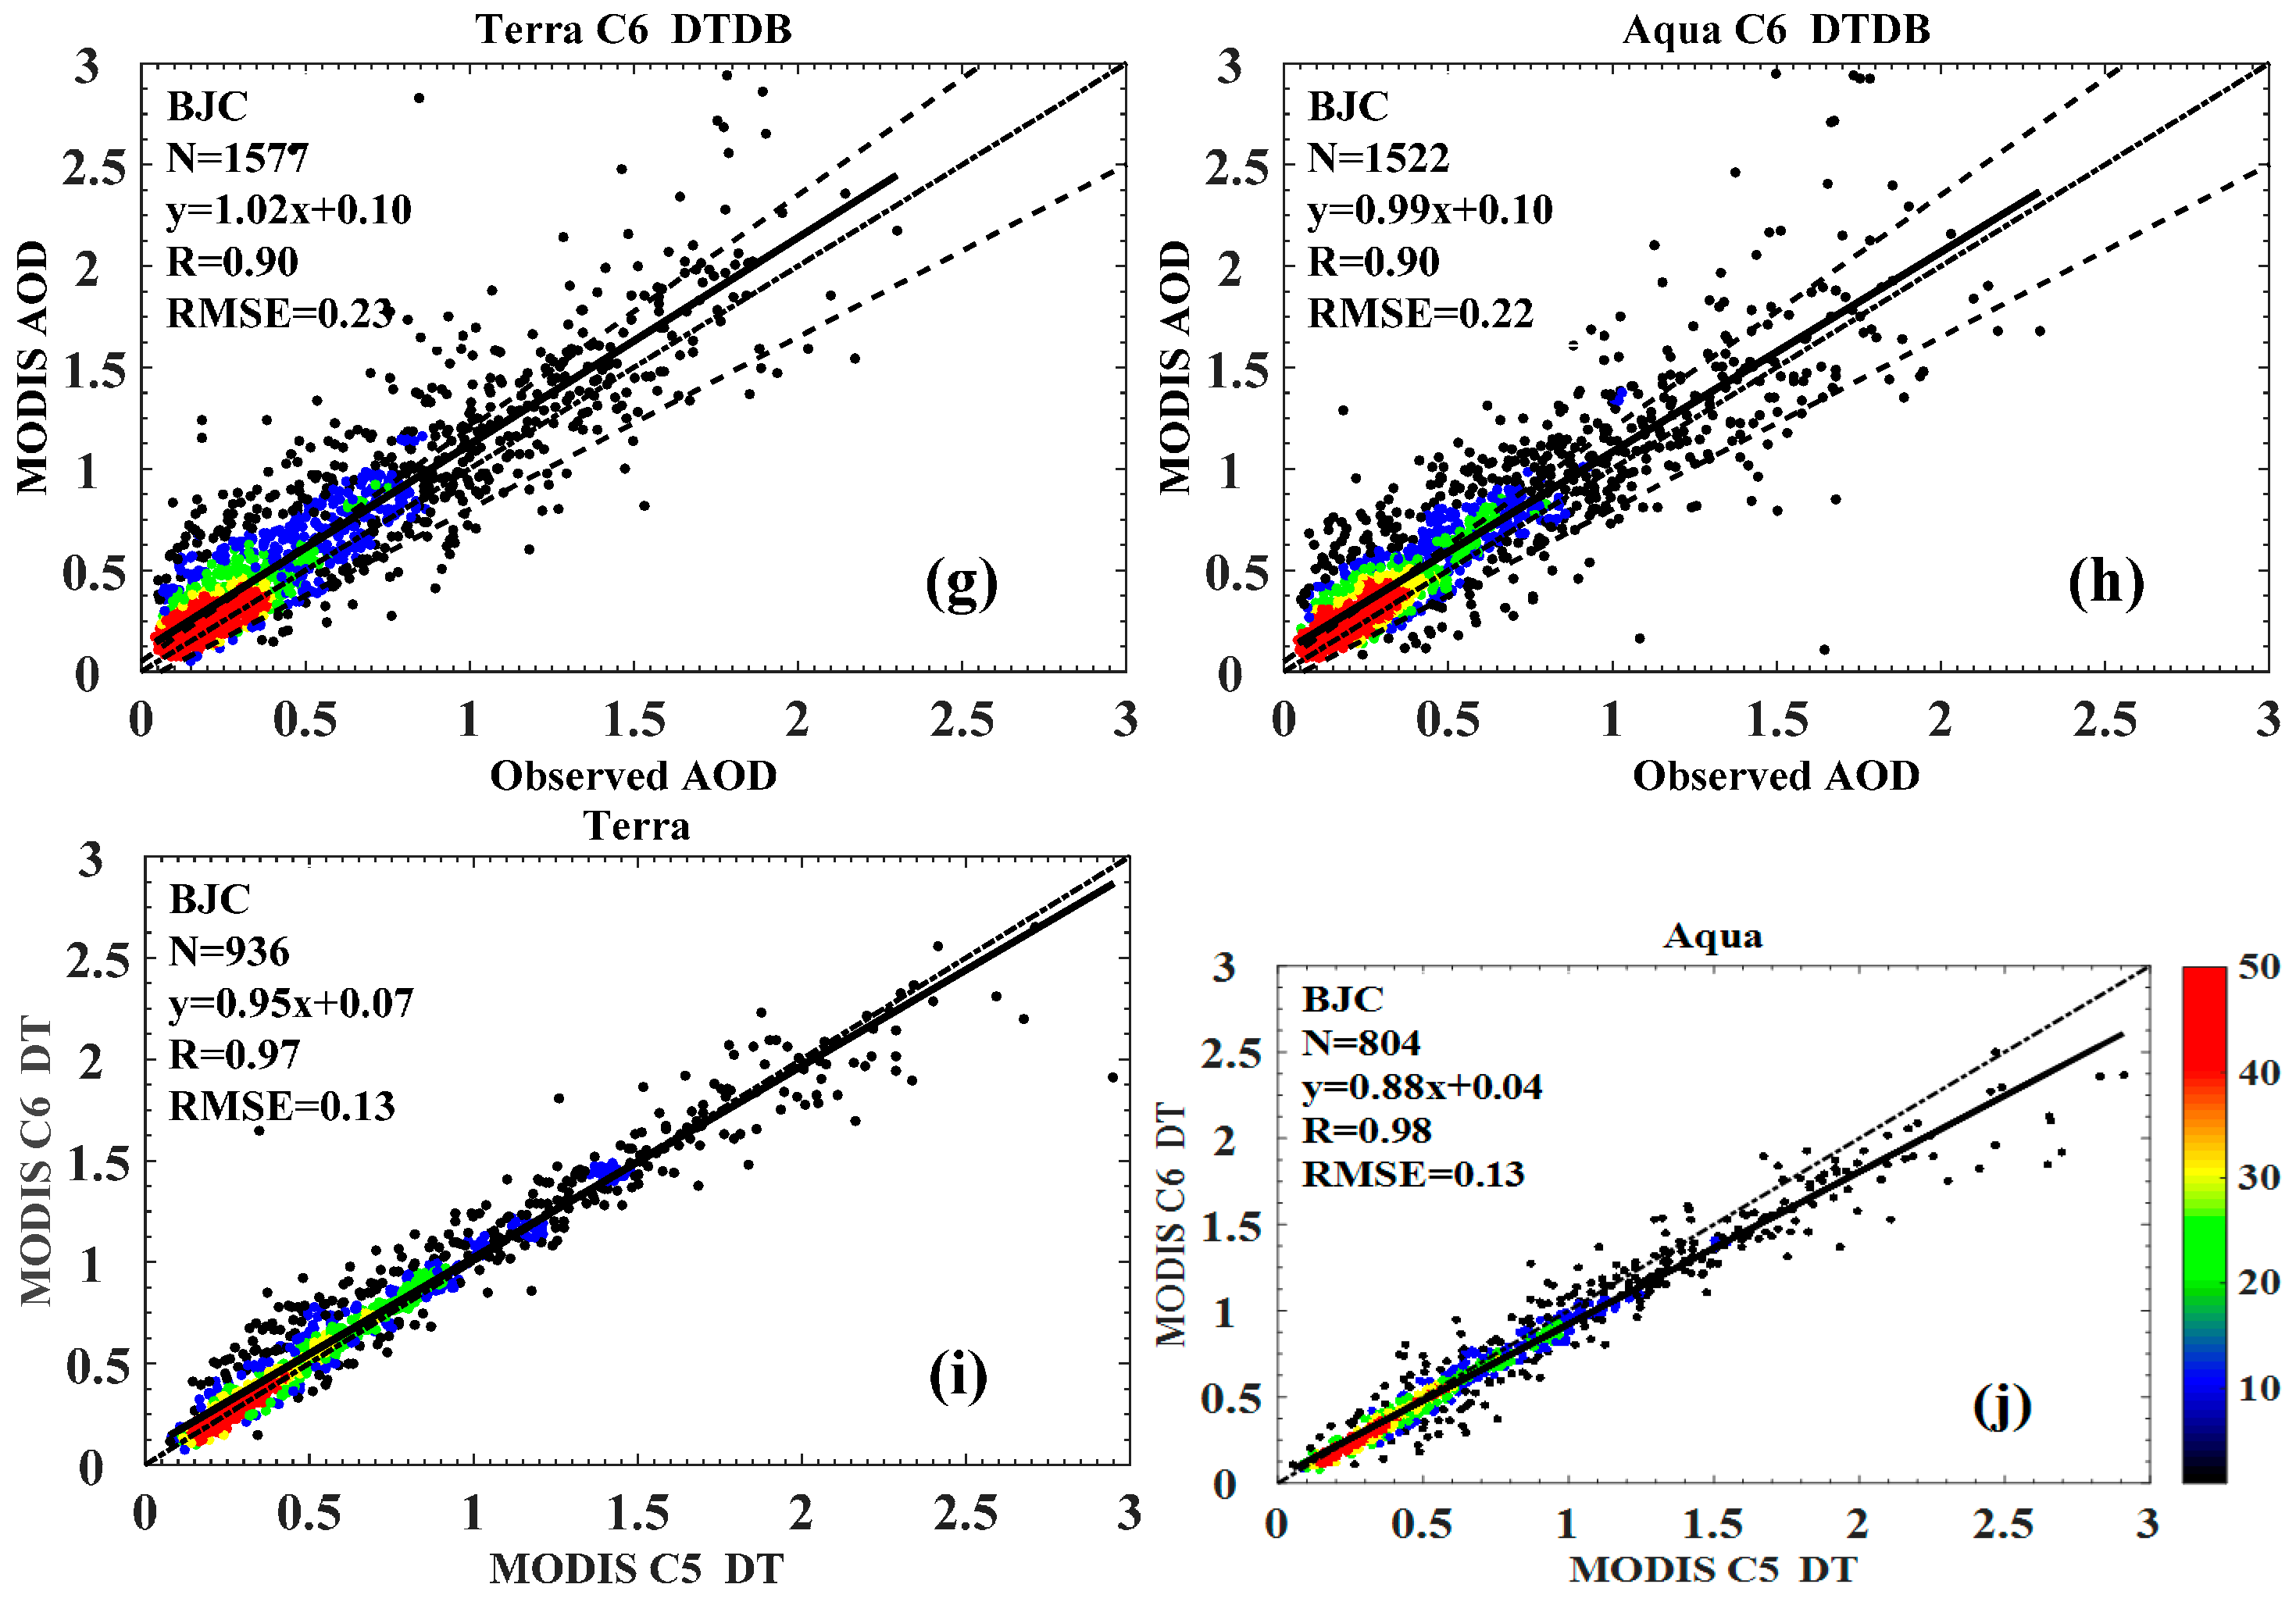
3.4. The Comparison of MODIS C5 and C6 Products at the Urban Site

Figure 6a–h showed the validation of C5 and C6 daily AOD versus ground-observed AOD at BJC site. The collected C5 and C6 DT retrievals were mainly in the range of 0~0.3 and 0~0.2, whereas those of C6 DB and C6 DTDB retrievals were in a wider range of 0~0.4, because DT algorithm was partly unavailable over complex and brighter urban surfaces as well as high aerosol loading conditions [16,29]. The overestimation of DT retrievals was obvious, with the large intercept of 0.10~0.19, large RMSE of 0.23~0.28, and more than 52%~68% of DT retrievals falling above EE, which was mainly due to the bias in surface reflectivity estimation. For Terra satellite, the matchups of C6 DT remarkably decreased by 39% comparing to C5 DT, and the intercept increased from 0.10 to 0.19, with RMSE increasing from 0.23 to 0.28, and the data falling above EE increased from 52% to 63%; therefore, the accuracy of C6 DT did not improve as expected, as shown in Figure 6i. For Aqua satellite, when compared to C5 DT, C6 DT matchups decreased by 22%, the slope decreased from 1.07 to 0.95, RMSE decreased from 0.30 to 0.26, with the data falling above EE decreasing from 68% to 60%, and the slightly improvement of C6 DT algorithm was still attractive, further illustrated by the large disparity between the two datasets in Figure 6j. Completely different from the poor performance at BJF, C6 DB algorithm has found to be in a good agreement with ground-observed AOD at BJC, the slope were 0.97 and 0.99, with intercepts of only 0.01, and the percentages within EE were up to 69% and 72% for Terra and Aqua, respectively. As expected, C6 DTDB had sufficient matchups of more than 1500, and it had a good accuracy due to the attendance of 47% of C6 DB retrievals, but the uncertainty of surface reflectivity estimation cannot be ignored, accompanied by intercepts of 0.10, and large RMSEs of 0.23 and 0.22 for Terra and Aqua, respectively. It is worth noting that the RMSE at BJC was in the range 0.17~0.30, whereas the biggest RMSE at BJF was 0.11, which may be related to the various aerosol types and complex urban surface at BJC.
Figure 7 shows the evaluation of different MODIS AOD products on a monthly scale at BJC site. As for DT products of C5 and C6 versions, the slopes were larger than 1.20 (1.06 for Aqua C6 DT), and the intercepts were in the range of 0.02~0.11, so the retrieval uncertainty was mainly caused by aerosol model assumption, and the advantages of C6 DT were as vague as the results on a daily scale discussed above. Although C6 DB retrievals were collected over the whole course of 113 months (from August 2004 to December 2013), the slopes were only 0.88 and 0.93 for Terra and Aqua, respectively, and the biases of aerosol model assumptions were serious. In the same way, C6 DTDB retrievals had obviously bias caused by aerosol model assumptions, especially shown by the bigger slope of 1.15 for Terra satellite.
DT products performed best in autumn, whereas in spring and summer there was obviously overvaluing with more than 65% of data falling above EE, and in winter the quantity of matchups was small. The performance of C6 DB and DTDB retrievals in summer was markedly inferior to other three seasons: during spring, autumn and winter the matchups and proportion of data falling within EE were more than 27% and 57%, respectively. Similar to the BJF‘s classification of aerosol types on the basis of ground-based α, at BJC DT overestimated by 58%~81% in the range of α > 1.5, which is dominated by fine mode aerosol types. For C6 DB and C6 DTDB products, they had better performance in the range of 0.5 < α < 1.5 and α > 1.5, with 45%~73% of the data falling into EE envelopes.

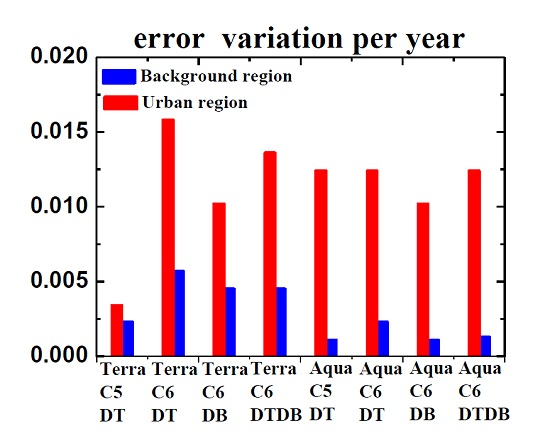
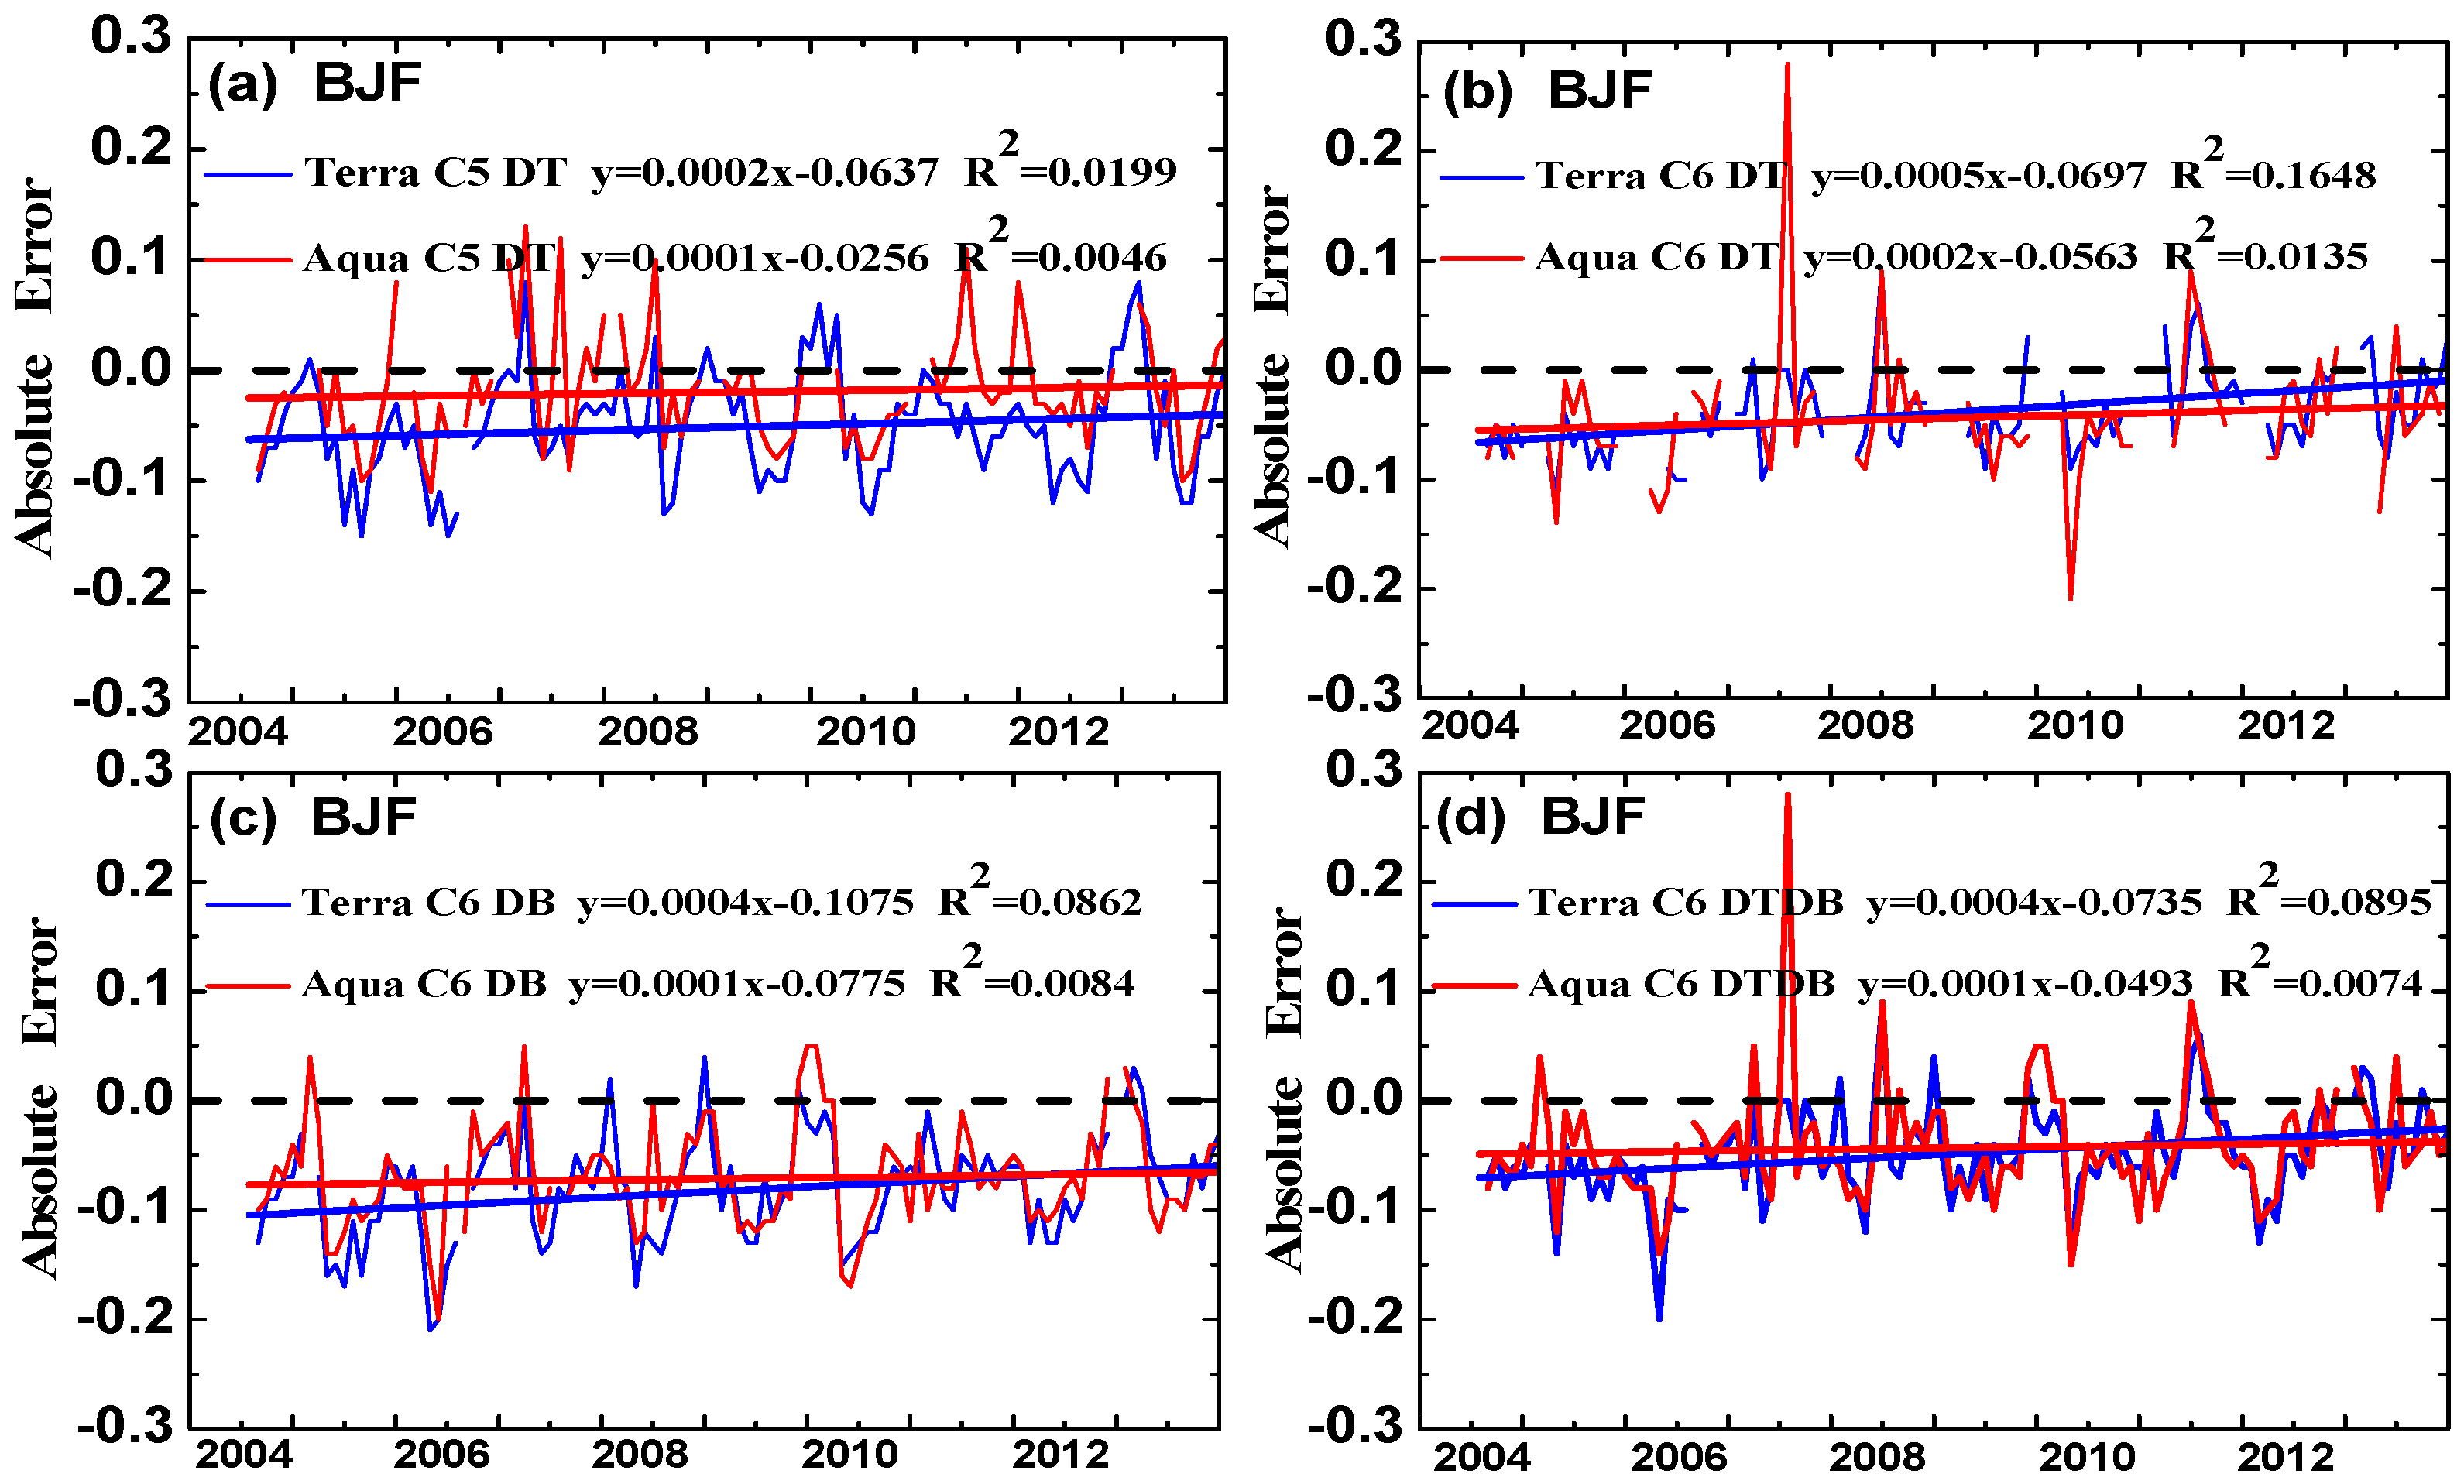
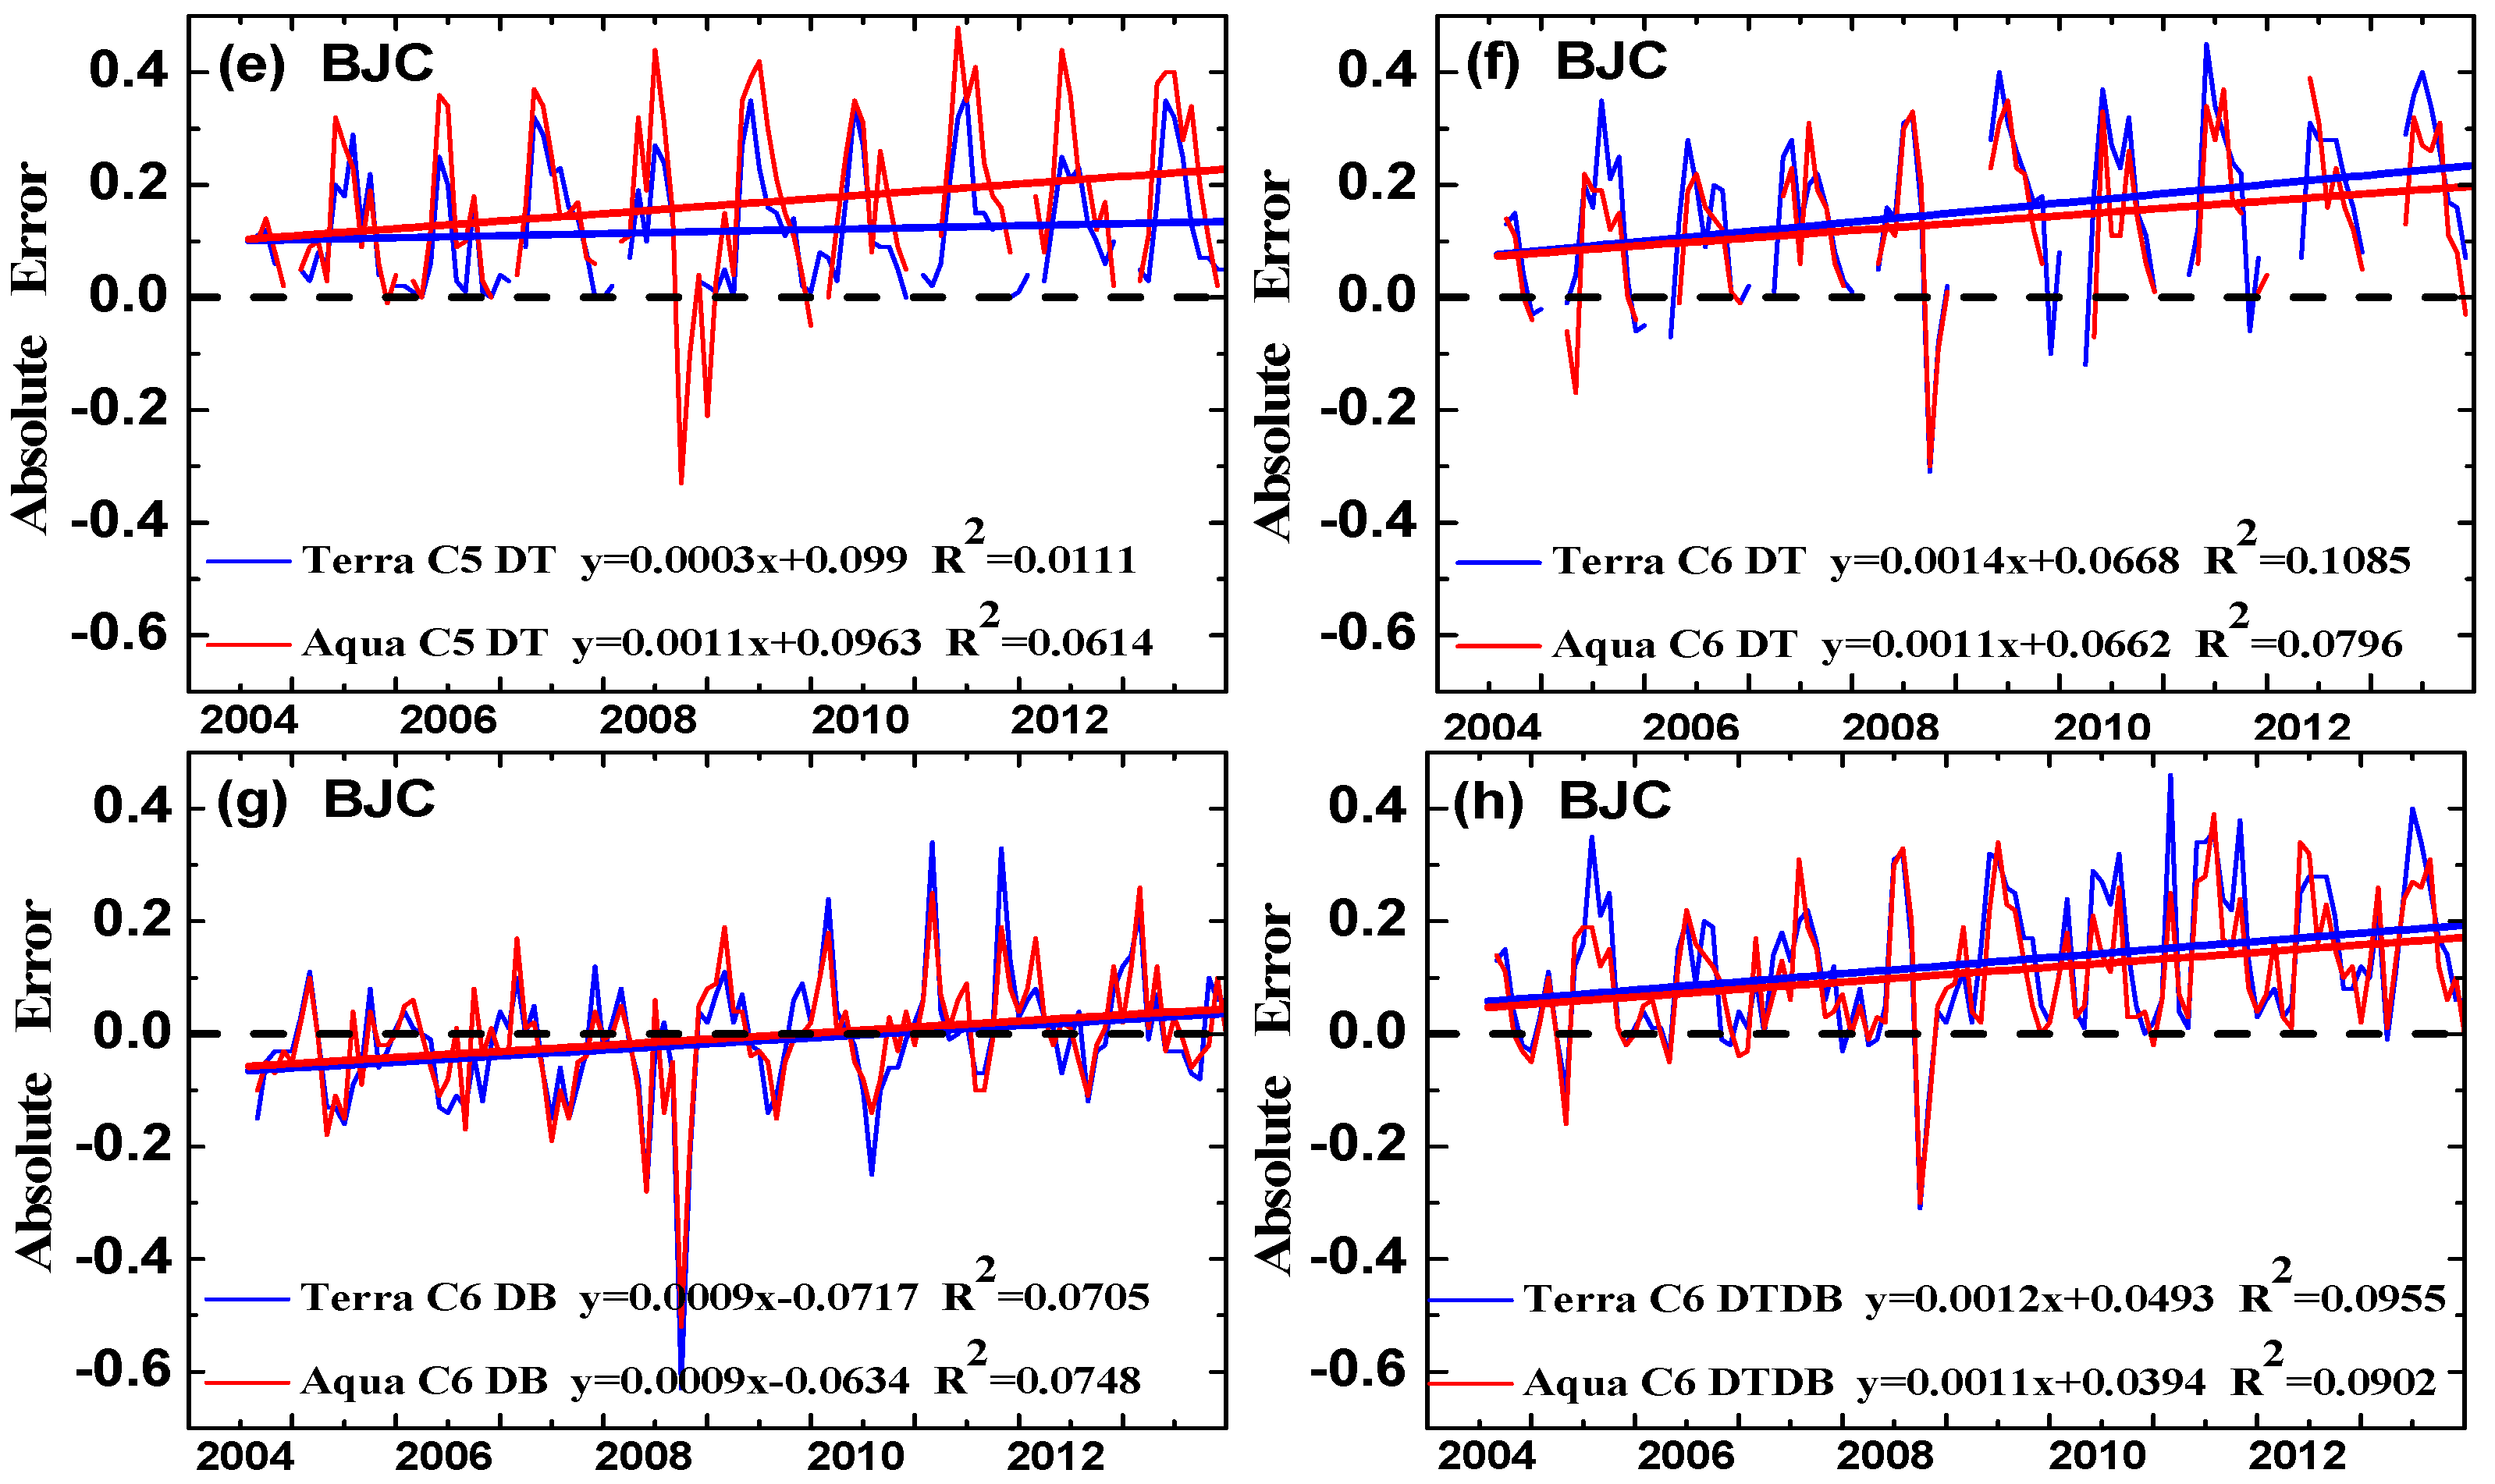
3.5. The Error Trends of MODIS C5 and C6 Products

The twin MODIS aboard Terra and Aqua satellites has operated for more than ten years, and the sensor aging problems over time has been considered by many researchers [16,41,42,43]. Figure 8 shows time series of MODIS AOD monthly average error ((MODIS-Observed) AOD) over ten years, which may help directly reflect the disparities of various MODIS retrieval products [44]. Since the error was a function of time, we also considered the complete years only (not shown here), but the results were almost the same, so the whole researched period (August 2004–December 2013) were shown here. The errors have obvious seasonal cycle: at BJF, they were in the larger range of −0.11~−0.02 during spring and summer and smaller one of −0.07~−0.02 during autumn and winter; comparatively, at BJC, their variations were 0.06~0.25 and −0.03~0.08 in the corresponding seasonal periods. Notably, the error lines of C6 DT for both satellites showed the weak time-continuity due to the lack of sufficient retrievals especially in winter as pointed above, as shown in Figure 8b,f. Significantly, the monthly average error at BJC was only −0.04~0.13 before 2008, while it increased to 0~0.58 after 2008, accompanied by higher peaks shown in Figure 8e–h.
In Figure 8, we can directly see that the long-term tendency of error lines for all the products were on the rise to different extent, indicating that the sensor degradation issues can not be neglected [44]. At BJF, the error of C5 DT has increased by 0.0023 and 0.0011 per year for Terra and Aqua, respectively, and the corresponding error increments of C6 DT were 0.0057 and 0.0023 for Terra. Besides, the error of Terra C6 DT had a dramatically strong correlation with time over the year, since the R2 was large 0.1648. As for C6 DB products, the difference between the two sensors was much smaller; significantly, the error for Aqua has a smaller increment of 0.0011 per year, along with weaker time correlation (R2 = 0.0084). The error of Aqua C6 DTDB had a smaller variation of 0.0013 per year. At BJC, the error of Terra C5 DT for has only increased by 0.0034 every year, with a small correlation of time series (R2 of 0.0111). However, the R2 of Terra C6 DT was even large to 0.1085. The error of C6 DB for both satellites has inconspicuously increased by 0.0102 per year, along with weak time correlation, since R2 were 0.0705 and 0.0748 for Terra and Aqua, respectively. C6 DTDB errors for the two sensors have similar variations, with increases of 0.0136 and 0.0124 per year for Terra and Aqua, respectively.

4. Discussion

As we all know, MODIS remote sensing is one of the important means to characterize aerosol distributions around the globe [9]. Since the uncertainties existed in the retrieval algorithms, sensors degradation problems and other aspects, various MODIS AOD products need to be evaluated in different seasons and regions in order to enhance their accuracy for diverse applications [16,17]. In the validation against ground-based observations, the slope and intercept of the fitting lines are primarily related to estimation errors of aerosol models and surface reflectivity for simplicity, respectively. Additionally, the uniform Expected Error (EE) lines of ±(0.05 + 0.15τ), where τ is the ground-observed AOD, were also used widely to evaluate the products [22,23,25].
Here, the BJF and BJC sites of CSHNET represented the background and urban areas, respectively. The ground-based daily AOD were from the observations between 10:00 a.m. and 2:00 p.m., the corresponding MODIS retrievals have been averaged in a box of 50 km × 50 km with ground-based stations in the middle [25,35]. In the background area, DT products usually had a better performance due to the algorithm limitation on dark/vegetated surface [15]. Although C6 DB products had expanded coverage to all snow-free and ice-free land [20], there was still a considerable 52% underestimation in our study, caused by biases in aerosol model assumptions, and the results was largely different from the hypotheses of Sayer et al. [21]. In the urban area, DT products had an overestimation of 52%~68% falling above EE, with a large intercept of 0.10~0.19, thus they worked poorly on brighter urban surfaces [16,31]. DB products had more sufficient data records and a good agreement with ground observations, which is also indicated by Tao et al. [29]. Although the improvements from C5 DT to C6 DT products have been identified by many researchers [17,21], the C6 DT level of agreement with CSHNET data has not obviously enhanced here, despite the matchups decreased by approximately 32%~39% compared to C5 DT, that may due to the QA = 3 cases revision in C6 products [17]. Significantly, the new dataset named C6 DTDB has good performance, especially in background, as expected [17,22], but there were little overestimation in the urban. Since the long-term MODIS AOD records are very valuable, they deserve to be updated and adjusted to further decrease the uncertainties.
The aerosol properties are greatly characterized by seasons and locations [34,35,36,37,38,39]. We also analyzed the monthly MODIS products performance in terms of seasonal features and Angstrom exponent (α). In the background, DT, DB and DTDB retrievals usually performed better in autumn and in fine mode dominated condition (α > 1.5). In the urban, DT products had overvalued in the range of α > 1.5, C6 DB and C6 DTDB products worked well in the range of 0.5 < α < 1.5 and α > 1.5, but their performance in summer was markedly poorer. It was noteworthy that the matchups of DT products in winter from background to urban were very small due to the algorithm limitations [15,23], especially for C6 products. From the daily and monthly evaluation of various AOD products, although there is not a product with absolute advantages [22], researchers can choose a more appropriate data record for their applications such as model research during an explicit period, health risk assessment, etc.
Since MODIS has operated for over a dozen years, we need to consider the sensor aging problems over time [16,41,42,43]. In the long-term period, the error had regular seasonal cycle both from background to urban areas, showing larger disparities during spring and summer and smaller ones during autumn and winter. Remarkably, the errors trends of all the products here had risen to different extents, which indicated the requirements of considering sensor degradation issues. Generally, Aqua products’ errors manifested much gently upward regression lines compared to Terra products in the background (apart from C6 DT products), which is in agreement with Cheng et al. [44]. In the urban, Terra C6 DB product remained the most stably, with smaller error increment and weaker time correlation (R2 = 0.0705), which is consistent with the results of Sayer et al. [43]. Thus, considering the sensor aging problems was necessary in the improvement of MODIS aerosol products’ quality.

5. Conclusions

In the present study, we evaluated MODIS AOD products (including high-quality C5 and C6 products of Terra and Aqua satellites) and analyzed the MODIS retrieval error variation trends over the past ten years (August 2004–December 2013) in North China. The BJF and BJC sites were used to represent typical background and urban aerosol distributions in the region, respectively. There were heavier aerosol loadings with smaller particle sizes in the urban than those in the background in North China. The ground-based AOD showed a slight decreasing trend of 0.023 and 0.057 in the background and urban areas during nearly ten years, but few MODIS C5 and C6 products can catch the trend variation characteristics. Furthermore, MODIS AOD products in the urban showed an opposite increased range of 0.04~0.18 during the decade. The accuracy of C5 and C6 DT products in the background was remarkably higher than that in the urban, and the uncertainty in urban area was mainly caused by assumptions of aerosol models, with intercepts large to 0.10~0.19 and an overestimation of 52%~68% above Expected Error (EE) envelope. Significantly, the accuracy of C6 DT products in North China has not obviously increased compared to C5 DT products. Although C6 DB products has expanded coverage to all land surface excluding cloud and snow pixels, they still performed better in the urban than in the background, and they had severe underestimation caused by aerosol model assumptions error in background, with slopes of only 0.77 and 0.81 for Terra and Aqua, respectively. Excitingly, the new merged dataset, namely, C6 DTDB, combined both C6 DT and DB retrievals [16], generally had smaller biases in North China (especially in the background area) thus it may provide a more convenient MODIS AOD record data for other applications. The monthly average errors were much higher in spring and summer (−0.11~0.25) than that in autumn and winter (−0.07~0.08) both in the background and urban areas. Aqua MODIS had degraded more slowly than Terra MODIS in the background. However, Terra C6 DB dataset had evidently more stable performance than other AOD products in the urban. Although the errors of sensor degradation were far less than the retrieval ones, the degradation issues of MODIS cannot be neglected and need further consideration in the retrieval algorithms. However, since only the data from two ground sites were collected in this study, the results may have certain partiality.

Acknowledgments

This study was supported by the National Natural Science Foundation of China (Grant No. 41375036, 41590873 and 41222033), the CAS Strategic Priority Research Program (XDB05020103), the National Basic Research Program of China (2016YFC0202001, and 973 Program2014CB441200) and the Priority Academic Program of Development of Jiangsu Higher Education Institutions (PAPD). The authors are grateful for the MODIS data services from NASA and CERN stations.

Author Contributions

Jinyuan Xin, Yan Yin and Yuesi Wang conceived and designed the experiments; Lili Wang contributed analysis tools; and Qi Zhang performed the experiments and wrote the paper.

Conflicts of Interest

The authors declare no conflict of interest.

References

  1. Carslaw, K.S.; Bouvher, O.; Spracklen, D.V.; Mann, G.W.; Rae, J.G.L.; Woodward, S.; Kulmala, M. A review of natural aerosol interactions and feedbacks within the Earth system. Atmos. Chem. Phys. Dicuss. 2009, 9, 11087–11183. [Google Scholar] [CrossRef]
  2. King, M.D.; Kaufman, Y.J.; Tanré, D.; Nakajima, T. Remote sensing of tropospheric aerosols from space: Past, present and future. Bull. Am. Meteorol. Soc. 1999, 80, 2229–2260. [Google Scholar] [CrossRef]
  3. Reisen, F.; Meyer, C.P.; Keywood, M.D. Impact of biomass burning sources on seasonal aerosol air quality. Atmos. Environ. 2013, 67, 437–447. [Google Scholar] [CrossRef]
  4. Pope, C.A.; Dockery, D.W. Health Effects of Fine Particulate Air Pollution: Lines that Connect. J. Air Waste Manag. Assoc. 2006, 56, 709–742. [Google Scholar] [CrossRef] [PubMed]
  5. Hayood, J.M.; Boucher, O. Estimates of the direct and indirect radiative forcing due to tropospheric aerosols: A review. Rev. Geophys. 2000, 38, 513–543. [Google Scholar] [CrossRef]
  6. Lohmann, U.; Feichter, J. Global Indirect aerosol effect: A review. Atmos. Chem. Phys. 2005, 5, 715–737. [Google Scholar] [CrossRef]
  7. Dubovik, O.; Holben, B.; Eck, T.F.; Smirnov, A.; Kaufman, Y.J.; King, M.D.; Tanre, D.; Slutsker, I. Variability of absorption and optical properties of key aerosol types observed in worldwide locations. J. Atmos. Sci. 2002, 59, 590–608. [Google Scholar] [CrossRef]
  8. Remer, L.A.; Kaufman, Y.J.; Tanre, D.; Mattoo, S.; Chu, D.A.; Martins, J.V.; Li, R.R.; Ichoku, C.; Levy, R.C.; Kleidman, R.G.; et al. The MODIS aerosol algorithm, products, and validation. J. Atmos. Sci. 2005, 62, 947–973. [Google Scholar] [CrossRef]
  9. Holben, B.N.; Tanre, D.; Smirnov, A.; Eck, T.F.; Slutsker, I.; Abuhassan, N.; Newcomb, W.W.; Schafer, J.S.; Chatenet, B.; Lavenu, F.; et al. An emerging ground-based aerosol climatology: Aerosol Optical Depth from AERONET. J. Geophys. Res. 2001, 106, 12067–12097. [Google Scholar] [CrossRef]
  10. Wang, L.L.; Wang, Y.S.; Xin, J.Y.; Li, Z.Q.; Wang, X.Y. Assessment and comparison of three years of Terra and Aqua MODIS Aerosol Optical Depth Retrieval (C005) in Chinese terrestrial regions. Atmos. Res. 2010, 97, 229–240. [Google Scholar] [CrossRef]
  11. Icholu, C.; Remer, L.A.; Eck, T.F. Quantitative evaluation and intercomparison of morning and afternoon MODIS aerosol measurements from the Terra and Aqua satellites. J. Geophys. Res. 2005, 110, 433–444. [Google Scholar]
  12. Barnes, W.L.; Xiong, X.X.; Salomonson, V.V. MODIS instrument status and operational activities. Proc. SPIE Earth Obs. Syst. IX 2004, 5542, 14–23. [Google Scholar]
  13. Remer, L.A.; Kleidman, R.G.; Levy, R.C.; Kaufman, Y.J.; Tanre, D.; Mattoo, S. Global aerosol climatology from the MODIS satellite sensors. J. Geophys. Res. Atmos. 2008, 113, 762–770. [Google Scholar] [CrossRef]
  14. Kaufman, Y.J.; Tanré, D.; Remer, L.A.; Vermote, E.F.; Chu, A.; Holben, B.N. Operational remote sensing of tropospheric aerosol over land from EOS moderate resolution imaging spectroradiometer. J. Geophys. Res. 1997, 102, 17051–17067. [Google Scholar] [CrossRef]
  15. Levy, R.C.; Remer, L.A.; Mattoo, S.; Vermote, E.F.; Kaufman, Y.J. Second generation operational algorithm: retrieval of aerosol properties over land from inversion of Moderate Resolution Imaging Spectroradiometer spectral reflectance. J. Geophys. Res. 2007, 112, 319–321. [Google Scholar] [CrossRef]
  16. Levy, R.C.; Remer, L.A.; Kleidman, R.G.; Mattoo, S.; Ichoku, C.; Kahn, R.; Eck, T.F. Global evaluation of the Collection 5 MODIS dark-target aerosol products over land. Atmos. Chem. Phys. 2010, 10, 10399–10420. [Google Scholar] [CrossRef] [Green Version]
  17. Levy, R.C.; Mattoo, S.; Munchak, L.A.; Remer, L.A.; Sayer, A.M.; Patadia, F.; Hsu, N.C. The Collection 6 MODIS aerosol products over land and ocean. Atmos. Meas. Technol. 2013, 6, 2989–3034. [Google Scholar] [CrossRef]
  18. Hsu, N.C.; Tsay, S.C.; King, M.D.; Herman, J.R. Aerosol properties over bright-reflecting source regions. IEEE Trans. Geosci. Remote Sens. 2004, 42, 557–569. [Google Scholar] [CrossRef]
  19. Hsu, N.C.; Tsay, S.C.; King, M.D.; Herman, J.R. Deep blue retrievals of Asian aerosol properties during ACE-Asia. IEEE Trans. Geosci. Remote Sens. 2006, 44, 3180–3195. [Google Scholar] [CrossRef]
  20. Hsu, N.C.; Jeong, M.J.; Bettenhausen, C.; Sayer, A.M.; Hansell, R.; Seftor, C.S.; Huang, J.; Tsay, S.C. Enhanced Deep Blue aerosol retrieval algorithm:The second generation. J. Geophys. Res. Atmos. 2013, 118, 9296–9315. [Google Scholar] [CrossRef]
  21. Sayer, A.M.; Hsu, N.C.; Bettenhausen, C.; Jeong, M.J. Validation and uncertainty estimates for MODIS Collection 6 “Deep Blue” aerosol data. J. Geophys. Res. Atmos. 2013, 118, 7864–7872. [Google Scholar] [CrossRef]
  22. Sayer, A.M.; Munchak, L.A.; Hsu, N.C.; Levy, R.C.; Bettenhausen, C.; Jeong, M.J. MODIS Collection 6 aerosol products: Comparison between Aqua’s e-Deep Blue, Dark Target, and “merged” data sets, and usage recommendations. J. Geophys. Res. Atmos. 2014, 119, 13965–13989. [Google Scholar] [CrossRef]
  23. Chu, D.A.; Kaufman, Y.J.; Ichoku, C.; Remer, L.A.; Tanré, D.; Holben, B.N. Validation of MODIS aerosol optical depth retrieval over land. Geophys. Res. Lett. 2002, 29. [Google Scholar] [CrossRef]
  24. Eck, T.F.; Holben, B.N.; Reid, J.S.; Dubovik, O.; Smirnov, A.; O’Neill, N.T.; Slutsker, I.; Kinne, S. Wavelength dependence of the optical depth of biomass burning, urban, and desert dust aerosols. J. Geophy. Res. 1999, 104, 31333–31349. [Google Scholar] [CrossRef]
  25. Ichoku, C.; Chu, D.A.; Mattoo, S.; Kaufman, Y.J.; Remer, L.A.; Tanre, D.; Slutsker, I.; Holben, B.N. A spatio-temporal approach for global validation and analysis of MODIS aerosol products. Geophys. Res. Lett. 2002, 29. [Google Scholar] [CrossRef]
  26. Zhang, X.Y.; Wang, Y.Q.; Niu, T.; Zhang, X.C.; Gong, S.L.; Zhang, Y.M.; Sun, J.Y. Atmospheric aerosol compositions in China: Spatial/temporal variability, chemical signature, regional haze distribution and comparisons with global aerosols. Atmos. Chem. Phys. 2012, 11, 779–799. [Google Scholar] [CrossRef]
  27. Nichol, E.J.; Bilal, M. Validation of MODIS 3 km Resolution Aerosol Optical Depth Retrievals Over Asia. Remote Sens. 2016, 8, 328. [Google Scholar] [CrossRef]
  28. Li, C.; Marufu, L.T.; Dickerson, R.R.; Li, Z.; Wen, T.; Wang, Y.; Wang, P.; Chen, H.; Stehr, J.W. In situ measurements of trace gases and aerosol optical properties at a rural site in northern China during East Asian Study of Tropospheric Aerosols: An International Regional Experiment 2005. J. Geophys. Res. Atmos. 2007, 112, 321–341. [Google Scholar] [CrossRef]
  29. Tao, M.H.; Chen, L.F.; Wang, Z.F.; Tao, J.H.; Che, H.Z.; Wang, X.H.; Wang, Y. Comparison and evaluation of MODIS Collection 6 aerosol data in China. J. Geophys. Res. Atmos. 2015, 120, 6992–7005. [Google Scholar] [CrossRef]
  30. Chen, H.; Cheng, T.; Gu, X.; Li, Z.; Wu, Y. Evaluation of polarized remote sensing of aerosol optical thickness retrieval over China. Remote Sens. 2015, 7, 13711–13728. [Google Scholar] [CrossRef]
  31. Bilal, M.; Nichol, J.E. Evaluation of MODIS aerosol retrieval algorithms over the Beijing-Tianjin-Hebei region during low to very high pollution events. J. Geophys. Res. Atmos. 2015, 120, 7941–7957. [Google Scholar] [CrossRef]
  32. Mi, W.; Li, Z.Q.; Xia, X.A.; Holben, B.; Levy, R.; Zhao, F.S.; Chen, H.B.; Cribb, M. Evaluation of the Moderate Resolution Imaging Spectroradiometer aerosol products at two Aerosol Robotic Network stations in China. J. Geophy. Res. 2007, 112, 321–341. [Google Scholar] [CrossRef]
  33. Kahn, R.A.; Nelson, D.L.; Garay, M.; Levy, R.C.; Bull, M.A.; Martonchik, J.V.; Diner, D.J.; Paradise, S.R.; Hansen, E.G.; Remer, L.A. MISR Aerosol product attributes and statistical comparisons with MODIS. IEEE Trans. Geosci. Remote Sens. 2010, 47, 4095–4114. [Google Scholar] [CrossRef]
  34. Xin, J.; Wang, Y.; Li, Z.; Wang, P.; Hao, W.M.; Nordgren, B.L.; Wang, S.; Liu, G.; Wang, L.; Wen, T.; et al. Aerosol optical depth (AOD) and Angstrom exponent of aerosols observed by the Chinese Sun Hazemeter Network from August 2004 to September 2005. J. Geophys. Res. 2007, 27, 1703–1711. [Google Scholar] [CrossRef]
  35. Li, Z.; Niu, F.; Lee, K.-H.; Xin, J.; Hao, W.-M.; Nordgren, B.; Wang, Y.; Wang, P. Validation and understanding of Moderate Resolution Imaging Spectroradiometer aerosol products (C5) using ground-based measurements from the handheld Sun photometer network in China. J. Geophy. Res. 2007, 112, 365–371. [Google Scholar] [CrossRef]
  36. Zhu, J.L.; Liao, H.; Li, J.P. Increases in aerosol concentrations over eastern China due to the decadal-scale weakening of the East Asian summer monsoon. Geophys. Res. Lett. 2012, 39. [Google Scholar] [CrossRef]
  37. Chan, C.K.; Yao, X.H. Air pollution in mega cities in China. Atmos. Environ. 2008, 42, 1–42. [Google Scholar] [CrossRef]
  38. He, M.; Zheng, J.Y.; Yin, S.S. Trends, temporal and spatial characteristics, and uncertainties in biomass burning emissions in the Pearl River Delta, China. Atmos. Environ. 2011, 45, 4051–4059. [Google Scholar] [CrossRef]
  39. Wang, Y.S.; Xin, J.Y.; Li, Z.Q.; Wang, S.G.; Wang, P.C.; Hao, W.M.; Nordgren, B.L.; Chen, H.; Wang, L.; Sun, Y. Seasonal variations in aerosol optical properties over China. J. Geophy. Res. Atmos. 2011, 8, 8431–8853. [Google Scholar] [CrossRef]
  40. Xin, J.Y.; Wang, L.L.; Wang, Y.S.; Li, Z.Q.; Wang, P.C. Trends in aerosol optical properties over the Bohai Rim in Northeast China from 2004 to 2010. Atmos. Environ. 2011, 45, 6317–6325. [Google Scholar] [CrossRef]
  41. Wang, D.; Morton, D.; Masek, J.; Wu, A.; Nagol, J.; Xiong, X.; Levy, R.; Vermote, E.; Wolfe, R. Impact of sensor degradation on the MODIS NDVI time series. Remote Sens. Environ. 2012, 119, 55–61. [Google Scholar] [CrossRef]
  42. Lyapustin, A.; Wang, Y.; Xiong, X.; Meister, G.; Platnick, S.; Levy, R.; Franz, B.; Korkin, S.; Hilker, T.; Tucker, C.J.; et al. Science impact of MODIS C5 calibration degradation and C6+ improvements. Atmos. Meas. Technol. 2014, 7, 4353–4365. [Google Scholar] [CrossRef]
  43. Sayer, A.M.; Hsu, N.C.; Bettenhausen, C.; Jeong, M.J.; Meister, M. Effect of MODIS Terra radiometric calibration improvements on Collection 6 Deep Blue aerosol products: Validation and Terra/Aqua consistency. J. Geophys. Res. Atmos. 2015, 120, 12157–12174. [Google Scholar] [CrossRef]
  44. Cheng, T.; Chen, H.; Gu, X.; Yu, T.; Guo, J.; Guo, H. The inter-comparison of MODIS, MISR and GOCART aerosol products against AERONET data over China. J. Quant. Spectrosc. Radiat. Transf. 2012, 113, 2135–2145. [Google Scholar] [CrossRef]
Figure 1. Geographical locations of the background Beijing Forest site (BJF) on the Donglingshan Mountain and the urban site (BJC) in Beijing City: (left) China altitude map; and (right) land cover map of the two Chinese Sun Hazemeter Network (CSHNET) observations sites. The land cover type map is from MODIS MCD12Q1 Collection 5.1 product for 2012 with a resolution of 500 m.
Remotesensing 08 00754 g001
Figure 2. Time series of monthly average ground-observed AOD and Angstrom exponent (α) at: BJF (a); and BJC (b) sites from August 2004 to December 2013. The red bars and the blue dotted lines are the ground-observed AOD and α, respectively.
Remotesensing 08 00754 g002
Figure 3. Annual average MODIS AOD and their trend variations over ten years at: BJF (a); and BJC (b) sites. The grey circles, blue squares and red triangles are the annual average AOD per year (from 2004 to 2013), the annual average AOD during the entire ten years and the MODIS AOD trend variations over the ten years, respectively. The text below the x-axis is constituted by satellite name, and the abbreviations of Collection version and retrieval algorithm.
Remotesensing 08 00754 g003
Figure 4. Frequency scatter plots of MODIS daily AOD versus ground-observed daily AOD at BJF site (ah); and C5 DT versus C6 DT (i,j). The AOD data are sorted into multiple cases according to the ordered pairs ((Observed, and MODIS) AOD or (C5 DT, and C6 DT) AOD) at an interval of 0.05. The colorful dots represent the number of ordered pairs in every particular case, shown specifically by the color bar beside (j). The dotted and dashed, dashed, and solid lines are the 1-1 line, the Expected Error (EE) of ±(0.05 + 0.15τ), and the linear regression of the pre-sorted scatters, respectively. The text on the top is constituted by satellite name, and the abbreviations of Collection version and retrieval algorithm. Text in the upper left describes: the site name, the number of matchups (N), the linear fitting equation, the correlation coefficient (R), and the Root Mean Square Error (RMSE) from top to bottom.
Remotesensing 08 00754 g004aRemotesensing 08 00754 g004b
Figure 5. Scatter plots of MODIS monthly AOD versus Observed monthly AOD at BJF site. (ah) For C5 to C6 products from Terra and Aqua. The colorful shapes represent four different seasons: the green squares, the light blue circles, the orange triangles, and the dark blue rhombuses are for spring, summer, autumn, and winter, respectively. The black dotted and dashed, dashed, and red solid lines are the 1-1 line, the Expected Error (EE) of ±(0.05 + 0.15τ), and the linear regression of all the pairs, respectively. The text on the top is constituted by satellite name, and the abbreviations of Collection version and retrieval algorithm. Text in the upper left describes: the site name, the number of matchups (N), the linear fitting equation, the correlation coefficient (R), and the Root Mean Square Error (RMSE) from top to bottom.
Remotesensing 08 00754 g005
Figure 6. Frequency scatter plots of MODIS daily AOD versus ground-observed daily AOD at BJC site from (ah); and C5 DT versus C6 DT from (i,j). The AOD data are sorted into multiple cases according to the ordered pairs ((Observed, and MODIS) AOD or (C5 DT, and C6 DT) AOD) at an interval of 0.05. The colorful dots represent the number of ordered pairs in every particular case, shown specifically by the color bar beside (j). The dotted and dashed, dashed, and solid lines are the 1-1 line, the Expected Error (EE) of ±(0.05 + 0.15τ), and the linear regression of the pre-sorted scatters, respectively. The text on the top is constituted by satellite name, and the abbreviations of Collection version and retrieval algorithm. Text in the upper left describes: the site name, the number of matchups (N), the linear fitting equation, the correlation coefficient (R), and the Root Mean Square Error (RMSE) from top to bottom.
Remotesensing 08 00754 g006aRemotesensing 08 00754 g006b
Figure 7. Scatter plots of MODIS monthly AOD versus Observed monthly AOD for at BJC site. (ah) For C5 to C6 products from Terra and Aqua. The colorful shapes represent four different seasons: the green squares, the light blue circles, the orange triangles, the dark blue rhombuses are for spring, summer, autumn, and winter, respectively. The black dotted and dashed, dashed, and red solid lines are the 1-1 line, the Expected Error (EE) of ±(0.05 + 0.15τ), and the linear regression of all the pairs, respectively. The text on the top is constituted by satellite name, and the abbreviations of Collection version and retrieval algorithm. Text in the upper left describes: the site name, the number of matchups (N), the linear fitting equation, the correlation coefficient (R), and the Root Mean Square Error (RMSE) from top to bottom.
Remotesensing 08 00754 g007
Figure 8. Time series of monthly average errors ((MODIS-Observed)AOD) and their trend variations at BJF (ad); and BJC (eh). Only collocated daily data are included. The blue solid line, red solid line and black dashed line represent the error for Terra, Aqua and zero line, respectively.
Remotesensing 08 00754 g008aRemotesensing 08 00754 g008b

