Abstract
The intentional damage to local Cultural Heritage sites carried out in recent months by the Islamic State have received wide coverage from the media worldwide. Earth Observation data provide important information to assess this damage in such non-accessible areas, and automated image processing techniques will be needed to speed up the analysis if a fast response is desired. This paper shows the first results of applying fast and robust change detection techniques to sensitive areas, based on the extraction of textural information and robust differences of brightness values related to pre- and post-disaster satellite images. A map highlighting potentially damaged buildings is derived, which could help experts at timely assessing the damages to the Cultural Heritage sites of interest. Encouraging results are obtained for two archaeological sites in Syria and Iraq.
1. Introduction
The significance of remote sensing in “exploration, identification and documentation and in monitoring archaeological heritage in the living landscape” has been vigorously highlighted during the 11th Europae Archaeologiae Consilium Heritage Management Symposium in 2010 [1]. Remote sensing applications for the aforementioned purposes bear a twofold utility, since, on one hand, they consist of distant non-destructive techniques, and, on the other hand, they cover broad areas instantly, enriching the information on Cultural Heritage (CH) sites in their context through landscape coverage [1,2].
When the Islamic State (IS) was rumored in the media to have destroyed CH sites in Syria and Iraq—in the cities of Palmyra and Nimrud, respectively—officials could not reach the areas in person to confirm the damage. Therefore, European Space Imaging (EUSI) supplied the Orient Department of the German Archaeological Institute (DAI) very high-resolution (VHR) imagery to safely assess the situation on the ground. The images have been processed and analyzed by remote sensing experts of the German Aerospace Center (DLR). A visual analysis confirmed the destruction of several sites as claimed by the IS, such as the Temple of Bel and several ancient tower tombs within Palmyra’s Valley of the Tombs [3], and Nimrud archaeological site in Iraq.
If, as in the described case, change detection for damage assessment is performed by visual analysis on large areas, it becomes a difficult and time-consuming activity, and the knowledge acquired from its results could be incomplete. Specifically, damaged areas could remain undetected for an observer, if the time available for the analysis is limited. Furthermore, in particular, the case studies under examination were inaccessible to any legal authority in order to perform a first in situ visual inspection by traditional means.
Automatic analysis of Earth Observation (EO) data has been successfully employed for several archaeological applications, especially the systematic detection of CH sites. In [4], pan-sharpened multispectral QuickBird (DigitalGlobe, Westminster, CO, USA) images are exploited to detect crop marks related to buried archaeological remains. An image based methodology for the detection of archaeological buried relics using multi-temporal satellite imagery was derived in [5] observing the phenological cycle of the crops. Automatic detection of ancient Arabian tombs through high-resolution satellite imagery was proposed in [6], while an automatic detection of ancient circular structures based on VHR QuickBird images in southeast Norway has been described in [7]. Monitoring and risk assessment of CH sites at landscape scale have been proposed in [8] by integrating a variety of satellite sensors bearing different spatial and spectral resolutions, using Geographic Information Systems (GIS) to cluster cultural heritage sites and monuments with similar characteristics. Very recently, previously undocumented cities in Cambodia have been mapped beneath vegetation using airborne lidar [9].
Although automatic methods are often used as in the examples listed above, damage detection to CH sites is usually carried out by visual analysis [10,11,12]. In this paper, we propose applying a change detection algorithm to solve this problem, going towards the automatic production of maps where areas suspected of having suffered damages are highlighted. We base our results on differences of texture features and brightness values, and choose robust detectors in order to obtain a reliable change map if the images present co-registration errors, or are affected by geometric distortions caused by different acquisition angles. The map contains a potential set of sensitive areas on which a more detailed analysis should be carried out by the experts. In this work, two different archaeological sites are taken into account: Palmyra in Syria and Nimrud in Iraq. In the former, three available images are exploited to successfully visualize the evolution in time of the detected damages. In the latter, changes are detected for the hard case of images acquired by different sensors, in different seasons, and with different quality. In spite of these difficulties, the captured changes reflect, to an acceptable extent, the damage occurred in the area.
The availability of high-resolution satellite images is steadily increasing, along with their quality and temporal resolution. In cases where there is accessibility to the sites of interest, the proposed methodology could be only a preliminary solution prior to any visit on the spot, but it may represent the only non-invasive way of observing and recording changes in the archaeological landscape for conflict areas and inaccessible sites in general.
The paper is structured as follows. Section 2 describes the features used to carry out the damage detection. Experimental results are described in Section 3, along with an introduction to the archaeological sites of Palmyra and Nimrud and to some of the relevant monuments which suffered damages from terrorist activities. We conclude in Section 4.
2. Robust Change Detection
The aim of a change detection algorithm is to provide a map of changes given as input two or more images acquired at different times over the same area. For the applications described in this paper, the desired output should highlight the locations of monuments that suffered damage or changes in a short time span. Nevertheless, automatic change detection techniques may be difficult to apply in practice. For example, the differences between pre- and post-event images may be difficult to obtain in a reliable way if the acquisition dates of the two images are too far away. Even if this is not the case, a pixel-based analysis is difficult to carry out even after an accurate co-registration step, as often no high-resolution Digital Surface Model (DSM) is available. In this case, images may exhibit orthorectification errors, and the differences in view angle introduce, in turn, pronounced geometric distortions. In this paper, we rely on robust features for these aspects, namely Gabor texture features and Robust Differences (RD) based on brightness levels. The two contain complementary information and may be combined in a final step.
2.1. Gabor Features
Gabor features are robust to two-dimensional shifts in space, and are traditionally employed in edge detection and edge characterization tasks [13]. They can be described as a windowed Fourier analysis, compensating for the lack of spatial dependency of features in the frequency domain. This means that they can capture the interactions between neighbouring pixels in a local window quantifying the roughness or smoothness in a specific point, along with its scale and orientation. A bank of Gabor filters usually consists of a set of complex linear filters encompassing the characteristics that stand out for the human eye and agreeing well with how the human visual system’s 2D receptive field works [14]. Each element in the filter bank is derived by multiplying a complex exponential representing a two-dimensional wave by a Gaussian function, which acts as an envelope. For example, in Figure 1, different orientations and scales of the two-dimensional waves are reported, with the envelope being the weighting function suppressing the response of the filter as a function of the distance from its center. The higher the frequency of the captured texture, the smaller the envelope can be. Therefore, each component in the filter bank can be defined in its discrete form by varying the frequency f and the orientation θ of the plane waves as proportional to:
where k and l are the extension in number of pixels of the filter, usually with , and the variance of the Gaussian function used to define the envelope: the smaller the σ, the smaller the effective area in which a specific texture detector for one orientation and scale is applied. An example for the real parts of the filter bank used in the experiments contained in this paper is reported in Figure 1. Before their application, the filters should be multiplied by a normalization factor chosen in order to have the sum of the responses of the filter to the same sinusoidal function as 1 [15]. The filter banks in Equations (1) and (2) are convolved with the image to generate the response centered at each pixel as and . The final value for the response of a pixel to a specific filter in the filter bank is then computed as:
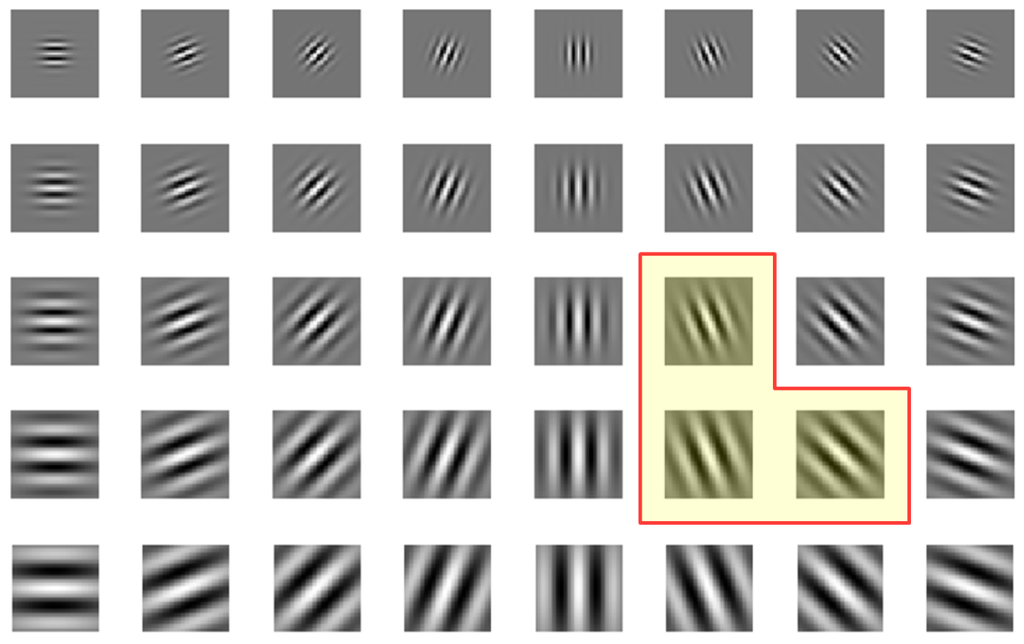
Figure 1.
Real parts of the Gabor filter bank used in the experiments in this paper according to the different orientations and scales. Highlighted are the filters giving the highest contribution to the detection to be described in next section.
This value is proportional to the similarity of the observed area with the gray-value distribution for a given frequency and orientation in the filter bank. Some generic experiments on damage detection using Gabor features have been carried out in [16]. In our case, for two coregistered images acquired at and , the difference in texture for an image element at location for a given frequency f, rotation θ and spread σ are quantified as:
and are the results of independently applying Equation (3) to the same image element in the two images.
2.2. Robust Differences
Region-based or grid-based comparison are among other approaches proposed to solve the aforementioned problems [17,18]. For efficient and fast results, Robust Difference (RD) has been initially proposed by Castilla et al. [19] and successfully applied to compare DSMs [20]. The RD distance is based on the assumption that the corresponding pixels of two images show the minimum intensity value differences within a small region, especially when the images were captured by the same sensor. An RD between the pre-disaster image X and a post-disaster image Y for a pixel at coordinates can be defined as the minimum of differences computed between the pixel in the post-disaster image and a certain neighborhood (with window size ) of the pixel in the pre-disaster image X. The relative to the pixel at location is defined as:
where:
- image coordinates,
- maximum distance in pixels from ,
- = coordinates of set of pixels in the neighbourhood centered around .
This means that only the minimum value of the absolute difference is taken into account, all within the defined window size, which should be adjusted based on the scale of the occurred changes. Typically used window sizes are square and range from up to pixels depending on the amount of geometric distortions caused by different acquisition angles and differences between the original spatial resolution of the two available images. As the input images are multispectral, the RDs are computed for each channel separately; subsequently, their chi-distances are summed to produce the final change map. The RD is, by definition, robust to geometric distortions caused by differences in the terrain and to errors introduced in the co-registration step. Given that it relies on absolute brightness values differences, the use of this method should be restricted to images acquired by the same sensor.
3. Experiments
We analyse the archaeological sites of Palmyra and Nimrud, located respectively in Syria and Iraq (see Figure 2), which have been reported to have suffered damage from terrorist activities in 2015.
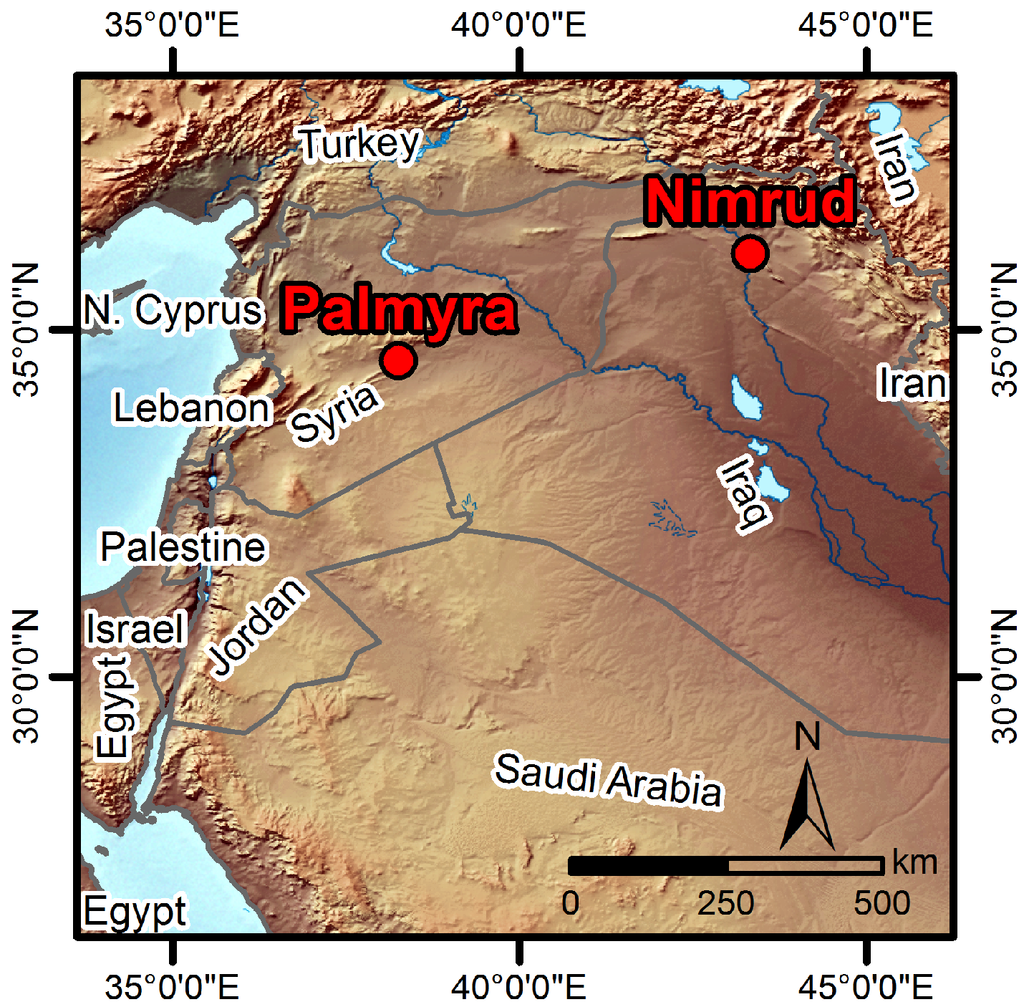
Figure 2.
Map showing the locations of the two sites analyzed in this paper.
3.1. Palmyra
The first case study concerns a part of the large archaeological site of Palmyra situated in the Syrian Desert northeast of Damascus. The archaeological vestiges of the ancient Roman city have been listed in the UNESCO World Heritage since 1980, while from 2013 until today, the site has been on the List of World Heritage in Danger (Article 11 (4) of the World Heritage Convention) [21]. The monumental ruins belong to an ancient city that flourished between the 1st and 3rd century A.D., as part of the Roman Empire. Due to its geographical position, Palmyra was a major trading center and bridging route during antiquity between the Mediterranean and the Euphrates. One of the first archaeological excavation missions undertaken in the area focused on the Sanctuary of Bel [22,23], situated in the southeastern part of the walled city, which is of particular interest for the results collected in the present paper. The Temple dates back to the Hellenistic period and received several architectural modifications throughout the first two centuries A.D., which make it of great importance according to scholars for its rich and diverse architectural details [24,25]. The Temple of Bel most probably comprises the first building of the sanctuary, and it is located approximately in its center: it will be clear in the next section how this structure suffered the worst damage.
Outside the walls of the city of Palmyra, its ancient necropolis can be found. The western one, better known as Valley of the Tombs, is relevant for our analysis. This cemetery contains some impressive constructions belonging to the architectural type of tower tombs. These were erected during the 1st and 2nd centuries A.D. to serve the wealthy inhabitants of the city: their existence and preservation, along with the study of the burial items found within, represent an important source of information for the culture and traditions of the elite class of that time. The tower tombs contained rich decoration such as wall paintings, funerary sculptures, inscriptions, and sarcophagi. Photographic documentation of the described sites is reported in Figure 3.
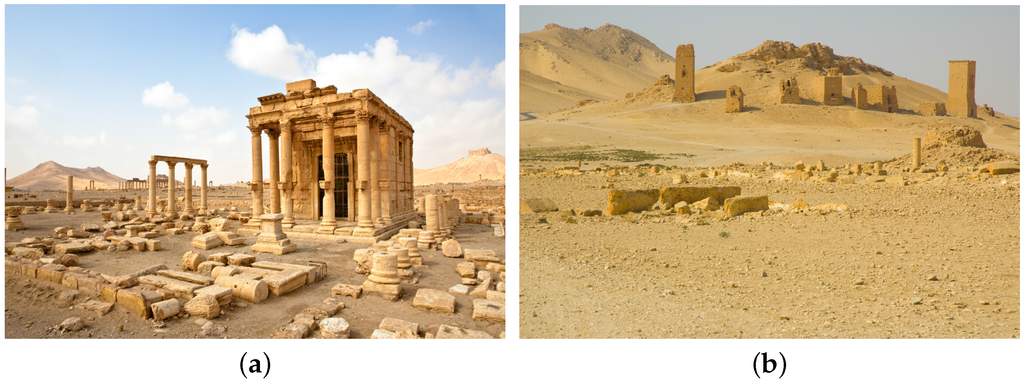
Figure 3.
Palmyra’s archaeological site: Temple of Bel (a) ©Dario Bajurin and tower tombs in the background (b) ©szymanskim.
Figure 4 and Figure 5 report the subsets of two WorldView-2 datasets acquired outside the city center of Palmyra, Syria, on the 27th of August and on the 2nd of September 2015, respectively. Henceforth, we refer to these two dates as and . At time , the IS had already destroyed several CH sites in the area. Between and , other tower tombs and the Temple of Bel were damaged. In the figures, the Temple of Bel is located in the southeast, while the tower tombs are scattered in the northwestern part of the image. The available images exhibit some pronounced orthorectification errors, as no high-resolution DSM is available. In this case the RD may yield more reliable results, as discussed in Section 2.2. In our first step, the co-registration of the images has been refined by automatically deriving 1000 Ground Control Points by matching of Scale Invariant Feature Transform features [26] between the two images, and by warping the image acquired at time using as reference the image acquired at time .
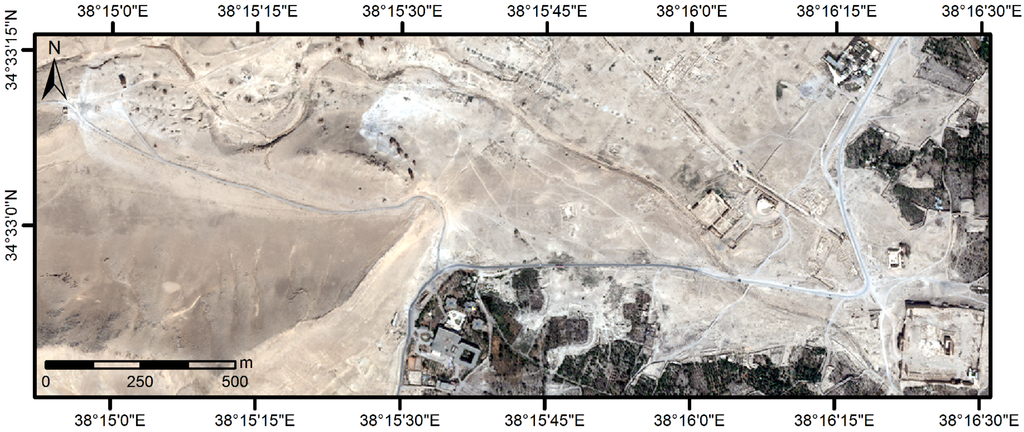
Figure 4.
Subset of the WorldView-2 image acquired on the 27 August 2015 (©European Space Imaging/DigitalGlobe).
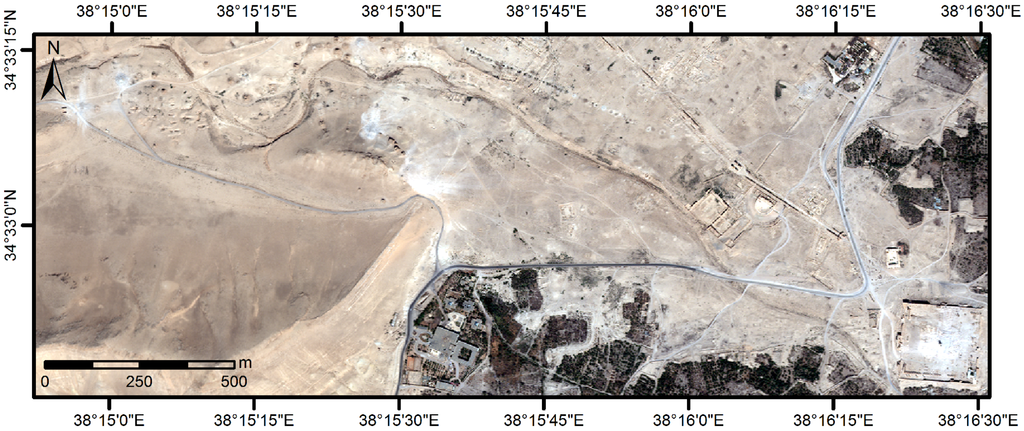
Figure 5.
Subset of the WorldView-2 image acquired on the 2 September 2015 (©European Space Imaging/DigitalGlobe).
A Gabor filter bank comprising features in a window of size at five scales and eight orientations, for a total of 40 filters, is derived according to [27], with the real parts of the filters reported in Figure 1. In the figure, the most important features for the analysis carried out in the rest of this section are highlighted.
The mean differences in responses obtained applying Equation (4) to the red spectral bands of the two images with the described set of features yields the change map in Figure 6a. We choose the red band as it consistently exhibits the best quality for the WorldView-2 sensor, independently from the off-nadir acquisition angle [28]. The main damages are correctly identified, and false alarms are limited although present. The most useful Gabor features highlighted in Figure 1 are related to the scale of the objects of interest and the shadow orientation, dependent on the sun’s elevation angle.
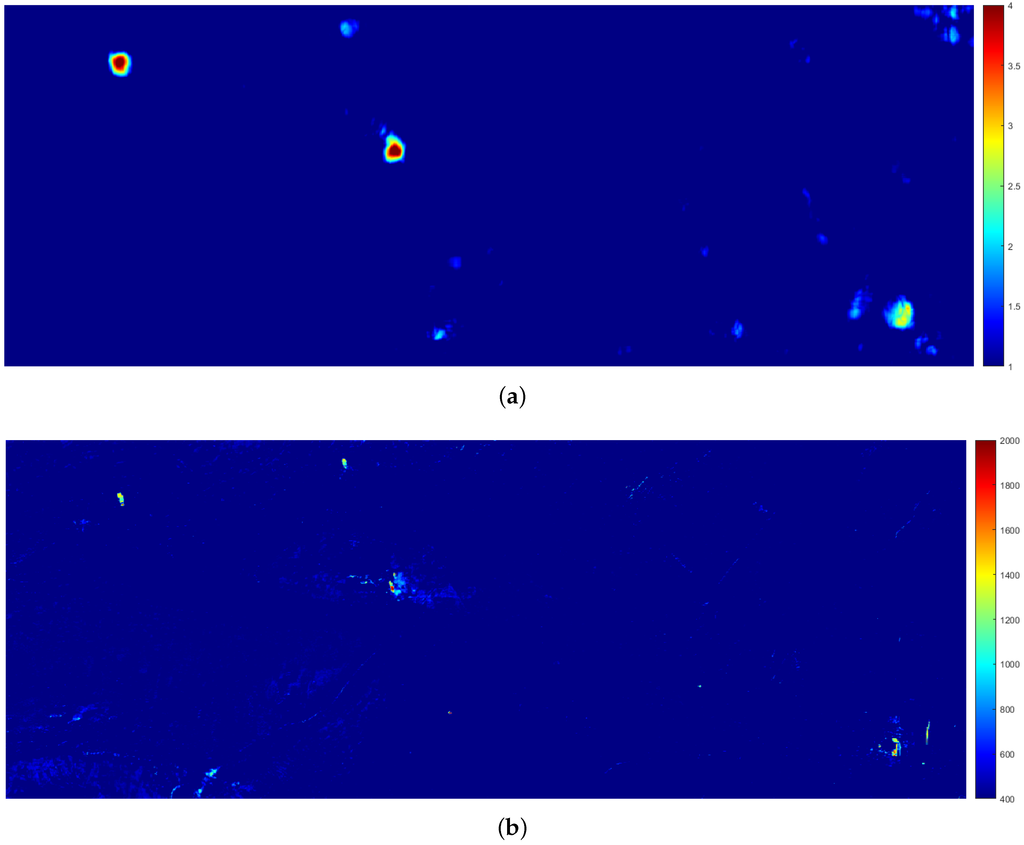
Figure 6.
Preliminary change maps derived from differences of Gabor features (a) and Robust Differences (b). A limited number of false alarms is visible in both.
As additional features, RD are computed as in Equation (5) using a window of size , which was found to give more robust results. The absolute value of the RD, representing the confidence that a real change has taken place for a given pixel, is reported in Figure 6b. Results agree well with the ones in Figure 6a, while false alarm locations are not correlated in the two maps.
In order to produce an overall change map, the values in the two preliminary maps are rescaled to the same range of values and the two are summed. Results are reported in Figure 7 and could represent in themselves useful tools for further investigations for an expert. To derive a binary change map, final changes are highlighted from a manually thresholded version of the change map. In Figure 7, the color stretch has also been set according to the selected threshold. Afterwards, a single pass of morphological opening and closing is applied. The structuring element of choice was a disc of size 3, corresponding to a square window filled with ones, with zeros in the four corners.
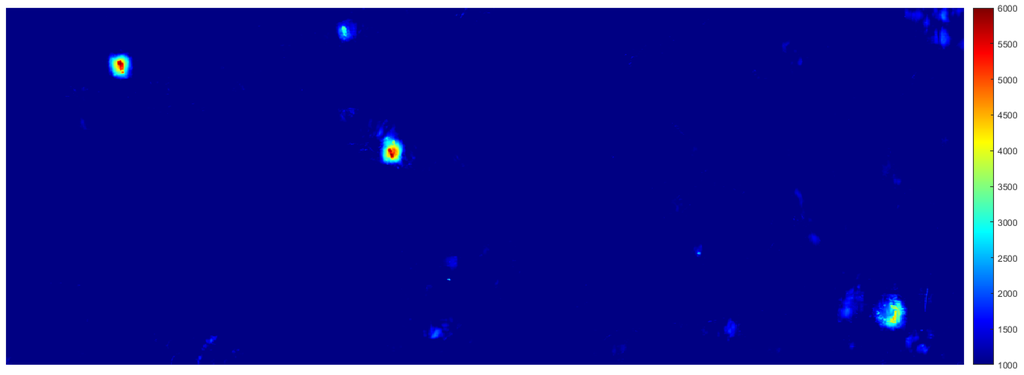
Figure 7.
Change map obtained combining the results in Figure 6a,b. The impact of false alarms is mitigated and the four targets stand out clearly.
Final results are overlaid in red on the image acquired at time in Figure 8. As validation, we refer to the report on the situation in Palmyra in [29], for which a map representing all relevant CH sites destroyed was produced and is reported in Figure 9. According to the report, between and the following monuments have been destroyed: the Temple of Bel, the tomb of Elahbel, the tomb of Kithoth in the northern part of the necropolis, the tomb of Julius Aurelius Bolma, and tomb #71 near the tomb of Iamliku.

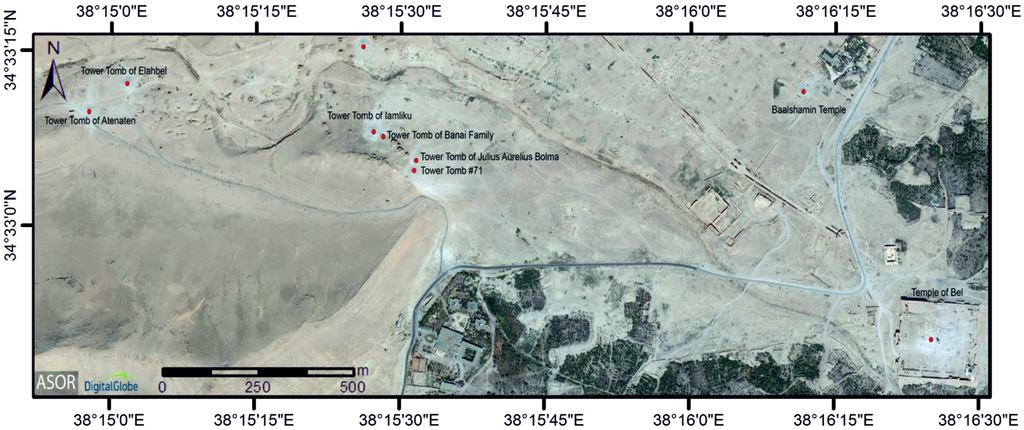
Figure 9.
Report from [29] showing destroyed CH sites in Palmyra. This map was used as validation for the detected damaged areas (©ASOR CHI/DigitalGlobe).
All of the tower tombs in the image destroyed by the IS between and are correctly detected from the algorithm, as well as the central part of the Temple of Bel on the right of Figure 8. No false alarms are present.
As anticipated in Section 2.1, the most useful Gabor features are the ones highlighted in Figure 1. It is interesting to consider the correspondences between these features and the damaged objects in the scene. On the one hand, the scale of the Gabor filters in the filter bank is comparable to the scale of the damaged objects. On the other hand, the orientations of the filters seem to agree with the sun position, whose variation is not a cause of concern if the data are acquired by a satellite characterized by a heliosynchronous orbit.
There are additional CH sites in the same area that had suffered damage before the acquisition time of the first image we had available. In [29], from which Figure 9 is reported, several of these sites are identified, and include the tower tombs of Atenaten, Iamliku, and the Banai family, and the temple of Baalshamin. As no previous acquisition was available for further analysis, we rely on an image extracted from Google Earth (version 7.1.5.1557, Google Inc., Mountain View, CA, USA), acquired on the 20 February 2014, which we refer to as time . The image reported in Figure 10 shows all relevant monuments still intact.
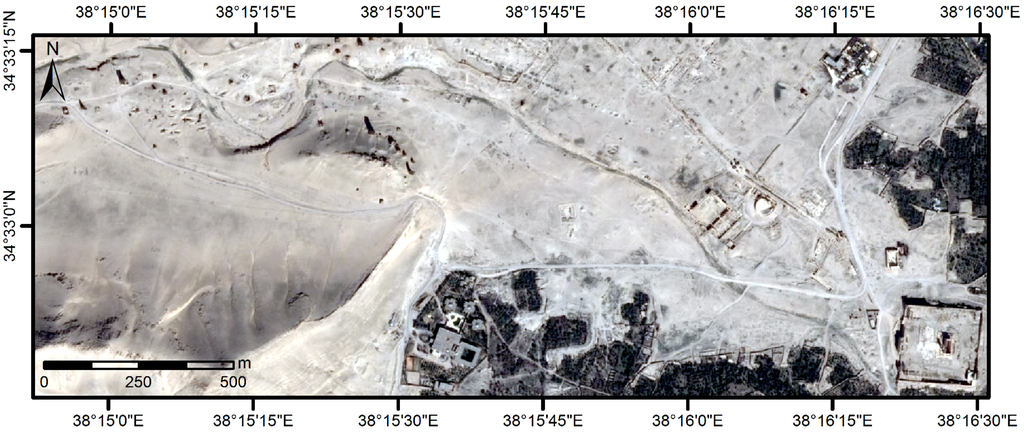
Figure 10.
Pre-disaster image acquired on the 20 February 2014, screenshot from Google Earth (©DigitalGlobe).
The image is coregistered to the image acquired at time and differences based on Gabor features are computed as in the previous experiment. The final results are reported in Figure 11. All previous damaged areas are detected, plus additional ones which correctly correspond to the temple of Baalshamin (in the north-eastern part of the image), the Tombs of Iamliku with the Tomb of the Banai family directly to its east (merged in a single area), and the tomb of Atenaten in the northwest. Only two false alarms are visible in the lower central part of the image. Therefore, the results agree well with the reported sites in Figure 9.
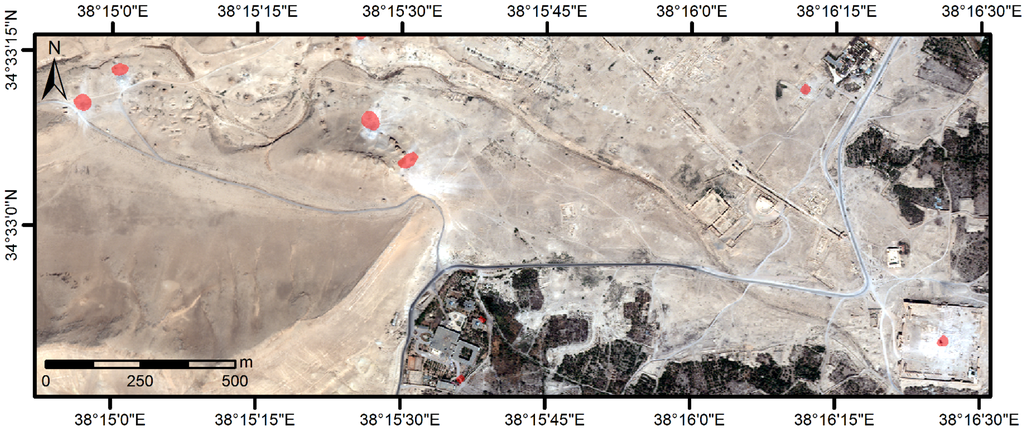
Figure 11.
red: post-processed changes overlaid on the 2 September 2015 WorldView-2 image reported in Figure 5. All the main damaged areas are correctly identified with two small false alarms in the southern part of the image (©European Space Imaging/DigitalGlobe).
A multitemporal representation of the damage suffered by the site of Palmyra can be derived by overlaying the detected damaged areas between images acquired at times , and in different colors. An example is reported in Figure 12, in which the first areas damaged are highlighted in blue and the more recent ones in red.

Figure 12.
Multitemporal representation of damage overlaid on the 2 September 2015 WorldView-2 image reported in Figure 5 (©European Space Imaging/DigitalGlobe). Damage that occurred between and and between and is highlighted in blue and red, respectively.
3.2. Nimrud
The second case study focuses on the site of Nimrud, located to the south of Mosul in what is today modern Iraq, adjacent to the Tigris River in northern Mesopotamia. Archaeological evidence dates the site back to the 13th century B.C., with the city experiencing a period of great flourishing during the 9th century B.C. as the second capital of the Assyrian empire. Archaeological excavations at the Nimrud site started in 1845 and lasted with various intervals until the 1990s, revealing the splendor of this civilization with its walled Acropolis, of which the most representative buildings are the Northwest Palace with its Throne room, and the Ezida monumental building including the sanctuary of Nabu, the god of science and learning [30], located at the southeast end of the acropolis. Both of these ancient buildings are of interest for our analysis in this section. The site, at the time at which this paper was written, is on the UNESCO Iraqi Tentative List sites [31]. For the sake of clarity, a topographic map of the place as produced by the Mallowan expedition in 1966 is reported in Figure 13. The map has been rotated by 90 degrees in clockwise order to facilitate the comparison with the satellite images that have a standard orientation to the north.
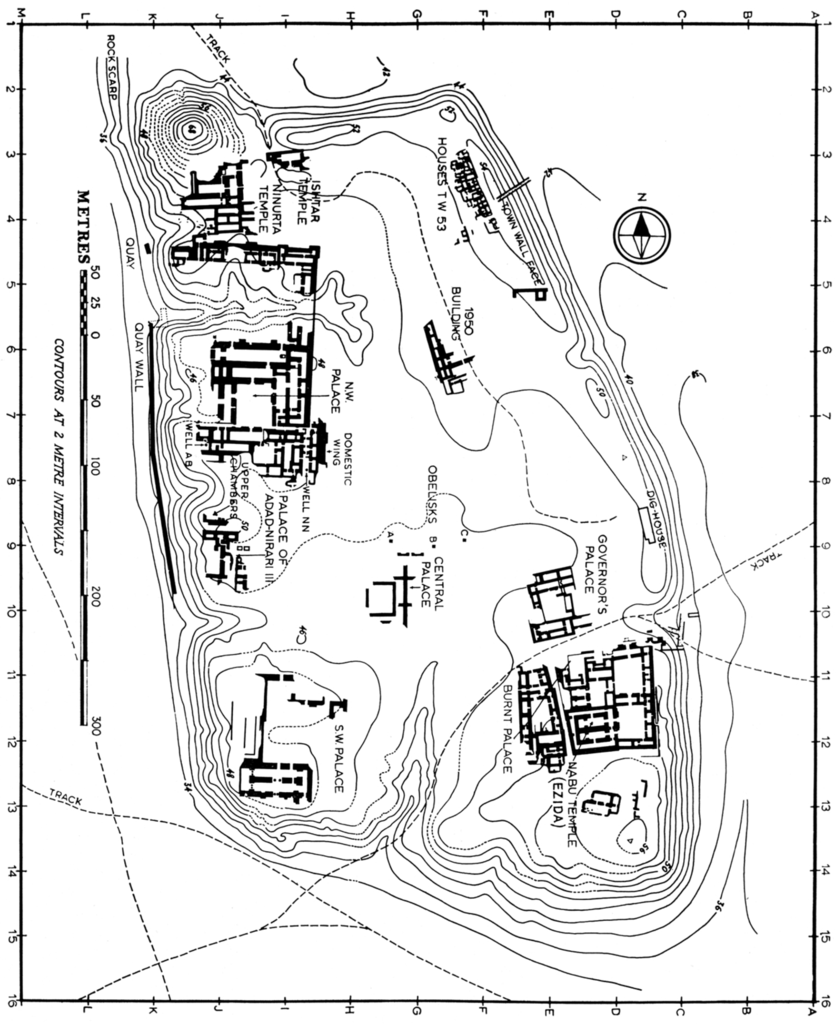
Figure 13.
Nimrud archaeological site topographic map.
The change detection methodology based on differences in Gabor features has been applied to a dataset of a GeoEye-1 pre-event (11 July 2011, ) and a WorldView-2 post-event (20 April 2015, ) image acquired over the site of Nimrud. Due to the fact that the images have been acquired by different sensors, RD features have not been extracted from these data.
The pre- and post-destruction images are reported in Figure 14. The Northwest Palace (visibly damaged in the image acquired at time ) lies in the northwestern part of the image, while the Temple of Nabu is located in the southeast.
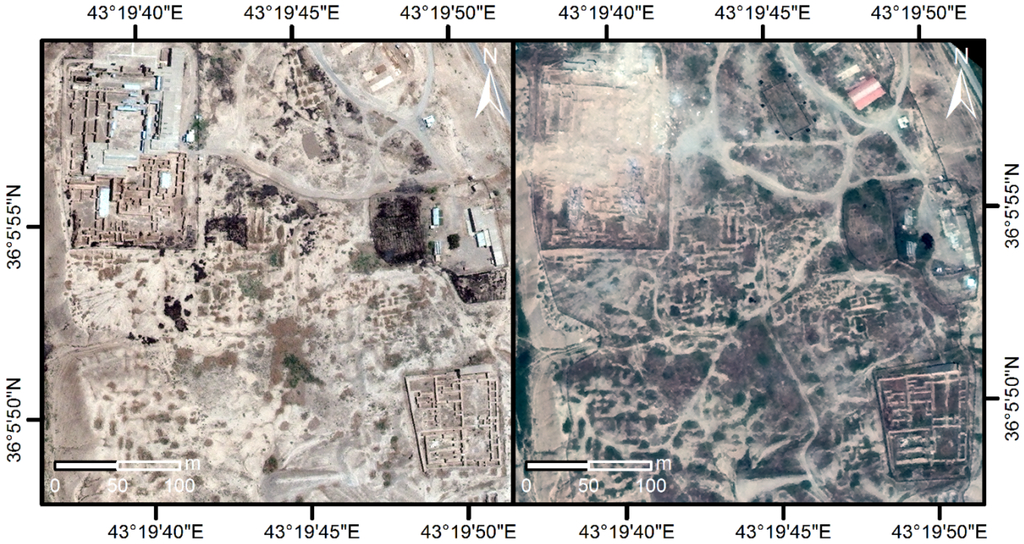
Figure 14.
(left) Nimrud pre- (GeoEye-1, 11 July 2011) and (right) post-event image (WorldView-2, 20 April 2015) (©European Space Imaging/DigitalGlobe).
This analysis presents several additional difficulties with respect to the previous case of study. First of all, the available images have been acquired from sensors at different spatial resolution and characterized by different spectral responses. Furthermore, the vegetation in the two appears very different, precluding every kind of analysis based on brightness difference. The sun’s elevation angle is very different in the two images (see the shadow directions in Figure 14). The image quality also varies considerably, as the image acquired at time appears blurred: this implies that detected differences at the highest frequencies should not be expected to be reliable. In the first step, the high-resolution image was spatially downsampled in order to match the low-resolution image, and the two datasets have been coregistered. Subsequently, the same Gabor filter bank used in the previous experiment has been applied. The relevant differences in texture are reported in Figure 15. The results are satisfactory as the extracted features are robust to the relevant differences in average brightness levels, which can be appreciated in the images. Most of the detected damage is concentrated in the Northwest Palace, with the major distinguishable damage related to the inner rooms of the building (Figure 14). Some detected changes in the image are positive ones, and include modern facility buildings built between and (see the building in the central eastern direction). The exact estimated extent of the damage to the Northwest Palace is reported in [32]. Nevertheless, the general quality of the results is decreased compared to the ones obtained for the Palmyra site. Some false alarms are to be seen, and some visible differences such as a newly constructed red building on the NE of the image acquired at time are not detected. A possible reason for this case could be that differences in texture are not strong enough, as the area where the new building appears was already relatively smooth at time . As a result of destruction, smooth textures are often replaced by rough surfaces instead, facilitating the detection process.
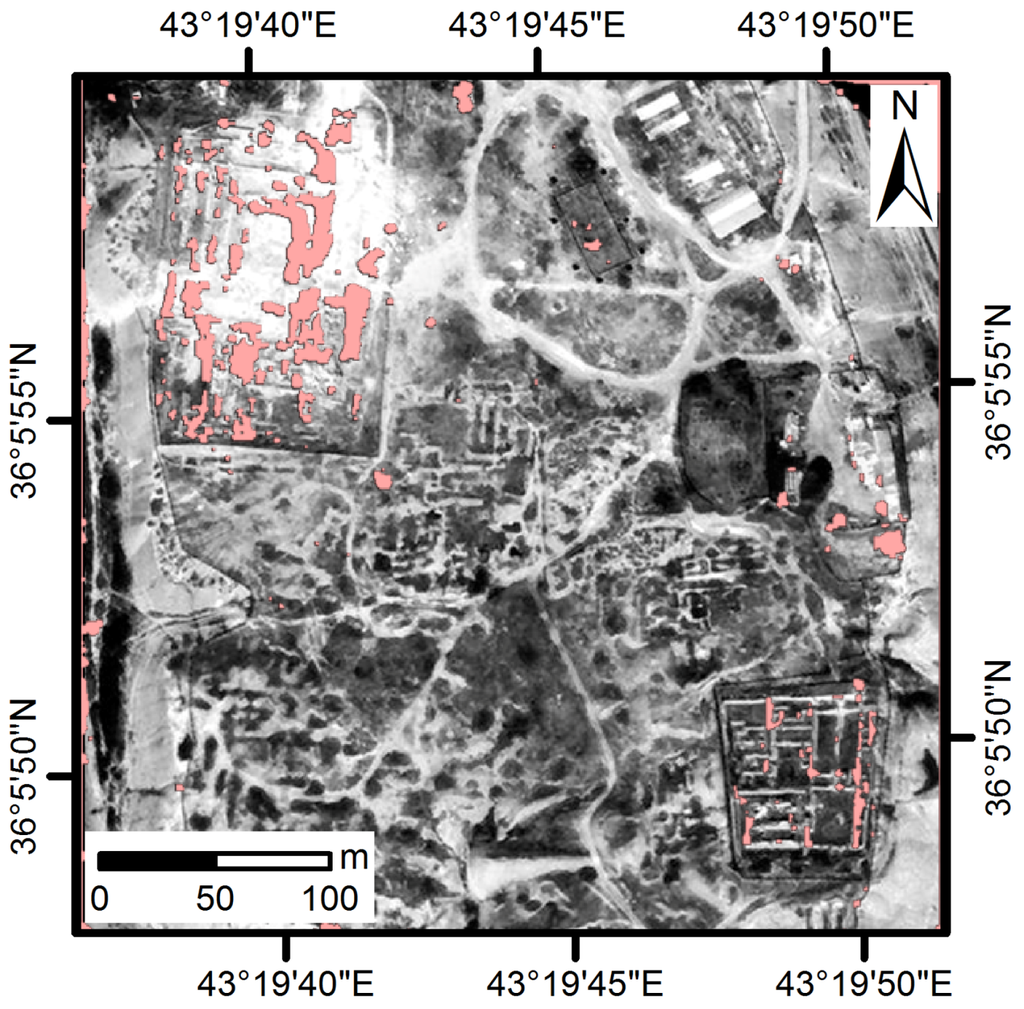
Figure 15.
Nimrud change map, overlaid on the post-destruction image (WorldView-2, 20 April 2015).
Of particular interest is the less pronounced but visible damage detected at the Temple of Nabu, which appears to be concentrated on the eastern walls. Official news had no clear assessment for this and reported that “the Iraqi Ministry of Tourism and Antiquities says IS bulldozed parts of the site, but the extent of the damage isn’t yet clear” [33]. Under a closer inspection, sections of both the outer and inner eastern walls appear indeed to be missing after damage in Figure 14. The Nabu Temple, most notably in its entrance gate in the northern wall, has suffered severe additional damage after [34].
4. Conclusions
The importance of remotely sensed EO data for archaeological applications has been widely acknowledged in recent years, and it has been highlighted in the European Landscape Convention promoting integrated landscape protection, management and planning [35]. Recent historical events constitute unprecedented threats for many cultural sites of universal interest in non-accessible areas, increasing the importance of detailed damage assessment maps acquired from remote sources for CH authorities, image analysts and stakeholders.
Such change detection applications are usually carried out visually: this paper takes a step towards decreasing the degree of supervision needed for the production of such maps of potentially damaged sensitive CH sites. As the process is robust and fast, it would represent a valuable, cost- and time-efficient tool in the hands of professionals dealing with CH management, monitoring and protection, as important information in sensitive areas could be promptly derived, once the post-change image is available and coregistered to the pre-change acquisition.
Change maps are derived taking into account both texture features extracted through Gabor filters and differences in brightness values related to Robust Differences. Convincing results are obtained analyzing the pre- and post-disaster images related to damaged CH sites in Syria and Iraq, despite the difficulties in the latter case due to the available data, which are heterogeneous to some degree. Subsequently, integration with Google Earth auxiliary images acquired at different times is exploited to enable a multitemporal representation of the evolution of the extent of damage over time. The methodology described in the article is a change detection approach based on one pre-event and one post-event image. If the VHR image provided by Google Earth is not too old, i.e., if no critical changes occurred in the time between its acquisition time and the date of the event of interest, such a free source of data can be suitable as pre-disaster information, reducing the costs required to apply the proposed methodology.
The analysis of the most useful Gabor features employed suggests that in order to retrieve automatic damage detection, better results could be achieved by preselecting the orientation of the texture filters as a function of image resolution and of the sun’s position, if the images are acquired by the same heliosynchronous satellite. It must be remarked that such features should only be used if the pre- and post-disaster images are acquired under different conditions or in different seasons, as, in such cases, robust differences of brightness values may be unreliable. Future work should also include an evaluation of the results for additional test sites in different time frames and geographical areas, while false alarms could be decreased by restricting the area of interest to known CH sites only.
The development of strategies for the protection of CH in the event of armed conflict requires regular monitoring and inspection of the condition of significant CH sites, to be undertaken as a basis of follow-up actions, further underlining the need for salvage recording or documentation of threatened or damaged cultural property [36]. The proposed methodology could be applied in such cases to inaccessible areas of war conflict in order to obtain a rapid detection and first assessment of the damage, until in situ investigation is permitted. Furthermore, the methodology is arguably appropriate for long-term monitoring of CH sites in terms of their inspection against natural and anthropogenic hazards. It could thus be imported in the general planning related to the development of risk-preparedness strategies for CH sites, contributing to the effectiveness of rapid response strategies in case of disasters. Ideally, if World Heritage sites VHR data for non-accessible sites would become easily available, an automatic change map could raise an alarm only minutes after the acquisition of a new image of the area. This should be later verified by experts—first, by visual analysis of the data, and, subsequently, by information sources in situ. Projects aiming at integrating earth observation in Cultural Heritage monitoring processes in a solid framework could benefit from employing such a workflow [37,38].
Acknowledgments
The present communication is under the “ATHENA” project H2020-TWINN2015 of the European Commission. This project has received funding from the European Union’s Horizon 2020 research and innovation programme under grant agreement No. 691936. The Geoeye-1 and WorldView-2 imagery was kindly provided by European Space Imaging.
Author Contributions
Daniele Cerra envisioned and carried out the experiments, and wrote the paper. Simon Plank performed visual analysis to support DAI archaeologists, wrote part of the introduction and created the final maps related to the datasets and the results. Vasiliki Lysandrou described the archaeological sites of interest and contributed to the introduction. Jiaojiao Tian performed part of the experiments and wrote part of Section 2.2. All authors read, revised and approved the final manuscript.
Conflicts of Interest
The authors declare no conflict of interest.
Abbreviations
The following abbreviations are used in this manuscript:
| CH | Cultural Heritage |
| DAI | German Archaeological Institute |
| DLR | German Aerospace Center |
| DSM | Digital Surface Model |
| EO | Earth Observation |
| GIS | Geographic Information System |
| EUSI | European Space Imaging |
| IS | Islamic State |
| RD | Robust Difference |
| UNESCO | United Nations Educational, Scientific and Cultural Organisation |
| VHR | Very High Resolution |
References
- Cowley, D.; Sigurdardottir, K. Remote Sensing for Archaeological Heritage Management; EAC Occasional Paper No. 5; Europae Archaeologiae Consilium: Brussels, Belgium, 2011. [Google Scholar]
- Lasaponara, R.; Masini, N. Satellite remote sensing in archaeology: Past, present and future perspectives. J. Archaeol. Sci. 2011, 38, 1995–2002. [Google Scholar] [CrossRef]
- Plank, S.; Strunz, G.; van Ess, M.; Richardson, P. Monitoring of cultural heritage sites using VHR earth observation data. In Proceedings of the WorldView Global Alliance—User Conference, Munich, Germany, 13–14 October 2015.
- Lasaponara, R.; Masini, N. Detection of archaeological crop marks by using satellite QuickBird multispectral imagery. J. Archaeol. Sci. 2007, 34, 214–221. [Google Scholar] [CrossRef]
- Agapiou, A.; Hadjimitsis, D.G.; Alexakis, D.D. Development of an image-based method for the detection of archaeological buried relics using multi-temporal satellite imagery. Int. J. Remote Sens. 2013, 34, 5979–5996. [Google Scholar] [CrossRef]
- Schuetter, J.; Goel, P.; McCorriston, J.; Park, J.; Senn, M.; Harrower, M. Autodetection of ancient Arabian tombs in high-resolution satellite imagery. Int. J. Remote Sens. 2013, 34, 6611–6635. [Google Scholar] [CrossRef]
- Trier, Ø.D.; Larsen, S.Ø.; Solberg, R. Automatic detection of circular structures in high-resolution satellite images of agricultural land. Archaeol. Prospect. 2009, 16, 1–15. [Google Scholar] [CrossRef]
- Agapiou, A.; Lysandrou, V.; Themistocleous, K.; Hadjimitsis, D. Risk assessment of cultural heritage sites clusters using satellite imagery and GIS: The case study of Paphos District, Cyprus. Nat. Hazards 2016, 1–16. [Google Scholar] [CrossRef]
- Evans, D. Airborne laser scanning as a method for exploring long-term socio-ecological dynamics in Cambodia. J. Archaeol. Sci. 2016. [Google Scholar] [CrossRef]
- Casana, J.; Panahipour, M. Satellite-based monitoring of looting and damage to archaeological sites in Syria. J. East. Mediterr. Archaeol. Herit. Stud. 2014, 2, 128–151. [Google Scholar] [CrossRef]
- Contreras, D.A. Huaqueros and remote sensing imagery: Assessing looting damage in the Virú Valley, Peru. Antiquity 2010, 84, 544–555. [Google Scholar] [CrossRef]
- Cunliffe, E. Remote Assessments of Site Damage: A New Ontology. Int. J. Herit. Digit. Era 2014, 3, 453–473. [Google Scholar] [CrossRef]
- Manjunath, B.S.; Ma, W.Y. Texture features for browsing and retrieval of image data. IEEE Trans. Pattern Anal. Mach. Intell. 1996, 18, 837–842. [Google Scholar] [CrossRef]
- Grigorescu, S.E.; Petkov, N.; Kruizinga, P. Comparison of texture features based on Gabor filters. IEEE Trans. Image Process. 2002, 11, 1160–1167. [Google Scholar] [CrossRef] [PubMed]
- Ramakrishnan, A.G.; Raja, S.K.; Ram, H.V.R. Neural network-based segmentation of textures using Gabor features. In Proceedings of the 12th IEEE Workshop on Neural Networks for Signal Processing, Martigny, Switzerland, 6 September 2002; pp. 365–374.
- Vijayaraj, V.; Bright, E.A.; Bhaduri, B.L. Rapid Damage Assessment from High Resolution Imagery. In Proceedings of the IEEE International Geoscience and Remote Sensing Symposium (IGARSS), Boston, MA, USA, 6–11 July 2008; Volume 3, pp. 499–502.
- Blaschke, T. Object based image analysis for remote sensing. ISPRS J. Photogramm. Remote Sens. 2010, 65, 2–16. [Google Scholar] [CrossRef]
- Im, J.; Jensen, J.R.; Tullis, J.A. Object based change detection using correlation image analysis and image segmentation. Int. J. Remote Sens. 2008, 29, 399–423. [Google Scholar] [CrossRef]
- Castilla, G.; Guthrie, R.H.; Hay, G.J. The Land-cover Change Mapper (LCM) and its application to timber harvest monitoring in Western Canada. Photogramm. Eng. Remote Sens. 2009, 75, 941–950. [Google Scholar] [CrossRef]
- Tian, J.; Cui, S.; Reinartz, P. Building change detection based on satellite stereo imagery and digital surface models. IEEE Trans. Geosci. Remote Sens. 2014, 52, 406–417. [Google Scholar] [CrossRef]
- United Nations Educational Scientific and Cultural Organisation (UNESCO). Convention cOncerning the Protection of the World Cultural and Natural Heritage. 1972. Available online: http://whc.unesco.org/en/conventiontext (accessed on 19 September 2016).
- Starcky, J.; Munajjed, S. Palmyra: The Bride of the Desert; Directorate-General of Information (Syria): Damascus, Syria, 1960. [Google Scholar]
- Seyrig, H. Antiquités Syriennes; Syria; Librairie Orientaliste Paul Geuthner: Paris, France, 1944; Volume 24, pp. 62–80. [Google Scholar]
- Cantineau, J. Inventaire des Inscriptions de Palmyre Fasc IX: le Sanctuaire de Bel; Damascus Museum: Damascus, Syria, 1934; p. 8. [Google Scholar]
- Danti, M. Palmyrene funerary sculptures at Penn. Expedition 2001, 43, 33–40. [Google Scholar]
- Lowe, D.G. Distinctive Image Features from Scale-Invariant Keypoints. Int. J. Comput. Vis. 2004, 60, 91–110. [Google Scholar] [CrossRef]
- Haghighat, M.; Zonouz, S.; Abdel-Mottaleb, M. CloudID: Trustworthy cloud-based and cross-enterprise biometric identification. Expert Syst. Appl. 2015, 42, 7905–7916. [Google Scholar] [CrossRef]
- Aguilar, M.; del Mar Saldaña, M.; Aguilar, F.J.; Fernández, I. Radiometric comparison between GeoEye-1 and WorldView-2 Panchromatic and Multispectral Imagery. In INGEGRAF-ADM-AIP PRIMECA; Ingegraf: Madrid, Spain, 2013; pp. 1–9. [Google Scholar]
- Cuneo, A.; Penacho, S.; Gordon, L.B. Special Report: Update on the Situation in Palmyra. 2015. Available online: http://www.asor-syrianheritage.org/special-report-update-on-the-situation-in-palmyra (accessed on 19 September 2016).
- Maxwell-Hyslop, K.R. Nimrud and its Remains. By M. E. L. Mallowan. Archaeol. J. 1966, 123, 223–224. [Google Scholar] [CrossRef]
- United Nations Educational Scientific and Cultural Organisation (UNESCO). Iraq’s Heritage: A Treasure under Threat; World Heritage Special Issue; Publishing for Development: London, UK, 2015. [Google Scholar]
- Danti, M.; Branting, S.; Paulette, T.; Cuneo, A. Report on the Destruction of the Northwest Palace at Nimrud. 2015. Available online: http://www.asor-syrianheritage.org/wp-content/uploads/2015/05/ASOR_CHI_Nimrud_Report.pdf (accessed on 19 September 2016).
- Curry, A. Here Are the Ancient Sites ISIS Has Damaged and Destroyed. 2015. Available online: http://news.nationalgeographic.com/2015/09/150901-isis-destruction-looting-ancient-sites-iraq-syria-archaeology/ (accessed on 19 September 2016).
- Danti, M.; Cuneo, A.; Penacho, S.; Al-Azm, A.; Rouhani, B.; Gabriel, M.; Kaercher, K.; O’Connell, J.; Lauricella, A. ASOR Cultural Heritage Initiatives Weekly Report 95–96. 2016. Available online: http://www.asor-syrianheritage.org/asor-cultural-heritage-initiatives-weekly-report-95-96-may-25-2016-june-7-2016/ (accessed on 19 September 2016).
- Council of Europe. European Landscape Convention; Report and Convention; Council of Europe: Florence, Italy, 2000. [Google Scholar]
- Stovel, H. Risk Preparedness: A Management Manual for World Cultural Heritage; ICCROM: Rome, Italy, 1998. [Google Scholar]
- Earth Observation in Cultural Heritage Documentation. 2016. Available online: http://www.earthobservations.org/activity.php?id=24 (accessed on 19 September 2016).
- CIPA Heritage Documentation. 2016. Available online: http://cipa.icomos.org/ (accessed on 19 September 2016).
© 2016 by the authors; licensee MDPI, Basel, Switzerland. This article is an open access article distributed under the terms and conditions of the Creative Commons Attribution (CC-BY) license (http://creativecommons.org/licenses/by/4.0/).