Article

A Low-Cost Smartphone Sensor-Based UV Camera for Volcanic SO2 Emission Measurements

by
Thomas Charles Wilkes
1,*,
Tom David Pering
1,
Andrew John Samuel McGonigle
1,2,3,
Giancarlo Tamburello
4 and
Jon Raffe Willmott
5
1
Department of Geography, The University of Sheffield, Winter Street, Sheffield S10 2TN, UK
2
Istituto Nazionale di Geofisica e Vulcanologia, Sezione di Palermo, via Ugo La Malfa 153, 90146 Palermo, Italy
3
School of Geosciences, The University of Sydney, Sydney, NSW2006, Australia
4
Dipartimento di Scienze della Terra e del Mare (DiSTeM), Università di Palermo, via Archirafi, 22, 90123 Palermo, Italy
5
Department of Electronic and Electrical Engineering, The University of Sheffield, Portobello Centre, Pitt Street, Sheffield S1 4ET, UK
*
Author to whom correspondence should be addressed.
Remote Sens. 2017, 9(1), 27; https://doi.org/10.3390/rs9010027
Submission received: 1 November 2016 / Accepted: 28 December 2016 / Published: 1 January 2017

Abstract

:
Recently, we reported on the development of low-cost ultraviolet (UV) cameras, based on the modification of sensors designed for the smartphone market. These units are built around modified Raspberry Pi cameras (PiCams; ≈USD 25), and usable system sensitivity was demonstrated in the UVA and UVB spectral regions, of relevance to a number of application areas. Here, we report on the first deployment of PiCam devices in one such field: UV remote sensing of sulphur dioxide emissions from volcanoes; such data provide important insights into magmatic processes and are applied in hazard assessments. In particular, we report on field trials on Mt. Etna, where the utility of these devices in quantifying volcanic sulphur dioxide (SO2) emissions was validated. We furthermore performed side-by-side trials of these units against scientific grade cameras, which are currently used in this application, finding that the two systems gave virtually identical flux time series outputs, and that signal-to-noise characteristics of the PiCam units appeared to be more than adequate for volcanological applications. Given the low cost of these sensors, allowing two-filter SO2 camera systems to be assembled for ≈USD 500, they could be suitable for widespread dissemination in volcanic SO2 monitoring internationally.

Graphical Abstract

1. Introduction

Since its first application to volcanology a decade ago, ultraviolet (UV) camera technology has become an important tool in constraining emission rates of sulphur dioxide (SO2) from volcanoes [1,2]. This goes beyond the capacity provided previously from scanning or traverse-based differential optical absorption spectroscopy (DOAS) measurements of volcanic gas fluxes [3,4], firstly by imaging the plumes and therefore providing detailed spatial information, and secondly by acquiring gas fluxes with at least two orders of magnitude higher temporal resolution than most DOAS techniques. In the former case, this is useful in understanding the behaviour of systems with multiple fumaroles or craters [5,6]; in the latter sense, this has enabled capture of a series of rapid explosive and passive volcanic degassing phenomena for the first time [7,8,9,10,11,12,13,14].
The rapid frame rate of the cameras has also enabled corroboration with geophysical datasets at a far higher time resolution than possible previously (e.g., on the order of 1 Hz; [9,11,15,16,17,18,19]). Combining geophysical and degassing data in this way provides scope for a far more holistic system understanding than a discrete analysis of the individual datasets, as first demonstrated on such time frames using spectroscopic gas flux data [20]. In addition, these high temporal resolution data enable a comparison against mathematical and numerical models of underground gas flow processes, providing new insights into the subterranean fluid dynamics, which drive surficial activity [8,21,22]. Much attention has also been directed towards scrutinising the data processing routines and considering sources of error in SO2 camera retrievals (e.g., [8,23,24,25,26,27]), related to light dilution, plume speed determination, and the calibration procedure.
Due to these benefits, UV cameras have been used in discrete field campaigns spread across quite a number of degassing volcanoes internationally (e.g., [28,29]), and are now in routine monitoring operation on a few targets, e.g., Mount Etna and Stromboli in Italy ([6,22,30]), and Kīlauea volcano, Hawaii [31]. However, as the UV imaging systems applied on volcanoes hitherto have been typically based on scientific grade cameras, which are rather expensive (thousands of dollars), the international reach in monitoring remains somewhat limited; in developing world countries, such as Indonesia and across Latin America, where risks are high, but surveillance budgets are limited, system costs are a particularly pertinent consideration. This prompted us to consider whether UV cameras could be developed based on inexpensive smartphone sensor technology [32]. Here, we report on the first application of such instrumentation in the field of volcanology, in particular, field tests on Mt. Etna, in an attempt to demonstrate proof of concept of the utility of these devices in this context. We also detail side-by-side comparisons against one such currently applied scientific grade UV camera system to gain a sense of the relative performance of these units, following, to a large extent, the inter-comparative approach detailed in [33].

2. The Camera Systems

The system deployed here was based on the adaptation of a low-cost Raspberry Pi camera module (referred to as PiCam hereafter; Raspberry Pi Foundation), of retail price ≈USD 25. The UV sensitivity of this unit was significantly enhanced by removing the Bayer filter from the back-illuminated CMOS sensor and by replacing the camera lens with a UV transmissive quartz alternate; for full details, see [32]. The camera sensor (OV5647; Omnivision Technologies Inc., Santa Clara, CA, USA) captures 10-bit raw image data at a resolution of 2592 × 1944, although pixel binning to lower resolutions was applied, as detailed below. This sensor, in combination with the UV transmissive AR-coated plano-convex lens with a 6 mm diameter and a 9 mm focal length (Edmund Optics Ltd., Barrington, NJ, USA), provided a field of view (FOV) of ≈23.1° × 17.3° (width × height). The unit specifications are broadly in line with those of other UV camera systems currently used in volcanology, a list of which is detailed in [33]; see Table 1.
Two of the aforementioned PiCams were deployed as a co-aligned pair, with a bandpass filter mounted before each lens, one centred on 310 nm and the other on 330 nm (Edmund Optics Ltd.), both with a 10 nm full width at half maximum bandwidth. This approach enables constraints on SO2 abundance over the field of view, from which fluxes can be derived, as this gas absorbs at the former wavelength but not the latter, as further detailed in [1,34]. Each of the cameras was connected to a Raspberry Pi computer via the Camera Serial Interface and controlled using a Python 3 graphical user interface (GUI) application developed in-house. A laptop computer communicated with each Raspberry Pi via an Ethernet secure shell (SSH), enabling operation of the GUI through X11 forwarding. At present, the images are saved to USB flash drives for processing at a later date; however, in future work, we anticipate implementing real-time processing. The overall cost of this SO2 system, excluding the laptop, is ≈USD 500, where the optical components (filters and lenses) of the system are the most expensive parts; conversely, the prices of typical SO2 cameras are dominated by the cost of the expensive scientific grade UV cameras (USD 1000s each), and not the foreoptics.
The scientific grade UV camera used for comparison was a JAI CM-140GE-UV (hereafter referred to as JAI; ≈USD 4000 each). It contains a Sony ICX407BLA UV-enhanced CCD array sensor, which provides 10-bit images, at an initial resolution of 1392 × 1040, although, through hardware and software binning, 696 × 520 images were produced for analysis. Again, a two-camera system was assembled, and Pentax B2528-UV lenses, with focal lengths of 25 mm, were mounted to the fore of each camera, providing FOVs of 14.6° × 11.1° (width × height). The bandpass filters attached to the JAI units were the same as those used in the PiCams, except in this case they were affixed between the object lens and the sensor, to avoid the issue of angular dependence in the filter transmission spectrum (e.g., [35]). Each JAI unit was operated through a GigE vision interface (via an Ethernet connection), and the acquisitions were controlled by a single laptop using the Vulcamera software [36].

3. Gas Flux Measurements

The PiCams were deployed on Mt. Etna, Sicily, alongside the JAI units, between 15 and 20 July 2016, measuring the gas emissions from the volcano. In particular, on 19 July, the units were stationed ≈2.5 km east-northeast of Etna’s North East Crater at Pizzi Deneri (Figure 1), imaging the gas release from this crater. Prior to processing, the PiCam images were binned to 648 × 486 to provide a similar pixel resolution to the JAI devices and to improve the system’s signal-to-noise ratio (SNR).
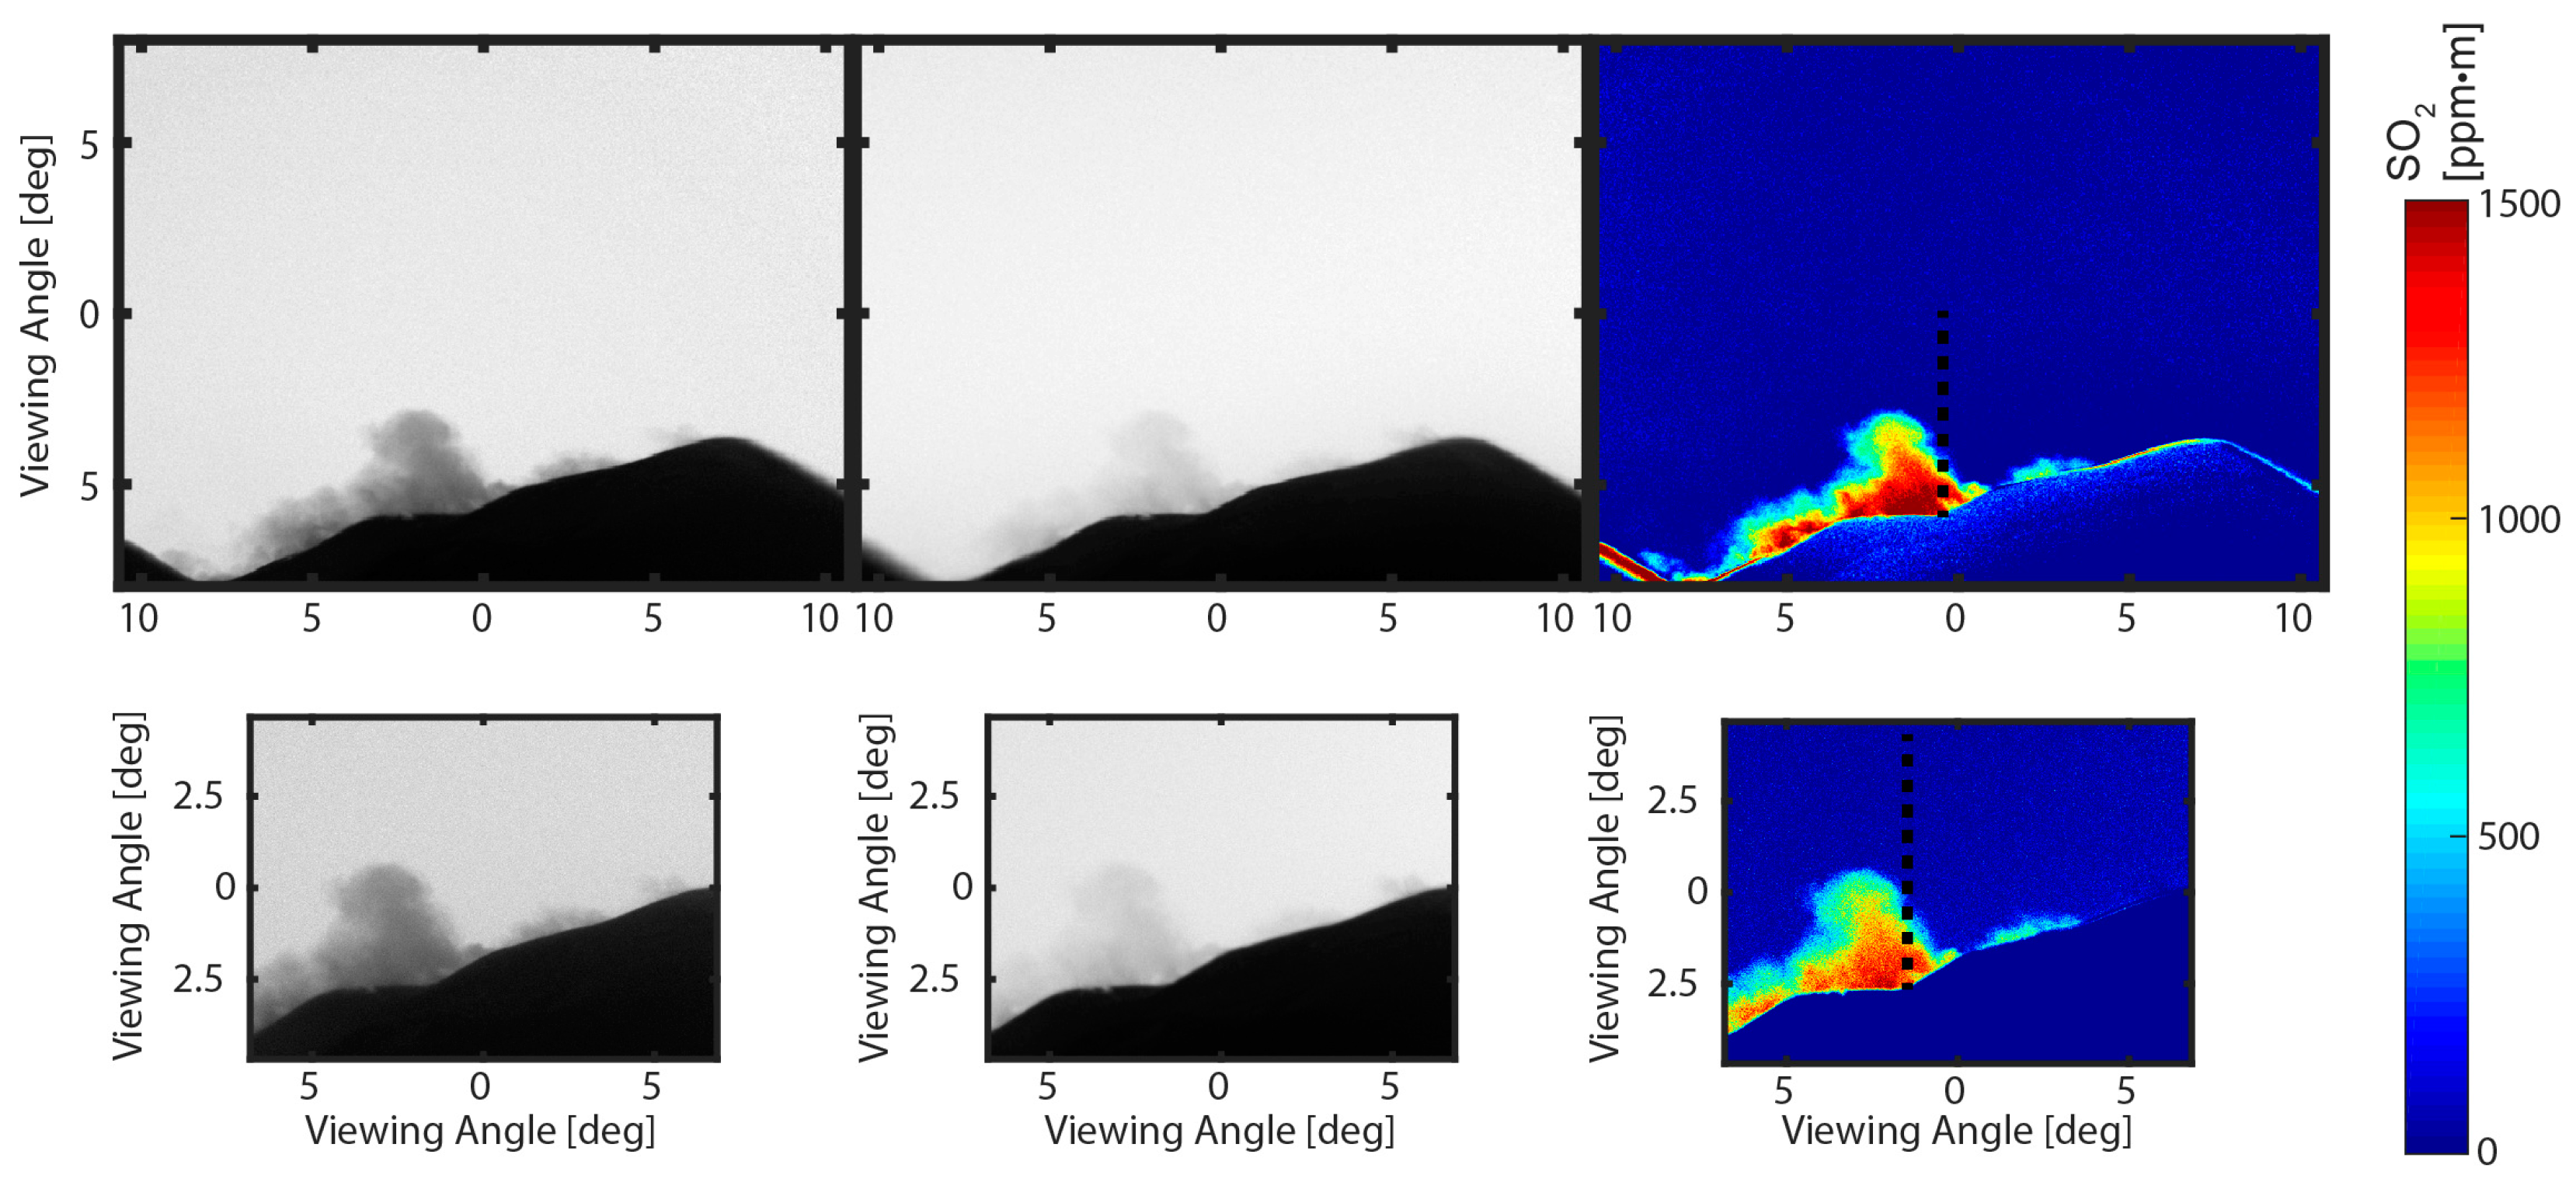
To replicate possible volcano monitoring deployment conditions for each system, shutter speeds for all four cameras were designated individually (200 and 30 ms for the 310 and 330 nm channels on the PiCam, respectively; for the JAI, auto-exposure adjustment was implemented, with typical speeds of 60 ms and 20 ms for the 310 and 330 nm channels, respectively). An acquisition rate of 0.25 Hz was applied for the PiCams, whilst the JAI units were acquired at 0.5 Hz. The images were processed following the protocols outlined in Kantzas et al. [34], particularly involving background subtraction, vignette correction, and calibration with three quartz cells containing known column amounts of sulphur dioxide (0, 998 and 1861 ppm·m), to convert the image pixel absorbances to ppm·m values. Integrated column amounts (ICAs) were then generated by summing these pixel column densities over a vertical section (approximately the same section for the JAIs and the PiCams) of the horizontally advected plume, before multiplication by the plume speed to calculate SO2 flux. These plume speeds were estimated using the cross correlation technique (e.g., [9,37]) by calculating the time lag between two ICA time series positioned at different locations along the plume transport vector. Plume speeds generated from the two camera systems were in good agreement (<±5%); to remove this error from the time series, the same wind speed, defined as the average between the two systems, was used for both systems. Example imagery from the field acquisitions are shown in Figure 2, demonstrating very similar retrieved concentrations across the image field of view from the two systems; videos of these image sequences captured between 07:49:00 UTC and 08:35:08 UTC are provided as Supplementary Materials Video S1 and Video S2 for the PiCam and JAI systems, respectively.
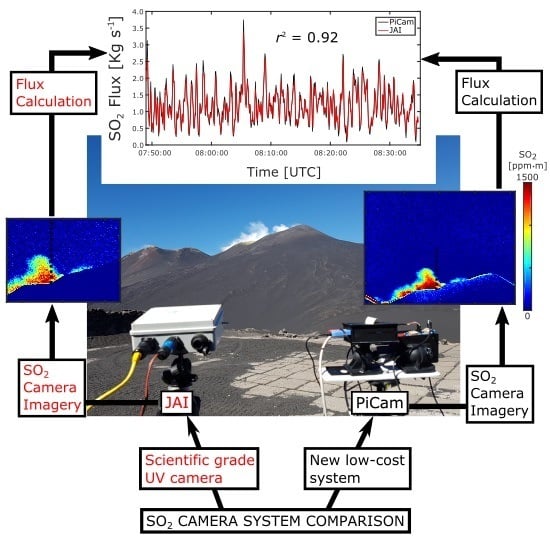
The flux time series of the two camera systems were compared. This was achieved by matching the JAI time series to the PiCam series to extract quasi-contemporaneous data points, given the different system acquisition frequencies. In particular, for every PiCam datum, the corresponding JAI flux was taken to be that acquired within a second of the PiCam value. Where this criterion could not be satisfied, the PiCam data point was simply omitted to maximise the integrity of the comparison. Figure 3A displays the resulting flux time series for matched JAI-PiCam data pairs, showing a strong agreement (r2 = 0.92) between these data series, therefore suggesting that the PiCam replicates the JAI system performance sufficiently for volcanic SO2 measurements. Errors involved in the camera column amount and flux computations are considered in the following section.

4. Characterising the Relative Performance of the PiCam System

Having established proof of concept of the utility of the inexpensive PiCam system for volcanic gas measurements, we then proceeded to perform a more detailed comparison of these sensors’ performance characteristics relative to the JAI units, following on from the approach detailed in [33]. In particular, on 20 July 2016, at 10:48 UTC, the two systems were set to image the same region of clear sky from a rooftop in Linguaglossa, Sicily, with a small outcrop of horizon present at the bottom of each image to ensure that viewing directions were consistent. To ensure parity, shutter speeds for both systems were set to those typically used by the JAI system in field acquisitions (e.g., 60 ms at 310 nm; 20 ms at 330 nm). As a result, PiCam channels were significantly undersaturated, as would be expected from a sensor not specifically designed for UV imagery, with average saturations of ≈18% and ≈19% for the 310 and 330 nm channels, respectively; JAI images were at ≈74% and ≈75% saturation for the 310 and 330 nm channels, respectively. Here, clear sky images were acquired, then dark current subtracted and vignette corrected, as would be the case in standard volcanic field acquisitions.
Firstly, the relative signal-to-noise ratio (SNR) performance of the two systems was characterised, according to the inverse of the standard deviation, σ, of measured clear skylight intensities, between two successive images, I1 and I2:
σ = s t d ( I 1 I 2 ) =   1 N p = 1 N [ I 1 ( p ) I 2 ( p )   I 1 I 2 ] 2
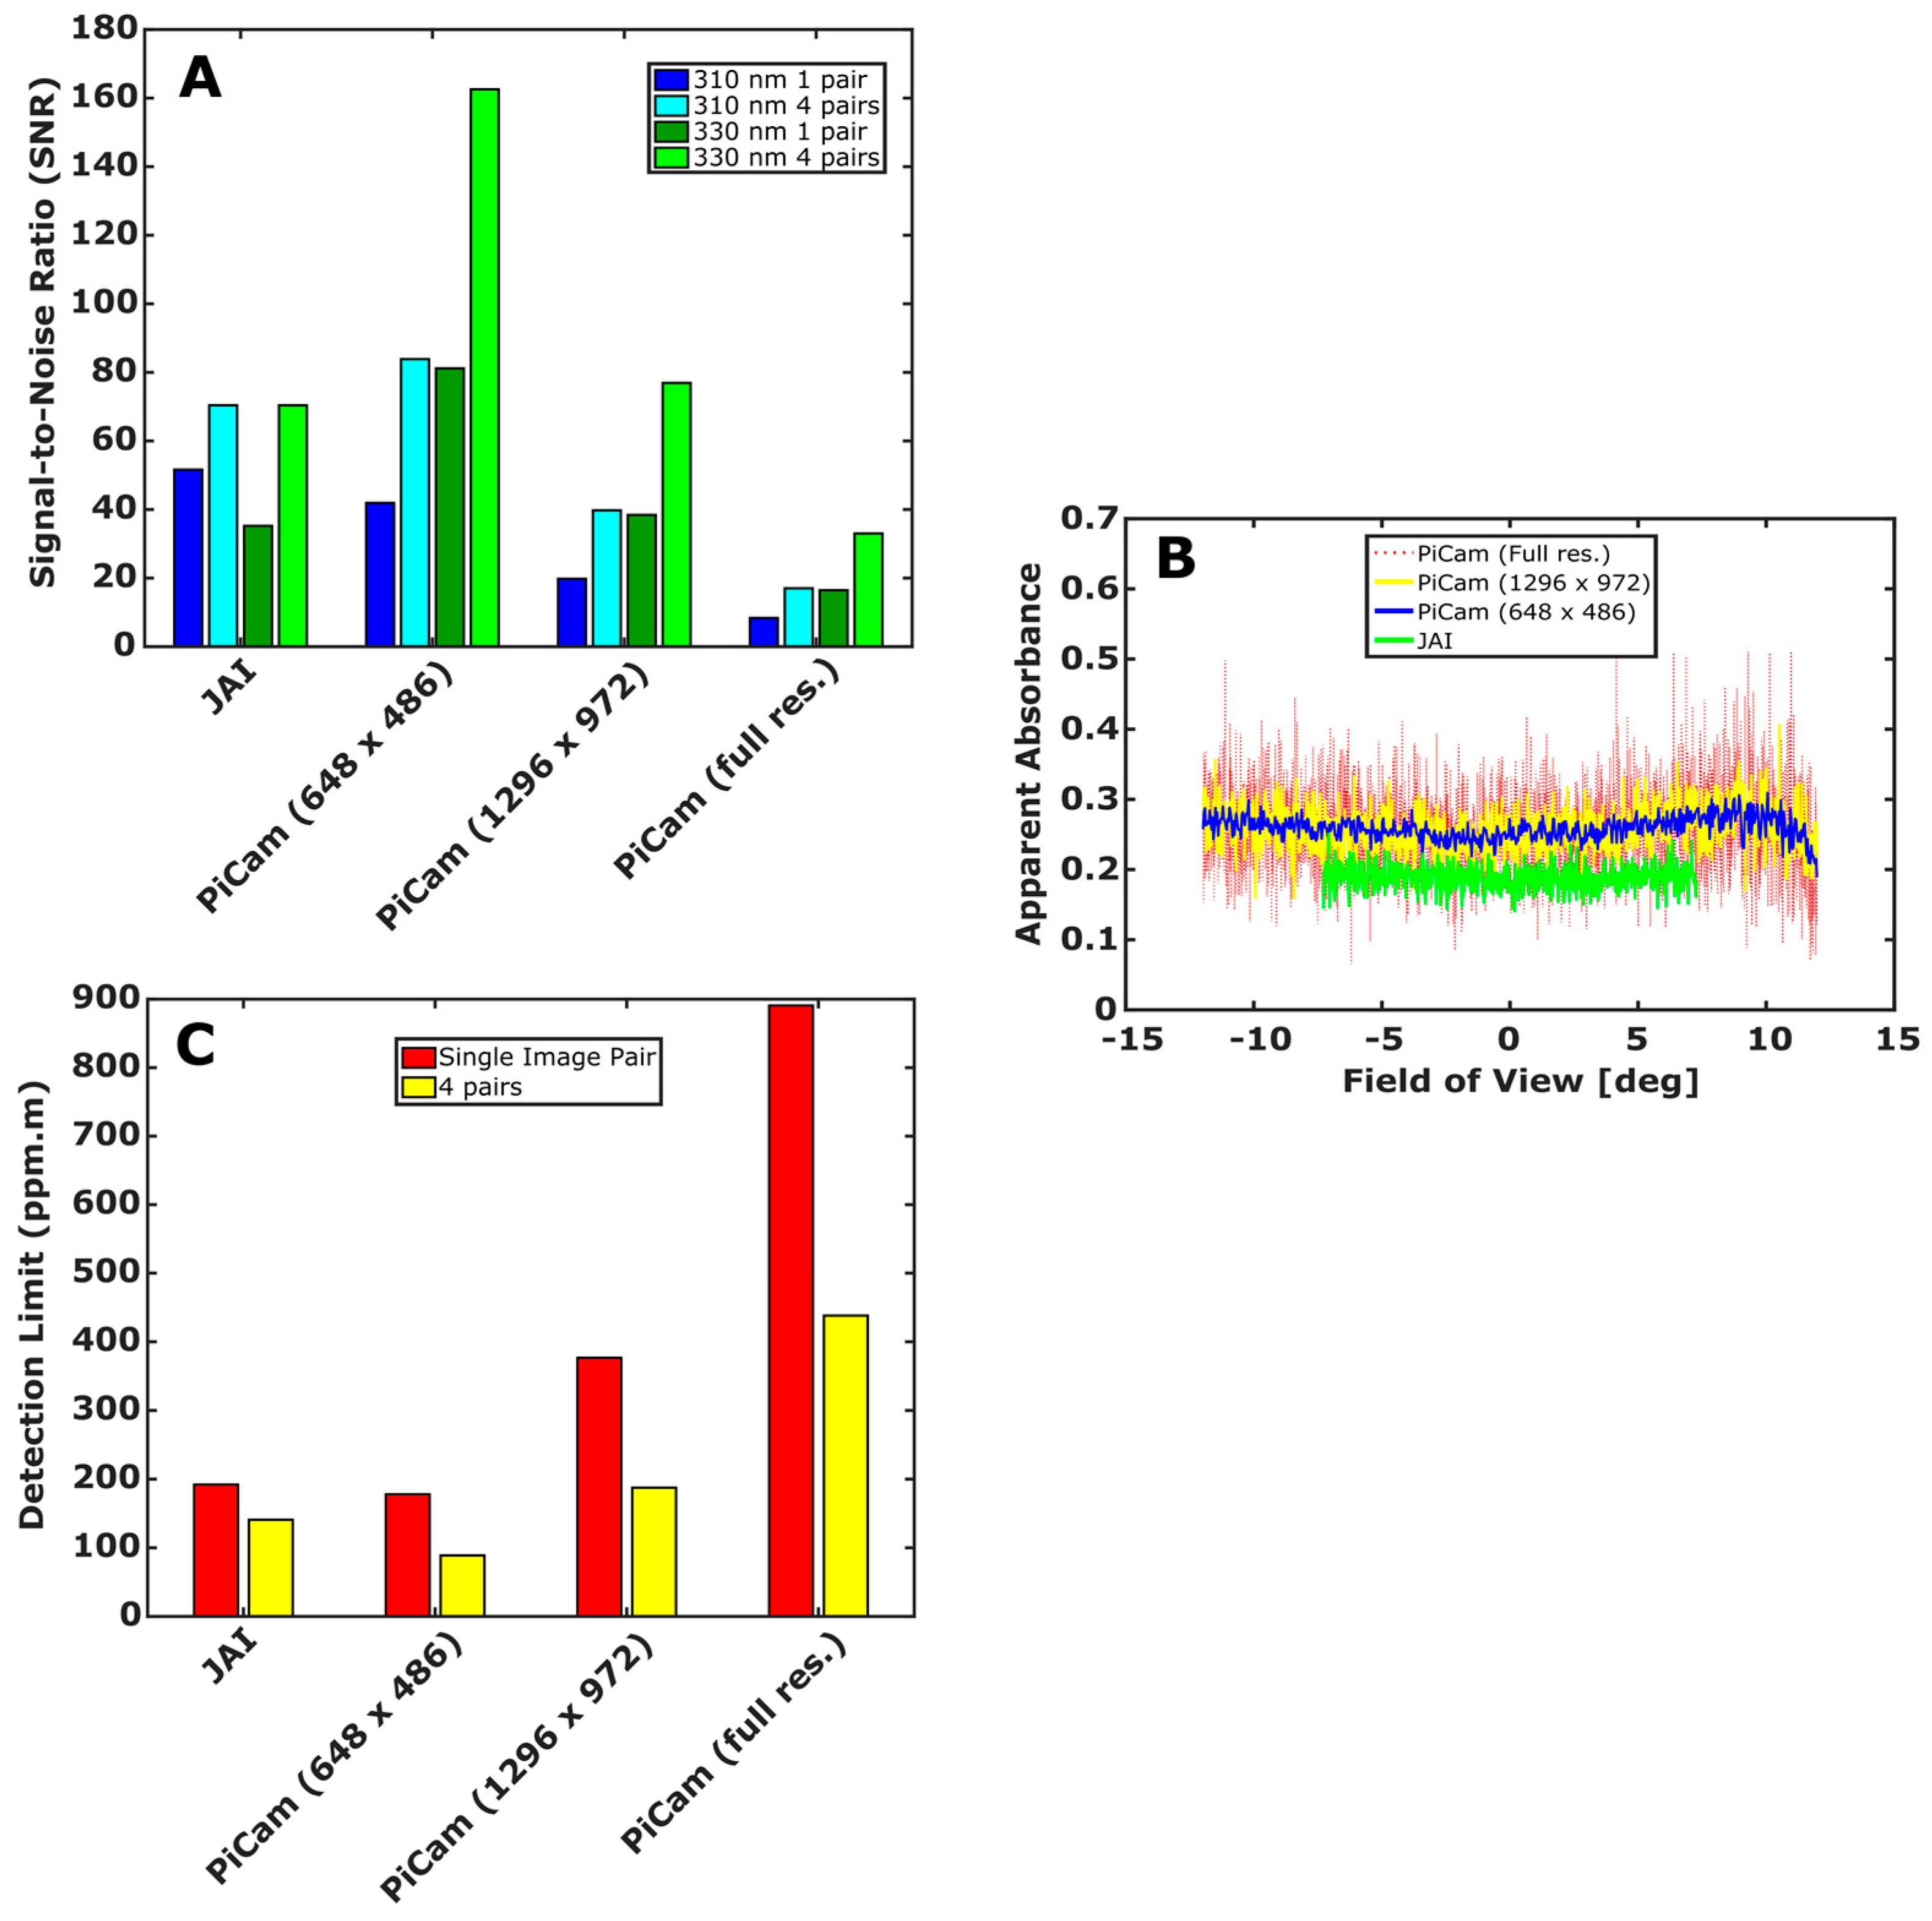
where p denotes an individual pixel, N is the total number of pixels, and I 1 I 2 is the average ratio between pixel intensities in these two images, measured across the entire detector [33]. SNRs for the JAI and PiCam systems are shown in Figure 4A, both for single image pairs and in a separate experiment where I1 and I2 were each obtained by co-adding (summing successive images on a pixel-by-pixel basis) four separate images. Data are presented for the PiCam with unbinned pixels, with pixels binned to approximately the same pixel resolution as the JAI system (e.g., 648 × 486), and with binning such that the FOV per pixel was roughly equal for both systems (e.g., 0.0178° at 1296 × 972 and 0.021° at 696 × 520, for the PiCam and JAI, respectively); note that, for the latter experiment, there is a slight discrepancy between the pixel FOVs of the two systems, as pixel binning results in discrete jumps in pixel FOV.
For all systems and filters, the SNR improves with co-adding, broadly following the theoretically anticipated t−1/2 proportionality, where t is the total integration time across all co-adds i.e., four-fold co-adding results in a doubling in SNR. This is to be expected in optical systems which are limited by photon (Poisson) noise, rather than internal electronic noise, suggesting that the PiCam is performing as required, even at the low saturation levels of this test. The notable disparity between SNRs for the PiCam 310 and 330 nm images suggests that this sensor’s quantum efficiency diminishes towards shorter wavelengths at a faster rate than in the JAI system; hence, the PiCam would present better SNR characteristics with longer shutter speeds than used by the JAI units. For the PiCams, post-acquisition pixel binning results in considerable improvements in SNR, e.g., by a factor of five, at 648 × 486, which is broadly comparable to the pixel resolution of the JAI system. At this resolution, the PiCam actually outperforms the JAI in the majority of SNR experiments, where there is certainly enough spatial resolution to enable adequate plume capture in the vast majority of cases. At 1296 × 972, the PiCams have somewhat poorer SNRs than the JAI units at 310 nm, as would be expected given the greater expense of the latter units; however this performance degradation is relatively modest, and again, this spatial resolution would be unnecessary for the majority of volcanic deployments.
Secondly, we generated apparent absorbances (AA), by placing a quartz cell of 1861 ppm·m SO2 over the camera lenses, as high frequency variation in AA across the camera FOV is another means of investigating SNR:
A A   =   log 10 [ I C 310 I B 310 / I C 330 I B 330 ]   .
Here, for each pixel, IC is the intensity with the cell, and IB is the background sky intensity, where the subscripts denote the camera filter in question; all images are dark subtracted. Results are shown in Figure 4B, indicating rather high noise levels for the full resolution PiCam sensor, but that binning to 648 × 486 produces very good image quality, similar to, if not better than, the JAI images in this test. In accordance with previous reports [23,33,35], the PiCam displays a higher SO2 sensitivity to the edges of the FOV, owing to the mounting of filters to the fore of the lenses; however, this effect is minor (≈15% increase) in comparison to that manifested in other systems (up to 40% in [33]). In general, the PiCam system also shows a higher sensitivity to SO2 than the JAI system (larger values of AA), possibly resulting from the different filter positions in the two optical systems, which will lead to differences in the peak filter transmission wavelength [33,35]; this disparity in response is directly accounted for within the SO2 calibration procedure, e.g., the systems have no systematic offset in calibrated SO2 column amounts.
Thirdly, camera detection limits were estimated, following the protocols detailed in [33], by multiplying the 310 nm channel standard deviations (σ), from Equation (1), by the gradient of the calibration line, e.g., that fitted to the gas concentrations vs. apparent absorbance data during cell calibration. Again, for PiCam binning to 648 × 486, the SO2 detection limits were comparable to or better than the JAI units, with values of ≈180 ppm·m and ≈190 ppm·m, respectively, where no co-adding was implemented, and ≈90 ppm·m and ≈140 ppm·m where four image co-adding was applied (Figure 4C). For binning to enable roughly similar FOVs per pixel in each system, the detection limits were larger for the PiCam units, but not enormously so. Of course, choosing longer integration times, to near saturate the PiCams, would improve their detection limit characteristics.
The data from Figure 4C also serve as proxies for random errors in retrieved image SO2 concentrations, ΔC (which can then be used to quantify overall uncertainty in flux), e.g., ±≈180 ppm·m and ±≈190 ppm·m, for the PiCams (648 × 486 resolution) and JAI units, respectively, where no co-adding is applied. These were the acquisition conditions, for instance, for the emission time series data, shown in Figure 3, although it should be noted that the PiCam shutter speeds do vary between Figure 3 and Figure 4; thus, we may anticipate that the error calculated below may be improved if longer shutter speeds, such as those from Section 3, were used. The absolute error in ICA, ΔICA, can then be found from the number of pixels in the plume cross section, N, and the height imaged by each pixel in the plane of the plume, h.
I C A =   N   ( C   h ) 2   .
In this case, for the PiCams, there were around 155 pixels in the plume cross section, each of height 1.58 m, and for the JAI units, these parameters were 280 and 0.92 m, respectively. This led to an uncertainty in ICA of ±3500 and 2900 ppm·m, for the PiCam and JAI acquisitions. These translate to errors of 4% and 3%, respectively, when considering the average ICA values associated with the Figure 3 data series. In addition to this error, which is distinct for the two systems, since it is directly related to the camera’s performance, there are a number of further errors which will affect the PiCam and JAI units in the same manner (e.g., see [8,23,35] for detailed discussions). These errors will include most significantly: plume speed determination, cell calibration, and light dilution. The errors are, of course, entirely specific to the acquisition conditions for each measurement; however, with plume speed error estimated at 10% for the cross-correlation method [23], a cell calibration error able to far exceed 10% under certain conditions [23], and neglecting light dilution due to the close proximity of the imaging systems to the plume, we conservatively estimate a total root-mean-square (RMS) error of 14.7% and 14.5% for the PiCam and JAI systems, respectively. Here, it is apparent that the contribution to total error from camera system performance is relatively small. Furthermore, the relative difference between the PiCam system error and the JAI system error is especially minor (≈1%), having a negligible impact on the total RMS error. This shows that a broadly similar performance from these systems is achievable in terms of overall uncertainty in determined emission rates, which is impressive considering the low cost of the PiCam system.

5. Concluding Remarks

In this study, we have detailed the deployment of novel, inexpensive, smartphone sensor-based ultraviolet cameras in a volcanic context for the first time. The system, based on a modified Raspberry Pi camera (PiCam), which has an overall cost of ≈USD 500, was observed to perform very well in this application area. Indeed, in side-by-side trials on Etna volcano, during July 2016, these units retrieved SO2 flux time series which were virtually identical (r2 = 0.92) to those extracted from a system based on scientific grade UV cameras (JAIs), costing at least an order of magnitude more, of the sort typically used in this application area. In addition, a study of relative signal-to-noise performance revealed that for the JAI- and PiCam-based systems binned to similar pixel resolutions (≈648 × 486) and with equivalent shutter speeds, the SNR values were comparable in both cases. The systems’ SO2 detection limits were also compared, under these acquisition conditions, again demonstrating rather similar performance e.g., ≈90 ppm·m and 140 ppm·m for the PiCam and JAI systems, respectively, when four images were co-added. Binning the PiCams to a lesser degree, to match the per pixel field of view of the JAI system (which had a narrower FOV lens), did result in notably better detection limits and SNR performance for the JAI units, as would be expected given the greater expense of the latter and their specific development for UV measurements. However, in this case, the resulting spatial resolution is considered to be beyond that required in volcano monitoring.
In summary, therefore, the PiCam units are considered to be more than adequate for volcanic SO2 flux measurements. Future work will focus on the ruggedisation of these units to expedite autonomous or more sustained deployments, as well as the extension of the current Python codes to enable in-line processing to output SO2 fluxes in real time. Given the very low cost of smartphone sensor technology, this article illustrates that this could be a very useful tool in volcanic gas monitoring, suitable for widespread dissemination, internationally.

Supplementary Materials

The following are available online at www.mdpi.com/2072-4292/9/1/27/s1: Video S1: Absorbance image sequence of Mount Etna’s SO2 emissions captured using the PiCam, from 07:49:00 UTC to 08:35:08 UTC, in concordance with the flux time series displayed in Figure 3. Larger SO2 column densities are represented by warmer colours. Pixels are binned to form a 648 by 486 array. Video S2: Absorbance image sequence of Mount Etna’s SO2 emissions captured using the scientific grade JAI camera, from 07:49:00 UTC to 08:35:08 UTC, in concordance with the flux time series displayed in Figure 3. Larger SO2 column densities are represented by warmer colours.

Acknowledgments

We gratefully acknowledge the sponsors of this work. Thomas Charles Wilkes acknowledges a University of Sheffield studentship. Andrew John Samuel McGonigle acknowledges support of a Leverhulme Trust Research Fellowship (RF-2016-580) and support from the NERC Centre for Observation & Modelling of Earthquakes, Volcanoes and Tectonics. Tom David Pering acknowledges support from a NERC studentship (NE/K500914/1). Giancarlo Tamburello acknowledges support from the European Research Council starting independent research grant (agreement 305377). Jon Raffe Willmott acknowledges the support of an Engineering and Physical Sciences Research Council grant (EP/M009106/1).

Author Contributions

The paper was written by Thomas Charles Wilkes and Andrew John Samuel McGonigle. Data analyses were predominantly performed by Thomas Charles Wilkes. The experimental concept was devised by Thomas Charles Wilkes, Tom David Pering, and Andrew John Samuel McGonigle. Fieldwork was performed by Thomas Charles Wilkes, Tom David Pering, Giancarlo Tamburello, and Andrew John Samuel McGonigle. Jon Raffe Willmott was a co-supervisor.

Conflicts of Interest

The authors declare no conflict of interest.

References

  1. Mori, T.; Burton, M.R. The SO2 camera: A simple, fast and cheap method for ground-based imaging of SO2 in volcanic plumes. Geophys. Res. Lett. 2006, 33, L24804. [Google Scholar] [CrossRef]
  2. Bluth, G.; Shannon, J.; Watson, I.M.; Prata, A.J.; Realmuto, V. Development of an ultra-violet digital camera for volcanic SO2 imaging. J. Volcanol. Geotherm. Res. 2007, 161, 47–56. [Google Scholar] [CrossRef]
  3. McGonigle, A.J.S.; Oppenheimer, C.; Galle, B.; Mather, T.A.; Pyle, D.M. Walking traverse and scanning DOAS measurements of volcanic gas emission rates. Geophys. Res. Lett. 2002, 29, 1985. [Google Scholar] [CrossRef]
  4. Galle, B.; Oppenheimer, C.; Geyer, A.; McGonigle, A.J.S.; Edmonds, M.; Horrocks, L.A. A miniaturised UV spectrometer for remote sensing of SO2 fluxes: A new tool for volcano surveillance. J. Volcanol. Geotherm. Res. 2003, 119, 241–254. [Google Scholar] [CrossRef]
  5. Tamburello, G.; Kantzas, E.P.; McGonigle, A.J.S.; Aiuppa, A.; Giudice, G. UV camera measurements of fumarole field degassing (La Fossa crater, Vulcano Island). J. Volcanol. Geotherm. Res. 2011, 199, 47–52. [Google Scholar] [CrossRef]
  6. D’Aleo, R.; Bitetto, M.; Delle Donne, D.; Tamburello, G.; Battaglia, A.; Coltelli, M.; Patanè, D.; Prestifilippo, M.; Sciotto, M.; Aiuppa, A. Spatially resolved SO2 flux emissions from Mt Etna. Geophys. Res. Lett. 2016, 43, 7511–7519. [Google Scholar] [CrossRef] [PubMed]
  7. Mori, T.; Burton, M. Quantification of the gas mass emitted during single explosions on Stromboli with the SO2 imaging camera. J. Volcanol. Geotherm. Res. 2009, 188, 395–400. [Google Scholar] [CrossRef]
  8. Holland, A.S.P.; Watson, I.M.; Phillips, J.C.; Caricchi, L.; Dalton, M.P. Degassing processes during lava dome growth: Insights from Santiaguito Lava Dome, Guatemala. J. Volcanol. Geotherm. Res. 2011, 202, 153–166. [Google Scholar] [CrossRef]
  9. Tamburello, G.; Aiuppa, A.; Kantzas, E.P.; McGonigle, A.J.S.; Ripepe, M. Passive vs. active degassing modes at an open-vent volcano (Stromboli, Italy). Earth Planet. Sci. Lett. 2012, 359, 106–116. [Google Scholar] [CrossRef] [Green Version]
  10. Tamburello, G.; Aiuppa, A.; McGonigle, A.J.S.; Allard, P.; Cannata, A.; Giudice, G.; Kantzas, E.P.; Pering, T.D. Periodic volcanic degassing behavior: The Mount Etna example. Geophys. Res. Lett. 2013, 40, 4818–4822. [Google Scholar] [CrossRef]
  11. Pering, T.D.; Tamburello, G.; McGonigle, A.J.S.; Aiuppa, A.; Cannata, A.; Giudice, G.; Patanè, D. High time resolution fluctuations in volcanic carbon dioxide degassing from Mount Etna. J. Volcanol. Geotherm. Res. 2014, 270, 115–121. [Google Scholar] [CrossRef]
  12. Smekens, J.-F.; Clarke, A.B.; Burton, M.R.; Harijoko, A.; Wibowo, H. SO2 emissions at Semeru volcano, Indonesia: Characterization and quantification of persistent periodic explosive activity. J. Volcanol. Geotherm. Res. 2015, 300, 121–128. [Google Scholar] [CrossRef]
  13. Moussallam, Y.; Bani, P.; Curtis, A.; Barnie, T.; Moussallam, M.; Peters, N.; Schipper, C.I.; Aiuppa, A.; Giudice, G.; Amigo, Á.; et al. Sustaining persistent lava lakes: Observations from high-resolution gas measurements at Villarrica volcano, Chile. Earth Planet. Sci. Lett. 2016, 454, 237–247. [Google Scholar] [CrossRef]
  14. Barnie, T.; Bombrun, M.; Burton, M.R.; Harris, A.; Sawyer, G. Quantification of gas and solid emissions during Strombolian explosions using simultaneous sulphur dioxide and infrared camera observations. J. Volcanol. Geotherm. Res. 2015, 300, 167–174. [Google Scholar] [CrossRef]
  15. Dalton, M.P.; Waite, G.P.; Watson, I.M.; Nadeau, P.A. Multiparameter quantification of gas release during weak Strombolian eruptions at Pacaya Volcano, Guatemala. Geophys. Res. Lett. 2010, 37, L09303. [Google Scholar] [CrossRef]
  16. Kazahaya, R.; Mori, T.; Takeo, M.; Ohminato, T.; Urabe, T.; Maeda, Y. Relation between single very-long-period pulses and volcanic gas emissions at Mt. Asama, Japan. Geophys. Res. Lett. 2011, 38, L11307. [Google Scholar] [CrossRef]
  17. Nadeau, P.A.; Palma, J.L.; Waite, G.P. Linking volcanic tremor, degassing, and eruption dynamics with SO2 imaging. Geophys. Res. Lett. 2011, 38, L013404. [Google Scholar] [CrossRef]
  18. Nadeau, P.A.; Werner, C.; Waite, G.P.; Carn, S.A.; Brewer, I.D.; Elias, T.; Suttom, A.J.; Kern, C. Using SO2 camera imagery to examine degassing and gas accumulation at Kīlauea volcano. J. Volcanol. Geotherm. Res. 2015, 300, 103–111. [Google Scholar] [CrossRef]
  19. Delle Donne, D.; Ripepe, M.; Lacanna, G.; Tamburello, G.; Bitetto, M.; Aiuppa, A. Gas mass derived by infrasound and UV cameras: Implications for mass flow rate. J. Volcanol. Geotherm. Res. 2016, 325, 169–178. [Google Scholar] [CrossRef]
  20. McGonigle, A.J.S.; Aiuppa, A.; Ripepe, M.; Kantzas, E.P.; Tamburello, G. Spectroscopic capture of 1 Hz volcanic SO2 fluxes and integration with volcano geophysical data. Geophys. Res. Lett. 2009, 36, L21309. [Google Scholar] [CrossRef]
  21. Pering, T.D.; Tamburello, G.; McGonigle, A.J.S.; Aiuppa, A.; James, M.R.; Lane, S.J.; Sciotto, M.; Cannata, A.; Patanè, D. Dynamics of mild strombolian activity on Mt. Etna. J. Volcanol. Geotherm. Res. 2015, 300, 103–111. [Google Scholar] [CrossRef] [Green Version]
  22. Pering, T.D.; McGonigle, A.J.S.; James, M.R.; Tamburello, G.; Aiuppa, A.; Delle Donne, D.; Ripepe, M. Conduit dynamics and post explosion degassing on Stromboli: A combined UV camera and numerical modelling treatment. Geophys. Res. Lett. 2016, 43, 5009–5016. [Google Scholar] [CrossRef] [PubMed]
  23. Lübcke, P.; Bobrowski, N.; Illing, S.; Kern, C.; Alvarez Nieves, J.M.; Vogel, L.; Zielcke, J.; Delgado Granados, H.; Platt, U. On the absolute calibration of SO2 cameras. Atmos. Meas. Tech. 2013, 6, 677–696. [Google Scholar] [CrossRef]
  24. Peters, N.; Hoffmann, A.; Barnie, T.; Herzog, M.; Oppenheimer, C. Use of motion estimation algorithms for improved flux measurements using SO2 cameras. J. Volcanol. Geotherm. Res. 2015, 300, 58–69. [Google Scholar] [CrossRef]
  25. Campion, R.A.; Delgado-Granados, H.; Mori, T. Image-based correction of the light dilution effect for SO2 camera measurements. J. Volcanol. Geotherm. Res. 2015, 300, 48–57. [Google Scholar] [CrossRef]
  26. Dalton, M.P.; Watson, I.M.; Nadeau, P.A.; Werner, C.; Morrow, W.; Shannon, J.M. Assessment of the UV camera sulfur dioxide retrieval for point source plumes. J. Volcanol. Geotherm. Res. 2009, 188, 358–366. [Google Scholar] [CrossRef]
  27. Yamamoto, H.; Watson, I.M.; Phillips, J.C.; Bluth, G.J. Rise dynamics and relative ash distribution in vulcanian eruption plumes at Santiaguito Volcano, Guatemala, revealed using an ultraviolet imaging camera. Geophys. Res. Lett. 2008, 35, L08314. [Google Scholar] [CrossRef]
  28. Campion, R.; Martinez-Cruz, M.; Lecocq, T.; Caudron, C.; Pacheco, J.; Pinardi, G.; Hermans, C.; Carn, S.; Bernard, A. Space- and ground-based measurements of sulphur dioxide emissions from Turrialba Volcano (Costa Rica). Bull. Volcanol. 2012, 74, 1757–1770. [Google Scholar] [CrossRef]
  29. Stebel, K.; Amigo, A.; Thomas, H.E.; Prata, A.J. First estimates of fumarolic SO2 fluxes from Putana volcano, Chile, using an ultraviolet imaging camera. J. Volcanol. Geotherm. Res. 2015, 300, 112–120. [Google Scholar] [CrossRef] [Green Version]
  30. Burton, M.R.; Salerno, G.G.; D’Auria, L.; Caltabiano, T.; Murè, F.; Maugeri, R. SO2 flux monitoring at Stromboli with the new permanent INGV SO2 camera system: A comparison with the FLAME network and seismological data. J. Volcanol. Geotherm. Res. 2015, 300, 95–102. [Google Scholar] [CrossRef]
  31. Kern, C.; Sutton, J.; Elias, T.; Lee, L.; Kamibayashi, K.; Antolik, L. An automated SO2 camera system for continuous, real-time monitoring of gas emissions from Kīlauea Volcano’s summit Overlook Crater. J. Volcanol. Geotherm. Res. 2015, 300, 81–94. [Google Scholar] [CrossRef]
  32. Wilkes, T.C.; McGonigle, A.J.S.; Pering, T.D.; Taggart, A.J.; White, B.S.; Bryant, R.G.; Willmott, J.R. Ultraviolet imaging with low cost smartphone sensors: Development and application of a raspberry Pi-based UV camera. Sensors 2016, 16, 1649. [Google Scholar] [CrossRef] [PubMed]
  33. Kern, C.; Lübcke, P.; Bobrowski, N.; Campion, R.; Mori, T.; Smekens, J.-F.; Stebel, K.; Tamburello, G.; Burton, M.R.; Platt, U.; et al. Intercomparison of SO2 camera systems for imaging volcanic gas plumes. J. Volcanol. Geotherm. Res. 2015, 300, 22–36. [Google Scholar] [CrossRef]
  34. Kantzas, E.P.; McGonigle, A.J.S.; Tamburello, G.; Aiuppa, A.; Bryant, R.G. Protocols for UV camera volcanic SO2 measurements. J. Volcanol. Geotherm. Res. 2010, 194, 55–60. [Google Scholar] [CrossRef] [Green Version]
  35. Kern, C.; Werner, C.; Elias, T.; Sutton, A.J.; Lübcke, P. Applying UV cameras for SO2 detection to distant or optically thick volcanic plumes. J. Volcanol. Geotherm. Res. 2013, 262, 80–89. [Google Scholar] [CrossRef]
  36. Tamburello, G.; Kantzas, E.P.; McGonigle, A.J.S.; Aiuppa, A. Vulcamera: A program for measuring volcanic SO2 using UV cameras. Ann. Geophys. 2011, 54, 219–221. [Google Scholar]
  37. McGonigle, A.J.S.; Hilton, D.R.; Fischer, T.P.; Oppenheimer, C. Plume velocity determination for volcanic SO2 flux measurements. Geophys. Res. Lett. 2005, 32, L11302. [Google Scholar] [CrossRef]
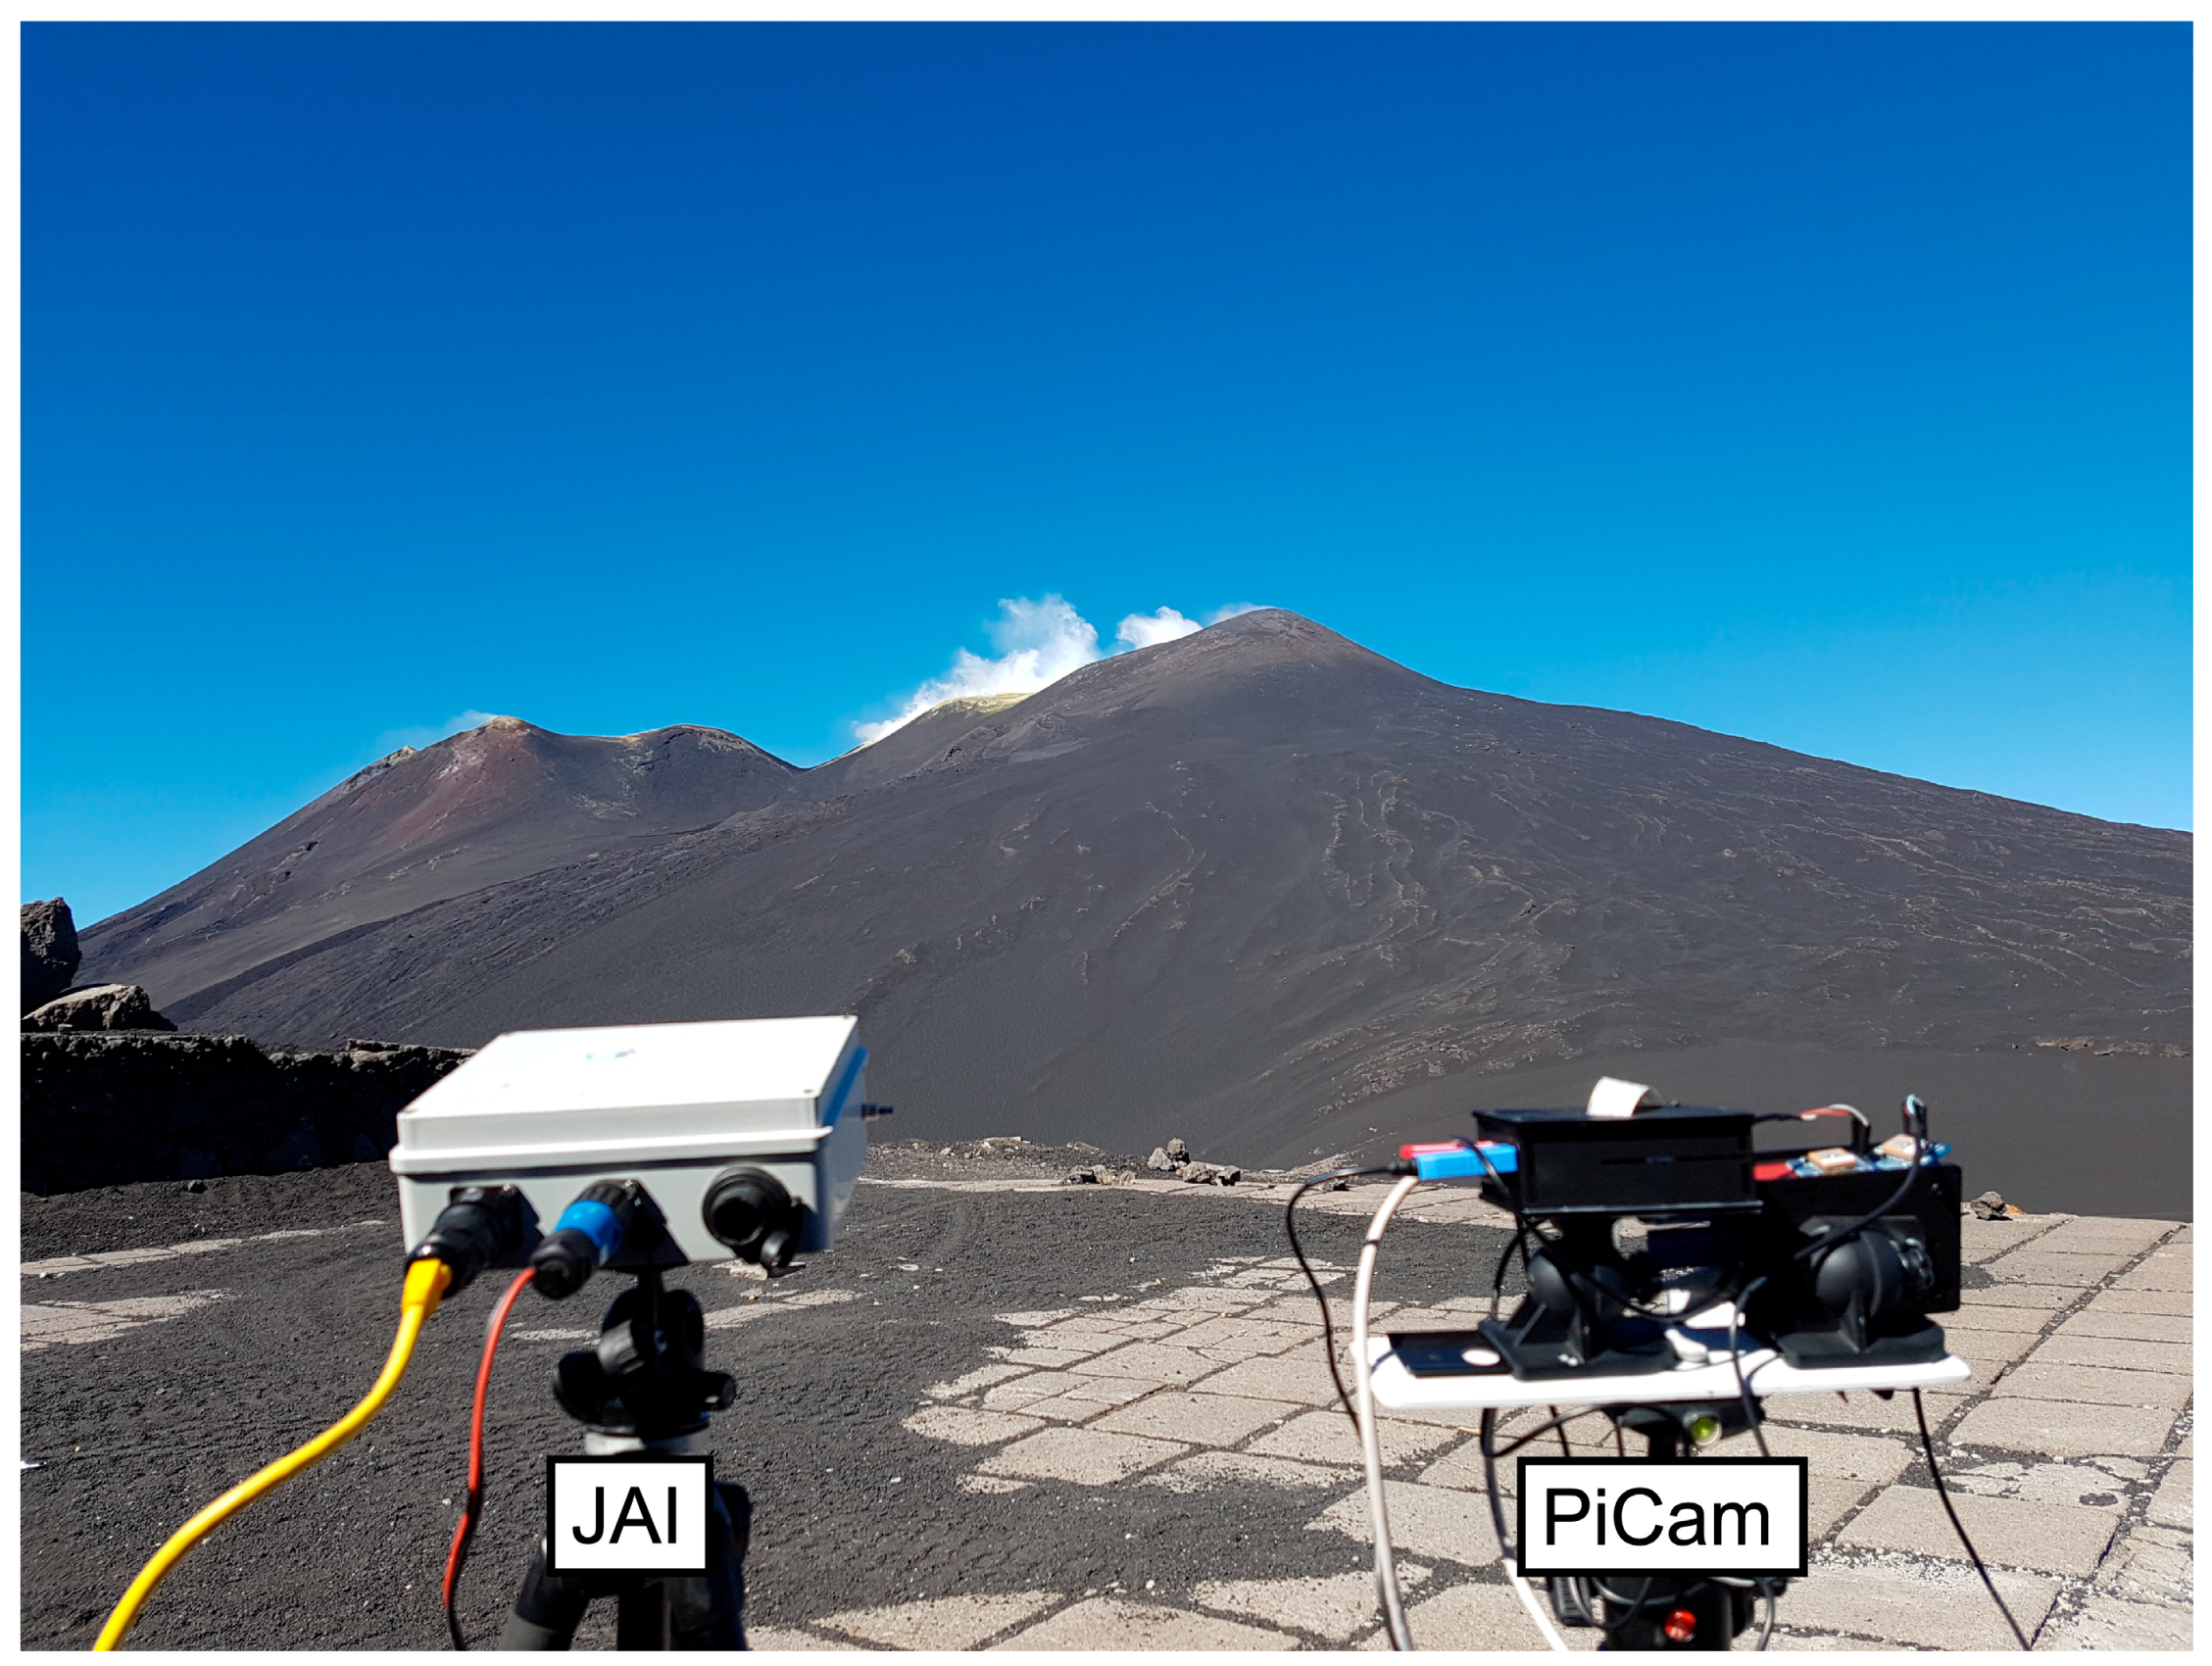
Figure 1. Side-by-side deployment of the JAI and PiCam UV cameras on 19 July 2016. The systems are imaging Etna’s North East Crater plume at ≈2.5 km distance.
Remotesensing 09 00027 g001
Figure 2. Images of Mount Etna’s plume taken with the PiCam units (top panels; pixels binned to 648 × 486) and the JAI systems (bottom panels) at 08:22:16 UTC on 19 July 2016. From left to right, the panels display 310 nm images, 330 nm images, and calibrated SO2 column amounts. The dotted black line in the calibrated SO2 images displays the profile across which integrated column amounts were retrieved.
Remotesensing 09 00027 g002
Figure 3. (A) Time synchronised SO2 fluxes calculated from the PiCam (black) and JAI (red) camera systems, between 07:49:00 and 08:35:08 UTC on 19 July 2016. The PiCam retrieved fluxes show excellent concordance with those of the JAI; (B) A scatter plot of contemporaneous fluxes, highlighting the remarkable correlation (r2 = 0.92).
Remotesensing 09 00027 g003
Figure 4. (A) Signal-to-noise ratios (SNRs); (B) Cross sections over apparent absorbance images for a SO2 cell (1861 ppm·m); (C) Detection limits for the JAI and PiCam systems with equivalent exposure times. For the PiCams, we examined both binned (648 × 486 and 1296 × 972) and full resolution (2592 × 1944) arrays. The former binning scenario provides approximately equal pixel resolutions across both systems (the JAI camera has a narrower FOV); the latter binning scenario provides approximately the same FOV per pixel from both systems. Four images were also co-added to increase SNR in (A,C) by summing four successive images on a pixel-by-pixel basis; results from this process are displayed as “4 pairs” entries. The drop in PiCam apparent absorbance at FOV > 10° is a manifestation of the gas cell holder entering the edge of the camera’s field of view and thus can be neglected. The 648 × 486 binning scenario, which we consider to provide sufficient spatial resolution for volcanic gas monitoring applications, provides comparable performance to the JAI cameras in these experiments. See main text for full details.
Remotesensing 09 00027 g004
Table 1. A summary of key UV camera specifications from a previous inter-comparative study into the relative performance of seven such units, which have been applied in volcano monitoring [33]. For these seven systems, the maximum, minimum, and mode value of each parameter are supplied here, in addition to the corresponding datum for the PiCam.
AttributeMinimumMaximumModePiCam
Sensor Resolution512 × 5121600 × 1200512 × 512 1380 × 10402592 × 1944
Bit Depth10161610
Quantum Efficiency at 300 nm~7%~60%~7%No data
Sensor Temp. (°C)−1010 or ambientambientambient
Full resolution frame rate (Hz)0.2516 10.50.5 2
Lens focal length (mm)12.550.4259
Field of View (W × H in °)7.2 × 5.528.8 × 21.923.1 × 23.123.1 × 17.3
Instrument size (cm)10 × 5 × 540 × 28 × 20None30 × 12 × 12 3
1 This frame rate is quoted as maximum achievable, although it is not necessarily a frame rate utilised in volcanology, which is commonly in the range of 0.25–1 Hz. 2 Tests to date have achieved this frame rate, although frames are dropped sporadically with our current version of the operating software; stable operation is currently available at 0.25 Hz. 3 In the current prototype arrangement here is scope to significantly reduce the PiCam’s footprint.