Article

Assessment of Regional Vegetation Response to Climate Anomalies: A Case Study for Australia Using GIMMS NDVI Time Series between 1982 and 2006

1
Division of Forest, Nature and Landscape, KU Leuven, Leuven 3001, Belgium
2
Division of Crop Biotechnics, KU Leuven, Leuven 3001, Belgium
3
Department of Geoscience & Remote Sensing, Delft University of Technology, 2628 CD Delft, The Netherlands
4
Department of Earth System Science and Policy, University of North Dakota, Grand Forks, ND 58202, USA
5
CSIRO Land and Water, Canberra ACT 2601, Australia
6
Remote Sensing Department, Flemish Institute for Technological Research (VITO), Antwerp Mol 2400, Belgium
*
Author to whom correspondence should be addressed.
Remote Sens. 2017, 9(1), 34; https://doi.org/10.3390/rs9010034
Submission received: 17 August 2016 / Revised: 15 December 2016 / Accepted: 22 December 2016 / Published: 4 January 2017

Abstract

:
Within the context of climate change, it is of utmost importance to quantify the stability of ecosystems with respect to climate anomalies. It is well acknowledged that ecosystem stability may change over time. As these temporal stability changes may provide a warning for increased vulnerability of the system, this study provides a methodology to quantify and assess these temporal changes in vegetation stability. Within this framework, vegetation stability changes were quantified over Australia from 1982 to 2006 using GIMMS NDVI and climate time series (i.e., SPEI (Standardized Precipitation and Evaporation Index)). Starting from a stability assessment on the complete time series, we aim to assess: (i) the magnitude and direction of stability changes; and (ii) the similarity in these changes for different stability metrics, i.e., the standard deviation of the NDVI anomaly (SD), auto-correlation at lag one of the NDVI anomaly (AC) and the correlation of NDVI anomaly with SPEI (CS). Results show high variability in magnitude and direction for the different stability metrics. Large areas and types of Australian vegetation showed an increase in variability (SD) over time; however, vegetation memory (AC) decreased. The association of NDVI anomalies with drought events (CS) showed a mixed response: the association increased in the western part, while it decreased in the eastern part. This methodology shows the potential for quantifying vegetation responses to major climate shifts and land use change, but results could be enhanced with higher resolution time series data.

Graphical Abstract

1. Introduction

Ecosystems provide important services to man and society, such as water purification, regulation of climate, pests and diseases, pollination, provision of wildlife habitat, biodiversity conservation and the delivery of wood and products through ecosystem functions, such as biomass production [1]. However, changes in average climate conditions, as well as increased frequency of climate extremes, suggested by the latest IPCC scenarios, threaten the stable delivery of these services [2]. Consequently, understanding the stability of these ecosystem services is of critical importance. Methods that examine the stability of natural and productive systems using remote sensing can therefore be useful for this kind of assessment.
Vegetation or ecosystem stability is commonly measured using four main stability metrics. At the moment a disturbance occurs, the vegetation state may change, where the ability of the ecosystem to withstand the disturbance is referred to as resistance. After the disturbance, the ecosystem may return to its original state. The speed at which the ecosystem returns is denoted by engineering resilience. However, sometimes the disturbance is strong enough or changing conditions have diminished its engineering resilience, and the system might change its regime, i.e., find a new stable state. The magnitude of disturbance needed for the system to switch regime is called ecological resilience. Finally, variance denotes the total variability of the system in response to environmental anomalies [3].
In order to quantify vegetation stability, the response of a vegetation state indicator, such as biomass, should be assessed in relation with the disturbances. The large-scale quantification of biomass or other vegetation state indicators is however difficult to achieve.The assessment is often labor intensive, costly and sometimes even destructive. Remote sensing time series of vegetation indices provide a means to retrieve indicators of vegetation stability at a global scale. Several indices, such as the Normalized Difference Vegetation Index (NDVI) or Enhanced Vegetation Index (EVI), have been developed, which are related to the biomass and greenness of vegetation [4]. The characteristics of these remote sensing time series, and more specifically their anomalies, can be used to obtain large-scale spatial patterns of vegetation stability. For example, the anomaly value associated with the moment of disturbance is an indicator of the resistance of the system. The standard deviation can be related to the variance and the auto-correlation at lag one can be related to engineering resilience [5].
Estimating resistance, engineering resilience or variance using a single metric on a complete anomaly time series, however, poses problems in a situation where the vegetation response changes over time [6]. This is illustrated in Figure 1, where two time series are shown with the same overall standard deviation and auto-correlation at lag one. While Time Series B is stationary (i.e., the characteristics of the time series, such as its variability, mean and the relationship between subsequent observations do not change over time), Time Series A shows changing behavior. Its auto-correlation at lag one and standard deviation increases over time, which could be interpreted as a sign of increased vulnerability (i.e., lower resilience and higher variability, respectively).
Assessment of such changes in vegetation response is of major importance for management purposes [7]. It may provide a warning for increased vulnerability and may serve as an indication for land managers that additional attention is required. Moreover, prior to the critical point of divergence when a regime shift occurs, vegetation response may show an altered response [8,9]. Vegetation is assumed to recover more slowly, i.e., critical slowing down, and its variability may increase before the shift [8,9,10]. Quantifying changes in vegetation recovery and variance thus potentially provides an extremely interesting asset for ecosystem management. It may allow one to monitor, predict and potentially intervene with ecosystems before a regime shift has occurred. The latter is of utmost importance, because these shifts may entail large economic and ecological losses, while their reversal may be extremely difficult [11]. Consequently, if changes in vegetation response are not observed and considered in ecosystem monitoring, important information about vegetation stability may remain unnoticed with severe consequences for production and function.
Many studies have already taken advantage of the availability of long-term and large-scale satellite time series to quantify changes in vegetation response or vegetation dynamics. Several of these studies focused on temporal trends of vegetation greenness indicators (i.e., greening or browning; [12,13,14,15,16]), revealing a greening trend in many parts of the world. Other studies quantified changes in phenology (e.g., [17], rainfall use efficiency [18], resilience [10] or the relation between inter-annual temperature variability and northern vegetation activity [19]. However, a study quantifying and related changes of the different aspects of vegetation stability, i.e., resistance, resilience and variance, has not been performed yet to our knowledge.
In previous studies [5,20], the utility of stability metrics such as standard deviation of the NDVI anomaly (SD; indicator of variance), autocorrelation at lag one of the NDVI anomaly (AC; indicator of resilience) and the correlation of NDVI anomaly (CS) with SPEI (Standardized Precipitation and Evaporation Index; indicator related to resistance), has been explored at the global scale. These studies indicated the potential of such metrics for detecting changes in vegetation stability and trends in vegetation cover associated with climate and land use change. Therefore, this study aims to test the usefulness of decomposing the NDVI time series signal into these metrics of vegetation stability for a regional environment subject to major climate fluctuations. More specifically, starting from a stability assessment on the complete time series, we aim to assess: (i) the magnitude and direction of stability changes; and (ii) the similarity in these changes for different stability metrics, which are indicators of resistance, resilience and variance. This study thus does not aim to draw detailed conclusions based on stability changes, but rather to investigate the usefulness of the concept. In order to frame the obtained stability metrics and changes in stability, the magnitude and direction of temporal vegetation stability changes will subsequently be linked to land cover types and changes in climate anomalies.

2. Materials and Methods

2.1. Study Area and Data

2.1.1. Study Area

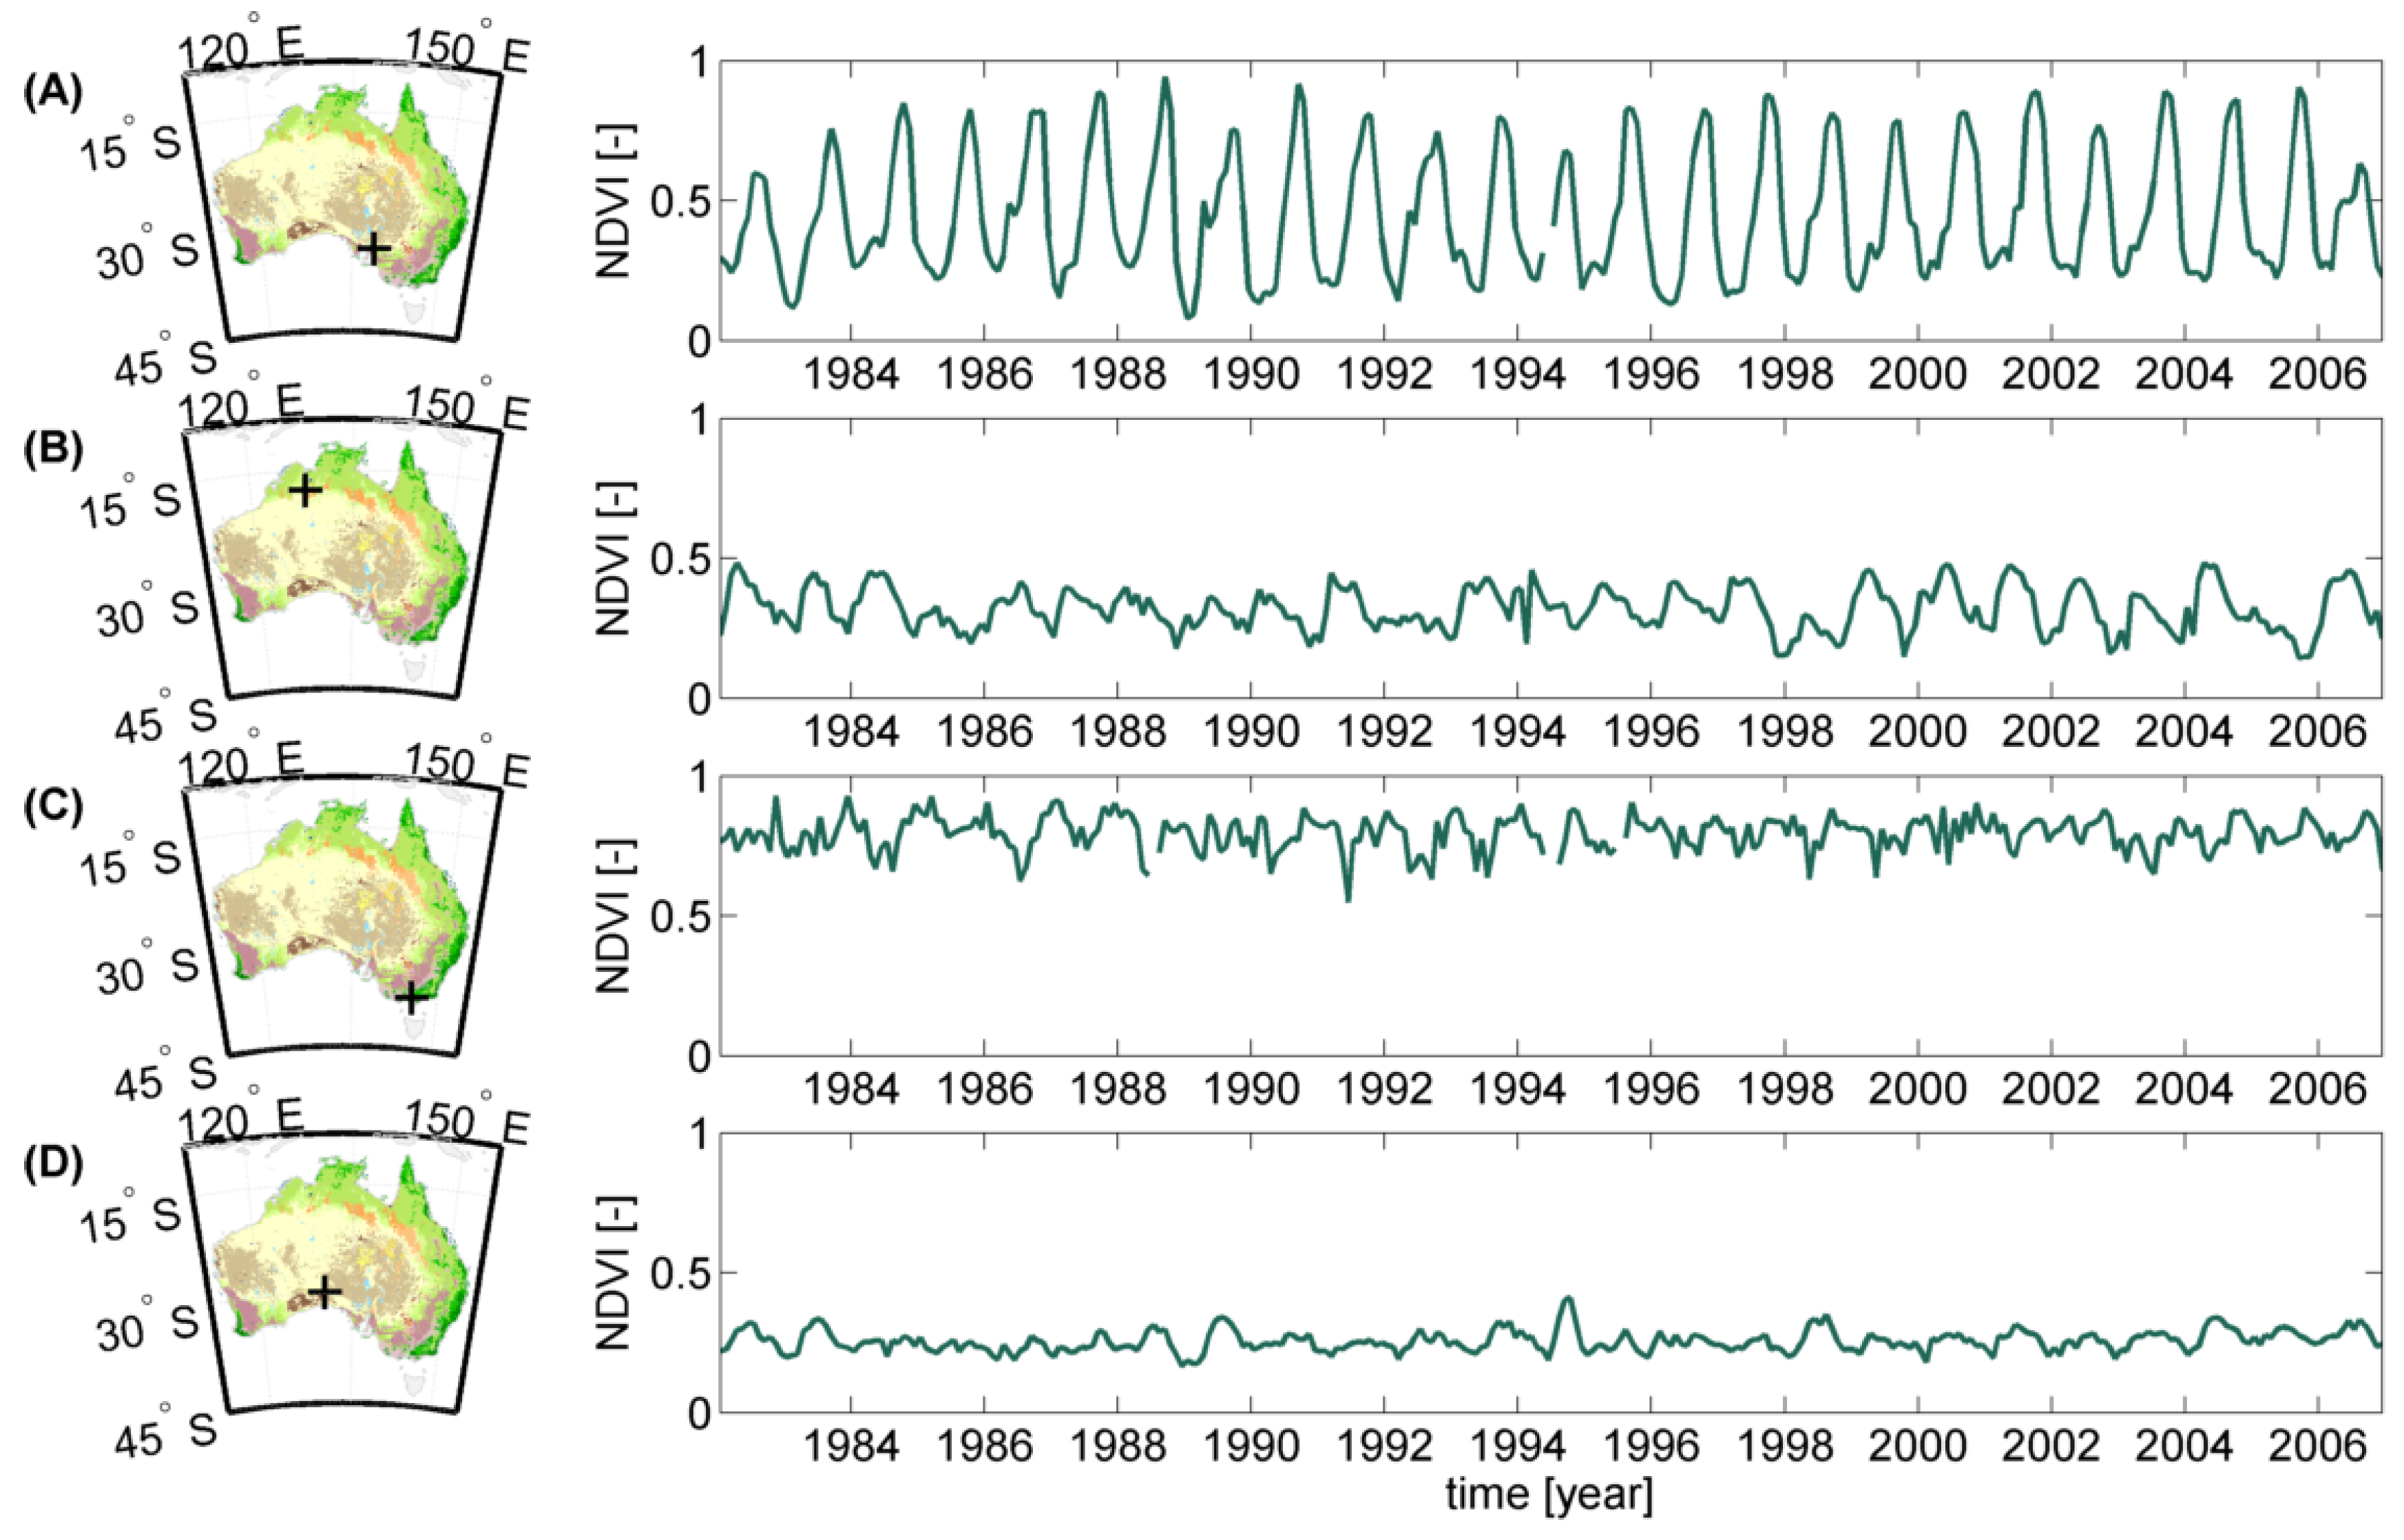
To study non-stationary vegetation response, we selected Australia as a study area. Australia contains a large variety of climate conditions and vegetation types ranging from humid warm climates with tropical rain-forests and eucalyptus forests in the north and northeast to arid warm climates with shrub-lands, hummock and tussock grasslands in the center to cool season wet climates in the south with a higher fraction of pasture and croplands. The precipitation and temperature variation across the continent provides a wide range of dynamic land surface behaviors (Figure 2) for comparison.
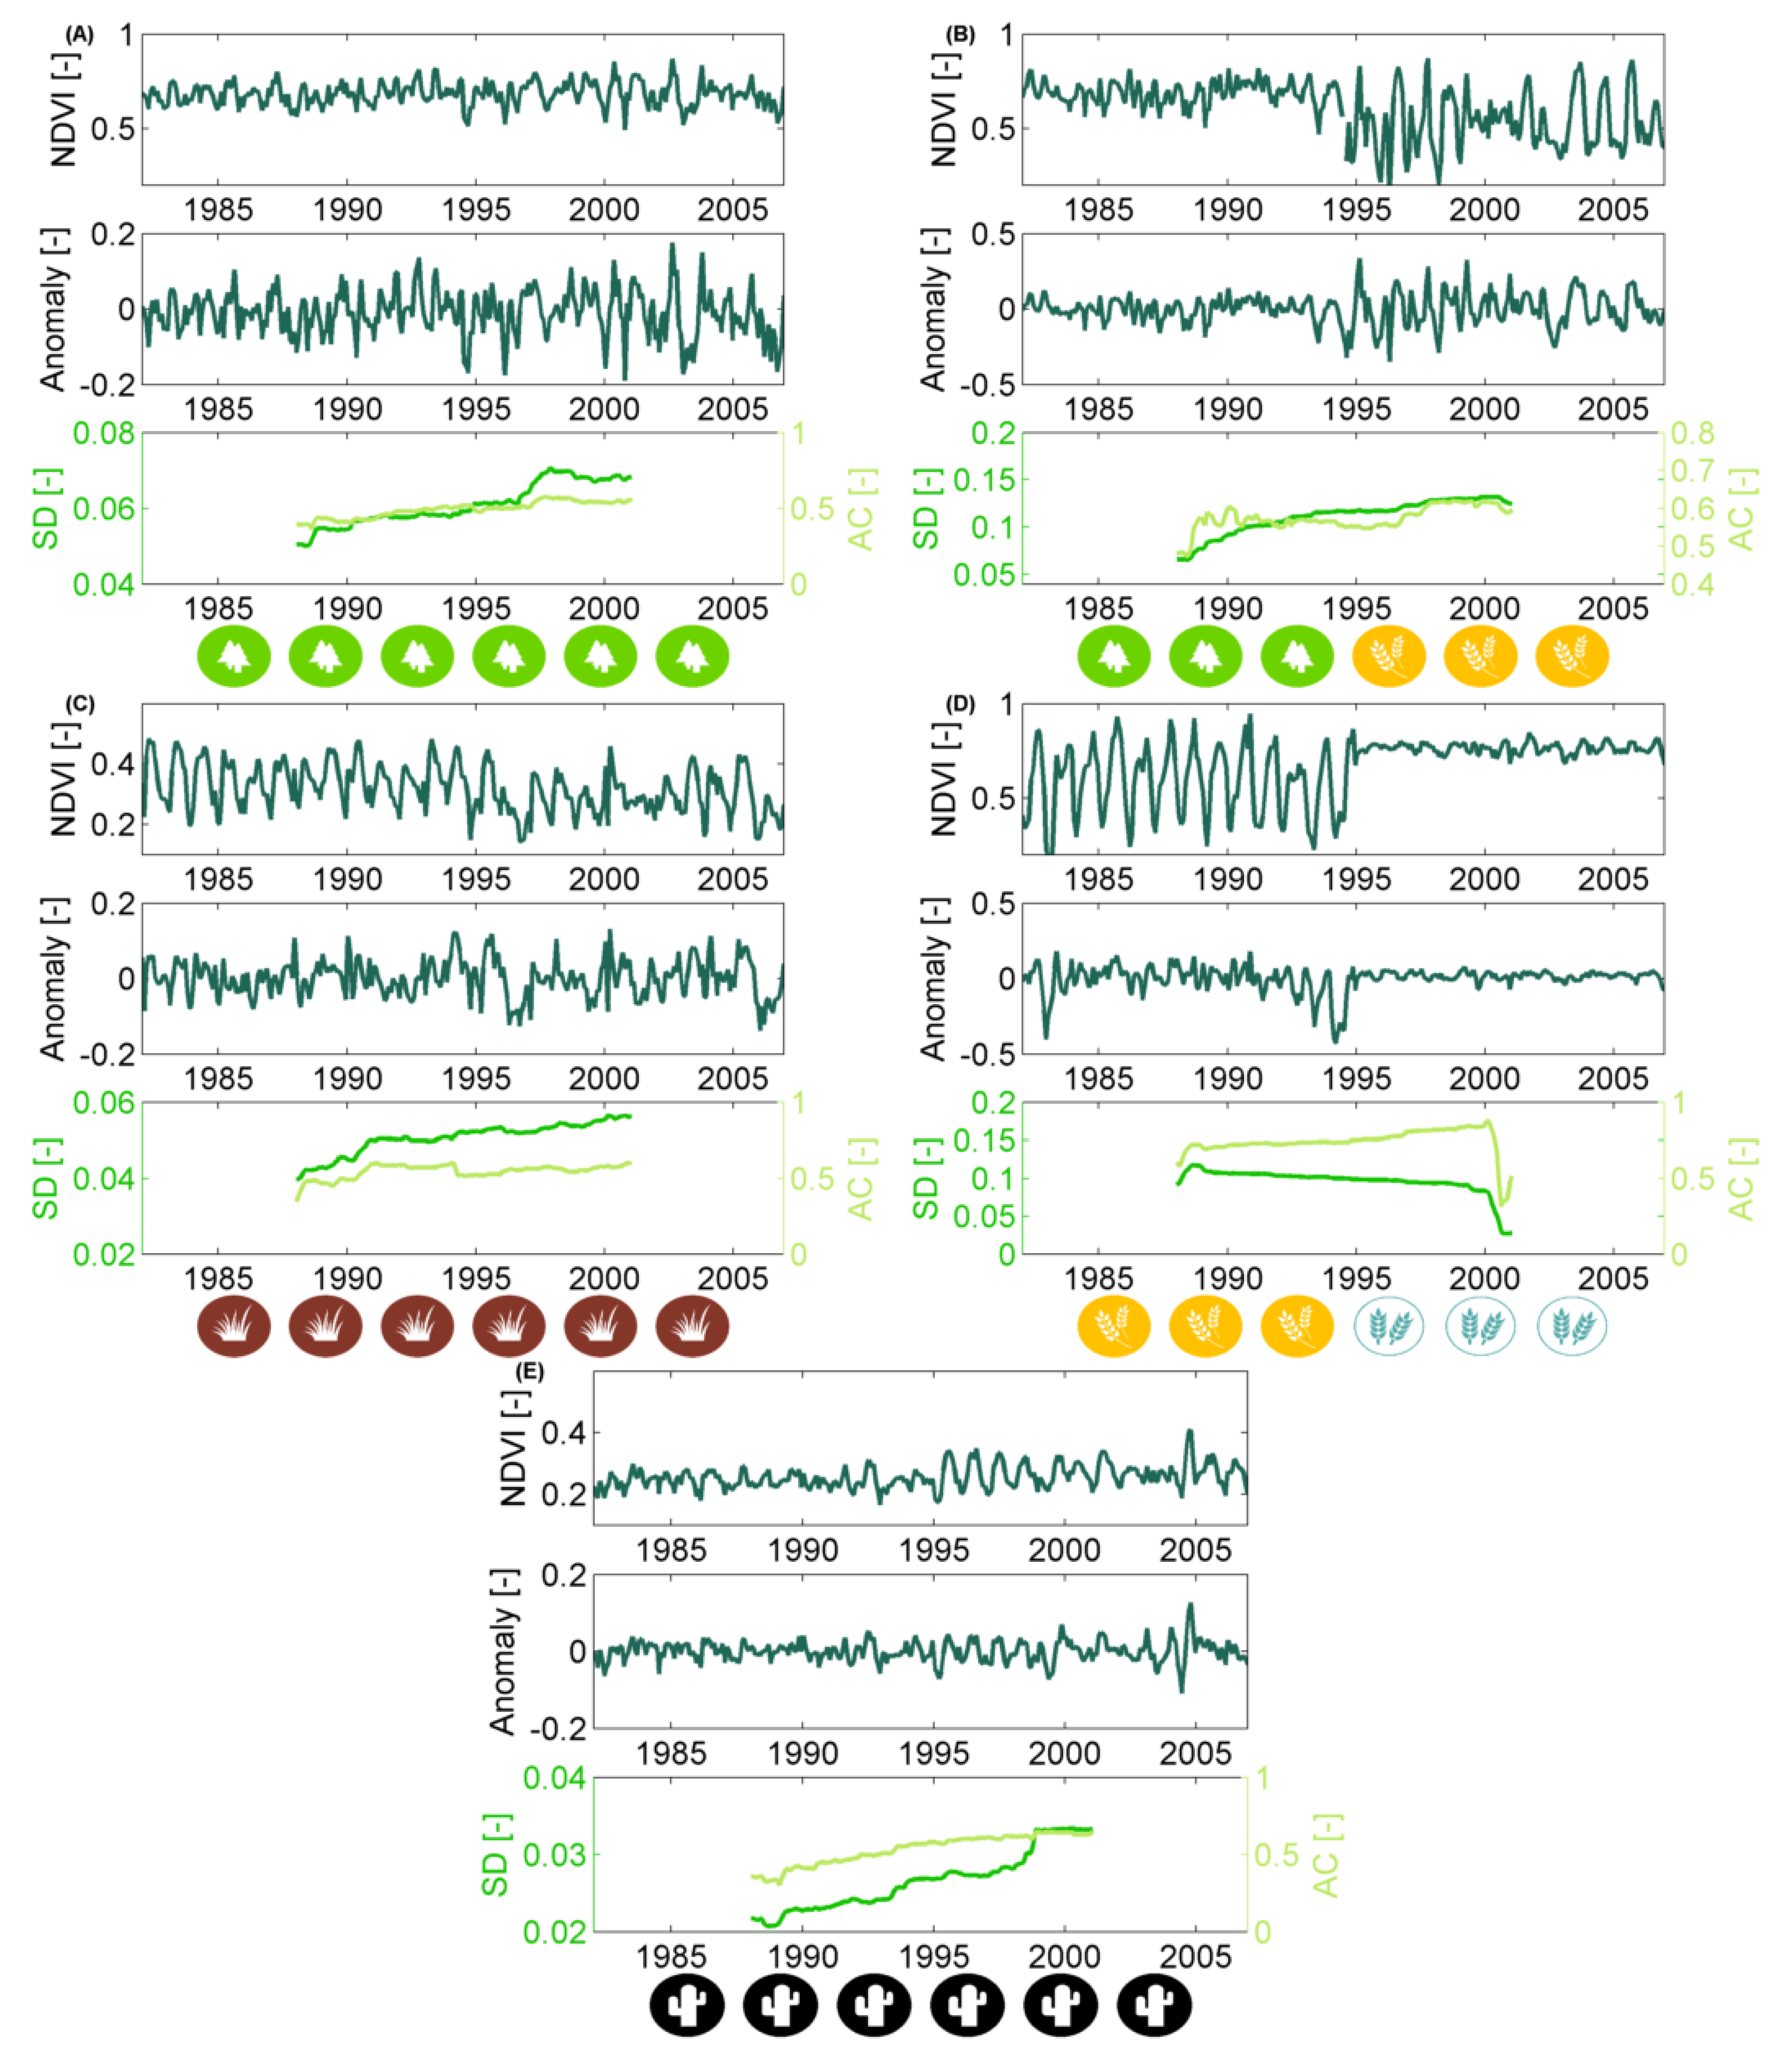
Moreover, the probability that altered vegetation dynamics are present and can be detected in Australia is high. Australia is a water-limited continent, subjected to highly variable precipitation patterns [21,22,23] due to, amongst others, the North Atlantic Oscillation (NAO) and El Niño–Southern Oscillation (ENSO) cycle [24,25]. Yet, over the past thirty years, the western part of the continent has received an upwards trend in precipitation, whereas precipitation in the eastern part decreased. The majority of the continent experiences a green-up, which is partially due to an increase in non-deciduous perennial vegetation [13]. These climatic changes, land cover changes and altered vegetation vulnerabilities are potential causes of non-stationary behavior [26,27,28], as illustrated in Figure 3. Furthermore, the limited and variable water availability, low NDVI saturation and relatively low cloud cover allow one to derive stability metrics with a relatively low model error from NDVI time series [20] and increase the likeliness that non-stationary behavior can be detected.

2.1.2. Land Cover Data, NDVI and Climate Time Series

NDVI Data

In order to quantify vegetation response, bimonthly 0.07° GLCF Global Inventory Modeling and Mapping Studies (GIMMS) NDVIg [29,30] time series were obtained over the 1982 to 2006 period. After the removal of low quality data using the associated quality flags, i.e., flags not equal to zero, the data were temporally averaged to monthly data in order to agree with the climate data. Time series having less than ten non-adjacent missing values were subsequently linearly interpolated. Time series having more than ten missing values or adjacent missing values were discarded in order to avoid inserting bias into the stability metrics.

Climate Data

Monthly 0.5° time series of the Standardized Precipitation and Evapotranspiration Index (SPEI; [31,32]) were used to quantify drought over the 1982 to 2006 period. The SPEI is a site-specific drought indicator based on deviations from the average water balance. The latter was defined as the precipitation minus potential evapotranspiration over a specific time scale. Positive/negative SPEI values therefore indicate wetter/dryer periods than average. A three-monthly time scale was used to maximize its correlation with vegetation dynamics and reduce the influence of noise [33,34]. Although vegetation may show variable lag effects, depending on the vegetation and environmental characteristics, a single time scale has been used to keep the results synoptic. The data were further resampled from the 0.5 grid to the 0.07° GIMMS grid.

Land Cover Data

The Australian vegetation was characterized based on (i) the type and degree of disturbances and (ii) its land cover. To characterize the type of disturbances, Australia was split into two main parts using the average 0.05° yearly precipitation over 30 years (1977 to 2006; [35], http://www.auscover.org.au/xwiki/bin/view/Product+pages/). Regions having a yearly precipitation lower than 200 mm were classified into arid lands and rangelands, whereas regions receiving more than 200 mm precipitation were considered to be productive lands. Arid lands or rangelands tend to be more natural, resilient and operate on relatively long cycles (i.e., due to changes in precipitation). In reverse, productive lands are more heavily altered and utilized. They contain both native and introduced vegetation and are subjected to a mixture of disturbances, such as climate anomalies, land clearing, fires and grazing.
Land cover was described using the Dynamic Land Cover Dataset [36], which contains 34 land cover classes, ranging from cultivated land covers (e.g., pastures) to natural land cover (e.g., tussock grasslands) and was created through the clustering of MODIS EVI time series characteristics. The 0.0023 degree land cover dataset was resampled to the GIMMS grid through assigning the land cover class covering the largest part of the pixel (i.e., the dominant land cover type). These dominant land cover classes had a 10 and 90 percentile cover of 39% and 93% of the GIMMS pixels, respectively.

2.2. Methodology

  • The vegetation response and climate anomaly were extracted from the NDVI and climate time series (Section 2.2.1).
  • Stability metrics were calculated over a running window of the anomaly time series, resulting in new time series of stability metrics.
  • In order to quantify how much the stability changes over time and whether the stability generally increases or decreases, two non-stationarity metrics were defined: the magnitude and direction of stability change (Section 2.2.2).
  • The non-stationarity of each stability metric was linked to vegetation and environmental characteristics to enhance their interpretation.

2.2.1. Non-Stationary Anomaly Time Series

The NDVI and climate time series can be decomposed into three main components, each of which may change over time: (i) the seasonality; (ii) the trend; and (iii) the anomaly. The NDVI seasonality reflects vegetation phenology (e.g., timing of greening and senescence). Trends may be caused by sensor drift or very gradual vegetation response (i.e., greening or browning due to altered management or gradual degradation). Finally, the remainder or anomaly is determined by the vegetation response to disturbances such as droughts and noise (e.g., negative spikes due to clouds or high aerosol concentrations) [37,38]. As the stability metrics aim to characterize the short-term vegetation response, the anomaly component needs to be extracted.
In order to obtain each of the three time series components, while taking non-stationary behavior (e.g., gradual and abrupt changes) into account, the Breaks For Additive Season and Trend (BFAST; [37]) algorithm was applied on the NDVI time series. The BFAST algorithm iteratively splits the time series in each of the three time series components, where breakpoints and their associated confidence intervals are estimated for the seasonality and trend time series. As such, this algorithm allows one to define anomaly time series while explicitly accounting for non-stationary seasonality and trends.

2.2.2. Quantifying Non-Stationarity of the Short-Term Vegetation Response

Short-term vegetation response was subsequently characterized using three stability metrics on the anomaly time series: (i) the standard deviation (SD) of the NDVI anomaly time series; (ii) the auto-correlation at lag one (AC) of the NDVI anomaly; and (iii) the correlation between the NDVI anomaly and SPEI time series (CS) (Figure 4). The latter two metrics were obtained by modeling the NDVI anomaly in function of the drought index and the lagged NDVI anomaly, where all time series were standardized [20]. More information about these metrics can be found in Table 1. In order to break down vegetation response temporally, these metrics were applied on a moving window of twelve years, resulting in time series of each stability metric. The magnitude and direction of changes in stability were then defined as (i) the range (90th percentile to 10th percentile of the stability metric) and (ii) the slope of the stability metric. The latter was obtained using the non-parametric Kendall τ rank correlation coefficient [39,40], where non-significant slopes (i.e., p-value > 0.05) were considered not to differ from zero. Positive slopes indicate an increase of the stability metric over time. An overview of the methodology can be found in Table 1.
Although the time series of the SD and AC metric provide interesting information concerning changes in vegetation response, they do not account for temporal variability of climate anomalies. For example, the standard deviation of an NDVI time series may increase because the number of precipitation extremes increases, while its response intrinsically remains the same. In reverse, if the climate anomaly characteristic remains the same and the variability of the NDVI anomaly increases, vegetation may becomes more sensitive over time. Similarly, an increase in the duration of droughts may increase the auto-correlation of the NDVI time series. To reveal the relation between the dynamics in the NDVI anomalies and the climate anomalies, the Kendal τ rank correlation coefficient was calculated between the AC or SD time series of the NDVI anomaly (i.e., derived using the moving window) and the AC or SD time series of the climate anomaly.

3. Results

3.1. Stability Derived over the Complete Time Period

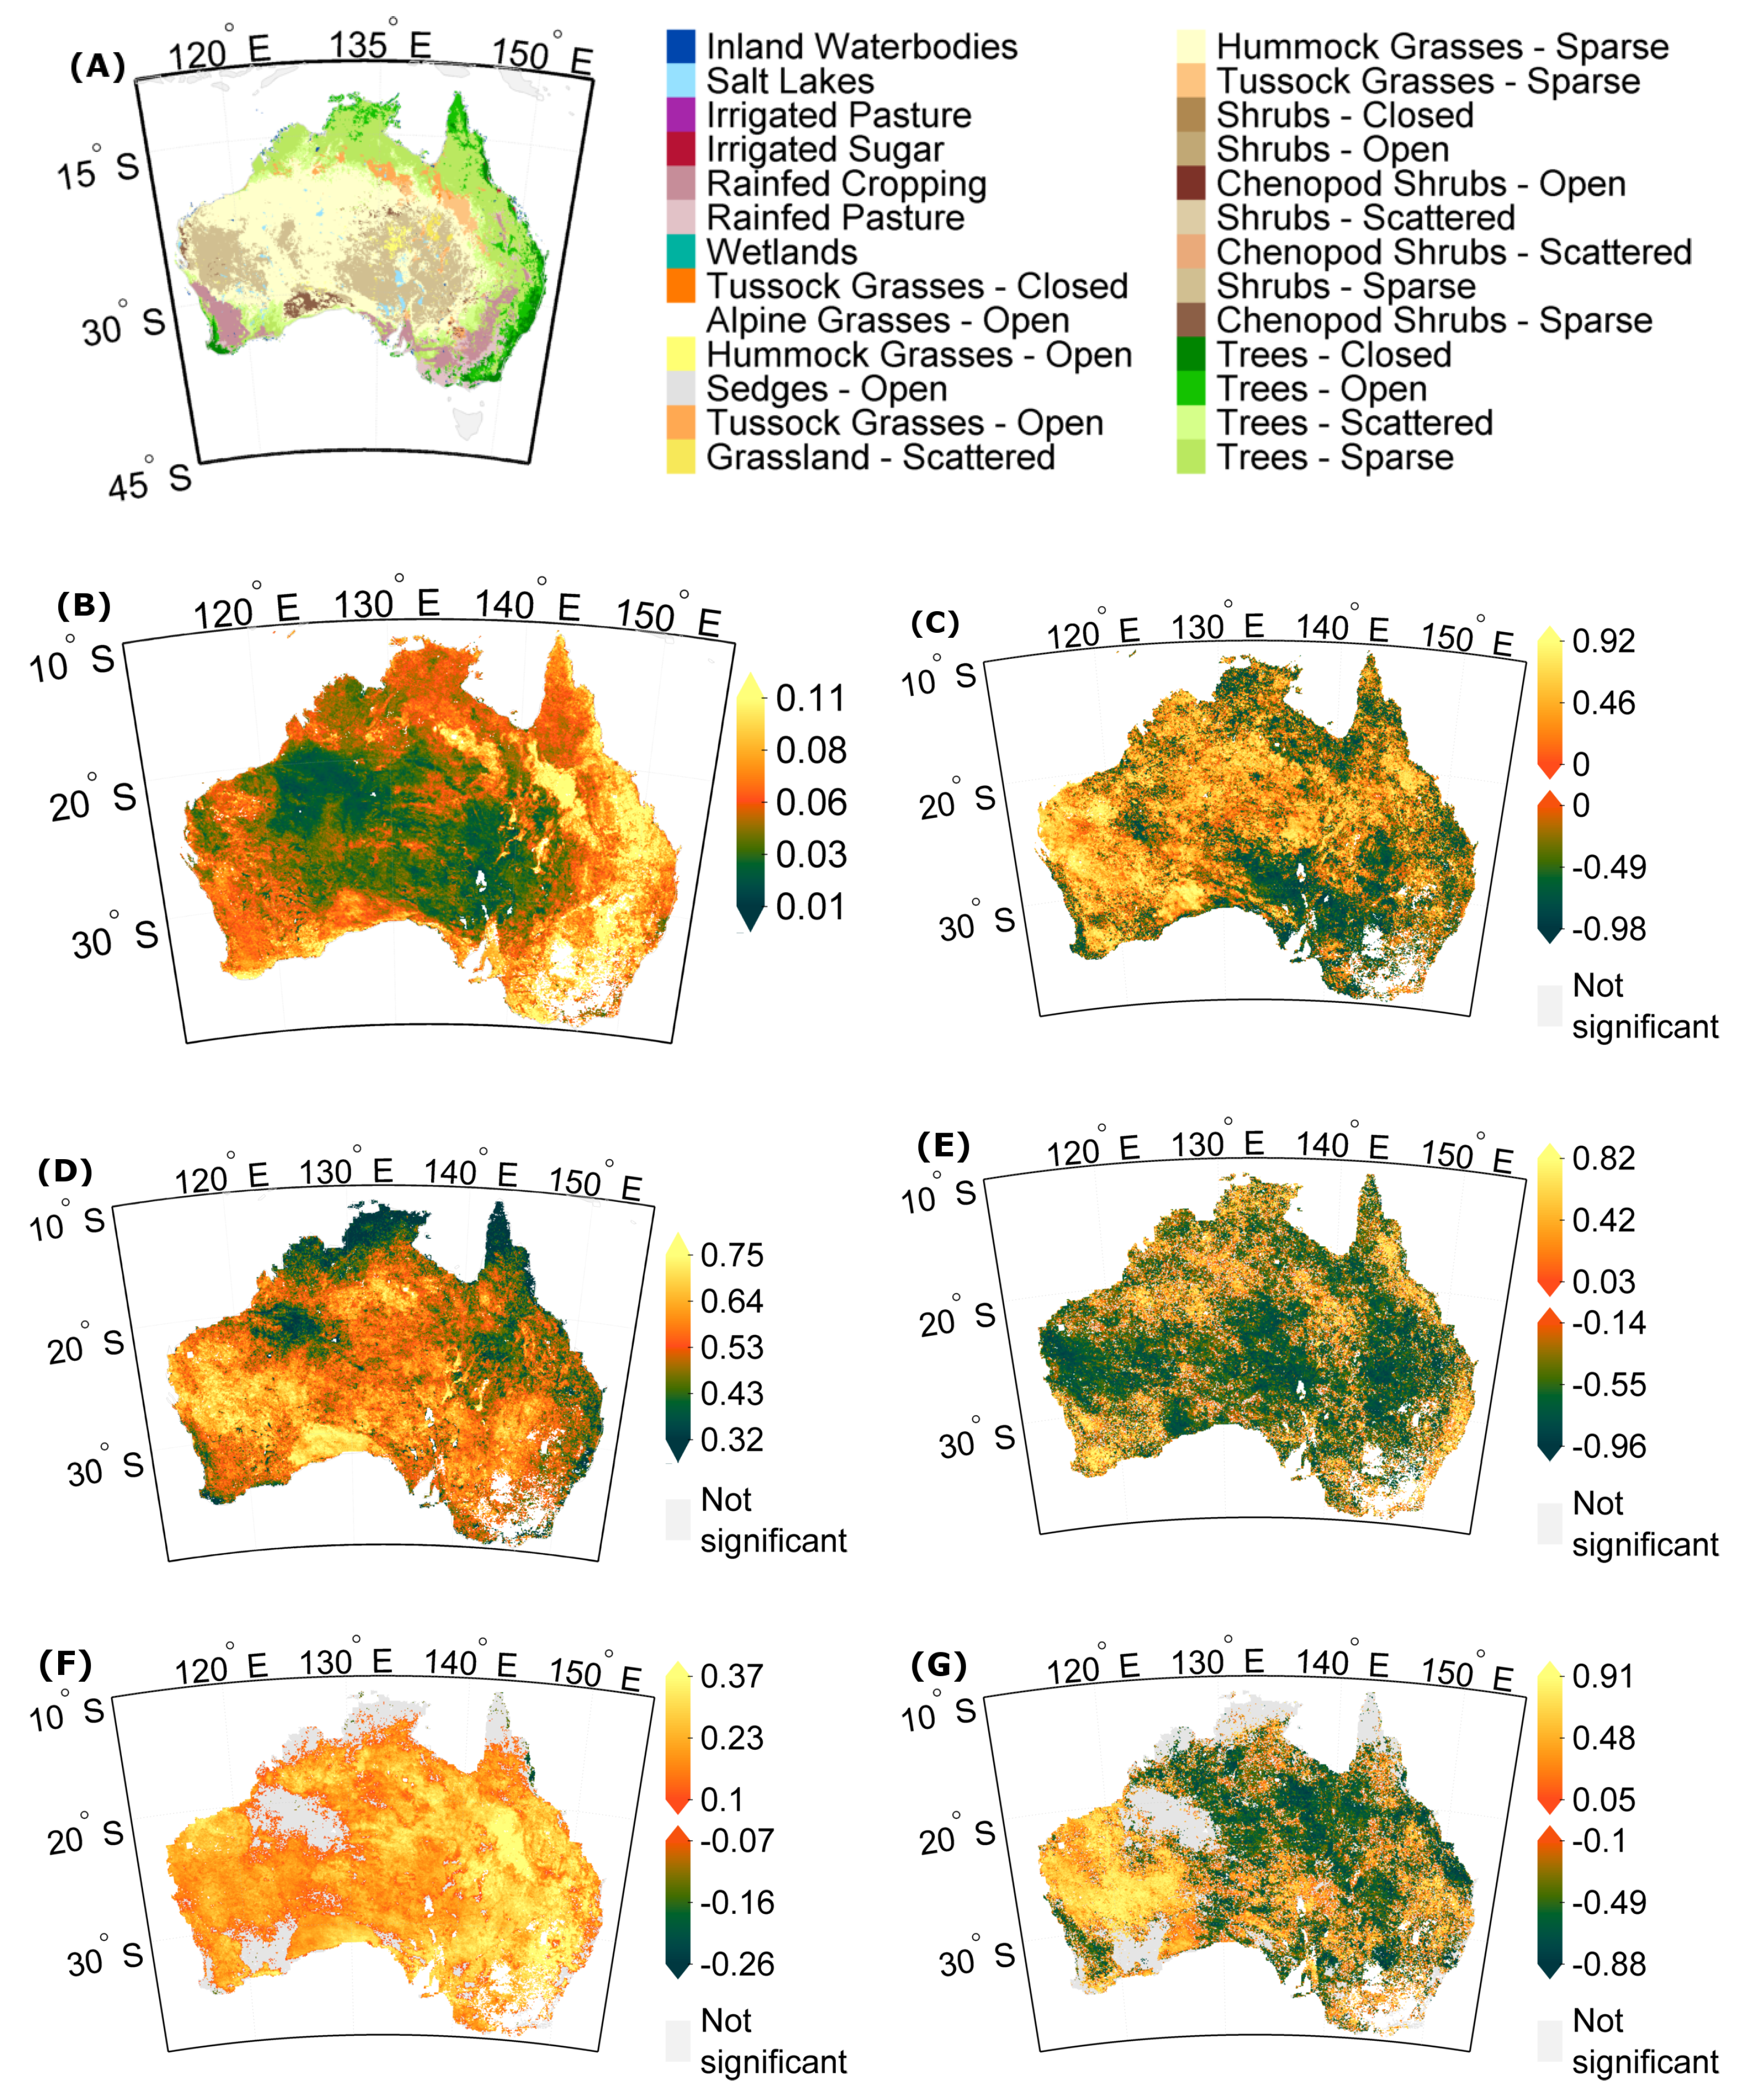
In order to frame temporal stability changes, each of the stability metrics were first derived over the complete time period. These metrics illustrate that vegetation response clearly differs spatially and is linked to the land cover types and environmental conditions (Figure 5 and Figure 6). For example, the tussock grasslands on vertisols (deep cracking clay soils) delimit an area having the highest variability and a large, negative response to droughts (i.e., high value for the variance metric (SD) and drought response metric (CS)), but show a relatively low memory effect (i.e., low value for the resilience metric (AC), thus high resilience). In reverse, chenopod shrubs on calcarosols in the south and shrubs in the western part of Australia have the highest memory effect (i.e., highest resilience metric (AC), thus low resilience) and show a mediocre variance (SD) and response to droughts (drought response metric (CS)). The majority of the arid region is further associated with a low NDVI variability (variance metric (SD)), mediocre memory effect (resilience metric (AC)) and relatively high resistance to droughts (low drought response metric (CS)).
Furthermore, although most pixels show a significant memory effect (i.e., resilience metric (AC)), large areas show no significant correlation with the drought index (drought response metric (CS)). The northern and southern part of the region with an insignificant response to droughts is situated in areas having tree vegetation. These areas are also associated with a mediocre variance (SD) and the lowest memory effect (i.e., lowest resilience metric (AC), highest resilience). Besides tree vegetation, also the northeastern area, which is sparsely vegetated with hummock grasses, shows a insignificant response to droughts (drought response metric (CS)), has the lowest variance metric (SD) and a low memory effect (low resilience metric (AC), high resilience).

3.2. How Much Does Vegetation Stability Change over Time?

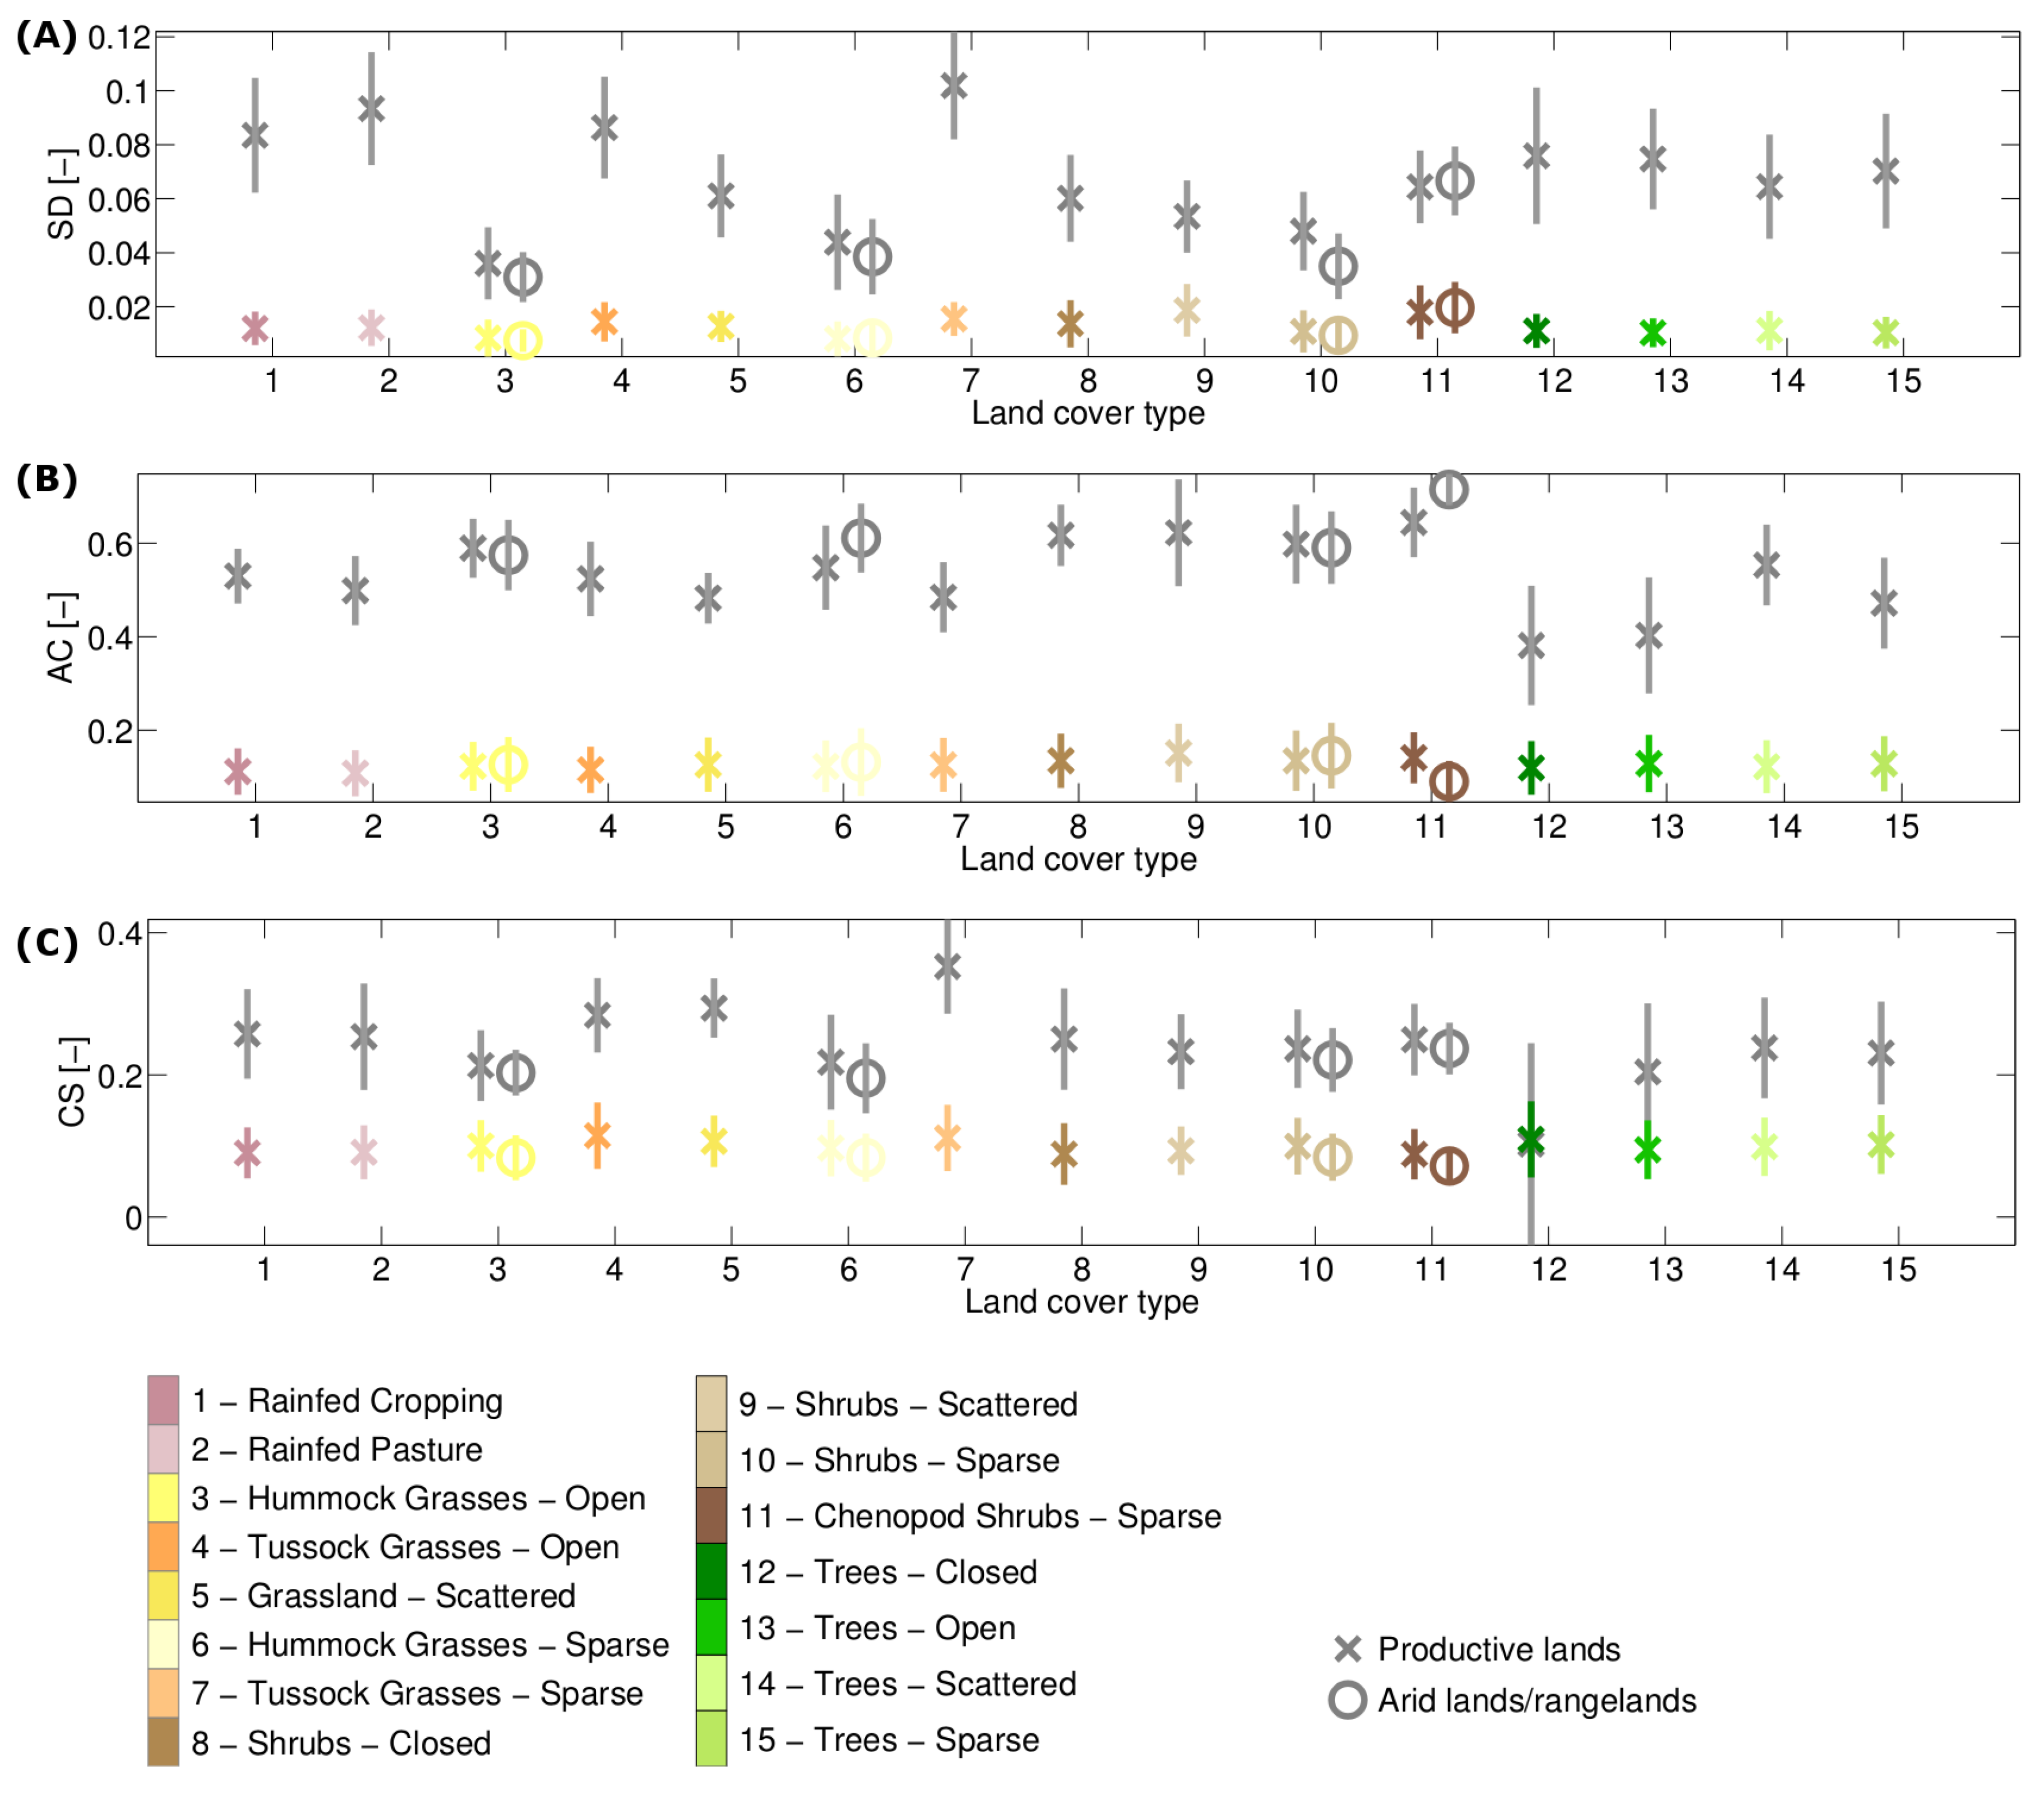
Although the stability metrics derived over the complete time period show spatial patterns that are related to vegetation and environmental characteristics, the vegetation response may change over time. The change magnitude (range of the temporal stability metric changes) is dependent on the stability metric considered (Figure 6). For example, the change magnitude of the stability metrics comprised about 12% to 33%, 15% to 25% and 50% of the absolute value of the variance (SD), resilience (AC) and drought response (CS) metrics derived over the entire time period, respectively.
Another aspect associated with the temporal stability metric changes is its variability between land cover types. Although the differences are relatively small, the change magnitude (range of the temporal stability metric changes) differs between land cover types. For example, sparse chenopod shrubs and scattered shrubs show the largest temporal changes in the variability metric (SD), while changes are relatively small for open hummock grasses and sparse shrubs. For the drought response metric (CS), the tussock grasses show the largest temporal change. Furthermore, the change in the drought response metric (CS) for land cover types in the arid areas is smaller compared to their counterpart in the productive areas (0.0154 on average), while the differences are very small for the other metrics (0.00008 and 0.007 for the SD and AC, respectively). Yet, due to the relatively small differences in change magnitude between land cover types, the change becomes more important for land cover types having a small overall stability metric (e.g., changes in the variability metric (SD) or drought response metric (CS) for open hummock grasses).

3.3. Is Vegetation Response Becoming More/Less Stable over Time?

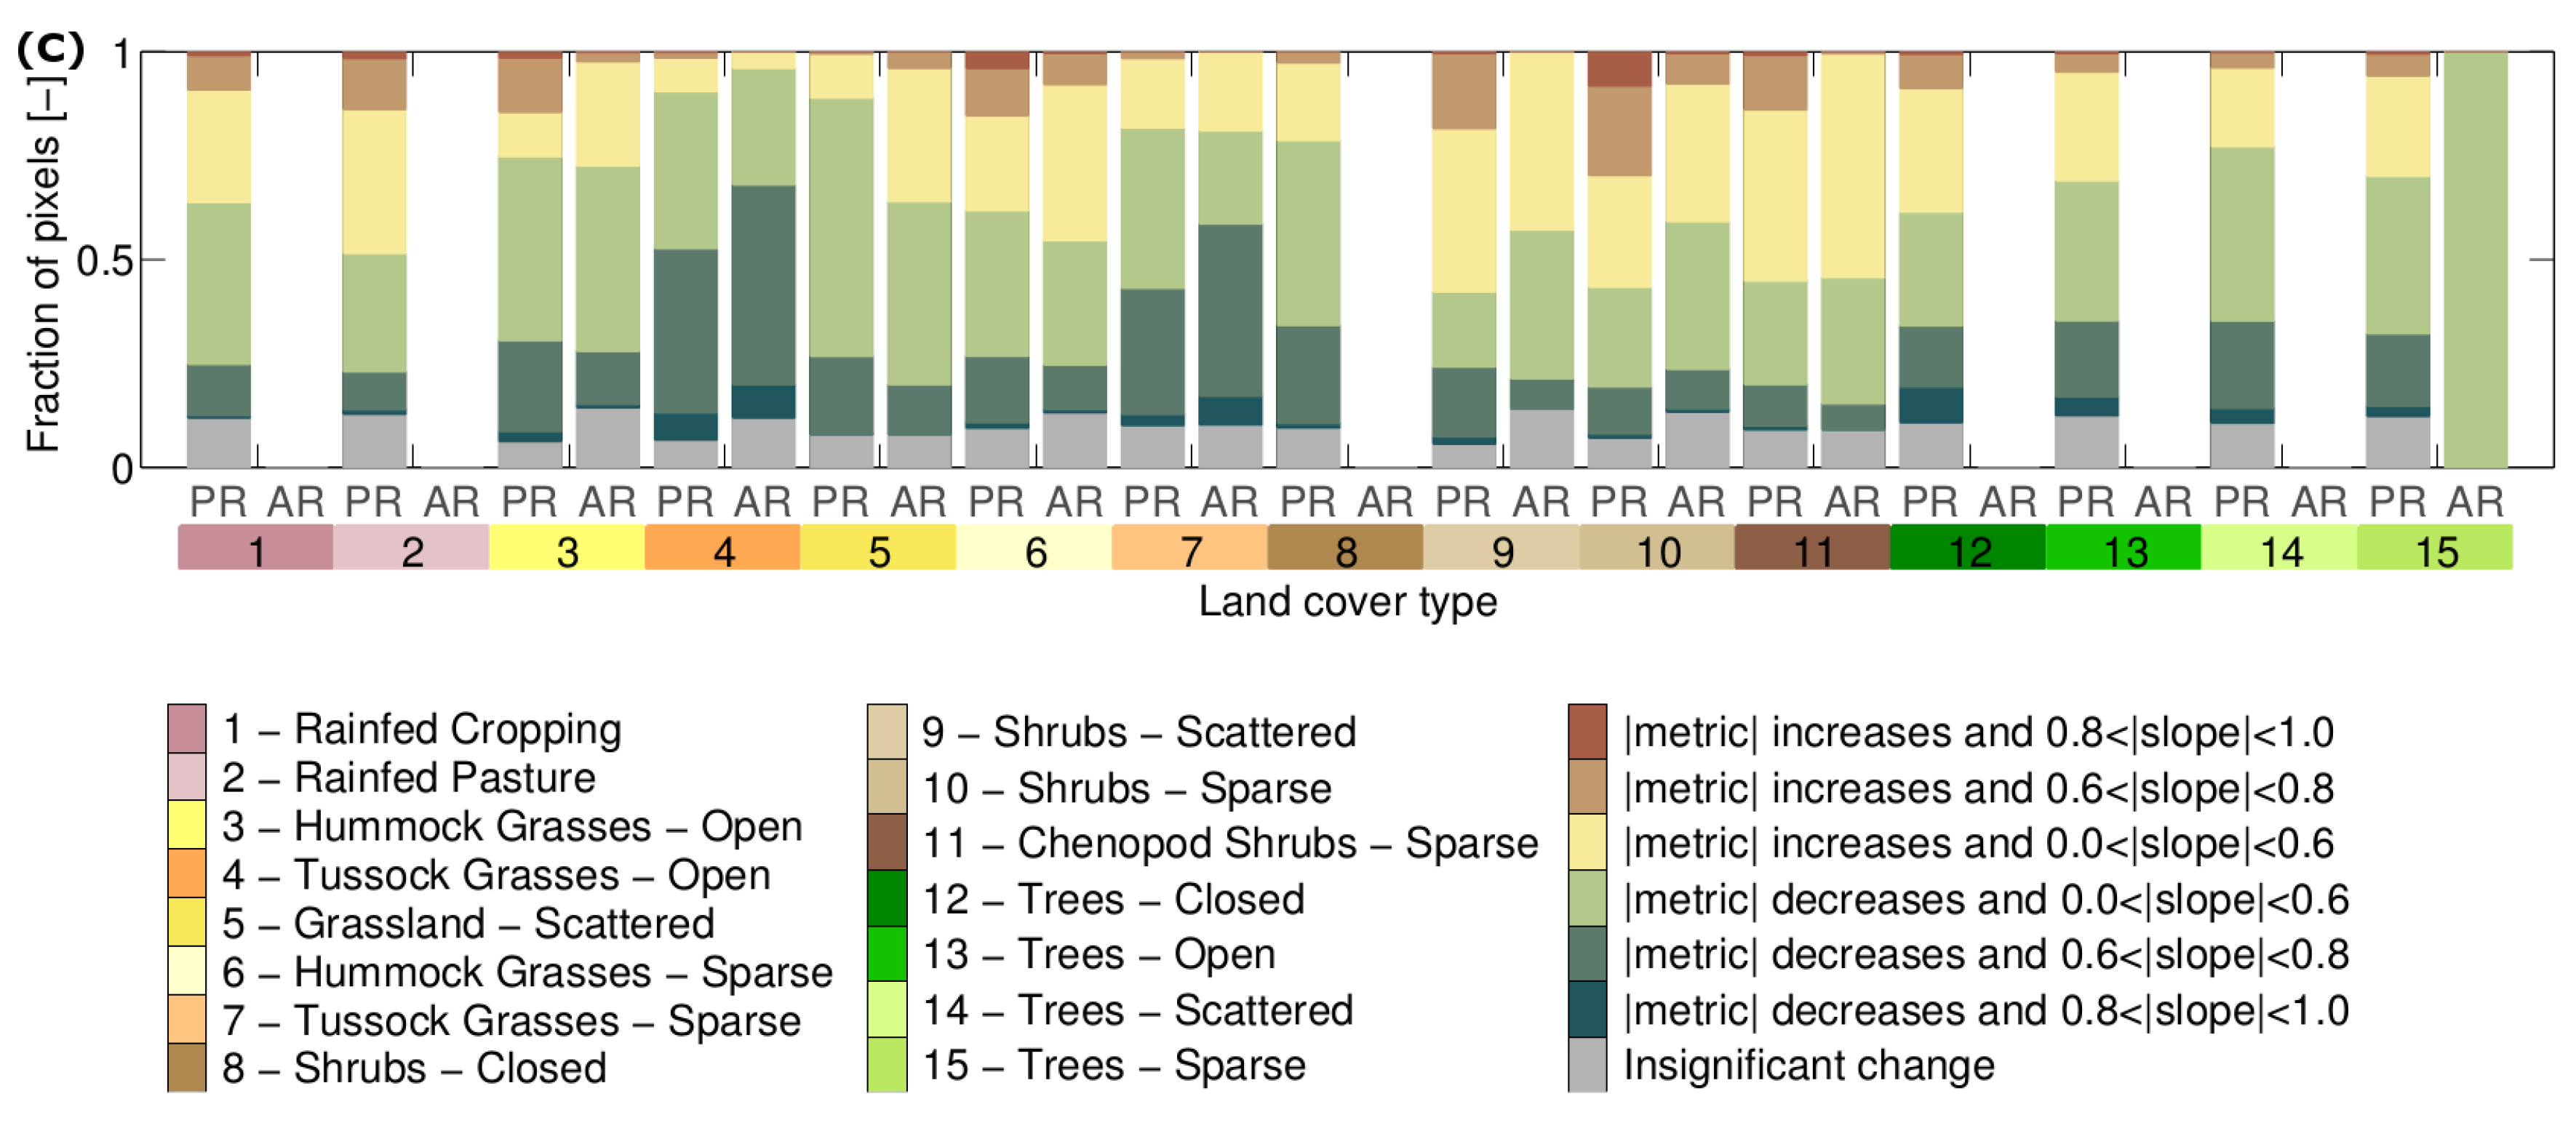
Except for the southeastern part of Australia, most of the Australian vegetation shows an increase in the variability metric (SD) over time, while its resilience metric (AC) tends to decrease (Figure 5c,e). The vegetation response to wet and dry periods (Figure 5g) increases in the western part of Australia, except for the agricultural area in the south, which shows a decrease in drought response. Furthermore, the majority of the vegetation in the eastern part of Australia shows a decrease in drought response (CS).
These spatial differences reflect differences between land cover types. The variability metric (SD) tends to increase the most for the hummock grasslands, shrublands and chenopod shrubs, while their memory effect (resilience metric (AC)) tends to decrease. The decrease in drought response metric (CS) is mostly apparent for both sparse and open tussock grasslands (Figure 7), which also showed the highest overall response to droughts (Figure 5 and Figure 6). In reverse, the shrublands showed the smallest decrease in drought response. Finally, no differences in trends of the stability metrics between arid and productive lands can be observed, except for the variance metric (SD): tussock grasslands, hummock grasses, scattered and chenopod shrubs located in arid regions tend to show a larger increase in variability (SD) compared to the land cover types located in productive lands.
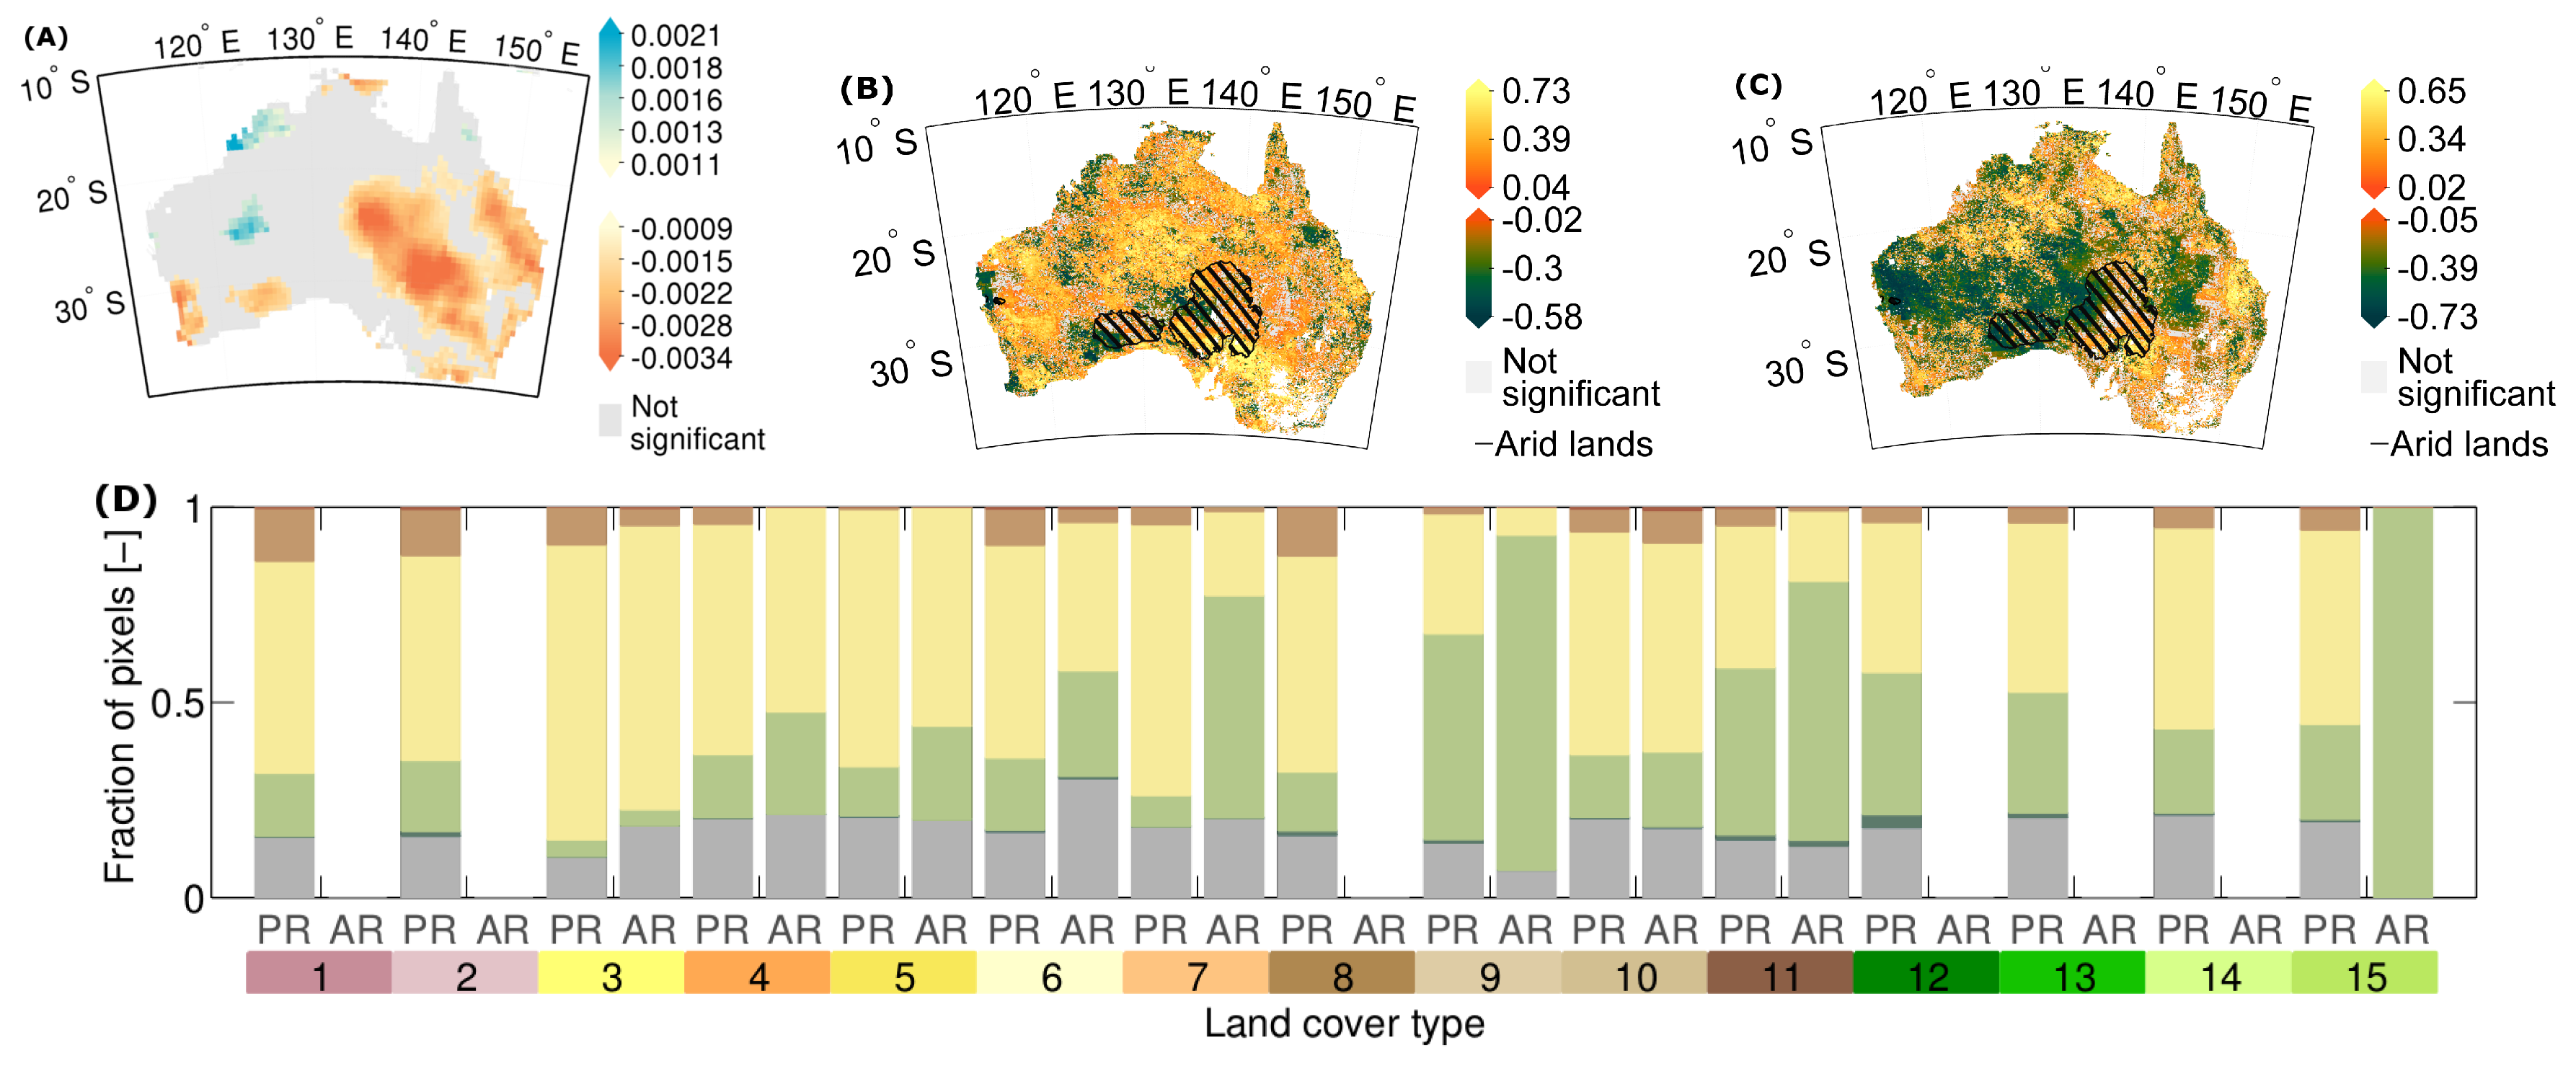
These changes in vegetation response can partially be linked to changes in climate conditions (Figure 8). Most of the pixels show a positive association between the variability in vegetation response (variance metric (SD) of the NDVI) and the variability in drought conditions (variance metric (SD) of SPEI). In other words, an increase/decrease in climate variability is associated with an increase/decrease in vegetation response variability. Yet, the association between the memory effect (resilience metric; AC) of the climate and vegetation response is negative for vegetation in central-west Australia: longer drought/wet periods are associated with a lower vegetation memory effect (higher resilience). Furthermore, the tau coefficient of the climate-vegetation relationships is not large (mostly smaller in absolute values than 0.6), and about 10% of the pixels do not show a significant relationship.

4. Discussion

Starting from stability metrics derived using the complete time series period, this study quantified the magnitude and direction of temporal vegetation response changes in Australia.
The stability metrics derived over the complete time series length showed that the spatial patterns of the stability metrics are related to those of the land cover types. For example, the tussock grasslands show a large variability and dependency on water availability, but a relatively low memory effect. This could partially be explained by their association with vertisols (i.e., deep cracking clay soils). These clay-rich soils are relatively fertile, but tend to form deep cracks during dry periods. Due to the important changes in soil conditions, vegetation biomass may fluctuate, as well, to a large extent. Tree-based land cover types and hummock grasses in the western part of Australia showed a insignificant relationship with droughts, but also a low memory effect and low to mediocre variability. This could suggest that these areas are one of the most stable of Australia: they recover relatively quickly and show nearly no response to droughts. Yet, other factors may also explain this type of response: (i) the hummock grasslands may be extremely sparsely vegetated, hampering the measurement of vegetation response; (ii) the NDVI response may saturate with relatively high LAI for tree vegetation in combination with (iii) a higher number of clouds in northern areas. These factors decrease the signal to noise ratio of the anomaly signal, complicating its ecological interpretation.
Next to the assessment of stability over the complete time period, temporal changes in stability were obtained. The temporal changes illustrate that the magnitude of temporal vegetation response change is relatively large compared to the stability metric derived over the complete time series period. This relatively large temporal variation has both technical and ecological consequences. First, the relatively large temporal variation in the stability metrics implies that vegetation response should not be considered as a constant, and this variability should be accounted for in vegetation stability assessment. Consequently, methods that are based on techniques implicitly assuming stationarity and using the whole time series period may not be optimal (e.g., [20]). Modification of these techniques, i.e., through the use of a moving window, the allowance of break-points or the explicit inclusion of changing response may be of interest. Second, the stability metrics, and certainly the response to droughts, will depend on the used time series time frame and time series length. Consequently, the results may differ between sensors or platforms, but also between the first and second part of the time series. The latter was also found in the study of [5], where the sensitivity of stability metrics to data characteristics and noise were assessed. Third, the result suggests that vegetation response changed over the 1982to 2006 period in Australia. As such, the assessment of these changes may reveal additional information about the vegetation response and may be interesting to monitor vegetation response.
The observed change in vegetation response may be an indicator of altered vegetation stability and may even be a precedent of regime shifts. A rise in SD or AC over time has for example been recognized as a possible indicator for regime shifts in both climatic systems and ecosystems [8,9,11]. Yet, the spatial overview of temporal changes of the three stability indicators indicates that the metrics generally do not change in concordance. For example, the increased standard deviation and correlation with the SPEI index in the western part of Australia suggests that vegetation has become more sensitive and response more variable over time, while the auto-correlation shows a mixed result. The shrub and hummock dominated northern part shows an increased resilience, while the tree and agriculture dominated southern part shows the opposite. Vegetation thus tends to react in a more complicated way, which supports the need to assess multiple stability indicators.
Comparing the increase in standard deviation and auto-correlation with the resilience metric of [41] in Australia further reveals contrasting patterns. This means that the probability of being in another state is not directly related to the change in stability. The analyses thus warn for a ‘blind’ application of the stability metrics on remote sensing data to assess vulnerability. As we did not test what exactly causes this lack of coherence, it is difficult to pinpoint just one cause. The remote sensing time series could still be too short to capture the increase in SD and AC that is supposed to be associated with ecosystems reaching a tipping point. Next, the states as defined by [41] are relatively broad (i.e., forest, savanna and treeless). The sensitivity observed in our study could be related to more subtle changes than these broad conversions or ecosystems could behave in a different way than expected.
Furthermore, several factors may influence the observed changes in vegetation response. Both the standard deviation and auto-correlation indicate how the vegetation response changes over time, but not how these changes are related to environmental anomalies. The variance and memory effect of the vegetation may thus increase because the disturbance regime alters, while the vegetation remains inherently the same. This is partly confirmed by the significant positive rank correlation between changes in SD of the NDVI and climate anomalies for most of the pixels. This suggests that changes in vegetation response are partly driven by changes in climate anomalies, which is logical given the large dependency of vegetation in Australia to water availability and climate conditions (e.g., [42]).
Yet, not all pixels show a simultaneous change in climate and vegetation anomalies, which may also be attributed to other environmental pressures. Australia has experienced a large influence of human activity (e.g., [21,43]), which may alter the vegetation response in a different way than expected from natural processes. As such, these conversions may hamper the interpretation of vegetation response changes as an altered sensitivity to climate anomalies. Other pressures than climate may further affect the vegetation state: factors such as altered fire regimes, overgrazing, introduction of invasive species and salinization are important, as well, and may furthermore alter the response of vegetation to climate anomalies [21,44,45,46]. Moreover, CO2 fertilization, altered fire and rainfall regimes may change the vegetation composition, which was suggested in the study of [13]. This may further be aggravated by the low spatial resolution of the GIMMS NDVI dataset. The low resolution results in variable fractional values of the dominant land cover type and increases the multitude of vegetation responses within a pixel, therefore complicating the interpretation. An analysis using higher resolution data in combination with a more complete set of drivers may provide a more detailed insight into the importance of each of these drivers and their relation with spatio-temporal changes in stability metrics. This however fell outside the scope of this study.
Finally, an undesirable and yet unavoidable factor of changes in stability metrics is the presence of noise in the time series [5]. For example, the presence of clouds, high aerosol contents, image misregistration, Bidirectional Reflectance Distribution Function (BRDF) effects and sensor artifacts may introduce trends, white noise (i.e., random noise due to the combined effect of noise factors) and biased noise (e.g., negative spikes in the time series due to clouds), which may in their turn severely affect the stability metrics. As clouds and aerosol concentrations are not only highly spatially, but also temporally variable, the observed changes in stability may be affected, as well. However, the studies of [5,20] already showed that the signal-to-noise factor of the NDVI anomaly time series in Australia is relatively high, thus increasing the probability to reliably detecting changes. Moreover, the highest influence of noise was found in forested, tropical or completely bare areas, whereas semi-arid areas showed the highest signal-to-noise ratio [5,20]. The former areas were mostly masked in the CS analysis, as they did not show a significant correlation. Yet, a ground-based assessment of biomass stability would be interesting for further validation.

5. Conclusions

Overall, this study illustrates the importance of the temporal dimension in remotely-sensed stability studies. A large part of the Australian vegetation showed an increase in variability over time, while its memory effect decreased. The association of biomass anomalies with drought events showed a mixed response: the association increased in the western part, while it decreased in the eastern part. The variation in vegetation response and its relationship with changing climate characteristics may as such reveal interesting additional information of vegetation dynamics and the impact of environmental changes on vegetation biomass production stability.

Acknowledgments

The research presented in this paper is funded by the KU Leuven (BOF-OTand PDMgrant) and the Belgian Science Policy Office in the frame of the STEREOIII program: Project UTURN(SR/00/339). We are indebted to the editor and referees for their reviews that improved the content of this paper.

Author Contributions

W.D.K., S.L., B.S. and M.J.H. conceived of and designed the experiments. W.D.K. performed the experiments and analyzed the data. W.D.K., S.L., M.J.H., B.S., L.T. and P.C. wrote the paper.

Conflicts of Interest

The authors declare no conflict of interest. The founding sponsors had no role in the design of the study; in the collection, analyses or interpretation of data; in the writing of the manuscript; nor in the decision to publish the results.

References

  1. Malinga, R.; Gordon, L.J.; Jewitt, G.; Lindborg, R. Mapping ecosystem services across scales and continents: A review. Ecosyst. Serv. 2015, 13, 57–63. [Google Scholar] [CrossRef]
  2. Intergovernmental Panel on Climate Change (IPCC). Managing the Risks of Extreme Events and Disasters to Advance Climate Change Adaptation; A Special Report of Working Groups I and II of the Intergovernmental Panel on Climate Change; Chapter Summary for Policymakers; Cambridge University Press: Cambridge, UK; New York, NY, USA, 2012; pp. 1–19. [Google Scholar]
  3. Pimm, S. The complexity and stability of ecosystems. Nature 1984, 307, 321–326. [Google Scholar] [CrossRef]
  4. Pettorelli, N.; Vik, J.; Mysterud, A.; Gaillard, J.; Tucker, C.; Stenseth, N. Using the satellite-derived NDVI to assess ecological responses to environmental change. Trends Ecol. Evol. 2005, 20, 503–510. [Google Scholar] [CrossRef] [PubMed]
  5. De Keersmaecker, W.; Lhermitte, S.; Honnay, O.; Farifteh, J.; Somers, B.; Coppin, P. How to measure ecosystem stability? An evaluation of the reliability of stability metrics based on remote sensing time series across the major global ecosystems. Glob. Chang. Biol. 2014, 20, 2149–2161. [Google Scholar] [CrossRef] [PubMed]
  6. De Keersmaecker, W.; Lhermitte, S.; Tits, L.; Honnay, O.; Somers, B.; Coppin, P. Resilience and the reliability of spectral entropy to assess ecosystem stability. Glob. Chang. Biol. 2015. [Google Scholar] [CrossRef] [PubMed]
  7. Milly, P.C.D.; Betancourt, J.; Falkenmark, M.; Hirsch, R.M.; Kundzewicz, Z.W.; Lettenmaier, D.P.; Stouffer, R.J. Stationarity is dead: Whither water management? Science 2008, 319, 573–574. [Google Scholar] [CrossRef] [PubMed]
  8. Lenton, T.M. Early warning of climate tipping points. Nat. Clim. Chang. 2011, 1, 201–209. [Google Scholar] [CrossRef]
  9. Dakos, V.; Carpenter, S.; Brock, W.; Ellison, A.; Guttal, V.; Ives, A.; Kéfi, S.; Livina, V.; Seekell, D.; van Nes, E.; et al. Methods for detecting early warnings of critical transitions in time series illustrated using simulated ecological data. PLoS ONE 2012, 7, e41010. [Google Scholar] [CrossRef] [PubMed] [Green Version]
  10. Verbesselt, J.; Umlauf, N.; Hirota, M.; Holmgren, M.; Van Nes, E.H.; Herold, M.; Zeileis, A.; Scheffer, M. Remotely sensed resilience of tropical forests. Nat. Clim. Chang. 2016. [Google Scholar] [CrossRef]
  11. Scheffer, M.; Carpenter, S.; Foley, J.A.; Folke, C.; Walker, B. Catastrophic shifts in ecosystems. Nature 2001, 413, 591–596. [Google Scholar] [CrossRef] [PubMed]
  12. De Jong, R.; Verbesselt, J.; Schaepman, M.E.; de Bruin, S. Trend changes in global greening and browning: Contribution of short-term trends to longer-term change. Glob. Chang. Biol. 2012, 18, 642–655. [Google Scholar] [CrossRef]
  13. Donohue, R.J.; Mcvicar, T.; Roderick, M.L. Climate-related trends in Australian vegetation cover as inferred from satellite observations, 1981–2006. Glob. Chang. Biol. 2009, 15, 1025–1039. [Google Scholar] [CrossRef]
  14. Dardel, C.; Kergoat, L.; Hiernaux, P.; Mougin, E.; Grippa, M.; Tucker, C. Re-greening Sahel: 30 years of remote sensing data and field observations (Mali, Niger). Remote Sens. Environ. 2014, 140, 350–364. [Google Scholar] [CrossRef]
  15. Herrmann, S.M.; Anyamba, A.; Tucker, C.J. Recent trends in vegetation dynamics in the African Sahel and their relationship to climate. Glob. Environ. Chang. 2005, 15, 394–404. [Google Scholar] [CrossRef]
  16. Fensholt, R.; Langanke, T.; Rasmussen, K.; Reenberg, A.; Prince, S.D.; Tucker, C.; Scholes, R.J.; Le, Q.B.; Bondeau, A.; Eastman, R.; et al. Greenness in semi-arid areas across the globe 1981–2007—An Earth Observing Satellite based analysis of trends and drivers. Remote Sens. Environ. 2012, 121, 144–158. [Google Scholar] [CrossRef]
  17. Heumann, B.W.; Seaquist, J.; Eklundh, L.; Jönsson, P. AVHRR derived phenological change in the Sahel and Soudan, Africa, 1982–2005. Remote Sens. Environ. 2007, 108, 385–392. [Google Scholar] [CrossRef]
  18. Fensholt, R.; Rasmussen, K. Analysis of trends in the Sahelian rain-use efficiency using GIMMS NDVI, RFE and GPCP rainfall data. Remote Sens. Environ. 2011, 115, 438–451. [Google Scholar] [CrossRef]
  19. Piao, S.; Nan, H.; Huntingford, C.; Ciais, P.; Friedlingstein, P.; Sitch, S.; Peng, S.; Ahlström, A.; Canadell, J.G.; Cong, N.; et al. Evidence for a weakening relationship between interannual temperature variability and northern vegetation activity. Nat. Commun. 2014, 5. [Google Scholar] [CrossRef] [PubMed] [Green Version]
  20. De Keersmaecker, W.; Lhermitte, S.; Tits, L.; Honnay, O.; Somers, B.; Coppin, P. A model quantifying global vegetation resistance and resilience against short-term climate anomalies and their relation with vegetation cover. Glob. Ecol. Biogeogr. 2015, 24, 539–548. [Google Scholar] [CrossRef]
  21. McAlpine, C.; Syktus, J.; Ryan, J.; Deo, R.; McKeon, G.; McGowan, H.; Phinn, S. A continent under stress: Interactions, feedbacks and risks associated with impact of modified land cover on Australia’s climate. Glob. Chang. Biol. 2009, 15, 2206–2223. [Google Scholar] [CrossRef]
  22. Gallant, A.; Reeder, M.J.; Risbey, J.; Hennessy, K. The characteristics of seasonal-scale droughts in Australia, 1911–2009. Int. J. Climatol. 2013, 33, 1658–1672. [Google Scholar] [CrossRef]
  23. Verdon-Kidd, D.; Kiem, A.S. Nature and causes of protracted droughts in southeast Australia: Comparison between the Federation, WWII, and the Big Dry droughts. Geophys. Res. Lett. 2009, 36, 1–6. [Google Scholar] [CrossRef]
  24. Li, J.; Fan, K.; Xu, Z. Asymmetric response in Northeast Asia of summer NDVI to the preceding ENSO cycle. Clim. Dyn. 2016, 47, 2765–2783. [Google Scholar] [CrossRef]
  25. Li, J.; Fan, K.; Xu, Z. Links between the late wintertime North Atlantic Oscillation and springtime vegetation growth over Eurasia. Clim. Dyn. 2016, 46, 987–1000. [Google Scholar] [CrossRef]
  26. Ma, X.; Huete, A.; Yu, Q.; Coupe, N.R.; Davies, K.; Broich, M.; Ratana, P.; Beringer, J.; Hutley, L.B.; Cleverly, J.; et al. Spatial patterns and temporal dynamics in savanna vegetation phenology across the North Australian Tropical Transect. Remote Sens. Environ. 2013, 139, 97–115. [Google Scholar] [CrossRef]
  27. Broich, M.; Huete, A.; Paget, M.; Ma, X.; Tulbure, M.; Coupe, N.R.; Evans, B.; Beringer, J.; Devadas, R.; Davies, K.; et al. A spatially explicit land surface phenology data product for science, monitoring and natural resources management applications. Environ. Model. Softw. 2015, 64, 191–204. [Google Scholar] [CrossRef]
  28. Broich, M.; Huete, A.; Tulbure, M.G.; Ma, X.; Xin, Q.; Paget, M.; Restrepo-Coupe, N.; Davies, K.; Devadas, R.; Held, A. Land surface phenological response to decadal climate variability across Australia using satellite remote sensing. Biogeosciences 2014, 11, 5181–5198. [Google Scholar] [CrossRef] [Green Version]
  29. Tucker, C.J.; Pinzon, J.E.; Brown, M.E.; Slayback, D.A.; Pak, E.W.; Mahoney, R.; Vermote, E.F.; El Saleous, N. An extended AVHRR 8-km NDVI dataset compatible with MODIS and SPOT vegetation NDVI data. Int. J. Remote Sens. 2005, 26, 4485–4498. [Google Scholar] [CrossRef]
  30. Pinzon, J.; Brown, M.; Tucker, C. Satellite time series correction of orbital drift artifacts using empirical mode decomposition. In Hilbert-Huang Transform: Introduction and Applications; World Scientific Publishing: Toh Tuh Link, Singapore, 2005. [Google Scholar]
  31. Vicente-Serrano, S.M.; Beguería, S.; López-Moreno, J.I.; Angulo, M.; El Kenawy, A. A new global 0.5 gridded dataset (1901–2006) of a multiscalar drought index: Comparison with current drought index datasets based on the Palmer Drought Severity Index. J. Hydrometeorol. 2010, 11, 1033–1043. [Google Scholar] [CrossRef]
  32. Beguería, S.; Vicente-Serrano, S.M.; Angulo-Martínez, M. A multiscalar global drought dataset: The SPEIbase: A new gridded product for the analysis of drought variability and impacts. Bull. Am. Meteorol. Soc. 2010, 91, 1351–1354. [Google Scholar] [CrossRef]
  33. Vicente-Serrano, S.M.; Gouveia, C.; Camarero, J.J.; Beguería, S.; Trigo, R.; López-Moreno, J.I.; Azorín-Molina, C.; Pasho, E.; Lorenzo-Lacruz, J.; Revuelto, J.; et al. Response of vegetation to drought time-scales across global land biomes. Proc. Natl. Acad. Sci. USA 2013, 110, 52–57. [Google Scholar] [CrossRef] [PubMed] [Green Version]
  34. Zeng, F.W.; Collatz, G.J.; Pinzon, J.E.; Ivanoff, A. Evaluating and quantifying the climate-driven interannual variability in Global Inventory Modeling and Mapping Studies (GIMMS) Normalized Difference Vegetation Index (NDVI3g) at global scales. Remote Sens. 2013, 5, 3918–3950. [Google Scholar] [CrossRef]
  35. Jones, D.A.; Wang, W.; Fawcett, R. High-quality spatial climate data-sets for Australia. Aust. Meteorol. Oceanogr. J. 2009, 58, 233. [Google Scholar]
  36. Lymburner, L.; Tan, P.; Mueller, N.; Thackway, R.; Thankappan, M.; Islam, A.; Lewis, A.; Randall, L.; Senarath, U. The Dynamic Land Cover Datset; Technical Report; GA Record 2011/31; Geoscience Australia: Canberra, Australia, 2011.
  37. Verbesselt, J.; Hyndman, R.; Newnham, G.; Culvenor, D. Detecting trend and seasonal changes in satellite image time series. Remote Sens. Environ. 2010, 114, 106–115. [Google Scholar] [CrossRef]
  38. Verbesselt, J.; Hyndman, R.; Zeileis, A.; Culvenor, D. Phenological change detection while accounting for abrupt and gradual trends in satellite image time series. Remote Sens. Environ. 2010, 114, 2970–2980. [Google Scholar] [CrossRef]
  39. Lenton, T.; Livina, V.; Dakos, V.; Van Nes, E.; Scheffer, M. Early warning of climate tipping points from critical slowing down: Comparing methods to improve robustness. Philos. Trans. R. Soc. A Math. Phys. Eng. Sci. 2012, 370, 1185–1204. [Google Scholar] [CrossRef] [PubMed]
  40. Kendall, M.G. Rank Correlation Methods; Charles Griffin & Company Limited: London, UK, 1948. [Google Scholar]
  41. Hirota, M.; Holmgren, M.; Van Nes, E.H.; Scheffer, M. Global resilience of tropical forest and savanna to critical transition. Science 2011, 334, 232–235. [Google Scholar] [CrossRef] [PubMed]
  42. Chen, T.; de Jeu, R.; Liu, Y.; van der Werf, G.; Dolman, A. Using satellite based soil moisture to quantify the water driven variability in NDVI: A case study over mainland Australia. Remote Sens. Environ. 2014, 140, 330–338. [Google Scholar] [CrossRef]
  43. Hosking, E. Land Clearing in the Northern Territory; Report No. 24/2002; Department of Infrastructure, Planning and Environment: Darwin, Australia, 2002.
  44. Hughes, L. Climate change and Australia: Trends, projections and impacts. Austral Ecol. 2003, 28, 423–443. [Google Scholar] [CrossRef]
  45. Tongway, D.; Sparrow, A.; Friedel, M. Degradation and recovery processes in arid grazing lands of central Australia. Part 1: Soil and land resources. J. Arid Environ. 2003, 55, 301–326. [Google Scholar] [CrossRef]
  46. Smith, D.; McKeon, G.; Watson, I.; Henry, B.K.; Stone, G.; Hall, W.; Howden, S. Learning from episodes of degradation and recovery in variable Australian rangelands. Proc. Natl. Acad. Sci. USA 2007, 104, 20690–20695. [Google Scholar] [CrossRef] [PubMed] [Green Version]
Figure 1. Proof of concept: two time series (a,b) (the y-axis represents a response variable (e.g., biomass or NDVI), and the x-axis represents the observation number of the time series, an indicator of time) having approximately the same standard deviation (SD) and auto-correlation at lag one (AC1). Time Series A, however, shows a break-point in the two properties: the standard deviation increases from 0.05 to 0.10 and its autocorrelation from 0.32 to 0.90, while the SD and AC1 approximately remains the same for time series B. This illustrates that metrics applied on the complete time series might fail to provide important information. Consequently temporal changes in stability metrics should be assessed to allow for a correct interpretation of the metrics.
Remotesensing 09 00034 g001
Figure 2. Proof of concept: Illustration of the variety of vegetation dynamics in Australia. (A) Sinusoidal winter (e.g., southeastern crop lands); (B) sinusoidal summer (e.g., northern woodlands); (C) forests; and (D) arid lands. The left panel illustrates the location for which the NDVI time series in the right panel is shown.
Remotesensing 09 00034 g002
Figure 3. Proof of concept: illustration of potential causes of stability change using simulated time series. The case (A) illustrates the Normalized Difference Vegetation Index (NDVI) response (top panel) of a forest showing an increased vulnerability to disturbances. The increased vulnerability is reflected by an increased variance and slower recovery rate (bottom panel; characterized respectively through the standard deviation (SD) and auto-correlation at lag 1 (AC) of the NDVI anomalies (center panel)). Similarly, the case in (B) illustrates the conversion of forest to cropland, the case in (C) shrubland subjected to a weakening monsoon, the case in (D) conversion from rainfed to irrigated pasture and the case in (E) increased rainfall in arid areas.
Remotesensing 09 00034 g003
Figure 4. Illustration of changing vegetation response characteristics: (a) stationary time series; (b) time series with increasing standard deviation (SD); (c) time series with increasing auto-correlation (AC); (d) two time series with decreasing correlation (CS).
Remotesensing 09 00034 g004
Figure 5. Spatial overview of (A) the land cover type; (B,D,F) stability metrics derived over the whole time series length and (C,E,G) increase/decrease in stability given by the slope of the stability metrics derived over a running window for three stability metrics: (B) to (C) the standard deviation (SD); (D) to (E) the auto-correlation at lag 1 (AC); and (F) to (G) correlation between the NDVI anomaly and Standardized Precipitation and Evapotranspiration Index (SPEI) (CS). Insignificant (p > 0.05) AC and CS metrics were masked.
Remotesensing 09 00034 g005
Figure 6. Overview of the mean (symbol) and spatial variability (error bar) of the stability (grey) and range in stability (color) per land cover type for three stability metrics: (A) standard deviation (SD); (B) auto-correlation at lag one (AC); and (C) correlation of the NDVI anomaly with the Standardized Precipitation and Evapotranspiration Index (CS). The shape of the symbols represent the disturbance regime/land use: arid lands/rangelands (o) and productive lands (x). The pixels for which the stability metric derived over the whole time series length was not significant were not taken into account, and land cover types containing less than 100 pixels were discarded.
Remotesensing 09 00034 g006
Figure 7. Overview of the temporal slope of the stability metrics ((A) standard deviation (SD), (B) auto-correlation (AC) and (C) cross-correlation between the NDVI and climate time series (CS)) for each land cover type (bar color) and disturbance regime (PR: productive lands; AR: arid lands/rangelands). A red-orange color indicates that the stability decreased (i.e., the absolute value of the metric increased), while a blue-green color denotes an increase in stability (i.e., the absolute value of the metric decreased). Red and blue colors suggest a consistent change, while for yellow-green colors, the change is less consistent. The pixels for which the stability metric derived over the whole time series length was not significant were not taken into account, and land cover types having 100 pixels or less were discarded.
Remotesensing 09 00034 g007aRemotesensing 09 00034 g007b
Figure 8. Overview of (A) the trend in Standardized Precipitation and Evapotranspiration Index (SPEI) over time and the non-parametric correlation coefficient Kendall’s tau for the stability metrics derived on the NDVI anomaly and climate time series: (B) to (C) a spatial overview and (D) to (E) overview per land cover type and disturbance regime (PR: productive lands; AR: arid lands/rangelands) for the (B,D) standard deviation (SD) and (C,E) auto-correlation at lag one (AC). Bar plots with a red-orange color indicate that changes in stability metrics on the SPEI are positively associated with changes in the NDVI anomaly (e.g., periods with low/high SD of the NDVI anomaly are associated with periods of low/high SD of the SPEI), while a blue-green color denotes negative association (e.g., periods with low/high SD of the NDVI anomaly are associated with periods of high/low SD of the SPEI). Red and blue colors suggest a strong association, while for yellow-green colors, the association is less strong. The pixels of which the stability metric derived over the whole time series length was not significant were not taken into account, and land cover types having 100 pixels or less were discarded.
Remotesensing 09 00034 g008aRemotesensing 09 00034 g008b
Table 1. Overview of the methodology and interpretation of the used metrics/time series components. BFAST, Breaks For Additive Season and Trend.
Metric/ComponentInterpretation
1. Anomaly extraction
BFAST anomalyAnomalies with respect to non-stationary seasonal and trend components. Positive/negative values indicate a higher/lower vegetation greenness (NDVI) than average.
2. Calculation of stability metrics over a 12-year running window
Standard deviation of the NDVI anomaly (SD)Indicator of variance. Large/small values denote a large/ small variability.
Auto-correlation at lag one of the NDVI anomaly (AC)Indicator of resilience (memory effect of the biomass response). Large absolute values of the auto-correlation indicate a large memory effect, i.e., a slow return to equilibrium or low resilience. For a positive auto-correlation, the anomalies are similar to the previous anomaly, whereas for a negative value, the anomalies are similar to the previous anomaly, but with the opposite sign.
Correlation NDVI anomaly: SPEI (CS)Indicator related to resistance (immediate response of the vegetation greenness to drought). Large absolute values denote a low resistance, and positive/negative values indicate that a higher greenness than average is associated with a higher/lower water availability than average.
3. Quantification of non-stationarity metrics
Range of stability metric time seriesMagnitude of stability metric change. The larger the range, the more the extremes of the stability metric deviate over time.
Slope of stability metric time seriesDirection of stability metric change. Positive/negative slopes indicate that the metric overall increases/decreases over time.