Article

Evaluation of Landsat-Based METRIC Modeling to Provide High-Spatial Resolution Evapotranspiration Estimates for Amazonian Forests

1
Geospatial Sciences Center of Excellence, South Dakota State University, Brookings, SD 57007, USA
2
Biosystems and Agricultural Engineering Department, Oklahoma State University, Stillwater, OK 74078, USA
3
South Dakota Water Resources Institute, South Dakota State University, Brookings, SD 57007, USA
4
Campus Floresta, Universidade Federal do Acre, Rio Branco de69920-900, Brazil
*
Author to whom correspondence should be addressed.
Remote Sens. 2017, 9(1), 46; https://doi.org/10.3390/rs9010046
Submission received: 4 October 2016 / Revised: 24 December 2016 / Accepted: 28 December 2016 / Published: 6 January 2017

Abstract

:
While forest evapotranspiration (ET) dynamics in the Amazon have been studied both as point estimates using flux towers, as well as spatially coarse surfaces using satellite data, higher resolution (e.g., 30 m resolution) ET estimates are necessary to address finer spatial variability associated with forest biophysical characteristics and their changes by natural and human impacts. The objective of this study is to evaluate the potential of the Landsat-based METRIC (Mapping Evapotranspiration at high Resolution with Internalized Calibration) model to estimate high-resolution (30 m) forest ET by comparing to flux tower ET (FT ET) data collected over seasonally dry tropical forests in Rondônia, the southwestern region of the Amazon. Analyses were conducted at daily, monthly and seasonal scales for the dry seasons (June–September for Rondônia) of 2000–2002. Overall daily ET comparison between FT ET and METRIC ET across the study site showed r2 = 0.67 with RMSE = 0.81 mm. For seasonal ET comparison, METRIC-derived ET estimates showed an agreement with FT ET measurements during the dry season of r2 >0.70 and %MAE <15%. We also discuss some challenges and potential applications of METRIC for Amazonian forests.

Graphical Abstract

1. Introduction

The Amazon holds the largest area of tropical rainforests in the world and its forests play a very important role in regional hydrological cycles. Evapotranspiration (ET) from land surfaces with extensive vegetation coverage accounts for 50%–60% of the total rainfall in the region [1,2] and is a critical component of the atmosphere–land surface hydrological process. Ongoing climate change and forest disturbances, however, have affected regional evapotranspiration and thus the hydrological cycle [3] and monitoring changes in forest ET associated with natural and human impacts is a key task to predict regional ecological consequences.
Flux-based studies have shown that forest ET patterns vary regionally across biomes in Amazonia as functions of climatic, environmental and biotic factors [4,5,6]. Flux tower-derived ET provide field-based monitoring data and have been used as reference points to calibrate and evaluate regional and global climate models, however they do not have representative spatial coverage to characterize spatial variability of ET across the vast Amazon forest area [7].
Remote sensing provides a spatially continuous representation of land surfaces and has been used to estimate ET for water management, monitoring vegetation water stress and water cycles over landscapes and biomes [8,9,10,11]. Some remotely sensed ET methods rely on thermal signatures from the land surface. The thermal infrared bands (TIR) are highly sensitive to land surface moisture conditions and play a critical role in diagnosing surface energy balance components including, sensible heat, net radiation and soil heat flux [11,12,13]. This is particularly important for understanding canopy water conditions associated with forest biophysical properties. Current remotely sensed ET products available for Amazonia are coarse in spatial resolution (≥1 km) obtained from platforms such as MODIS [14,15] and are used for understanding regional ET patterns and their variability associated with different drivers. However, signals from focused or localized landscape features associated with forest structures and biophysical properties that regulate transpiration rates may not be captured at this coarse scale. This limitation is of growing importance as Amazonian forests are increasingly fragmented, selectively logged and, in many locations, damaged by fire or severe drought. These factors substantially impact forest transpiration rates and local hydrological cycles [16,17]. However, the potential impacts of forest disturbances and extreme climate events, such as droughts, on forest ET remain poorly understood, using only coarse scale or point/field measurements [5]. To improve our understanding of ET associated with forest types and disturbances, it is necessary to investigate ET spatial variability at higher spatial resolutions.
Application of remote sensing algorithms to solve energy balances using high resolution satellite imagery has proven useful for establishing credible estimates of evapotranspiration for large populations of conditions and water uses [11]. Mapping Evapotranspiration at High Resolution with Internalized Calibration (METRIC) [9,11,13,18,19,20] is a commonly used remote sensing-based model that solves energy balance equations to estimate ET by integrating satellite imagery and surface meteorological observations. Through this model, ET is estimated as a residual of the surface energy balance. We selected the METRIC model for this project for several reasons: (1) METRIC is a widely used and well-documented model [9,12]; (2) METRIC is commonly applied at spatial scales similar to the scale needed for this study (i.e., 30 m resolution) utilizing Landsat satellite imagery [13,20,21]; (3) the ground-based data available for this study aligned with the input requirements of METRIC; and (4) we found that this study was a good opportunity to test the model in tropical forest ecosystems where it has not commonly been used previously.
Weather station-based estimated reference ET [22] is used during the internal calibration process (see e.g., [13,20] and [8] for discussion of the calibration) to reduce computational biases inherent to remote-sensing-based energy balance components and to provide congruency with traditional methods for ET [20]. The METRIC model has been widely used over different land-use and land-cover types for ET estimation [9,23,24]. Some efforts have already been made to estimate ET over forest with proper adjustments to surface roughness and estimation of the radiometric temperature of the canopy [9,25]. Use of the high spatial resolution thermal band of Landsat enables the estimation of ET from water-stressed vegetation and evaporation from wet soil. While METRIC may greatly improve our ability to characterize forest ET dynamics in time and space at finer spatial resolutions, its potential/application has not been tested for Amazonian forests.
The objective of this study was to assess the potential of the METRIC model with appropriate adjustment for ET estimation over seasonally dry tropical forests in the Amazon. The resulting ET estimates from METRIC (METRIC ET) were compared with ET measured from eddy covariance flux towers (FT ET) located in the Brazilian state of Rondônia (Figure 1).

2. Materials and Methods

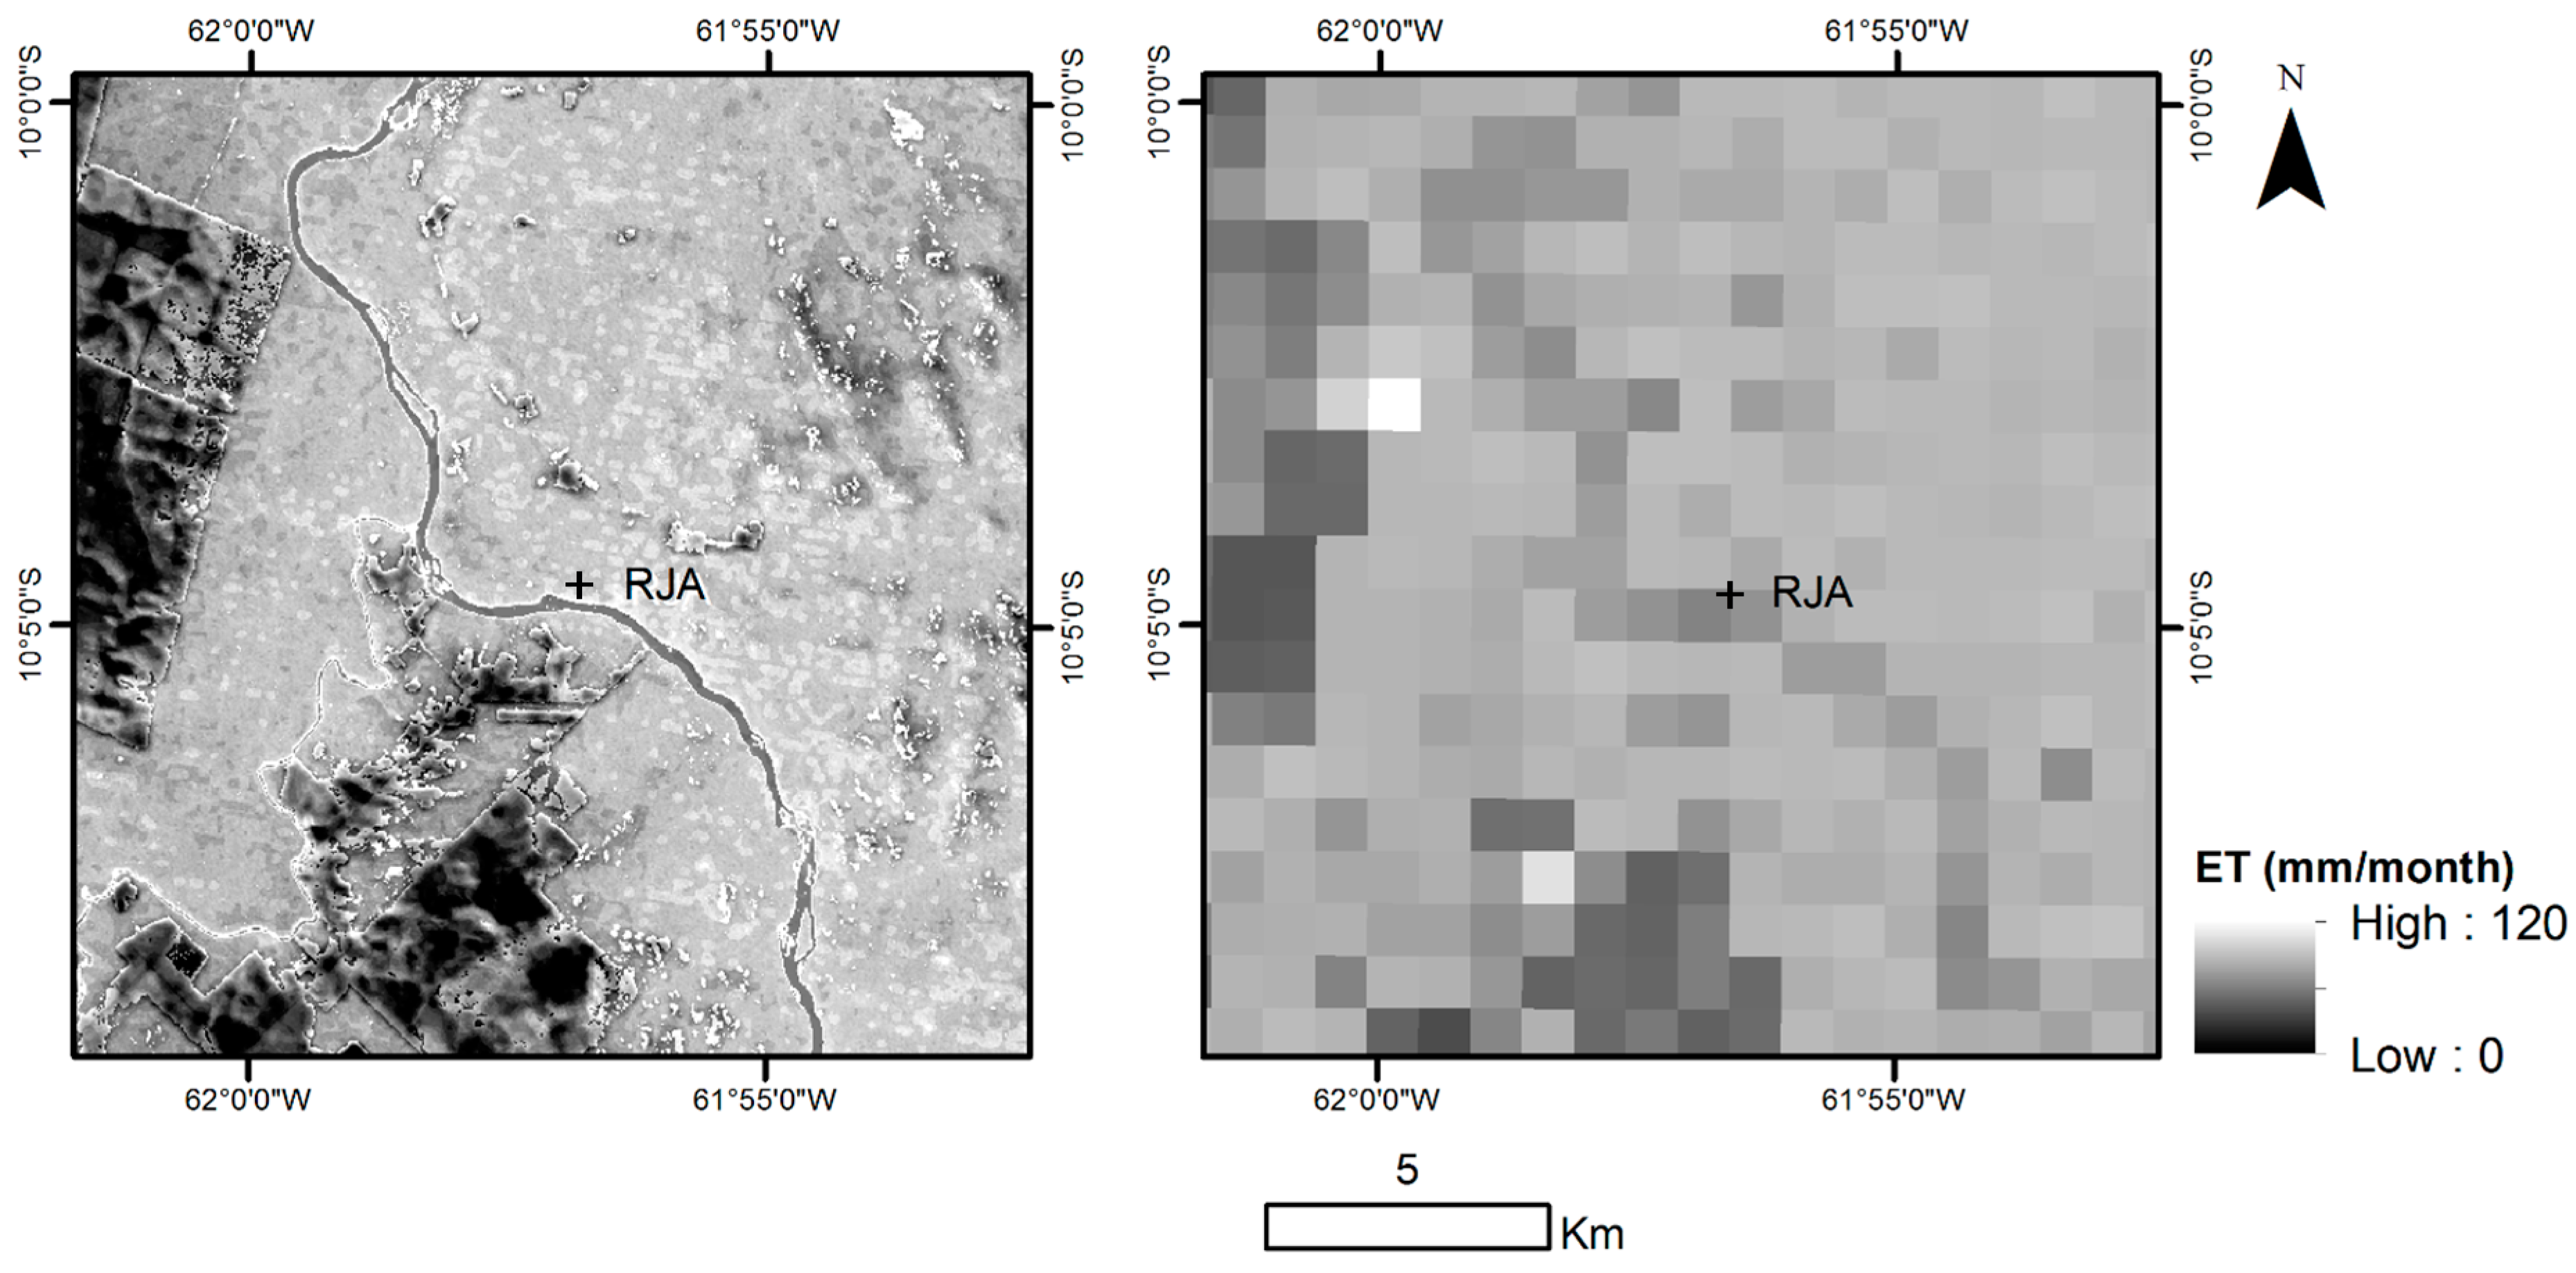
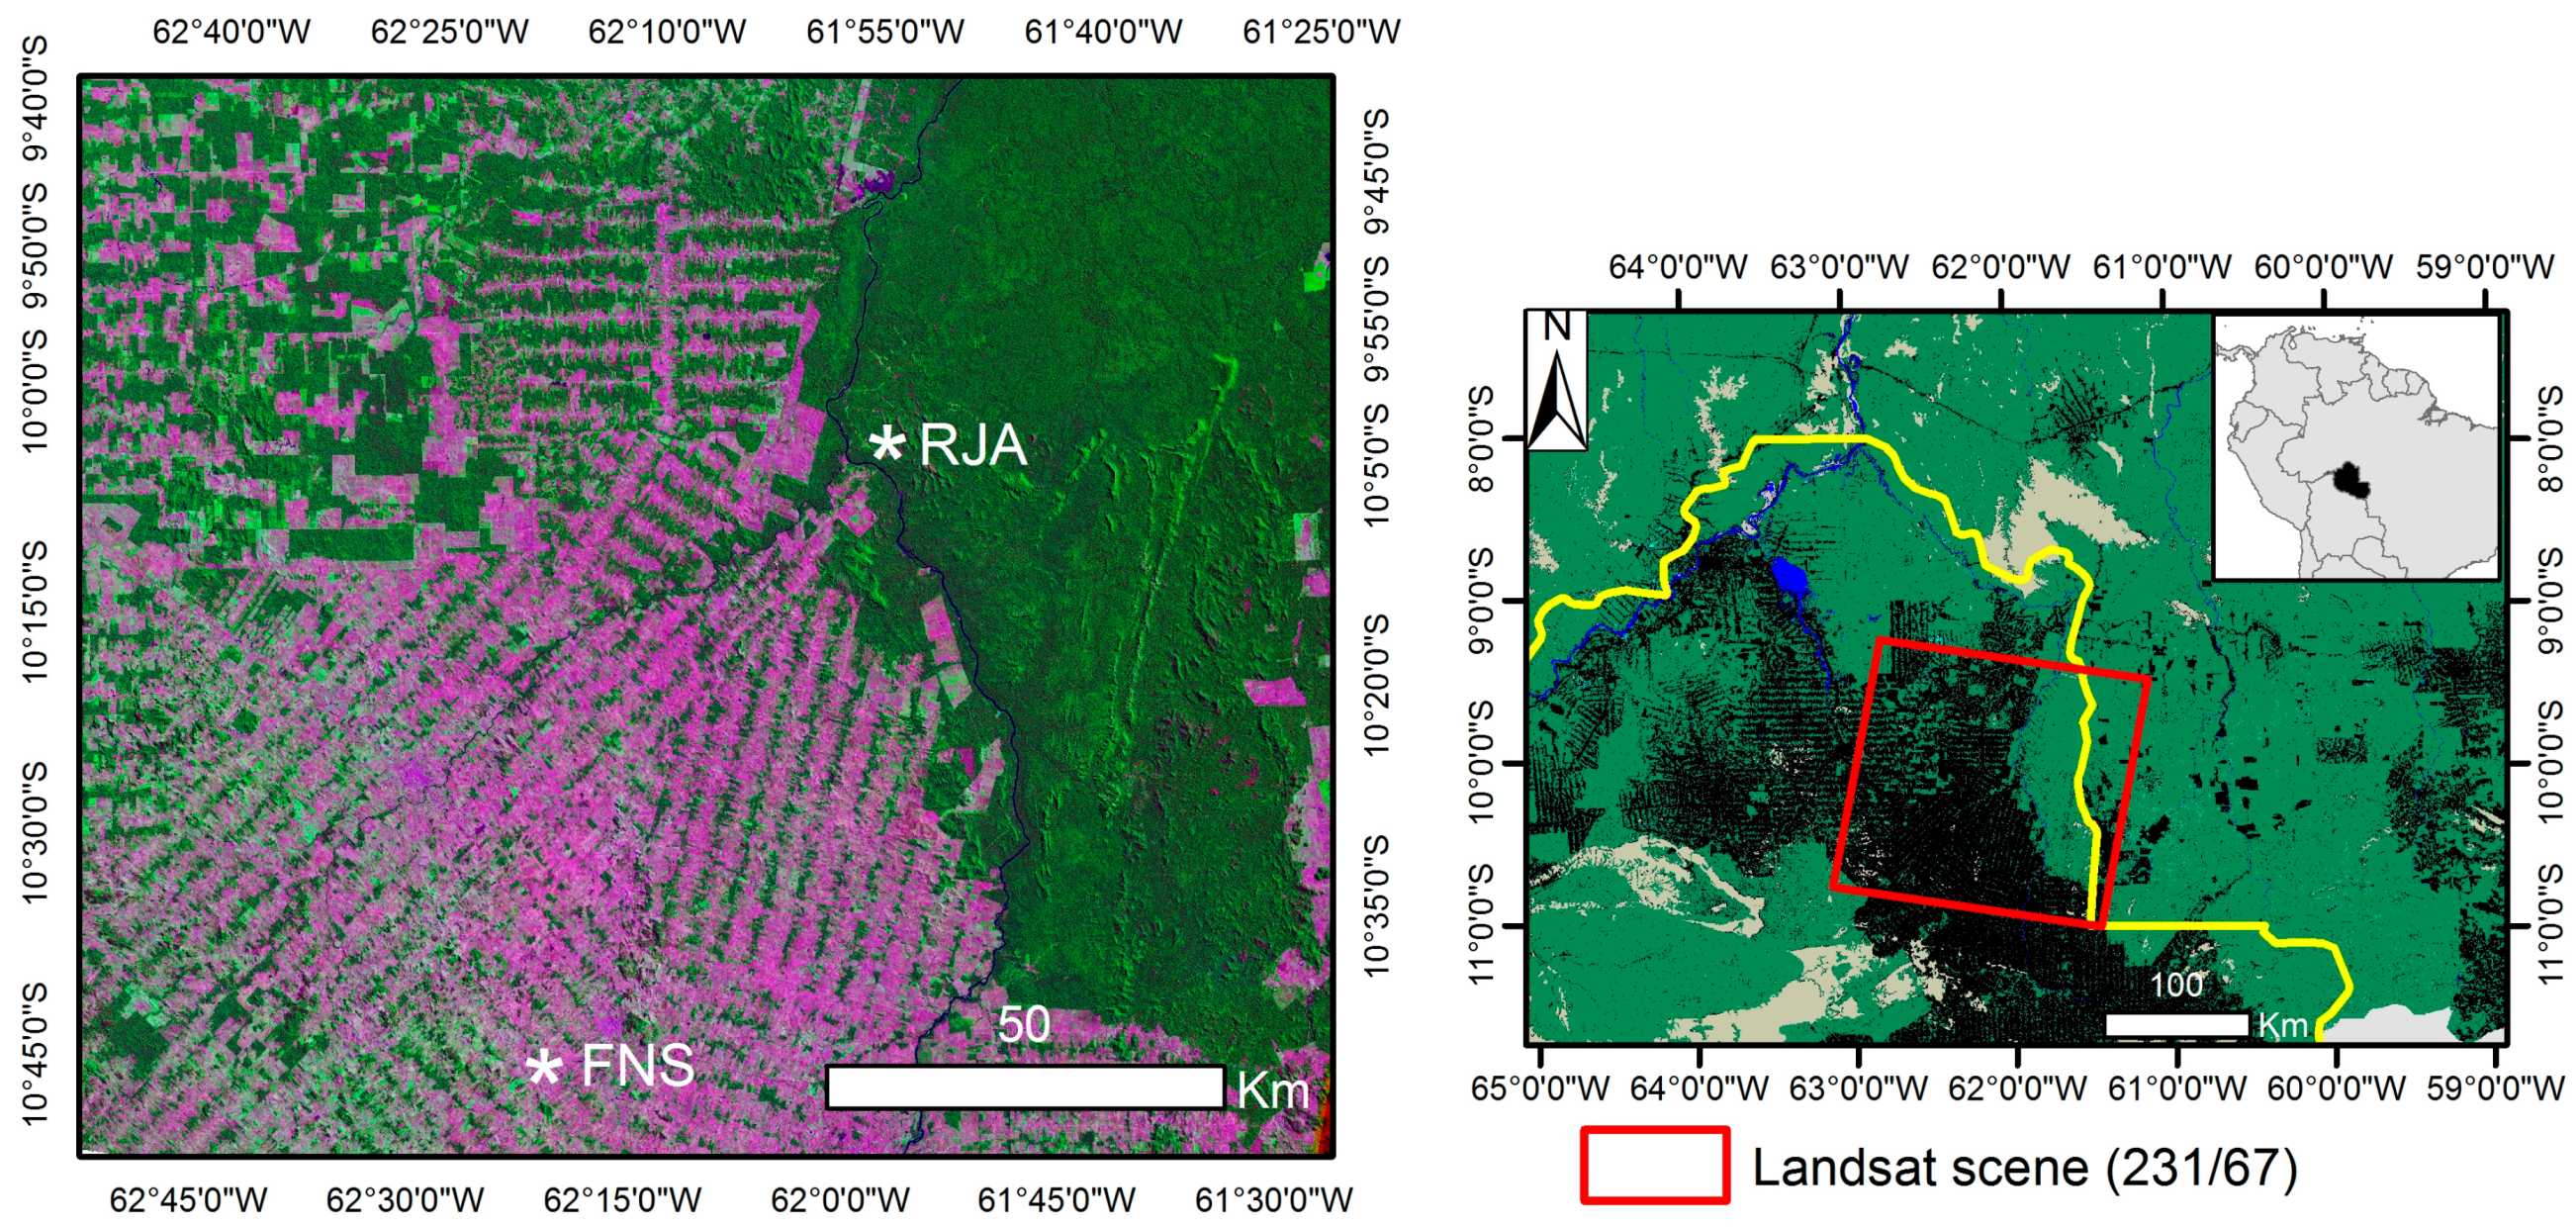
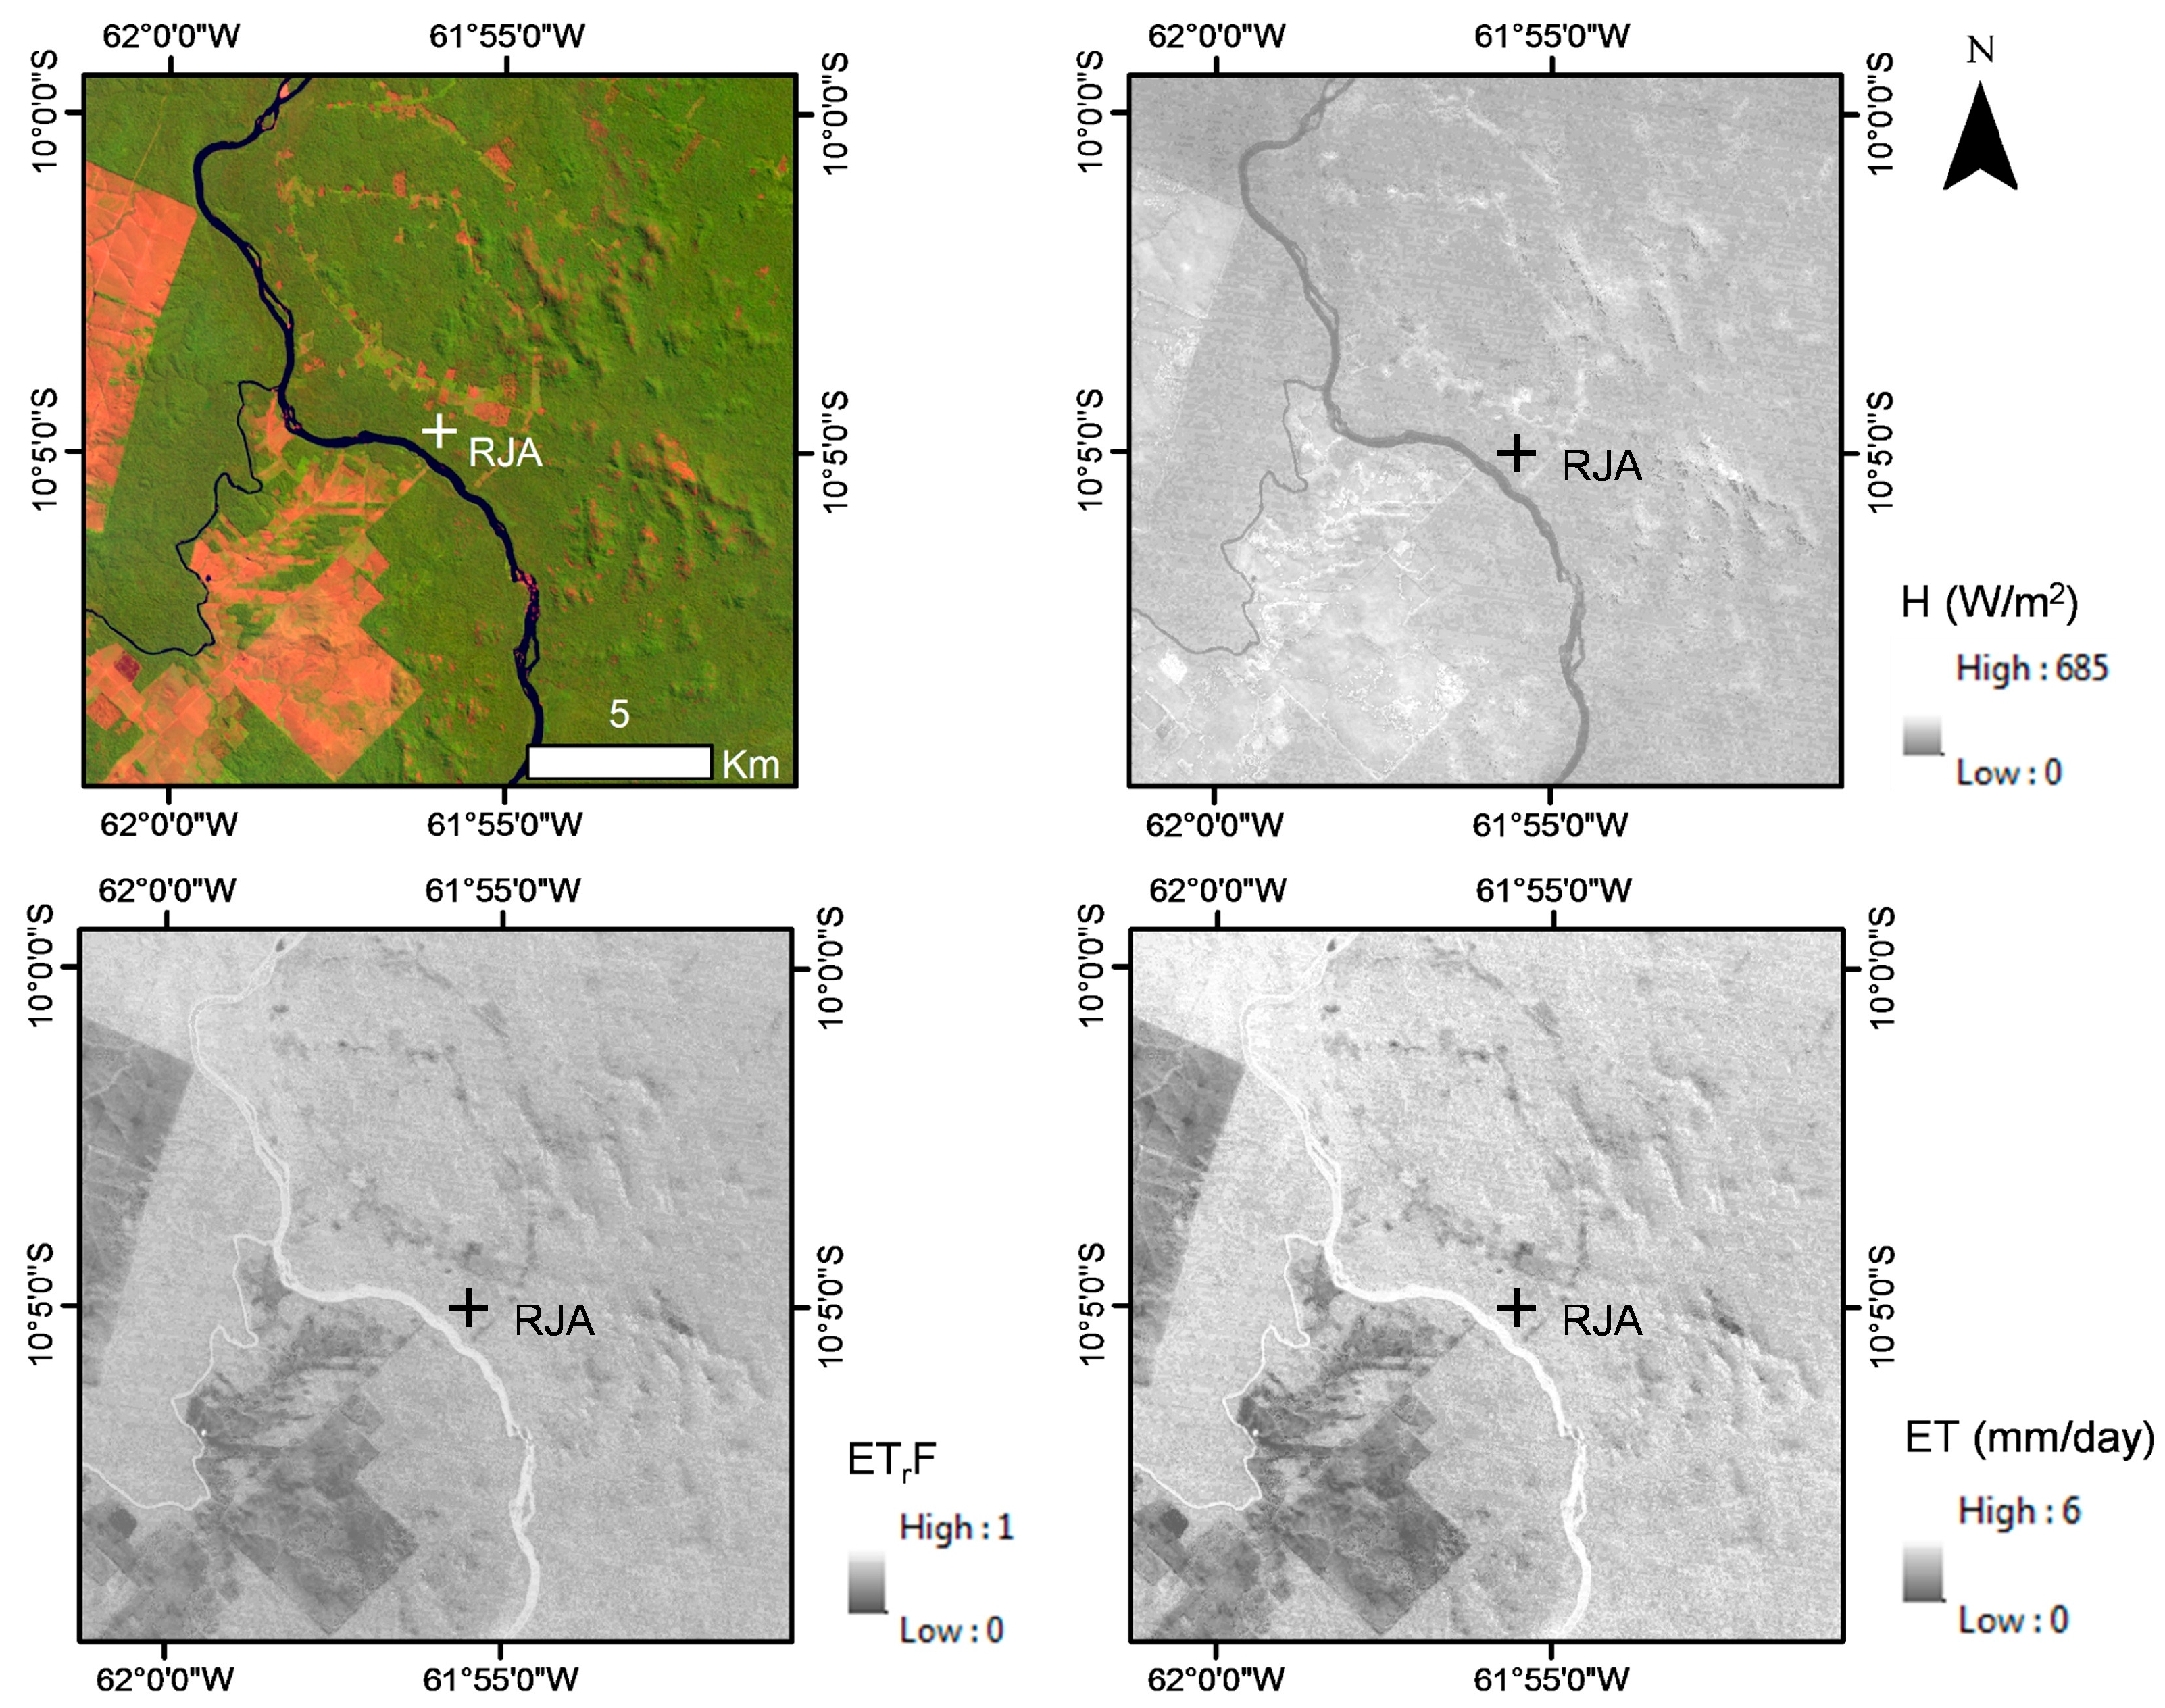
2.1. Sites and Flux Tower Data

The flux data from the Brazilian State of Rondônia were measured as part of the Large-Scale Biosphere-Atmosphere Experiment in Amazonia (NASA LBA). Table 1 summarizes details of flux tower data. The study is focused on the dry season period from June to September to capture seasonal variation in forest ET associated with vegetation water stress and due to the greater availability of cloud-free Landsat images during this period compared to other months. The selection of study years (2000–2002) was based on the availability of meteorological data as an input for METRIC processing and flux tower data for the forest ET comparisons. Figure 2 shows the precipitation of the dry season in the study years.
A flux tower is located in the Jarú Biological Reserve (RJA), Rondônia (Figure 1). The tower is surrounded by seasonally dry tropical forest which averages about 30 m height, with scattered trees as tall as 44 m [26]. The forest has a relatively closed canopy structure and a sparse palm and lianas understory. The second flux tower is located at a pasture site, Fazenda Nossa Senhora (FNS), Ouro Preto, in central Rondônia. The dominant grass species is Brachiaria brizantha which is generally maintained at 0.5 m height [27]. The hourly meteorological information collected from the flux towers over the pasture site (FNS in Rondônia) were utilized as an input for the METRIC processing.
Despite the existence of more sites within the LBA flux tower network dataset, these data were not included in the present study due to a lack of coincident cloud free Landsat imagery and ground-based meteorological data for METRIC processing. The flux tower data were obtained from the Oak Ridge National Laboratory Distributed Active Archive Center (http://daac.ornl.gov/LBA/guides/CD32_Brazil_Flux_Network.html) [28] with datasets provided in [29] for RJA and FNS. The data from RJA include net radiation, latent heat flux and sensible heat flux computed using eddy covariance systems. Detailed information on instrumentation and data preparation is presented in [29,30]. Measured hourly incoming shortwave radiation, air temperature, air humidity, and wind speed data from FNS were utilized to compute alfalfa-based reference ET. Further details on the FNS site are presented in [30,31,32].
Previous studies [6,33,34] have documented energy balance closure problems in eddy covariance data. A common approach to rectify the error is to maintain a constant Bowen-ratio (H/LE) when closing the energy balance [32]. Due to the wide acceptance of this method, it was adopted for closing the energy balance in this study. Only days with energy balance closure ratio (H + LE)/(Rn − G) greater than 0.8 were used for the comparisons to METRIC ET estimates.

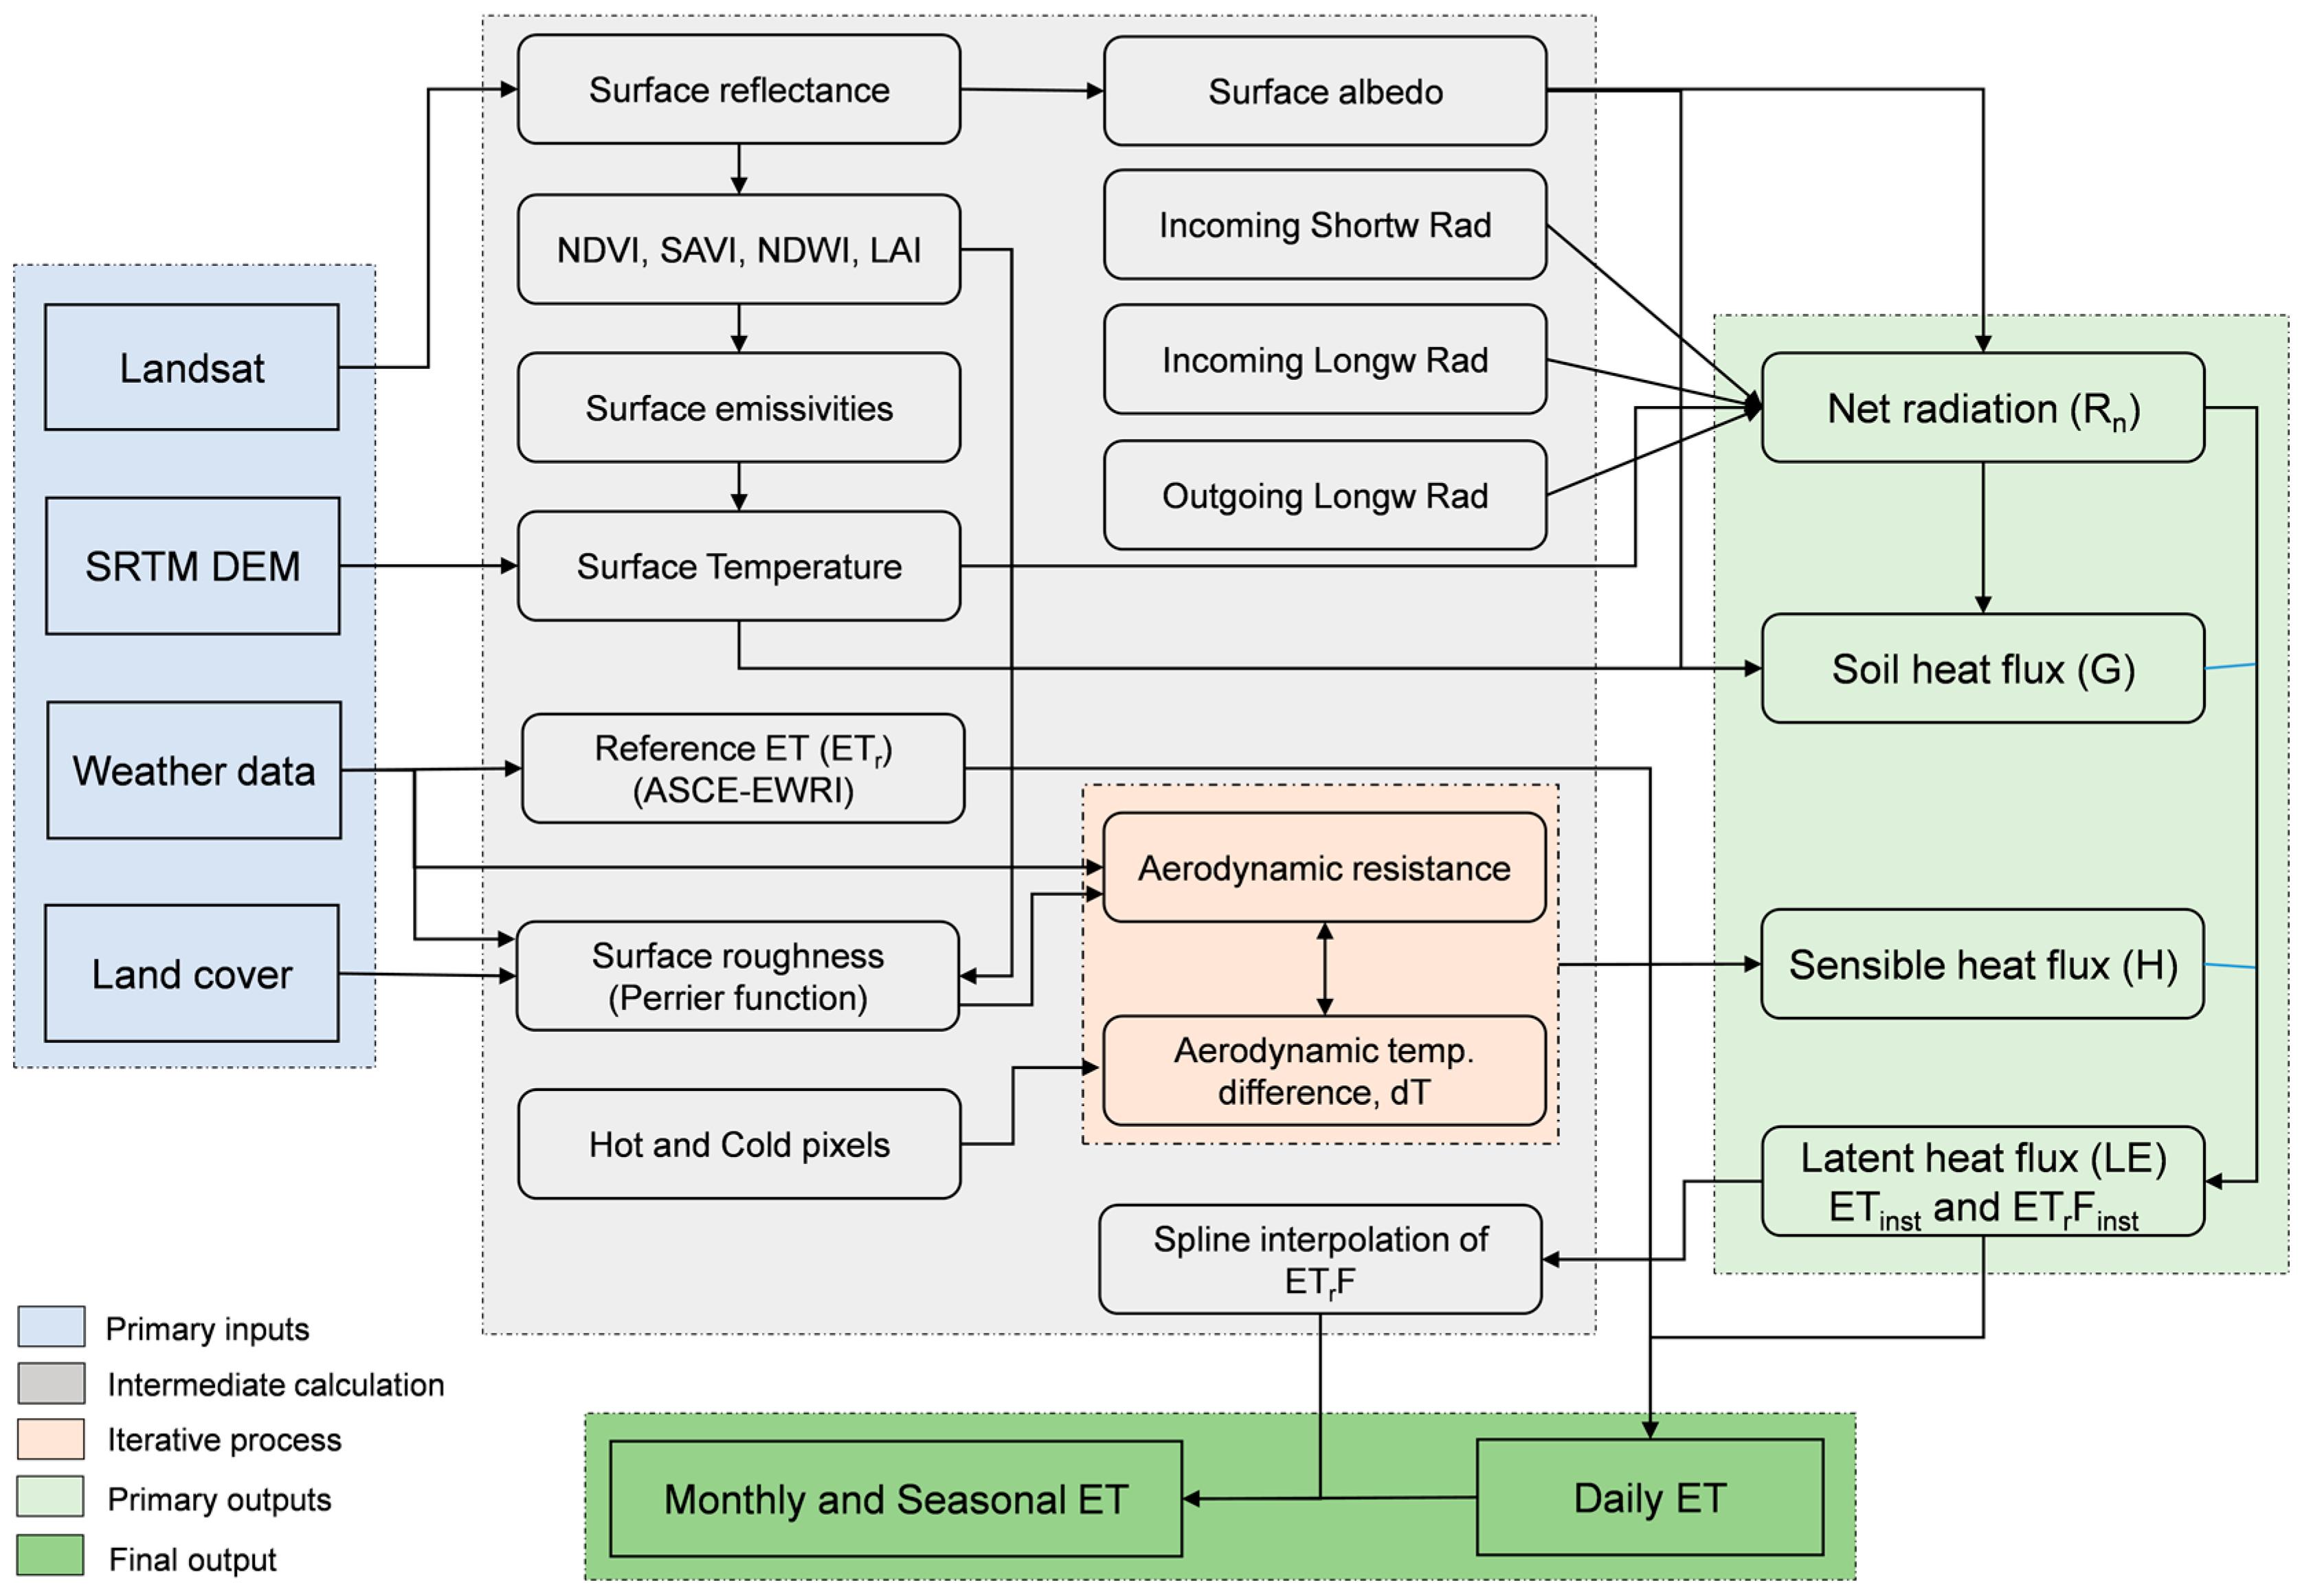
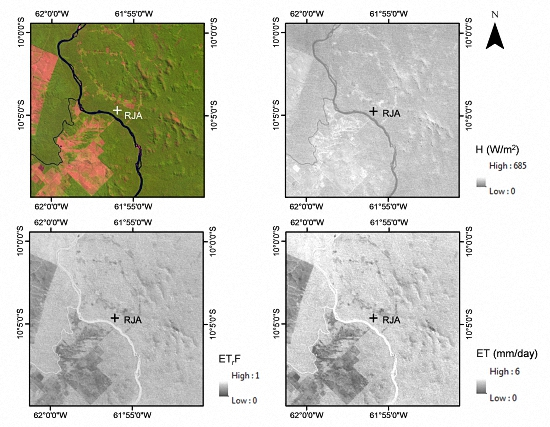
2.2. METRIC Evapotranspiration

METRIC is a satellite imagery-based processing model and estimates ET as a residual of the surface energy balance (Equation (1)).
LE = Rn − G − H
where LE is the latent energy consumed by ET, Rn is net radiation at the surface (W/m2), G is ground heat flux (W/m2) and H is sensible heat flux (W/m2). Figure 3 shows the flowchart of evapotranspiration estimation by METRIC.
Rn computed by subtracting all outgoing radiant fluxes from all incoming radiant fluxes as:
Rn = RSi − αRSi + RLi − RLo − (1 − εο) × RLi
where RS and RL are shortwave (SW) and longwave (LW) radiation (W/m2) with subscript i and o representing incoming and outgoing, respectively. The surface albedo (α) represents the reflective nature of the earth’s surface and was computed as described in [35]. εο is surface emissivity (dimensionless) and is estimated following [20].
G was calculated using an empirical equation developed by [35] as:
G/Rn = 0.05 + 0.18e−0.521 LAI (LAI ≥ 0.5)
G/Rn = 1.80 × (Ts − 273.15)/Rn + 0.084 × (LAI < 0.5)
where Ts is surface temperature (K) estimated using a modified Plank equation following Markham and Barker (1986) with atmospheric and surface emissivity correction as presented in [9]. LAI is leaf area index (dimensionless) and was estimated according to [36].
A one-dimensional aerodynamic function is used to estimate H within METRIC as:
H = ρ × cp × dT/rah = ρ × cp × (Ts − Ta)/rah
where ρ is air density (kg/m3), cp is air specific heat (J/kg/K), dT is the near-surface to air temperature difference between two heights (z1 and z2) in a near-surface blended layer, Ts is the surface temperature (K), Ta is the air temperature (K) and rah is the aerodynamic resistance to heat transport (s/m) [11,20]. rah is estimated during an iterative process based on the friction velocity of the air, the momentum roughness length of the surface and atmospheric stability [20]. More information regarding the calculation process of rah is available in [11,20] and an alternative approach to ensure convergence of the iteration output for wind speeds lower than 2 m/s during the iterative process is available in [37]. METRIC utilizes the Calibration using Inverse Modeling at Extreme Conditions (CIMEC) procedure as used in Surface Energy Balance Algorithms for Land (SEBAL) [8,21] to estimate the dT function (Equation (4)). Ideally, dT represents the temperature difference between the surface and the air at some distance (e.g., 2 m) above the surface. The radiometric temperature available in Landsat’s TIR band may be several K different than the true, or aerodynamic temperature of the surface depending on TIR sensor view angle, vegetation cover fraction, and the surface roughness length for heat and momentum [8,9,11]. In the CIMEC procedure, rather than estimating dT directly from Ts, the dT is established for two known conditions present within the image, and the dT for all areas within the image is indexed using the surface temperature based on these two conditions. The two known conditions are commonly referred to as the cold and the hot anchor pixels. The cold pixel ideally represents a condition with vigorous green, actively transpiring vegetation such as actively growing agricultural crops. The surface tends to be cool due to evaporative cooling. The hot pixel ideally represents a dry, bare soil condition that has been tilled within the last several months, such as an agricultural field devoid of vegetation. The surface tends to be hot due to the lack of evaporative cooling. For these two anchor conditions, Equation (1) can be rewritten as:
H = Rn − G − LE
where net radiation (Rn) (W/m2) is estimated using Equation (2), ground heat flux (G) (W/m2) is estimated using Equations (3a) and (3b) and LE is estimated based on the alfalfa-based reference ET [38] (W/m2), converted from a depth measurement (e.g., mm/h) by multiplying with the latent heat of vaporization. An adjustment factor is used to adjust the ET estimation to reflect the actual evaporation amount at the cold and hot pixels. A value of 1.05 is typically used for the cold pixel, but may be adjusted down in situations where the hot field with vegetation cover is present within the image. For the hot pixel, a value of 0.05 is typically used for situations where the top 10–15 cm of the soil is dry and no rainfall has occurred for 4–6 weeks. A bare soil evaporation model such as presented by [38] can be used to establish the appropriate adjustment factor higher than 0.05 to account for residual soil evaporation from antecedent rainfall.
After establishing H from Equation (1), it is inserted into Equation (4) rewritten as:
dT = H × rah/(ρ × cp)
The resulting dT estimate is generally assumed to “float” above the surface and represent the temperature differential between approximately 10 cm and approximately 2 m above the surface [20,34]. With two known dT conditions within the image, one at the cold pixel and one at the hot pixel, a linear regression function is developed by regressing the known dT values against the surface temperature (K) as dT = aTs + b. Based on this linear regression, the dT values for all other pixels within the image are estimated as indexed values from the surface temperature. In this way, the need for absolute accuracy in the TIR imagery is reduced as long as relative variability in Ts is captured with good fidelity and is nearly constant throughout the scene [9,11].
METRIC employs hourly or shorter interval reference ETr to establish an energy balance condition at the cold pixel during computation of sensible heat flux. ETr indicates the ET rate expected from a well-defined surface of full-cover alfalfa [22] and was calculated using data from ground-based weather stations at the pasture site FNS in Rondônia. We completed a comprehensive weather data quality control prior to use for the METRIC processing [22,39].
After solving for Rn, G and H, LE is computed as a residual of the surface energy equation (Equation (1)). Then, LE is divided by the latent heat for vaporization (λ) to calculate instantaneous ET (mm/h) at the time of the satellite overpass. For the extrapolation of instantaneous ET values at the satellite overpass time to 24-h (daily), ET is obtained using the fraction of reference ET (ETrF), equivalent to the well-known crop coefficient (Kc). ETrF is calculated as the ratio of actual ET to ETr as:
ETrF = ETactual/ETr
The instantaneous ETrF at satellite overpass is assumed to be constant for the entire 24-h period, i.e., ETrFinstantaneous = ETrF24-h [13,20,39].
Statistical significances for data comparison between FT ET and METRIC ET were evaluated based upon t-tests. Only comparisons between the resulting estimates of ET were included in the analysis rather than presenting other components of the energy balance model such as Rn, G and H. The METRIC model, by design, may have certain biases in the intermediate output (such as, in the estimates of net radiation, soil heat flux or similar). Provided these biases are constant across a scene, these biases cancel out during the calibration of H. As a result, an attempt to compare intermediate products to e.g., flux tower data, may show poorer correlation while the final ET estimates compare well. Additional discussion is available in [9,13]. Hence, because it is not particularly relevant to compare intermediate results, we will focus on comparisons of ET only.
A summary of reference ET and associated parameters for the study period is presented in Table 2.

2.2.1. Selection of Cold and Hot Pixels

Cold and hot pixels ideally represent extreme conditions within the scene and the selection of these anchor pixels is critical in the METRIC processing. We employed the following process for their selection: For each image date, we reviewed maps of the image displayed in true and false color as well as METRIC-generated maps of net radiation, surface temperature, normalized difference vegetation index (NDVI), leaf area index (LAI), albedo and sensible heat flux to gain an understanding of the conditions present within each image.
Next, we identified a number (>10) of preliminary hot and cold pixel candidates. The cold pixel was selected from agricultural pastoral fields with green, actively transpiring vegetation cover. In METRIC, the estimation of the energy balance conditions of the cold anchor pixel is based on the expected ET values from vegetation with ET characteristics of agricultural crops [20,22,36]. Therefore, we considered the pasture representing a known, agricultural condition, rather than forest, as the most appropriate land use for selecting the cold anchor pixel. Selecting the cold pixel over the forest would add uncertainty to the resulting ET estimates as the cold anchor pixel would no longer represent a known, agricultural condition. The cold pixel ideally represents a population of vigorous and actively transpiring agricultural vegetation, which is assumed to occur for vegetated, cool surfaces with NDVI >0.75 [13,20]. The NDVI values of the selected cold pixels at the pasture sites ranged from 0.45 to 0.70 which is less than NDVI >0.75 considered ideal cold pixels, indicating less than full vegetation cover. Figure 4 shows the top 20% NDVI values from the pasture parcels for all processed images (Table 3) by year. To compensate for this lower than optimal NDVI, an alternative approach suggested by [9,36] was used to adjust the ETrF fraction downward, viz. ETrFcold = 1.25 × NDVIcold pixel at the cold pixel. This approximation is commonly used during non-growing season where crops are not fully developed or when field parcels with actively growing well-watered crops may not cover the ground fully [20,36]. The hot pixels were selected from parcels with bare soil or with very little vegetation (NDVI < 0.20) [20,36]. The surface at the hot pixel tends to be warm due to the lack of evaporative cooling. A minimum value for ETrF at the hot pixels was set to a minimum of 0.05. A bare soil evaporation model [38] run on a daily time step was used to adjust ETrFhot higher than 0.05 in situations with residual soil evaporation from antecedent rainfall.
Upon insertion of the preliminary hot and cold pixel candidates into METRIC, each resulting map of spatially gridded ETrF values was reviewed by several team members. The review included an assessment of expected ETrF values for different land use types, including agricultural land, forest, bare soil and burnt areas, open water, and urban features such as parks, roads and parking lots. If an adjustment was needed, new sets of hot and cold pixel candidates (>10) were identified, tested in METRIC and the output reviewed again. This iterative process was completed until acceptable anchor pixels were identified. The last set of hot and cold anchor pixels were used to estimate ET for comparison of the FT ET data. The iterative process was completed for all images separately and no anchor pixel coordinates were reused between image dates.

2.2.2. METRIC Parameterization for Forest Application

In order to apply METRIC for tall vegetation such as forest, some adjustments were considered in this study. We applied a function by Perrier [40] for the estimation of surface roughness length (zom) for the forest region, which is based on LAI, average tree height and vertical canopy distribution. For this study, the different zom values were estimated based upon the forest type, which was dominated by dense and regenerated forest as determined based upon the land cover maps developed by [41] and the forest was considered “top heavy” with a field-estimated 70% of the canopy LAI residing above h/2, where h is the tree height [36]. Examples of the relationship between LAI and zom are provided by [36]. For the dense forest, average height was considered as 30 m and for the regenerated forest, it was 20 m. The canopy distribution was assumed to be uniform for dense and regenerated forests. The maximum value of zom for each forest type was limited to 1 m.
Nadir-viewing satellites such as Landsat may capture the spectral signals of shaded area from tall vegetation which can potentially reduce the computed bulk surface temperature and surface albedo [36]. To analyze this possible shadow impact on computed Ts of tall forest vegetation, we tested the liner scaling approach for estimating surface albedo and Ts, and ETrF of selected hot and cold pixels suggested by [36]. The scaling was applied for conditions when the NDVI of the forest region was greater than 0.45 and the surface albedo was less than 0.15. These criteria were set to adequately capture the within-canopy shadows of tall trees biasing the low radiometric surface temperature. A comparison of the differences between ET before and after Ts adjustment showed that the impact on forest ET was very small (<2%) for all of the selected Landsat scenes. As a result, the standard approach of Ts estimation within the METRIC procedure was followed.
DEM (Digital Elevation Model) maps were utilized to account for changes in net radiation caused by surface slope and orientation relative to the sun, and changes to the surface temperature caused by elevation differences. NASA Shuttle Radar Topography Mission (SRTM) data with 90 m horizontal resolution were resampled to 30 m to be the same as the pixel size of the Landsat data.
For the comparison with FT ET, we averaged the METRIC ET estimates centered over the flux tower location. We tested three different pixel window sizes, viz. 3 by 3 (0.81 ha), 5 by 5 (2.25 ha), and 9 × 9 (7.29 ha) in order to identify a proper METRIC ET sampling area. Because relative differences in average values of these variables from three different windows were less than 0.2 mm/day, we found that the ET signal for the forest area surrounding the flux tower is homogeneous. Based on this analysis, the 3 × 3 pixel size was selected to capture forest ET.

2.2.3. Seasonal and Monthly ET Estimates from Daily ETrF Maps

Images selected for the METRIC processing are listed in Table 3. Daily consecutive ET estimates for Landsat scene (231/67 for Rondônia) over the studied dry seasons were produced. This was accomplished by producing estimates of daily ETrF on a pixel-by-pixel basis using a cubic spline interpolation [9,13]. Other methods for interpolating between image dates have been provided by e.g., [39,42,43,44,45]. Applying a cubic spline function may introduce some uncertainty into the estimation of monthly or longer ET estimates. However, a cubic spline function mimics the shape of the well-known crop coefficient curve [38], which accounts for relatively slow changes in vegetation phenology, growth and water stress. The ETrF estimates resulting from the spline function are multiplied by the daily reference ET, which captures the day-to-day variation in atmospheric evaporative demand. The daily ETr was calculated from the weather station data for each day, following [9]. Synthetic images of ETrF were created (Table 3) before or after dry season June–September to help initiate the cubic spline interpolation. The synthetic images were created based on soil evaporation estimates (Allen et al. [13,38]). The average monthly ET was estimated from daily ET computed from the previous steps. Subsequently, ET estimated by METRIC was averaged for 3 × 3 pixel windows over the flux tower location to compare with corresponding FT ET values at this site.

2.2.4. Error Estimation

To quantify errors of ET estimates by METRIC, we calculated root mean square error (RMSE) and percent mean absolute error (%MAE) for daily, seasonal and monthly METRIC ET by following
RMSE = i = 1 n ( METRIC   ET FT   ET ) 2 n
% MAE =   1 n i 1 n ( METRIC   ET FT   ET )   ×   100
where METRIC ET is ET estimates by METRIC, FT ET is ET measured from the flux tower and n is the number of utilized data.

3. Results

3.1. Energy Balance Closure

The eddy covariance data coverage for study years including correlation between energy availability (Rn − G) and energy loss (H + LE), and energy closure ratio ((H + LE)/(Rn − G)) is presented in Table 4. During the complete energy balance closure condition, r2 (coefficient of determination) between Rn − G and H + LE is near or equal to 1, however in our case, these values were 0.60, 0.76, 0.58 for the years 2000, 2001, and 2002, respectively at RJA, whereas the ratios between (H + LE)/(Rn − G) for the study years were 0.67, 0.70 and 0.75, respectively. For our analysis, only those with energy balance closure ≥80% were included in FT ET estimates and comparisons, which were 13, 19 and 22 usable days for 2000, 2001 and 2002 respectively (Table 4).

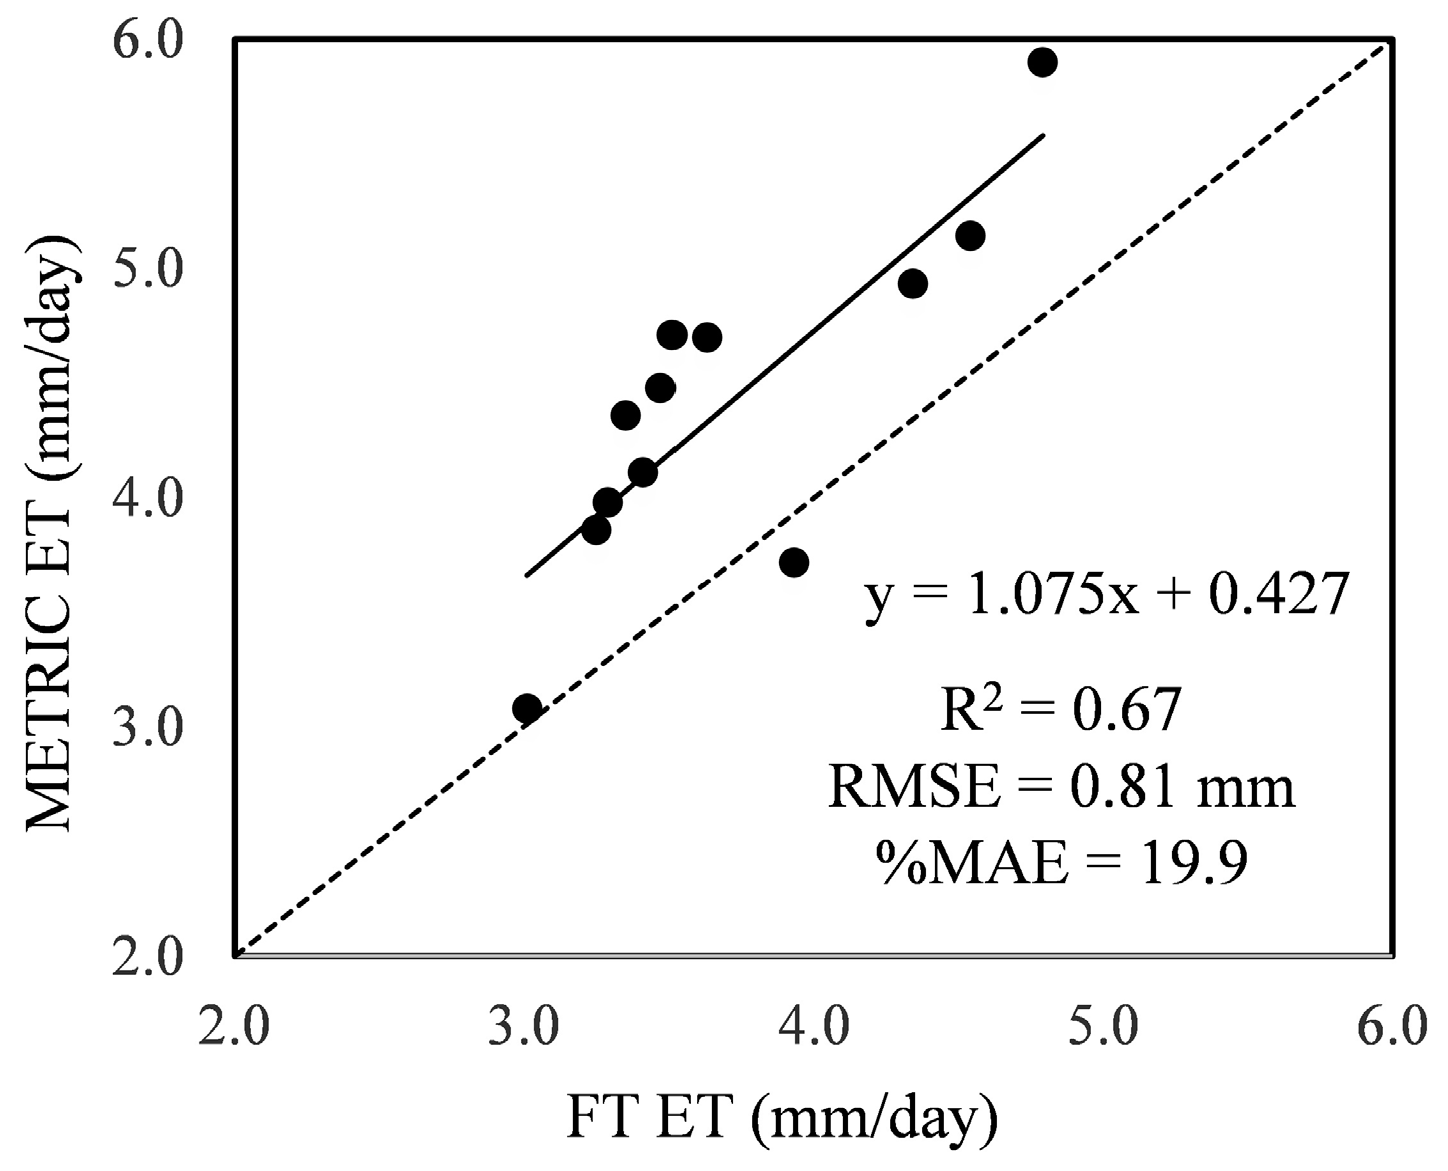
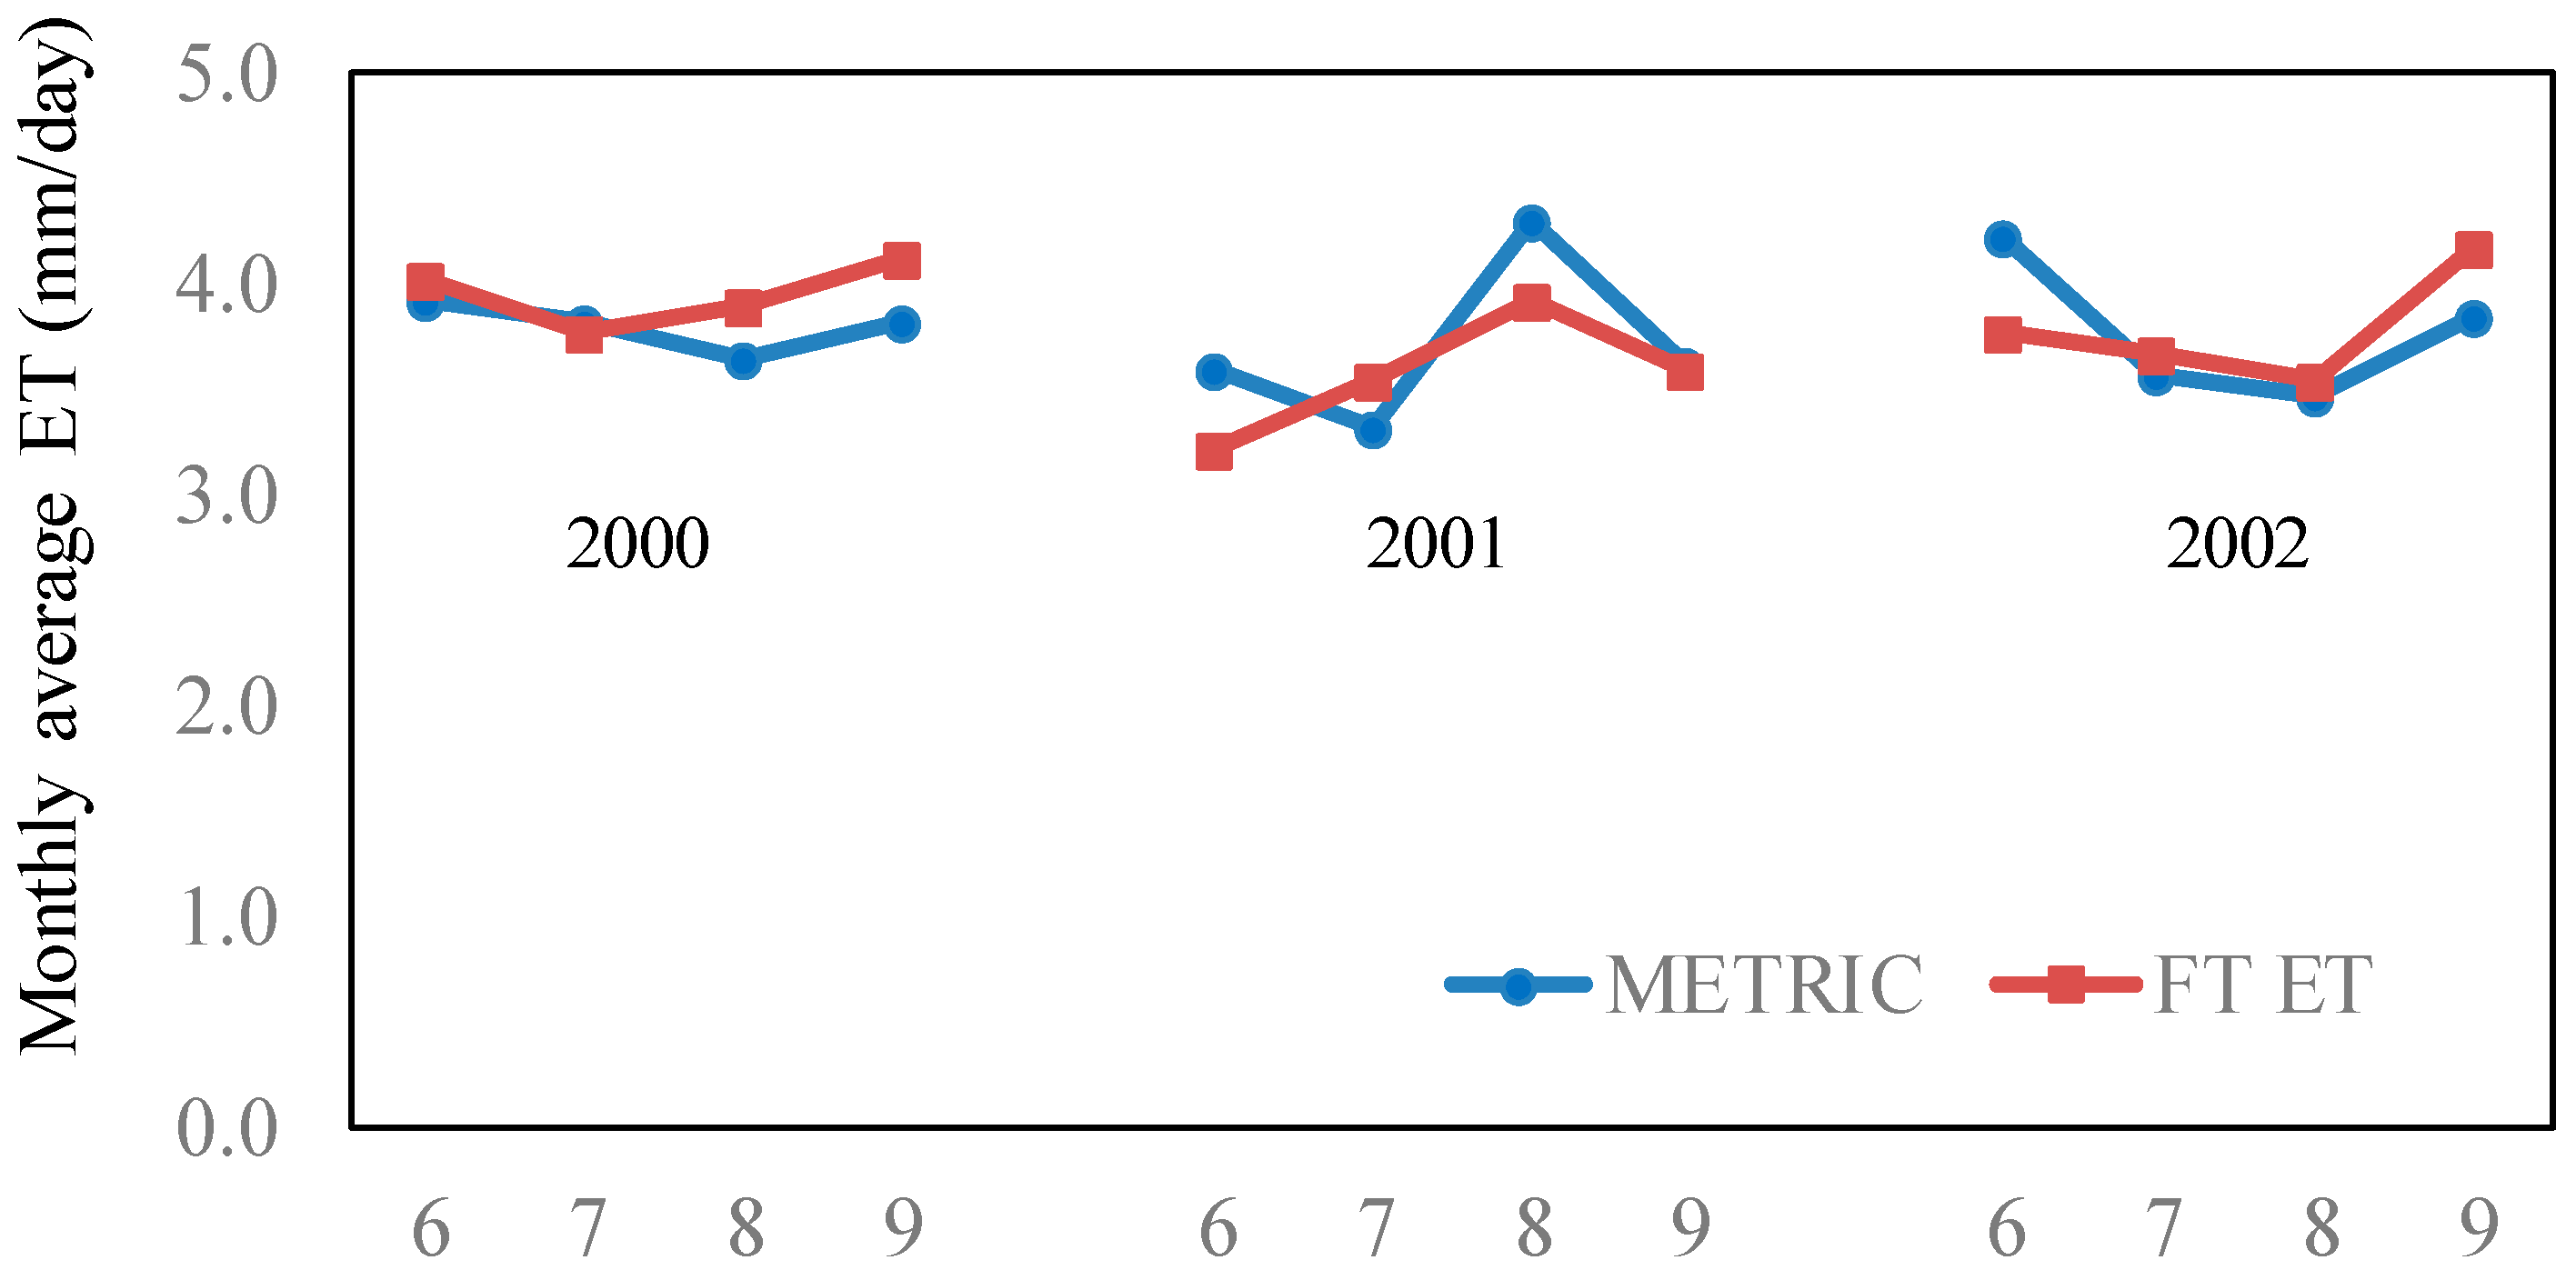
3.2. Daily ET from FT and METRIC

Figure 5 illustrates METRIC derived sensible heat (H), reference ET fraction (ETrF), and ET over the RJA site derived from Landsat imagery (231/67). Figure 6 shows the data points from days where ET from field and Landsat data is available for the comparison. These days are indicated with the letter D in Table 3. Overall agreement between FT ET and METRIC ET during the dry seasons in 2000, 2001 and 2002 is r2 = 0.67, RMSE = 0.81 mm, %MAE = 19.9 (Figure 6). The results indicate that METRIC tended to overestimate daily ET in comparison to FT ET. Differences between FT ET and METRIC ET at RJA are potentially associated with cold pixel selection and limited flux tower data that are discussed in the Discussion section.

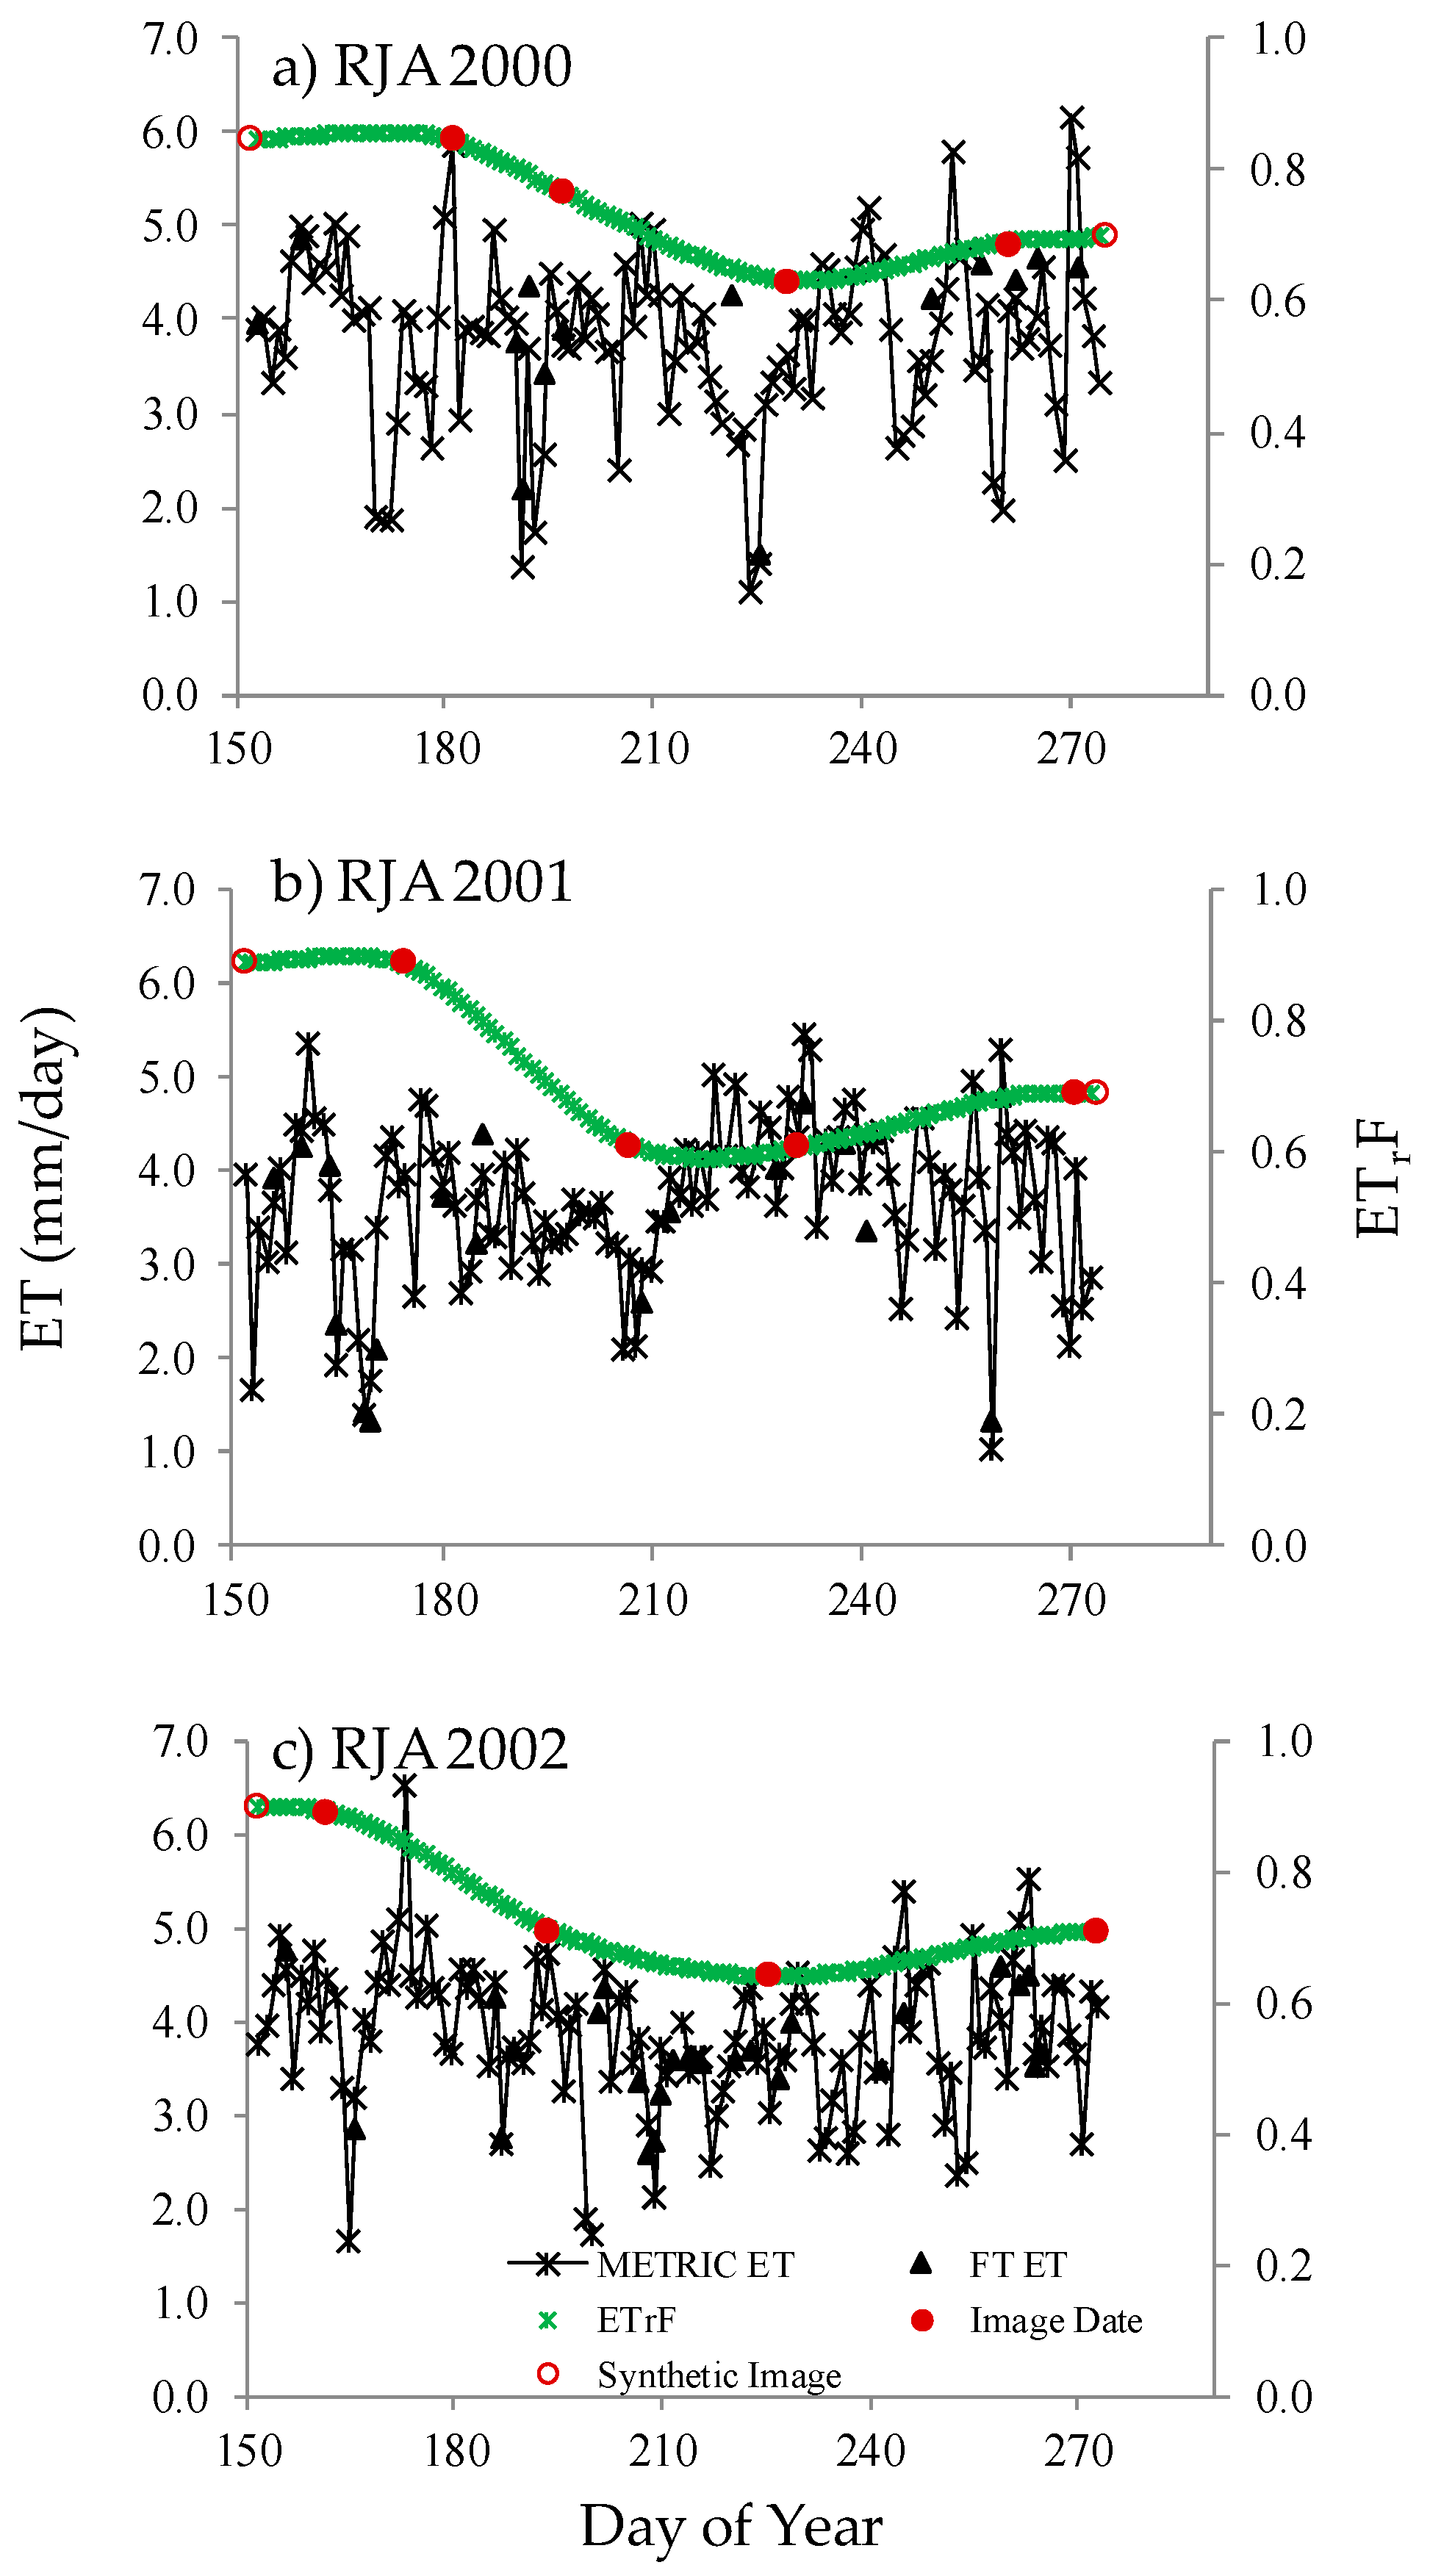
3.3. Seasonal ETrF and ET

Interpolated daily ETrF between image dates, calculated through the spline approach, were used to generate additional daily ET by multiplying ETrF with calculated daily ETr (Figure 7). ETrF accounts for water deficit and other stressors that may limit ETr. Seasonal changes in the ETrF values indicate forest water stress in the dry season, especially during August (Days of year 210–240) when lowest ETrF values coincide with highest cumulated water stress levels in this region (Figure 2). For analysis of seasonal ET, RJA shows high agreements between FT ET and METRIC ET during June to September with r2 = 0.78, 0.84, and 0.71 for 2000, 2001 and 2002, respectively (Table 5).

3.4. Monthly and Seasonal Average ET

Figure 8 shows the monthly average ET rates derived from FT and METRIC for the study site over the dry seasons. Comparisons are made on monthly average ET rather than monthly total ET as there were several missing values on daily flux tower data. METRIC ET and FT ET present similar seasonal patterns. Monthly ET differences between METRIC ET and FT ET are smaller than daily ET comparison (Section 3.1), with the maximum difference <0.5 mm/day and lower errors (RMSE = 0.27 mm and %MAE = 6%), but much lower coefficient of determination (r2 = 0.27).
RJA in 2000 and 2002 presents ET decreasing from June to August and recovering in September. Year 2001 shows the opposite trend though, with the highest ET rates occurring in August. This is potentially related to larger accumulated soil moisture content because of higher precipitation before the dry season than during other years (Figure 2), providing more available water for the trees in the early dry season. The seasonal METRIC ET patterns as well as FT ET observed in Rondônia during 2000 and 2002 show a decreasing trend in RJA during June to August. These observations agree with patterns found in other studies using flux tower data [3,4,5,6,7,46].
Comparisons of seasonal ET from METRIC and FT showed an overall r2 = 0.75 and RMSE = 0.54 mm.

4. Discussion

The results from the comparison of METRIC ET with FT ET indicate the potential of METRIC for providing high resolution ET estimates for Amazonian forests. Reasonable performance was observed in the seasonally dry forests of Rondônia. As daily ET rates are highly variable and fluctuate through the study period due to the variation in atmospheric evaporative demand, larger differences between METRIC ET and FT ET were observed at daily scales whereas both data at seasonal and monthly timescales showed smaller differences. Using daily data, METRIC ET estimates had r2 = 0.67 with RMSE = 0.81 mm with FT ET. At the monthly timescale, some of the uncertainty in the daily estimates are minimized or cancelled out, resulting in lower errors (RMSE = 0.27 mm and difference from FT ET <0.5 mm/day), but a lower relationship (r2 = 0.27). Comparisons of seasonal ET from METRIC and FT showed an overall r2 = 0.75 and RMSE = 0.54 mm.
Previous studies have shown different seasonal ET patterns from wet-equatorial forest in central and north Amazonia and seasonally dry forest in southern Amazonia. While forest ET increases during the dry season in wet-equatorial forest, seasonal dry forest presents the opposite trend based upon eddy covariance data including RJA [4,5]. Both seasonal and monthly METRIC ET estimates captured the seasonal patterns of ET in Rondônia observed in previous studies with the exception of the 2001 monthly ET estimates. A decreasing ET trend in August—middle to end of the dry season—is likely due to the reduction of green leaf area index and transpiration as semideciduous tree species senesce as radiation and the cumulative water deficit condition increases [5]. For 2001, both FT ET and METIC ET estimates present a different pattern to the peak in August.
There are several uncertainties associated with METRIC ET and FT ET estimates. For practical use of this technique, we have identified some challenges for application of METRIC across the Amazon through our analysis. Some of them are discussed below.

4.1. Challenges in Application of METRIC for Forest ET Estimation in Amazonia

An important driver of ET estimates from METRIC is the selection of appropriate cold and hot anchor pixels. The sensitivity of the hot pixel on the final ET rates is normally relatively low since the hot pixel ‘controls’ the ET rates at the dry end of the ET spectrum present within the image. For the cold pixel, however, there is a nearly 1:1 relationship between a bias in the ET for the cold pixel and the bias in the resulting ET for vegetation at full ET [34]. The proper and appropriate selection of the anchor pixels is based on the professional judgment of the individuals applying METRIC [20,42]. Long et al. [42] describes a study assessing and quantifying the impact of selecting representative and appropriate anchor pixels, and uses field data from Iowa to show this importance. In this study, utmost care and our best effort was put into selecting appropriate anchor pixels using the process outlined in Section 2.2.1. Irrigated crop land is usually an ideal target for cold pixel selection and the assumption of cold pixel ET with a fully vegetated and “wet” area is equal to 1.05 × alfalfa reference ETr [19]. In some cases, the NDVI values from the cold pixels selected over pasture were less than 0.75, which may indicate less than full cover conditions. Irrigated fields are rare in the studied region and most agricultural production is rain-fed [29]. Cold pixel selection becomes increasingly challenging as the dry season progresses, especially in the southern drier regions of Amazonia. One solution to this situation is to adjust ETrFcold value based on a regression relationship with NDVI, and adjustment for residual soil evaporation from antecedent rainfall. Allen et al. [9] suggests ETrFcold be developed according to the image, based upon the judgment of the operator or based on local data. Singh and Irmak [47] proposed a method where the reference ET estimated using [22] for the Priestly–Taylor ET estimation method is substituted utilizing a locally calibrated leading (i.e., alpha) coefficient for determining the ET, when estimating sensible heat flux (H) at the cold and hot pixels. For our analysis, we chose not to use the methodology suggested in [22] because it represents a departure from the [22] methodology commonly used and adopted by the broader ET community [22,38] and in other applications of METRIC [9,10,12,13,20]. Hence, to be consistent with the literature and other METRIC applications, and avoid introducing additional uncertainties into our analysis, we chose to use the [22] to estimate the reference ET during the calculation of H at the cold and hot pixels. An additional uncertainty relates to using the ET signal from a managed, agricultural production system to estimate the ET from forest. The air temperature could be higher and the vapor pressure lower over the pasture which in turn may inflate the ETr estimates compared to the forest. While this, in and of itself, does not impact the final ET maps for forest ET developed in this study, it may result in lower ETrF values for the forest. The result of this is that the ETrF values developed in this study may be biased low and caution should be exercised if they are used with ETr estimates calculated from land uses other than rain fed pasture. Further studies of appropriate coefficients (ETrF) based on local environmental conditions in Amazonia are needed.
Under certain atmospheric conditions, such as very low wind speed at 200 m (<~2 m/s) and large dT, a problem with slow or non-convergence during the iterations for the rah may occur. In this study, these atmospheric conditions did not occur and no convergence issues were observed. In other studies such as [36], the lack of convergence has been solved by artificially increasing the wind speed and/or increasing the number of iterations until convergence is achieved. In a recent study, Dhungel et al. [37] showed an alternative approach based on a backward-averaged method. Dhungel et al. [37] found that the method reduces computation time and was able to reach convergence without needing to adjust the wind speed.
A potential problem is related to estimating albedo from tall vegetation in situations where a nadir-viewing satellite records the multispectral reflectance from sunlit as well as shaded portions of the canopy if the sun is not at zenith. This may cause the canopy to appear darker and potentially cause the albedo to be lower compared to viewing sunlit leaves only. Because albedo is a component of the energy balance, any biases in the albedo for tall vegetation not present at the hot and cold pixels could impact the resulting ET estimates. It has been estimated that a bias in albedo of 0.01 results in an error of up to 0.5% in the resulting ET estimates [36].
The availability of quality input data for METRIC is critically important for its application in Amazonia, as in all places. The availability of cloud-free optical satellite data is highly limited over the Amazon rainforests; this is further complicated by haze and smoke from fire during the dry season when land is being cleared. The cloud issue is most problematic for northern Amazonia [41,48]. In our study, in Rondônia, cloud free Landsat imagery can be found in June and July but atmospheric conditions become critical in August and September. This problem is common to all remote sensing-based approaches including METRIC.
METRIC preferably requires and utilizes hourly or even shorter interval ground-based meteorological data for the ET estimation [20], which is an advantage over other satellite based ET models. However, the requirement of complete meteorological data may limit the applicability of the METRIC procedure where long-term meteorological data are scarce, such as the Brazilian Amazon region. INMET, Brazil’s National Institute of Meteorology, currently provides hourly and daily meteorological data publicly from a network of automated weather stations. Most meteorological measurements from INMET began in 2008, while only a limited number of locations include data measurements taken at earlier time periods. Therefore, “wall-to-wall” ET estimates from METRIC for this region will likely be limited to recent years due to the lack of historical meteorological data.
METRIC is designed to produce high quality accurate maps of ET for focused regions but there are other satellite-imagery based surface energy balance models designed for more general and routine application, which require fewer input data compared to METRIC, as discussed in [10,12,49,50,51]. For example, hourly based meteorological data is not required for SSEBop [52] which also employs a pre-defined hot and cold boundary condition for computing daily ET. This eliminates the need for the selection of cold and hot pixels from each Landsat scene as required in the METRIC processing. Several of these less input-intensive models utilizing Landsat data have been tested in agriculture and other simpler land cover types [52,53,54]. Given the limited availability of meteorological data in the Amazon and challenges identifying suitable cold and hot pixels in Amazonian conditions, these alternative models, due to their simplicity, may have a use in the Amazon for applications where a potentially larger margin of error in the ET estimates can be tolerated.
ET estimates from flux towers present several uncertainties, including accuracy and response time of the equipment being used for the measurements. The soil temperature, net radiation and the sonic anemometer sensors all measure the surface energy balance components at different spatial scales, adding to the uncertainties. Twine et al., Wilson et al. and Foken [33,34,55], among others, discuss additional sources of uncertainty in EC-based flux measurements.

4.2. Potential Benefits and Future Direction of Application of METRIC for Forest ET Estimation in Amazonia

ET maps developed using METRIC provide the means to quantify ET in terms of both the rate and spatial distribution, and at high spatial resolution. ET data with seasonal coverage brings several benefits to eco-physiological studies of Amazonian ecosystems. Long-term studies utilizing METRIC coupled with Landsat across the entire Amazon basin do not seem feasible for earlier time periods due to the lack of local meteorological information and insufficient number of cloud-free Landsat images. However, for areas where the data availability of both satellite and meteorological data is adequate, well-characterized ET dynamics in space and time at finer spatial scales, derived from METRIC, will provide a better overall representation of spatial variation of ET associated with forest spatial extent and biophysical conditions compared to the existing coarse resolution ET products, such as MODIS 16 ET [14], as illustrated in Figure 9. There are uses and applications for both coarser scale and finer scale ET maps. For regional or global applications, coarser scale ET estimates are typically adequate. A fine spatial resolution ET map derived from Landsat will allow users to address certain key issues. For instance, seasonal patterns of water vapor and sensible heat flux vary across the tropical biome gradient from forest to savanna [5], thus responses of forest ecosystems to drought vary across biomes which may change within short distances, such as a few tens of meters. The seasonal and inter-annual ET dynamics associated with the Landsat TIR allow users to track changes in water cycles and stress by change in forest type or along forest edges exposed by forest clearing, as caused by both human and natural disturbances [11]. The spatial and temporal variability of ET across forests will be an important source of information for the improvement of existing land surface models. For example, the rate of forest transpiration varies as a function of canopy structure and is also influenced by forest disturbance and edge effects [16,17,54], and different levels of disturbance intensity. High spatial resolution ET data derived will contribute to the improvement of coupled atmosphere–vegetation models to better understand forest canopy moisture transport associated with forest disturbance [17]. In addition, vulnerability to extreme climate events, especially drought, can be linked to high spatial resolution seasonal ET maps via METRIC to predict fire susceptibility of forest.

5. Conclusions

We present the first assessment of the potential of high spatial resolution ET estimates of tropical forest in the Amazon derived from METRIC. The daily, seasonal and monthly METRIC ET data were produced for seasonally dry tropical forests in the Amazon and were compared to flux tower ET measurements. Good correlations between METRIC seasonal ET and seasonal ET from FT (r2 > 0.70) were found for seasonally dry forest in Rondônia. Overall, METRIC derived seasonal ET estimates had agreements with flux tower ET measurements (r2 >0.70 and %MAE <15%) in most cases. Our analysis also highlighted challenges for the application of METRIC in the Amazon. The main challenge regarding the application is the selection of the “cold” anchor pixel used in METRIC calibration due to the difficulty of identifying ideal, fully vegetated and wet conditions for a cold pixel extraction during the dry season in the Amazon. One solution to this issue is to determine suitable ETrF values to the cold pixels according to the conditions in the study area in the Amazon based upon a relationship between ETrF and NDVI. The potential applicability of METRIC varies regionally due to the number of cloud-free images used to establish seasonal ET estimates. Based on the analysis, the METRIC model can be applied routinely in the southern Amazon where cloud-free images are more frequently available, as compared to the northern Amazon.
Despite the above issues, a high spatial resolution ET product via METRIC has the potential to improve our understanding of Amazonian forests, including hydrologic impact of land conversion from forest to agricultural production, local and regional water balances for water management, and spatial mapping of vegetation health and vigor via ET estimations to assess the vulnerability and response of forest to extreme climate events in the Amazon. These issues can be addressed in future studies based upon the results of the present paper.

Acknowledgments

This work is supported by a research grant from the NASA Terrestrial Ecology Program (NNH13ZDA001N-TE). We greatly acknowledge the use of LBA flux tower data for the model comparisons.

Author Contributions

Izaya Numata, Kul Khand and Jeppe Kjaersgaard conceived and designed the experiment. Kul Khand and Izaya Numata prepared, processed the data. Izaya Numata, Kul Khand, Jeppe Kjaersgaard, and Mark Cochrane contributed to the analysis and the interpretation of the results. Izaya Numata wrote the paper and all the other members revised the paper.

Conflicts of Interest

The authors declare no conflict of interest. And the founding sponsors had no role in the design of the study; in the collection, analyses, or interpretation of data; in the writing of the manuscript, and in the decision to publish the results.

References

  1. Salati, E.; Nobre, C.A. Possible climatic impacts of tropical deforestation. Clim. Chang. 1991, 19, 177–196. [Google Scholar] [CrossRef]
  2. Victoria, R.L.; Martinelli, L.A.; Mortatti, J.; Richey, J. Mechanisms of water recycling in the Amazon basin: Isotopic insights. Ambio 1991, 20, 384–387. [Google Scholar]
  3. D’Almeida, C.; Vorosmarty, C.J.; Hurtt, G.C.; Marengo, J.A.; Dingman, S.L.; Keim, B.D. The effects of deforestation on the hydrological cycle in Amazonia: A review on scale and resolution. Int. J. Climatol. 2007, 27, 633–647. [Google Scholar] [CrossRef]
  4. Hasler, N.; Avissar, R. What controls evapotranspiration in the Amazon basin? J. Hydrometeorol. 2007, 8, 380–395. [Google Scholar] [CrossRef]
  5. Da Rocha, H.R.; Manzi, A.O.; Cabral, O.M.; Miller, S.D.; Goulden, M.L.; Saleska, S.R.; Coupe, N.R.; Wofsy, S.C.; Borma, L.S.; Artaxo, P.; et al. Patterns of water and heat flux across a biome gradient from tropical forest to savanna in Brazil. J. Geophys. Res. Biogeosci. 2009, 114. [Google Scholar] [CrossRef] [Green Version]
  6. Costa, M.H.; Biajoli, M.C.; Sanches, L.; Malhado, A.C.M.; Hutyra, L.R.; da Rocha, H.R.; Aguiar, R.G.; de Araujo, A.C. Atmospheric versus vegetation controls of Amazonian tropical rain forest evapotranspiration: Are the wet and seasonally dry rain forests any different? J. Geophys. Res. Biogeosci. 2010, 115. [Google Scholar] [CrossRef]
  7. Werth, D.; Avissar, R. The regional evapotranspiration of the Amazon. J. Hydrometeorol. 2004, 5, 100–109. [Google Scholar] [CrossRef]
  8. Bastiaanssen, W.G.M. Regionalization of Surface Flux Densities and Moisture Indicators in Composite Terrain: A Remote Sensing Approach under Clear Skies in Mediterranean Cimates. Ph.D. Thesis, CIP Data Koninklijke Bibliotheek, Den Haag, The Netherlands, 1995. [Google Scholar]
  9. Allen, R.G.; Tasumi, M.; Morse, A.; Trezza, R.; Wright, J.L.; Bastiaansseen, W.; Kramber, W.; Lorite, I.; Robison, C. Satellite-based energy balance for mapping evapotranspiration with internalized calibration (METRIC)–Applications. J. Irrig. Drain. Eng. 2007, 133, 395–406. [Google Scholar] [CrossRef]
  10. Kalma, J.D.; McVicar, T.R.; McCabe, M.F. Estimating Land Surface Evaporation: A Review of Methods Using Remotely Sensed Surface Temperature Data. Surv. Geophys. 2008, 29, 421–469. [Google Scholar] [CrossRef]
  11. Anderson, M.C.; Allen, R.G.; Morse, A.; Kustas, W.P. Use of Landsat thermal imagery in monitoring evapotranspiration and managing water resources. Remote Sens. Environ. 2012, 122, 50–65. [Google Scholar] [CrossRef]
  12. Gowda, P.H.; Chavez, J.L.; Colaizzi, P.D.; Evett, S.R.; Howell, T.A.; Tolk, J.A. Remote sensing based energy balance algorithms for mapping ET: Current status and future challenges. Trans. Am. Soc. Agric. Biol. Eng. 2007, 5, 1639–1644. [Google Scholar]
  13. Allen, R.; Irmak, A.; Trezza, R.; Hendrickx, J.M.H.; Bastiaanssen, W.; Kjaersgaard, J. Satellite-based ET estimation in agriculture using SEBAL and METRIC. Hydrol. Process. 2011, 25, 4011–4027. [Google Scholar] [CrossRef]
  14. Mu, Q.; Heinsch, F.A.; Zhao, M.; Running, S.W. Development of a global evapotranspiration algorithm based on MODIS and global meteorology data. Remote Sens. Environ. 2007, 111, 519–536. [Google Scholar] [CrossRef]
  15. Mu, Q.Z.; Zhao, M.S.; Running, S.W. Improvements to a MODIS global terrestrial evapotranspiration algorithm. Remote Sens. Environ. 2011, 115, 1781–1800. [Google Scholar] [CrossRef]
  16. Laurance, W.F.; Camargo, J.L.C.; Luizao, R.C.C.; Laurance, S.G.; Pimm, S.L.; Bruna, E.M.; Stouffer, P.C.; Williamson, G.B.; Benitez-Malvido, J.; Vasconcelos, H.L.; et al. The fate of Amazonian forest fragments: A 32-year investigation. Biol. Conserv. 2011, 144, 56–67. [Google Scholar] [CrossRef]
  17. Roy, S.B. Mesoscale moisture transport effects on forest edges in a fragmented landscape in Amazonia. Clim. Chang. 2011, 108, 609–617. [Google Scholar]
  18. Allen, R.G. Using the FAO-56 dual crop coefficient method over an irrigated region as part of an evapotranspiration intercomparison study. J. Hydrol. 2000, 229, 27–41. [Google Scholar] [CrossRef]
  19. Allen, R.G.; Clemmens, A.J.; Burt, C.M.; Solomon, K.; O’Halloran, T. Prediction accuracy for projectwide evapotranspiration using crop coefficients and reference evapotranspiration. J. Irrig. Drain. Eng. 2005, 131, 24–36. [Google Scholar] [CrossRef]
  20. Allen, R.G.; Tasumi, M.; Trezza, R. Satellite-based energy balance for mapping evapotranspiration with internalized calibration (METRIC)—Model. J. Irrig. Drain. Eng. 2007, 133, 380–394. [Google Scholar] [CrossRef]
  21. Bastiaanssen, W.G.M. SEBAL-based sensible and latent heat fluxes in the irrigated Gediz Basin, Turkey. J. Hydrol. 2000, 229, 87–100. [Google Scholar] [CrossRef]
  22. Environmental and Water Resources Institute of the American Society of Civil Engineers (ASCE-EWRI). The ASCE Standardized Reference Evapotranspiration Equation; Report of the ASCE-EWRI Task Committee on Standardization of Reference Evapotranspiration; ASCE: Reston, VA, USA, 2005. [Google Scholar]
  23. Trezza, R.; Allen, R.G.; Tasumi, M. Estimation of actual evapotranspiration along the Middle Rio Grande of New Mexico using MODIS and Landsat imagery with the METRIC model. Remote Sens. 2013, 5, 5397–5423. [Google Scholar] [CrossRef]
  24. Bhattarai, N.; Quackenbush, L.J.; Dougherty, M.; Marzen, L.J. A simple Landsat-MODIS fusion approach for monitoring seasonal evapotranspiration at 30 m spatial resolution. Int. J. Remote Sens. 2015, 36, 115–143. [Google Scholar] [CrossRef]
  25. Carrilo-Rojas, G.; Silva, B.; Córdova, M.; Célleri, R.; Bendix, J. Dynamic mapping of evapotranspiration using an energy balance-based model over an Andean Páramo Catchment of Southern Ecuador. Remote Sens. 2016, 8, 160. [Google Scholar] [CrossRef]
  26. McWilliam, A.L.C.; Cabral, M.R.; Gomes, B.M.; ESteves, J.L.; Roberts, J.M. Forest and pasture leaf-gas exchange in south-west Amazonia. In Amazonian Deforestation and Climate; Gash, J.H.C., Nobre, C.A., Robert, J.M., Victoria, R.L., Eds.; John Wiley & Sons: Chichester, NY, USA, 1996; pp. 265–285. [Google Scholar]
  27. Numata, I.; Roberts, D.A.; Chadwick, O.A.; Schimel, J.P.; Sampaio, F.F.; Leonidas, F.C.; Soares, J.V. Characterization of pasture biophysical properties and the impact of grazing intensity using remotely sensed data. Remote Sens. Environ. 2007, 108, 314–327. [Google Scholar] [CrossRef]
  28. Oak Ridge National Laboratory Distributed Active Archive Center. LBA-ECO CD-32 Flux Tower Network Data Compilation, Brazilian Amazon: 1999–2006. Available online: http://daac.ornl.gov/LBA/guides/CD32_Brazil_Flux_Network.html (accessed on 1 February 2015).
  29. Von Randow, C.; Manzi, A.O.; Kruijt, B.; de Oliveira, P.J.; Zanchi, F.B.; Silva, R.L.; Hodnett, M.G.; Gash, J.H.C.; Elbers, J.A.; Waterloo, M.J.; et al. Comparative measurements and seasonal variations in energy and carbon exchange over forest and pasture in south west Amazonia. Theor. Appl. Climatol. 2004, 78, 5–26. [Google Scholar] [CrossRef]
  30. Saleska, S.R.; Miller, S.D.; Matross, D.M.; Goulden, M.L.; Wofsy, S.C.; da Rocha, H.R.; de Camargo, P.B.; Crill, P.; Daube, B.C.; de Freitas, H.C.; et al. Carbon in Amazon forests: Unexpected seasonal fluxes and disturbance-induced losses. Science 2003, 302, 1554–1557. [Google Scholar] [CrossRef] [PubMed]
  31. Araujo, A.C.; Nobre, A.D.; Kruijt, B.; Elbers, J.A.; Dallarosa, R.; Stefani, P.; von Randow, C.; Manzi, A.O.; Culf, A.D.; Gash, J.H.C.; et al. Comparative measurements of carbon dioxide fluxes from two nearby towers in a central Amazonian rainforest: The Manaus LBA site. J. Geophys. Res. Atmos. 2002, 107. [Google Scholar] [CrossRef]
  32. Goulden, M.L.; Miller, S.D.; da Rocha, H.R.; Menton, M.C.; de Freitas, H.C.; Figueira, A.M.E.S.; de Sousa, C.A.D. Diel and seasonal patterns of tropical forest CO2 exchange. Ecol. Appl. 2004, 14, S42–S54. [Google Scholar] [CrossRef]
  33. Twine, T.E.; Kustas, W.P.; Norman, J.M.; Cook, D.R.; Houser, P.R.; Meyers, T.P.; Prueger, J.H.; Starks, P.J.; Wesely, M.L. Correcting eddy-covariance flux underestimates over a grassland. Agric. For. Meteorol. 2000, 103, 279–300. [Google Scholar] [CrossRef]
  34. Wilson, K.; Goldstein, A.; Falge, E.; Aubinet, M.; Baldocchi, D.; Berbigier, P.; Bernhofer, C.; Ceulemans, R.; Dolman, H.; Field, C.; et al. Energy balance closure at fluxnet sites. Agric. For. Meteorol. 2002, 113, 223–243. [Google Scholar] [CrossRef]
  35. Tasumi, M.; Allen, R.G.; Trezza, R.; Wright, J.L. Satellite-based energy balance to assess with in-population variance of crop coefficient curves. J. Irrig. Drain. Eng. 2005, 131, 94–109. [Google Scholar] [CrossRef]
  36. Allen, R.; Trezza, R.; Tasumi, M.; Kjaersgaard, J. METRIC: Mapping Evapotranspiration at High Resolution Using Internalized Calibration Applications Manual for Landsat Satellite Imagery, V 3.0.; University of Idaho: Moscow, ID, USA, 2014; 279.
  37. Dhungel, R.; Allen, R.G.; Trezza, R. Improving iterative surface energy balance convergence for remote sensing based flux calculations. J. Appl. Remote Sens. 2016, 10, 026033. [Google Scholar] [CrossRef]
  38. Allen, R.G.; Pereira, L.S.; Raes, D.; Smith, M. Crop Evapotranspiration—Guidelines for Computing Crop Water Requirements—FAO Irrigation and Drainage Paper 56; Food and Agriculture Organization of the United Nations: Rome, Italy, 1998. [Google Scholar]
  39. Kjaersgaard, J.; Allen, R.; Irmak, A. Improved methods for estimating monthly and growing season ET using METRIC applied to moderate resolution satellite imagery. Hydrol. Process. 2011, 25, 4028–4036. [Google Scholar] [CrossRef]
  40. Perrier, A. Land surface process: Vegetation. In Land Surface Process in Atmospheric General Circulation Models; Eagelson, P., Ed.; Cambridge University Press: Cambridge, UK, 1982; pp. 395–448. [Google Scholar]
  41. Souza, C.M.; Siqueira, J.V.; Sales, M.H.; Fonseca, A.V.; Ribeiro, J.G.; Numata, I.; Cochrane, M.A.; Barber, C.P.; Roberts, D.A.; Barlow, J. Ten-year Landsat classification of deforestation and forest degradation in the Brazilian Amazon. Remote Sens. 2013, 5, 5493–5513. [Google Scholar] [CrossRef]
  42. Long, D.; Singh, V.P. Assessing the impact of end-member selection on the accuracy of satellite-based spatial variability models for actual evapotranspiration estimation. Water Resour. Res. 2013, 49, 2601–2618. [Google Scholar] [CrossRef]
  43. Cammalleri, C.; Anderson, M.C.; Gao, F.; Hain, C.R.; Kustas, W.P. Mapping daily evapotranspiration at field scales over rainfed and irrigated agricultural areas using remote sensing data fusion. Agric. For. Meteorol. 2014, 186, 1–11. [Google Scholar] [CrossRef]
  44. Semmens, K.A.; Anderson, M.C.; Kustas, W.P.; Gao, F.; Alfieri, J.G.; McKee, L.; Prueger, J.H.; Hain, C.R.; Cammalleri, C.; Yang, Y.; Xia, T. Monitoring daily evapotranspiration over two California vineyards using Landsat 8 in a multi-sensor data fusion approach. Remote Sens. Environ. 2016, 185, 155–170. [Google Scholar] [CrossRef]
  45. Dhungel, R.; Allen, R.G.; Trezza, R.; Robison, C.W. Evapotranspiration between satellite overpasses: Methodology and case study in agricultural dominant semi-arid areas. Meteorol. Appl. 2016, 23, 714–730. [Google Scholar] [CrossRef]
  46. Da Rocha, H.R.; Goulden, M.L.; Miller, S.D.; Menton, M.C.; Pinto, L.D.V.O.; de Freitas, H.C.; Figueira, A.M.E.S. Seasonality of water and heat fluxes over a tropical forest in eastern Amazonia. Ecol. Appl. 2004, 14, S22–S32. [Google Scholar] [CrossRef]
  47. Singh, R.K.; Irmak, A. Treatment of anchor pixels in the METRIC model for improved estimation of sensible and latent heat fluxes. Hydrol. Sci. J. 2011, 56, 895–906. [Google Scholar] [CrossRef]
  48. Asner, G.P. Cloud cover in Landsat observations of the Brazilian Amazon. Int. J. Remote Sens. 2001, 22, 3855–3862. [Google Scholar] [CrossRef]
  49. Senay, G.B.; Gowda, P.H.; Bohms, S.; Howell, T.A.; Friedrichs, M.; Marek, T.H.; Verdin, J.P. Evaluating the SSEBop approach for evapotranspiration mapping with Landsat data using lysimetric observations in the semi-arid Texas High Plains. Hydrol. Earth Syst. Sci. Discuss. 2014, 11, 723–756. [Google Scholar] [CrossRef]
  50. Senay, G.B.; Bohms, S.; Singh, R.K.; Gowda, P.H.; Velpuri, N.M.; Alemu, H.; Verdin, J.P. Operational evapotranspiration mapping using remote sensing and weather datasets: A new parameterization for the SSEB approach. J. Am. Water Resour. Assoc. 2013, 49, 577–591. [Google Scholar] [CrossRef]
  51. Su, Z. The surface energy balance systems (SEBS) for estimation of turbulent fluxes. Hydrol. Earth Syst. Sci. 2002, 6, 85–99. [Google Scholar] [CrossRef]
  52. Singh, R.K.; Senay, G.B.; Velpuri, N.M.; Bohms, S.; Scott, R.L.; Verdin, J.R. Actual evapotranspiration (water use) assessment of the Colorado river basin at the Landsat resolution using the operational simplified surface energy balance model. Remote Sens. 2014, 6, 233–256. [Google Scholar] [CrossRef]
  53. Roerink, G.J.; Su, Z.; Menenti, M. S-SEBI: A simple remote sensing algorithm to estimate the surface energy balance. Phys. Chem. Earth Part B 2000, 25, 147–157. [Google Scholar] [CrossRef]
  54. Ringgaard, R.; Herbst, M.; Friborg, T. Partitioning of forest evapotranspiration: The impact of edge effects and canopy structure. Agric. For. Meteorol. 2012, 166, 86–97. [Google Scholar] [CrossRef]
  55. Foken, T. Micrometeorology; Springer: Berlin, Germany, 2008. [Google Scholar]
Figure 1. Flux tower sites Jarú Biological Reserve (RJA) and Fazenda Nossa Senhora (FNS) in Rondônia, the Brazilian Amazon.
Remotesensing 09 00046 g001
Figure 2. Monthly average precipitation over the dry season at RJA in Rondônia.
Remotesensing 09 00046 g002
Figure 3. Flowchart of METRIC evapotranspiration estimation.
Remotesensing 09 00046 g003
Figure 4. Normalized difference vegetation index (NDVI) values of the highest 20% pixel candidates for a cold pixel selected from four images per each year. Each plot shows the minimum, maximum, average and first, second and third quantiles.
Remotesensing 09 00046 g004
Figure 5. Illustration of METRIC derived products. Landsat image in RGB with bands 5, 4 and 3 (upper left), Sensible Heat (upper right), ETrF (lower left) and METRIC ET (lower right) over the RJA site in Rondônia. Image date: 13 July 2002.
Remotesensing 09 00046 g005
Figure 6. Daily ET measured from flux tower vs. estimated ET by METRIC during the dry seasons in 2000, 2001 and 2002.
Remotesensing 09 00046 g006
Figure 7. (ac) Daily ETrF interpolated by a spline function with image dates (closed circle), daily ET derived from METRIC (cross) and FT ET (triangle) for the study site. Synthetic images (open circle) were used for spline before and after the dry seasons.
Remotesensing 09 00046 g007
Figure 8. Monthly average ET derived from both METRIC and the flux tower over the dry season (June–September) for the RJA site.
Remotesensing 09 00046 g008
Figure 9. Thirty meter monthly ET map from Landsat using METRIC (left) and 1km monthly ET map derived from MODIS (Mu et al. 2007) (right) both from July 2000 over the RJA flux tower region.
Remotesensing 09 00046 g009
Table 1. Summary of the characteristics of the flux tower sites in the analysis.
SiteLocation (Latitude S, Longitude W)Biome TypeInstrument Height (m) Canopy Height (m)Period of Data Used
RJAReserva Jarú (RJA), Rondônia (10.08, 61.93)Tropical semideciduous forest60302000–2002
FNSFazenda Nossa Senhora, Rondônia (10.76, 62.35)Pasture10 0.52000–2002
Table 2. Summary of reference ET (ETr), temperature and wind speed for the study period.
YearAvg ETrMax ETrMin ETrTavgTmaxTminWavgWmaxWmin
20005.28.91.724.628.513.03.09.71.4
20015.39.01.624.928.712.92.68.01.2
20025.38.21.925.728.120.22.76.51.3
Avg ETr = average reference ET (mm/day); Max ETr = Maximum reference ETr (mm/day); Tavg = average temperature (°C); maximum temperature (°C); minimum temperature (°C); Wavg = average wind speed (m/s); Wmax = maximum wind speed (m/s); and Wmin = minimum wind speed (m/s).
Table 3. Path/row, date and satellite platform for the images used in the METRIC processing for the daily ET estimation.
Path/RowSiteDate *Satellite
231/67RJA5/31/2000 (C)synthetic image
231/67RJA6/29/2000 (C, D)Landsat 5
231/67RJA7/15/2000 (C, D)Landsat 5
231/67RJA8/16/2000 (C)Landsat 5
231/67RJA8/24/2000 (D)Landsat 7
231/67RJA9/17/2000 (C, D)Landsat 5
231/67RJA10/1/2000 (C)synthetic image
231/67RJA5/31/2001 (C)synthetic image
231/67RJA6/8/2001 (D)Landsat 7
231/67RJA6/24/2001 (C, D)Landsat 7
231/67RJA7/26/2001 (C, D)Landsat 7
231/67RJA8/19/2001 (C, D)Landsat 5
231/67RJA9/28/2001 (C)Landsat 7
231/67RJA10/1/2001 (C)synthetic image
231/67RJA5/31/2002 (C)synthetic image
231/67RJA6/11/2002 (C, D)Landsat 7
231/67RJA6/27/2002 (D)Landsat 7
231/67RJA7/13/2002 (C, D)Landsat 7
231/67RJA7/29/2002 (D)Landsat 7
231/67RJA8/14/2002 (C)Landsat 7
231/67RJA10/1/2002 (C)Landsat 7
* C = images used for cubic spline interpolation of ETrF values. D = image dates for daily ET comparison between METRIC ET and flux tower (FT) ET.
Table 4. Number of days with available data and as % of days of the year, regression coefficients and energy balance closure of the flux tower full dataset from RJA.
YearNo. of Days with Available Data (% of Days in Year)r2 for Rn − G vs. H + LE(H + LE)/(Rn − G)
2000174 (48%)0.600.67
2001261 (71%)0.760.70
2002185 (51%)0.580.75
Table 5. Relationships between simulated daily ET by METRIC with flux tower derived ET.
LocationYearNo. of DatesaBr2RMSE%MAE
RJA2000130.731.320.780.6613.8
RJA2001190.890.240.840.5012.2
RJA2002220.651.170.710.479.7
a = slope; B = intercept; r2 = coefficient of determination; RMSE = root mean square error; and %MAE = % of mean absolute error.

