Satellite Monitoring of Urban Land Change in the Middle Yangtze River Basin Urban Agglomeration, China between 2000 and 2016


1
State Key Laboratory of Information Engineering in Surveying, Mapping, and Remote Sensing, Wuhan University, 129 Luoyu Road, Wuhan 430079, China
2
Collaborative Innovation Center of Geospatial Technology, Wuhan University, 129 Luoyu Road, Wuhan 430079, China
*
Author to whom correspondence should be addressed.
Remote Sens. 2017, 9(11), 1086; https://doi.org/10.3390/rs9111086
Submission received: 4 September 2017
/
Revised: 12 October 2017
/
Accepted: 21 October 2017
/
Published: 25 October 2017
Abstract
:Detailed studies on the spatiotemporal patterns of urban agglomeration in the Middle Yangtze River Basin (MYRB) are rare. This paper analyzed the spatiotemporal patterns of urbanization in the MYRB using multi-temporal remote sensing data circa 2000, 2008 and 2016 integrated with geographic information system (GIS) techniques and landscape analysis approaches. A multi-level analysis of the rate and intensity, type as well as the landscape changes of urban expansion at regional, prefectural and inner-city levels was performed. Results show that the MYRB experienced rapid urban expansion with an annual expansion rate of 3.199%, especially in the Chang-Zhu-Tan and Poyang Lake metropolitan areas. The small and medium cities presented faster urban expansion than the larger cities with annual growth rates three times the average level. Urban expansion within the three capital cities was further analyzed in detail. It is found that outlying expansion and edge-expansion were the dominant growth patterns at all the three levels. Although urbanization in the MYRB has a remarkable increase in the past sixteen years, its annual growth rate of urban land expansion has fallen behind the three other large urban agglomerations in China as a result. Finally, the spatial evolution of the socioeconomic structure of the MYRB was further explored. It indicated that urban land was distributed mainly along the “northwest-southeast” direction and that the economic spatial interactions among cities showed a pattern of “multi-polarization and fragmentation”, which illustrates the weak radiative driving forces of the central cities. The MYRB urban agglomeration faces a great challenge to manage trades-offs between narrowing the intra-regional disparity and maintaining synergetic development among cities.

1. Introduction
Urbanization has been an important social and economic phenomenon taking place at an unprecedented scale and rate all over the world [1]. In addition, it is forecast that approximately 4.9 billion people are expected to settle down in urban areas by 2030 and 6.3 billion by 2050 [2]. Meanwhile, urbanization and industrialization have become major factors affecting ecosystem services and environmental quality [3], especially within developing countries in Asia such as China and India [4]. As the most populous developing country in the world, China has witnessed a 46% increase in its urban population and a 78.5% increase in its urban land area over the past decade [5]. China issued its “New Urbanization Planning” strategy in 2014 to promote sustainable, human-oriented, and efficient urbanization [6]. In this context, timely and accurate information on urban areas and their changes have significant implications on studies of urban growth modeling and on the understanding of the causes and effects of urbanization in China among diverse processes such as urban planning, water and land resource management, and service allocation [7].
As reported in many previous studies, spatiotemporal urban land cover change is a serious concern both in megacities, such as Beijing [8,9], Shanghai [10,11,12], Hangzhou [13,14], and Guangzhou [15,16], and in developed coastal urban agglomerations, especially the three largest urban agglomerations, i.e., the Yangtze River Delta (YRD) [17,18], the Pearl River Delta (PRD) [19,20] and the Jing-Jin-Ji (JJJ) [21,22,23]. However, urban expansion in less developed cities and urban agglomerations has received little attention even though rapid urbanization has also occurred in these areas. Even so, such attention is mainly focused on some capital cities, such as Wuhan and Chengdu [24,25,26], and therefore, a broad-scale analysis of the peripheral regions as a whole is lacking. This is mainly due to the availability and quality of medium to high resolution images, as it is very difficult and time consuming to extract urban land of each city for every year.
Rather than investigating urban expansion across cities of different sizes at multiple scales, urban land change were conducted either at the national or regional scale as a whole, or at the single metropolitan or city level [27]. For example, at the national scale, Xu et al. [28] characterized the spatiotemporal dynamics of urbanization in 285 Chinese cities using time series of DMSP/OLS data from 1992 to 2009. Kuang [2] analyzed the patterns and drivers of the rapid urban expansion in China between 1990 and 2010 by taking China as a whole. Setting the study area as China, Huang et al. [29] carefully illustrated that the urban expansion in China from 2005 to 2008 was influenced by globalization, marketization and the process of decentralization. At the regional scale and city scale, numerous studies on the extent, pattern and driving forces of urban expansion were focused on individual or several metropolitan cities in China, especially the more developed cities in the east of China, such as Beijing, Shanghai, Tianjin, and Guangzhou [30,31,32,33]. Some urban remote sensing projects generated data and statistics based on jurisdictions, but failed to justify how to effectively link the data to pattern analysis of urbanization across multiple levels of jurisdiction.
To date, a number of earth observation satellites have been launched with varying degrees of resolution. For example, the Advanced Very High Resolution Radiometer (AVHRR) managed by the National Oceanic and Atmospheric Administration, possesses a coarse spatial resolution, while the Moderate Resolution Imaging Spectroradiometer (MODIS), Land Satellite (Landsat), and Advanced Space-borne Thermal Emission and Reflection Radiometer (ASTER) possess fine spatial resolutions. Specific advantages and disadvantages are associated with each type of them [34]. Due to the data volumes involved, the quality (i.e., season or cloud) as well as relatively low repeat times, the number of pre-collected medium spatial resolution images varies at different regions, thus provision of reliable and repeated urban information at regional to global scales remains a challenging task [35,36,37]. Compared with AVHRR data, MODIS data has an improved spectrum (0.4 μm–14.4 μm), spatial resolution (maximum 250 m), and data quality, and the MODIS sensor has seven bands that are designed for terrestrial systems. Thus, it attracts much attention in the mapping and monitoring of land use and land cover changes at the global or regional scale [38].
In 2015, the development strategy [39] for urban agglomeration in the Middle Yangtze River Basin (MYRB) was released, which is based on the development of the urban agglomeration in the MYRB, emphasizing cooperation among neighboring cities, and finally aiming to create a new growth pole for China’s economic development, a new urbanization zone for the central and western regions, and a leading area for the construction of the two-type society (the resource-saving and environment-friendly society). In this context, studying the urban expansion in the MYRB is necessary which will provide supportive information for better urban planning and development. This study aims to explore the trends and patterns of urban expansion in the MYRB urban agglomeration over past 16 years from the regional landscape to prefectural and inner-city levels using multi-temporal MODIS products and Landsat data integrated with GIS techniques and landscape ecology approaches. The specific objectives of this study comprise: (1) dynamically map the locations and extents of main urban area expansions; (2) analyze the similarities and differences of the general trends of urbanization, spatially explicit urban growth patterns, and spatiotemporal changes of landscape metrics; and (3) reveal spatiotemporal inequality of the socioeconomic development among the cities in the MYRB. Furthermore, the results of this study also offer a scientific decision-making platform for achieving the goals of macroeconomic regulation and control, town planning, land management for governmental eco-environmental protection and promoting healthy urbanization in the MYRB region.
2. Study Area and Datasets
2.1. Study Area
The MYRB urban agglomeration, located in the central part of the Yangtze River Economic Belt (YREB) (Figure 1), is the fourth largest urban agglomeration in China following the YRD, PRD and JJJ urban agglomerations and the second largest urban agglomeration in the YREB. It encompasses three city clusters, namely the Poyang Lake megalopolis (PLM) in Jiangxi Province, Wuhan megalopolis (WHM) in Hubei Province, and the Changsha–Zhuzhou–Xiangtan megalopolis (CZTM) in Hunan Province (Figure 1c). As the most important hub of Chinese transportation and the focal point of the economy, culture, education, and technology in central China, the study area consists of 31 cities of different sizes covering a total land area of 317,000 km2, with a population of 121 million, and a gross domestic product (GDP) of 980,552.38 million US$ in 2014, accounting for 3.3%, 8.8% and 8.8% of the whole country, respectively [39]. The region is rich in biodiversity with a total area of biodiversity reserves of 11,770 km2 [40], and the climate is humid continental and characterized by hot, humid summers and cold winters.
2.2. Datasets
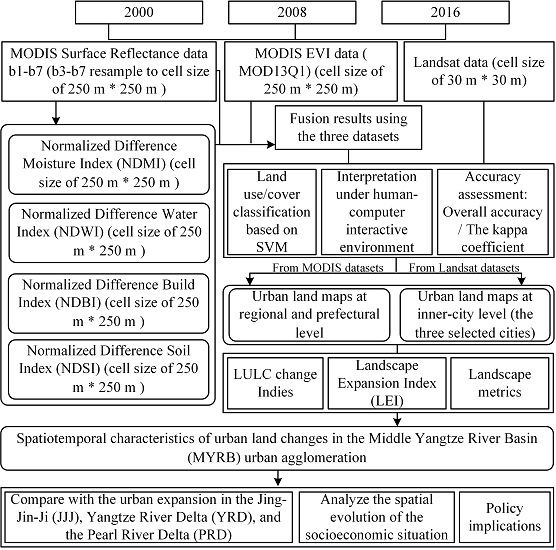
Numerous mapping efforts using medium-resolution data have been made in the literature [35,36,37,41]. In this study, two kinds of remote sensing datasets were used for this work to conduct analysis at different levels, including (1) Collection 5 MODIS 250 m surface reflectance and Enhanced Vegetation Index (EVI) products, 500 m surface reflectance products for 2000, 2008 and 2016 for analyzing urban land change at the regional and prefectural levels, (2) Landsat-based thematic maps depicting finer land cover as well as areas of change at the inner city level for 2000, 2008 and 2016 for the three capital cities, as shown in Table 1.
Bands 3–7 from MODIS 500 m 8-day surface reflectance product (MOD09A1), bands 1–2 from MODIS 250 m 8-day surface reflectance product (MOD09Q1) and 250 m MODIS Enhanced Vegetation Index (EVI) product (MOD3Q1) for 2000, 2008 and 2016 from the NASA website (https://www.nasa.gov/) were used. The MODIS EVI product is a high-quality dataset that is gap-filled and smoothed using an enhanced TIMESAT algorithm [42]. It is similar to the Normalized Difference Vegetation Index (NDVI), but less affected by atmosphere and can better reflect the canopy structure of vegetation [43,44]. To reduce the spectral variation brought by phonological effects [41], the surface reflectance products from the May–September growing season were used in our study [35]. As to the EVI products, after previewing the images of each DOI phase, four time periods representing the four seasons were chosen with little cloud cover (Table 1). The MODIS data are stored in a tile format and four tiles (i.e., h27v05, h27v06, h28v05, h28v06) are needed to cover the whole study area. Therefore, 72 scenes of images were used in this study. All MODIS datasets were resampled into a 250 m spatial resolution using the cubic convolution approach through the MRT. The Landsat TM/ETM+/OLI images with cloud covers of less than 10% obtained from the USGS website (http://www.usgs.gov/) were also used to conduct a further analysis on urban expansion at the inner-city level setting the three selected cities as examples. Only the six reflective bands with 30 m resolution were used for further data analysis while the thermal infrared band with a coarse spatial resolution of 120 m was excluded. The path/row numbers and acquisition dates of images used in this study are listed in Table 1. City and county boundary datasets were obtained from the Data Center for Resources and Environmental Sciences, Chinese Academy of Sciences (RESDC). Demographic and socioeconomic data from the Statistical Yearbooks of Hubei, Hunan, and Jiangxi Provinces in 2000, 2008 and 2016 were also used to provide summary statistics for cities within the study area.
2.3. Data Processing
The MODIS Reprojection Tool (MRT) [44] was employed to execute the automatic batch processing of reprojection (sinusoidal to UTM coordinates) and mosaicking of the MODIS images. The flash atmospheric correction and image georeferenced mosaicking for Landsat datasets and band combination for both Landsat and MODIS datasets were then accomplished using professional image processing software Environment for Visualizing Images (ENVI) 5.1. Finally, the Landsat and MODIS images were all clipped using the vector boundaries. Normalized indices show a much higher classification accuracy compared with original un-transformed spectral data. Such indices can effectively detect changes from early spring growth to late season maturity and senescence [45]. For a more accurate classification [38] at the regional level, four indices images, e.g., the Normalized Difference Soil Index (NDSI) [46], Normalized Difference Moisture Index (NDMI) [47], Normalized Difference Water Index (NDWI) [43] and Normalized Difference Built-up Index (NDBI) [48], were also combined with the MODIS surface reflectance bands as additional spectral bands using the layer stacking tool of ENVI. Because changes to administrative boundaries can influence the calculation of urban population, we applied the city boundaries in 2015 to both datasets to ensure comparable urban areas.
Six broad land cover types (i.e., urban land, cropland, forest, grass, water body and unused land) were classified based on these images using the SVM classifier via a radial basis function kernel [49]. A stratified random sampling strategy was used to select sample points for all the images by visual interpretation. A total of 8224 pixels, which represent water (2631), urban (921), forest (2313), grass (687), crop (1628) and unused (44), were selected from the MODIS composite image with reference to all the Landsat images for each year. The Google Earth [50] was used as reference data for selecting training and validation samples for the Landsat dataset. In all, 2800 pixels were selected and they represent water (553), urban (750), forest (963), grass (50), crop (440) and unused (44) for Wuhan. 2898 pixels were selected and they represent water (553), urban (715), forest (1047), grass (79), crop (440) and unused (64) for Changsha. 2262 pixels were selected and they represent water (400), urban (578), forest (723), grass (56), crop (440) and unused (65) for Nanchang. All the samples were randomly divided into two parts, with 70% as training samples and 30% for validating the results. Points were generally located near the center of fields or away from edge areas to avoid mixed pixels, however, just as [51] pointed that some mixing is likely inevitable considering the relatively coarse spatial resolution of the datasets. After the land-use classification was completed, the output images were further converted into two land categories (urban and nonurban) because the focus of this study is the spatiotemporal dynamics of urban land.
Accuracies of the classified products were measured by their overall accuracy (OA), kappa coefficient (KC), commission error (CE) and omission error (OE). They were calculated from the confusion matrix based the remained 30% samples. All these accuracy assessments were done in the ENVI system, which provides a very good tool to deal with post-classification [52]. Results showed that the KCs were more than 0.80 for most of the images (Table 2), which meets the accuracy requirements for land cover change evaluation [53].
3. Methods
Figure 2 shows the methodology for data processing and analyses. Based on the collected datasets, gridded maps were developed to show the spatial intensity of urban land expansions at 250 m resolution across the MYRB and 30 m for the three capital cities in each of the time period. Spatiotemporal patterns and landscape change of urban land during 2000–2016 were then analyzed. We further compared the urban expansion of the MYRB with that of the other three national level urban agglomerations and further investigated the socioeconomic spatial evolution in the MYRB. The related policy implications considering the urban planning were finally discussed.
3.1. Qualitative Analysis of Urban Expansion
The characteristics of urban expansion (e.g., speed, extent, intensity, and direction) vary from region to region [54]. Four indicators, namely, the AI, AGR, Rs and Is, were adopted to evaluate the spatiotemporal dynamics of urban expansion in this paper. The AI and AGR can denote the magnitude and speed of urban expansion in recent years. The Rs and Is can be used to represent changes in the amount of urban area per unit time compared with the original urban area and the total land area. Thus, these indices can quantify the urban expansion during the study period. They are defined as follows [10,22]:
where AI (km2 per year), AGR (%) are the annual area change and annual change rate of urban land, respectively. Rs (%) is the urban expansion rate, Is (%) is the urban expansion intensity, d is the time span, Ua and Ub are the urban area at the start and end year, respectively, and TUa is the total land area in year a. These indices can be used to understand the characteristics of urban expansion between years.
3.2. Urban Expansion Pattern
Urban growth was divided by Forman (1995) into three types: infilling, edge-expansion and outlying. The landscape expansion index (LEI) was calculated to define these three urban growth types using the following equation according to Liu et al. [55]:
where LEI represents the landscape expansion index of a newly growth patch, Ao is the intersection between the buffer zone and the occupied category, and is the intersection between the buffer zone and the vacant category. According to this definition, the value of the LEI ranges from 0 to 100. The urban expansion type is defined as infilling, edge-expansion and outlying when LEI > 50, 0 < LEI ≤ 50, or LEI = 0, respectively.
3.3. Landscape Metrics
For the objectives of this study, and to avoid influences of different scales and extents of the datasets, land expansion was characterized by five prominent spatial metrics chosen based on spatial and complexity criteria. The metrics include the patch density (PD), largest patch index (LPI), aggregation index (AI), percentage of landscape (PLAND), and landscape shape index (LSI) (Table 3). These metrics were computed for each of the selected regions and cities, at the class level with the help of FRAGSTATS 4.2 with the eight-neighbor rule [56].
3.4. Across-Scale Land-Cover Data Generation
Because the spatiotemporal dynamics of urban expansion appear to be significantly different at different scales [57,58], we explored them from 2000 to 2016 at regional, prefectural and inner-city levels. Specifically, at the prefectural-city level, the 31 cities were categorized as super, mega, large, medium and small according to the newly criteria proposed by China central government [59] (Table 4). Then, the extents of urban expansion for these five groups were calculated for the period 2000–2016.
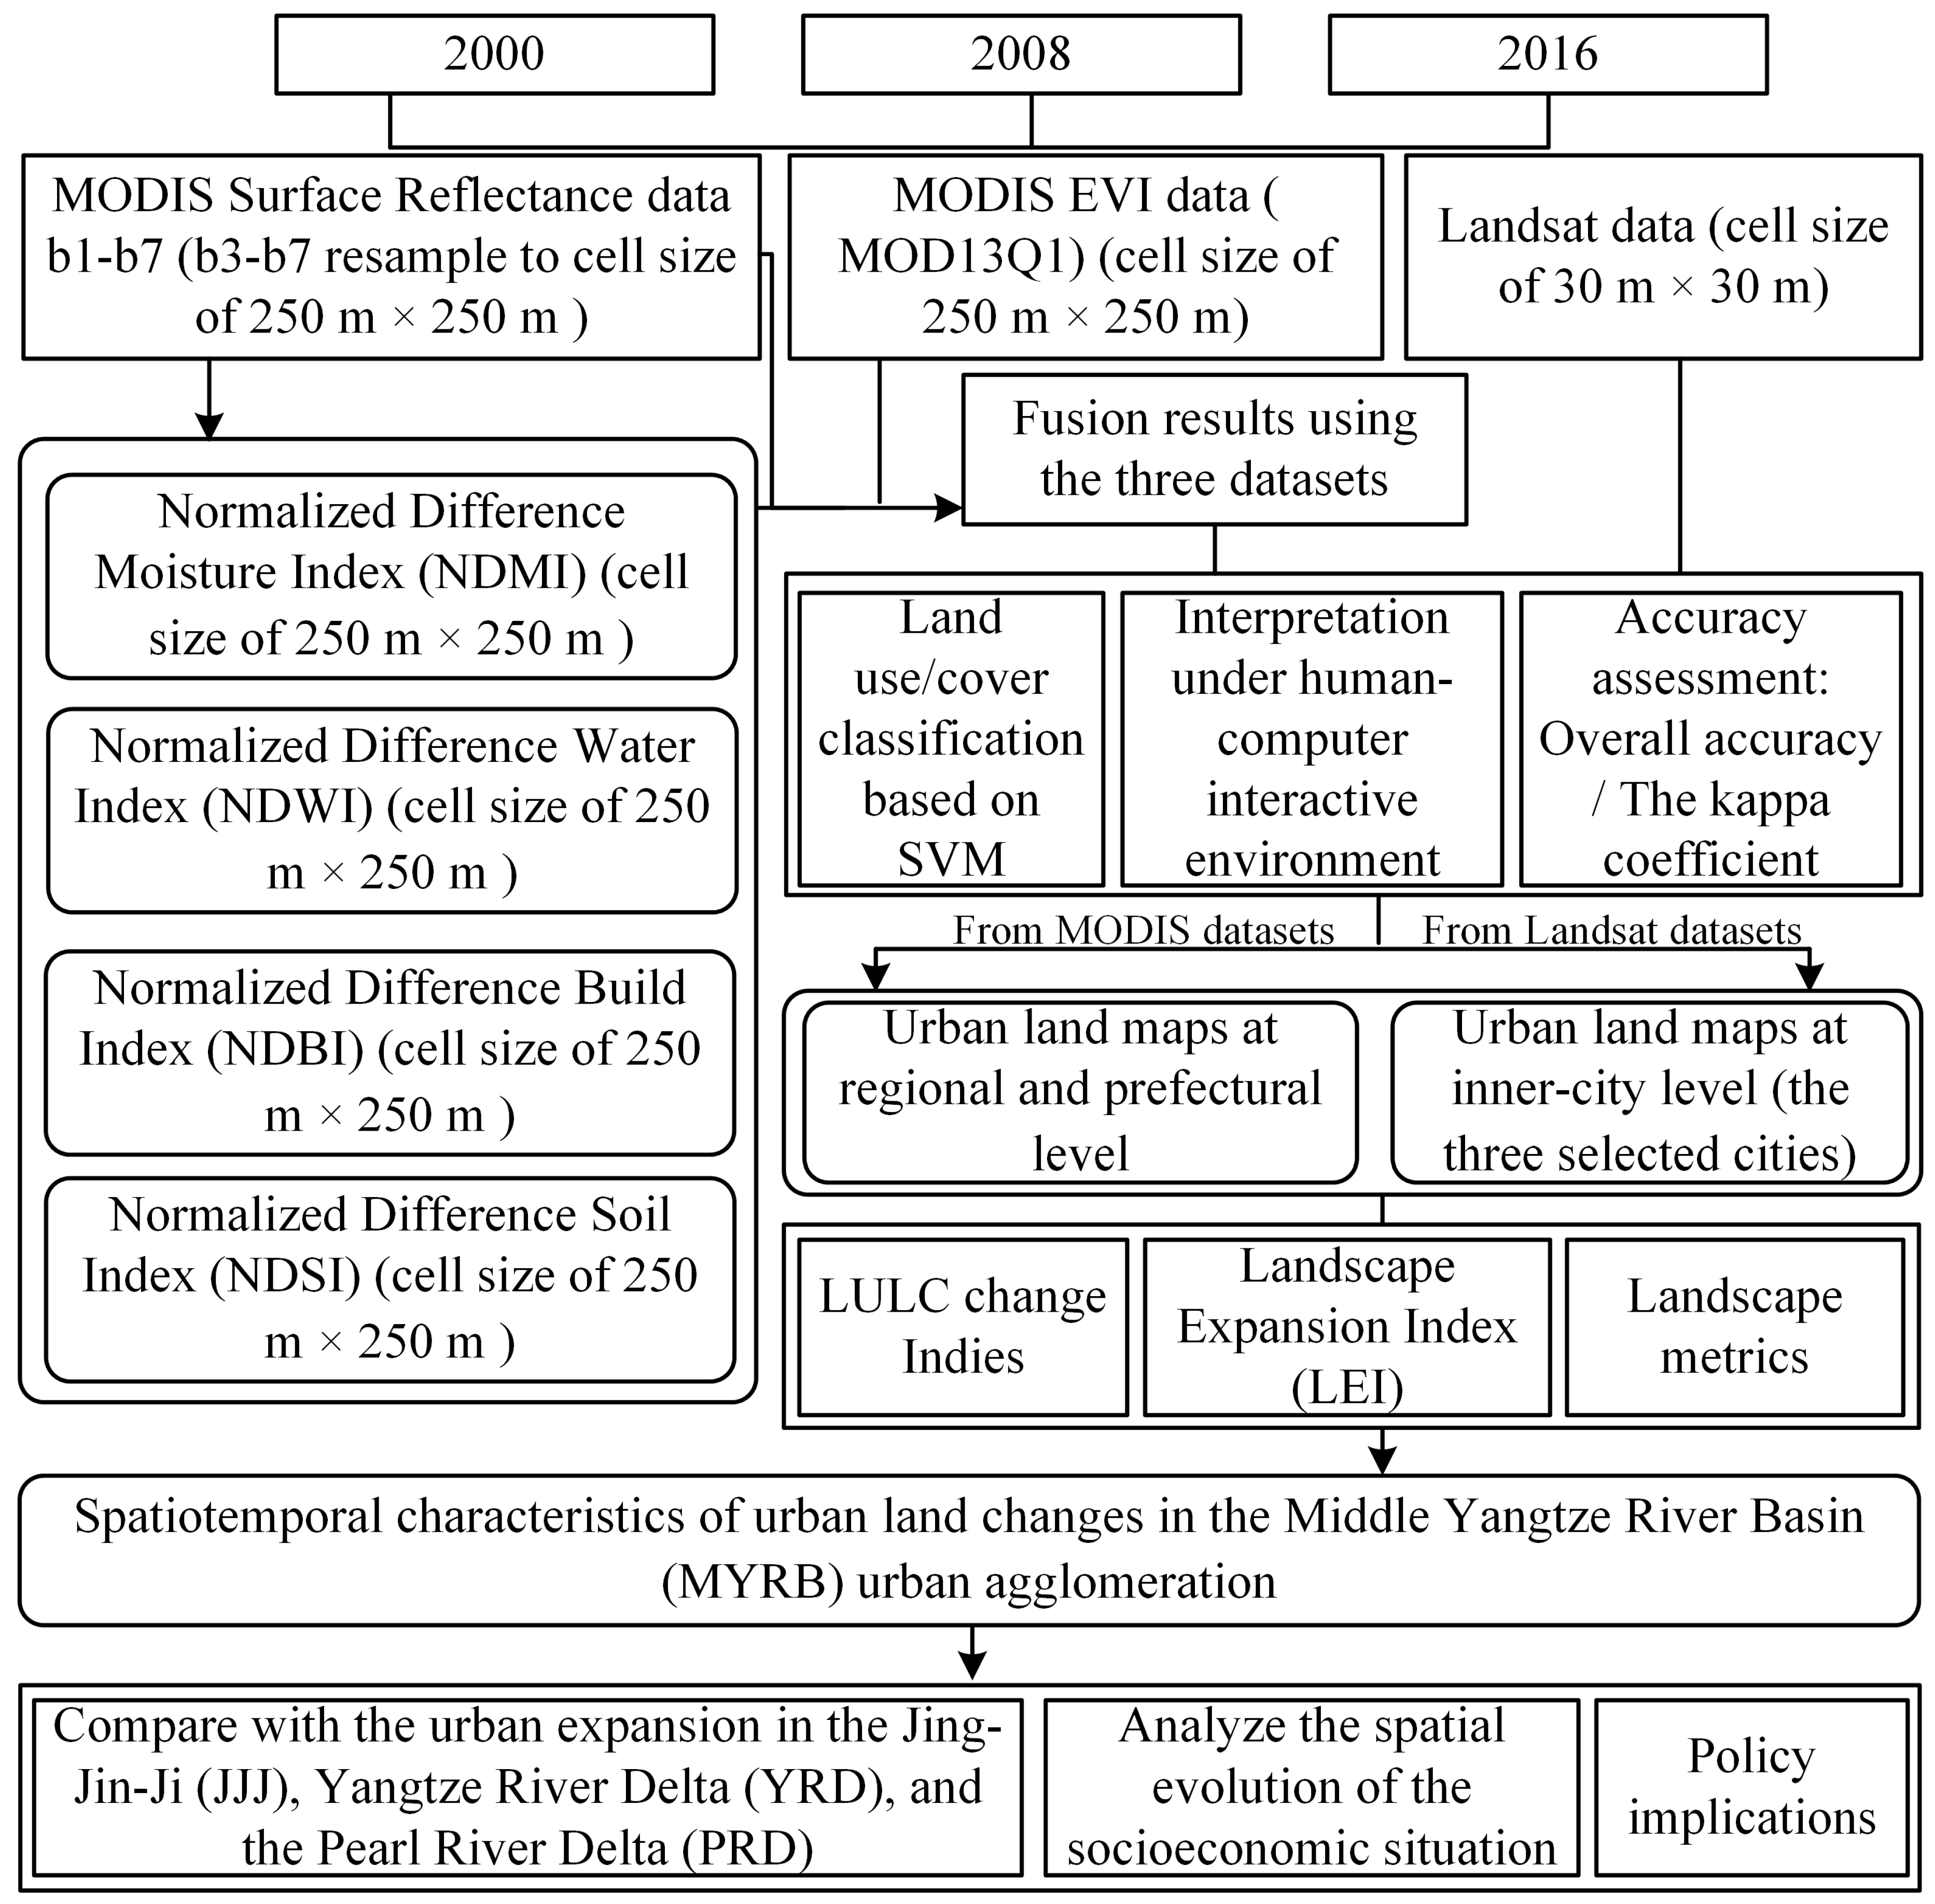
To examine the detailed spatial patterns of landscape changes, we further analyzed the urban land changes at the inner-city level of three hotspot cities: Wuhan, Changsha and Nanchang. Using administrative boundaries as the spatial extent of a city is unsuitable because they are changeable, include areas that are too large or too small and are not comparable across cities [59,60]. Concentric buffer structure is a common method used to analyze phenomena changes, such as population and land use, across an area [32]. Based on this theory, a series of buffer rings with consecutive distances of 2 km were generated within a radius of 30 km from the city center. North-south and East-west transects cutting across the city center were later used to divide each city into four sectors: northeast (NE), southeast (SE), southwest (SW) and northwest (NW) (Figure 3). The area of urban land in each sector was then calculated to reflect the spatial heterogeneity of urban expansion.
4. Results
4.1. Urban Land Dynamic Change at the Regional Level
4.1.1. Urban Land Change in the MYRB Was Mainly Occupied by Outlying and Edge-Expansion
The MYRB urban agglomeration has witnessed rapid urban expansion from 2000 to 2016 (Figure 4). Urban land cover increased over the past 16 years from 3523.50 km2 to 5326.75 km2 with an average annual growth rate of 2.62%. In addition, edge-expansion was the primary mode of urban expansion in the MYRB urban agglomeration during the study period (Figure 5). Specifically, the expansion of urban land through this pattern was 2659.31 km2, which accounted for 60.82% of the total expanded urban land during 2000–2008. In addition, it increased to 2750.75 km2 during 2008–2016. However, the expansions of urban land resulted from the outlying and infilling modes were relatively less, accounting for 34.75% and 4.43%, respectively, in the first period, and 45.73% and 2.24%, respectively, in the second period.
On the metropolitan level, the urban land was mainly distributed in Wuhan, Chang-Zhu-Tan and Poyang Lake metropolitan areas (63.97% in 2016) as a result of the higher levels of economic development in those areas (Figure 4). The WHM, which occupies 17.92% of the MYRB land area, accounted for 22.43% (411.27 km2) of the regional expansion of urban land from 2000 to 2016. Moreover, the expansion of urban land was faster during 2008–2016 (2.21%) than that in the first period (1.82%) as a result of rapid social and economic development. It can also be seen that the WHM experienced urban land expansion in almost every direction, presenting a polynuclear urbanization pattern. Edge-expansion, which accounted for 68.14% of the total area of expanded land in the WHM, was the dominant urban growth mode in WHM over the past sixteen years (Figure 6).
For the CZTM, which takes up 8.47% of the total MYRB land area, experienced an urban expansion of 405.25 km2 from 2000 to 2016, with an average annual growth rate of 4.23%. The expansion rate of urban land during 2000–2008 (8.17%) was higher than that during 2008–2016 (2.60%), which is in contrast to that of WHM, due to the influence of both policy and socioeconomic factors. Outlying expansion was the dominant urban growth pattern in this area, accounting for 2858.56 km2 or 53.73% of the total expansion of urban land in the CZTM. It can also be seen that the CZTM experienced its urban land expansion mainly around its main urban center in contrast to the WHM.
As to the PLM, accounting for 17.62% of the total area of the MYRB, experienced an expansion of urban land of 450.99 km2 during 2000–2016 with an average annual growth rate of 3.87%. It also demonstrated faster urban expansion in the second period (5.24%) than in the first period (3.53%), which is the same as that of the WHM. The dominant urban growth mode was outlying expansion during the past 16 years, which accounted for 699.31 km2 or 70.48% of the total expansion of urban land in the PLM. Specifically, during 2000–2008, the main urban expansion mode was edge-expansion, accounting for 68.21% of the total expanded urban land, and it transformed into outlying expansion, which accounted for 87.81% of the total urban land expansion in the second period.
4.1.2. Urban Landscape Became More Aggregated in the Whole MYRB from 2000 to 2016
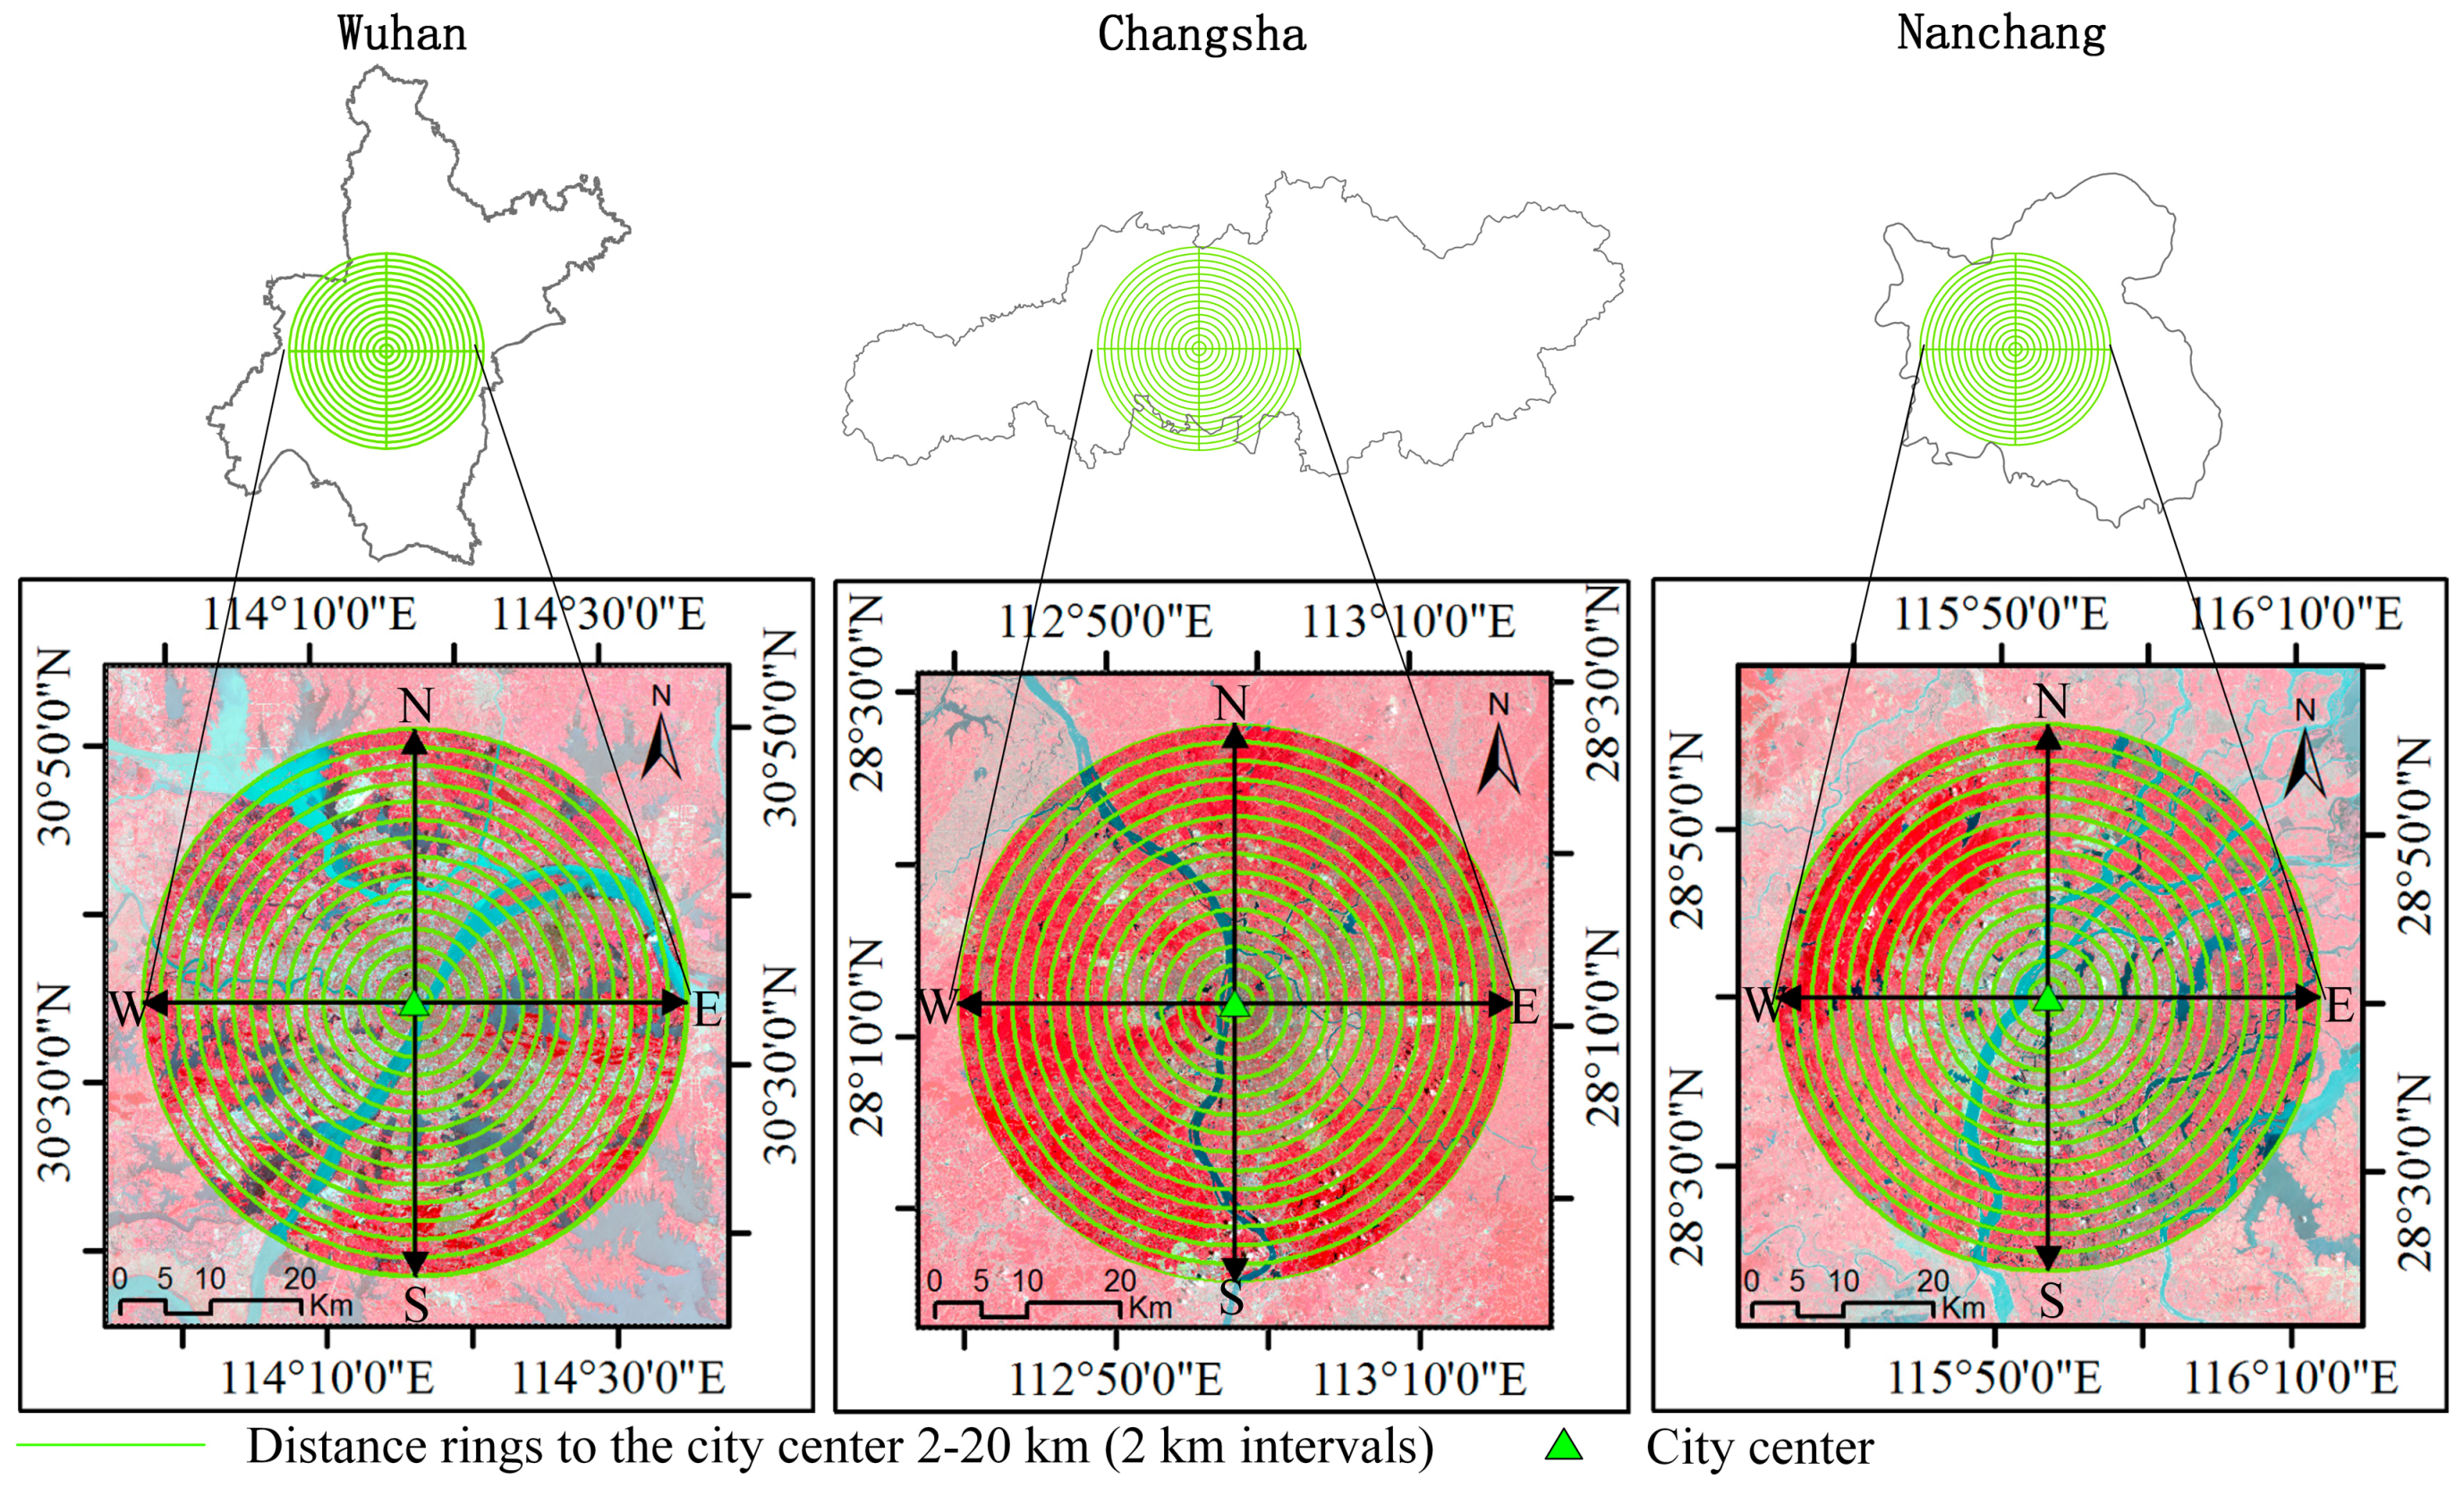
Figure 6 demonstrates the features and trends of urban landscape changes in the MYRB and the three metropolitan areas from 2000 to 2016. As urbanization progressed, the PLAND showed a monotonically increasing trajectory for the MYRB urban agglomeration with a much steeper trend for the CZTM than those for the WHM and PYLM (Figure 6a). The PLAND increased from 1.08% in 2000 to 1.34% in 2008 and 1.63% in 2016 over the whole MYRB, while it increased from 2.02 to 2.72% for the WHM, 1.54 to 2.98% for CZTM, and 0.93 to 1.70% for the PYLM. The PD and LSI fluctuated during the period from 2000 to 2016. Specifically, they decreased during 2000–2008 and then increased in the following period throughout the whole MYRB as well as in the WHM and PYLM, indicating that urban land in these areas experienced dispersed growth before 2008 and then shown a compact expansion. In contrast, the fragmentation and complexity of landscape in CZTM increased first and then decreased as indicated by the shapes of the broken lines of PD and LSI in Figure 6b,d. The LPI of urban land demonstrated different patterns in the MYRB and the three metropolises. For the MYRB, the urban land remained relatively stable in the past 16 years. However, it demonstrated a monotonic increase with a much steeper trend for the CZTM than that of the PYLM, indicating the agglomeration of built-up areas into larger, more densely built-up patches [21]. In terms of the WHM, the urban land became aggregated from 2000 to 2008 and then fragmented during 2008–2016 as seen from Figure 6c,e. A rise in the AI can be observed both throughout the whole MYRB and the three metropolises during 2000–2008 (Figure 6e). Meanwhile, the PYLM witnessed a decrease in the AI during 2008–2016 in contrast to the whole MYRB and the other two metropolises. Therefore, the urban form became more clumped or aggregated.
4.2. Urban Land Dynamic Change at the Prefectural Level
4.2.1. Medium-Small Cities Witnessed Faster Urban Expansion than Larger Cities
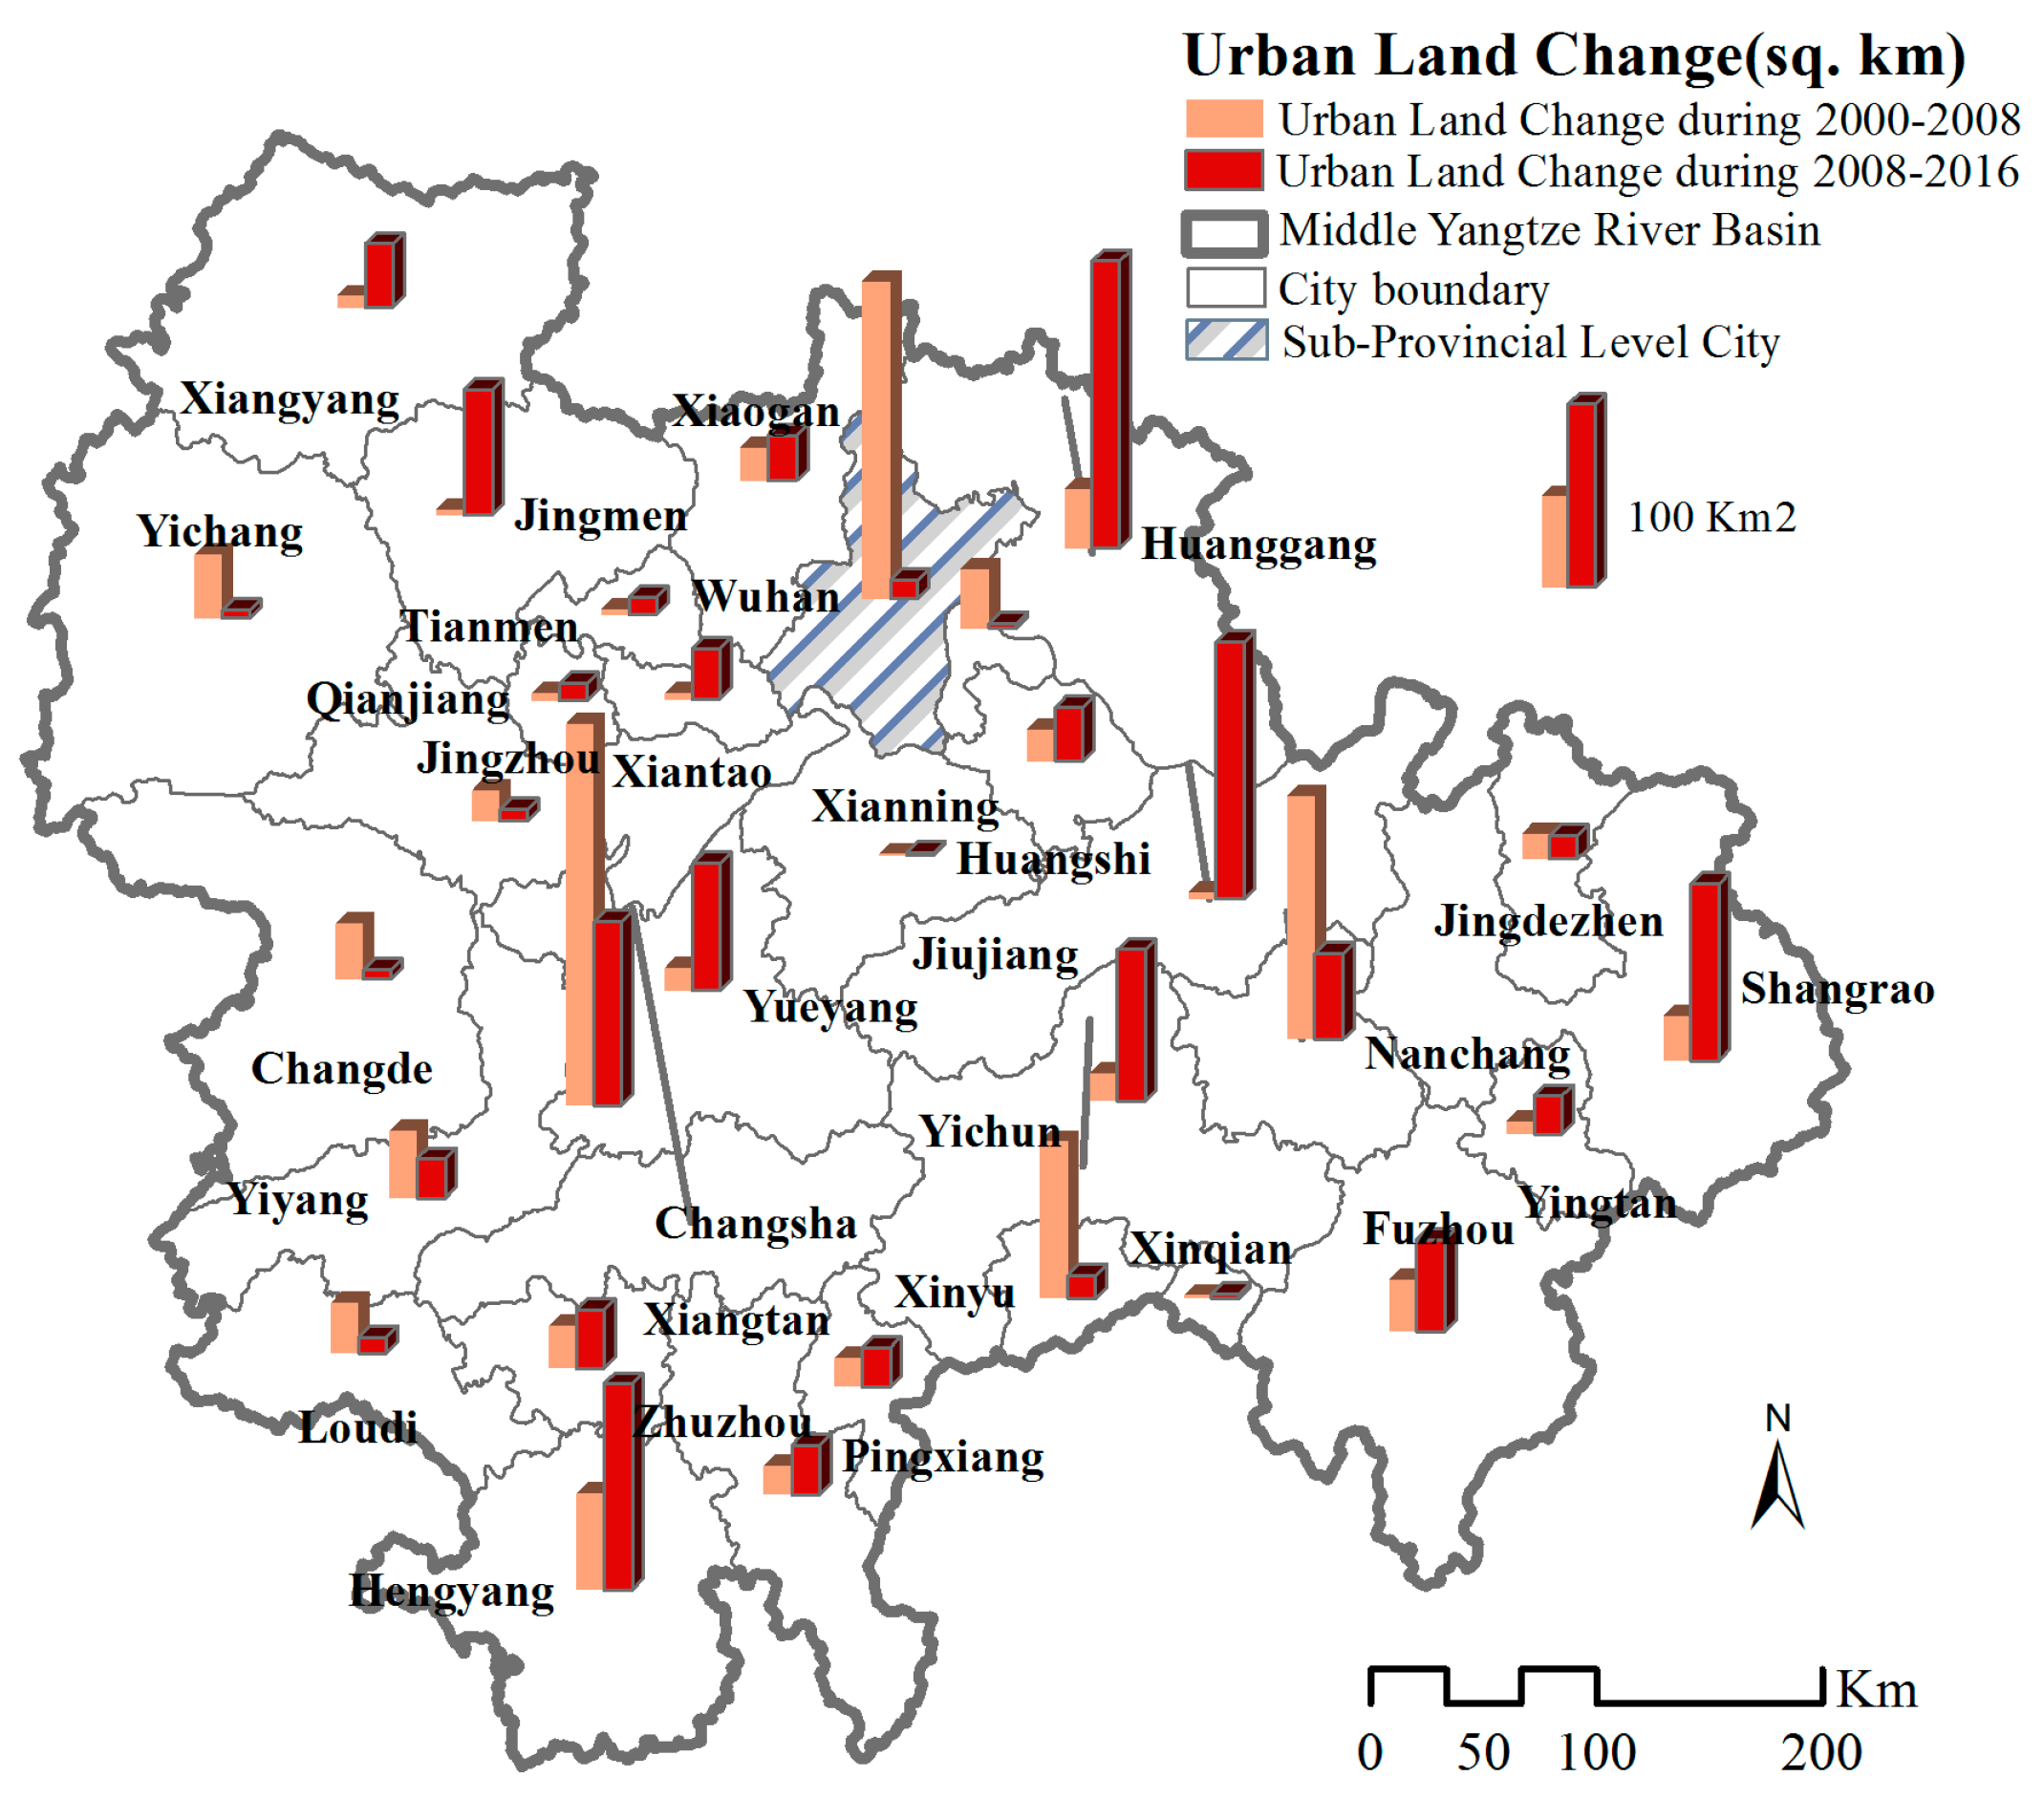
Figure 7 shows the distribution of urban land change of the 31 cities in the MYRB from 2000 to 2016. Based on the results, we observe that almost all the prefectural level cities witnessed urban expansion in the study period. In addition, the increase of urban land in the three capital cities during the period of 2000–2008 was much higher than that in the period of 2008–2016. Moreover, the urban land among the three capital cities exhibited a total increase of 670.68 km2 from 2000 to 2016, accounting for 36.58% of the total urban land expansion at the whole urban agglomeration level. However, the neighboring cities presented smaller areas of urban expansion compared to those of the capital cities, indicating that urban land expansion differs across space and administrative rank [61] and that the development and expansion of urban land are highly related to economic development [2,32,54].
There was also a clear disparity in terms of the urban expansion when cities of different sizes were compared (Table 5). On the 16-year scale, sharp increases in the expansion of urban land occurred during the period 2000–2016. The megacities experienced much greater urban expansion (from 1202.64 km2 to 1724.86 km2) than those in the other four categories. Meanwhile, the small and medium cities witnessed faster urban expansion than the other cities. Between 2000 and 2016, the urban expansion rates within small and medium cities were 7.51% and 4.77%, respectively, or 1.96 and 1.25 times the average of the five groups of cities. On a small scale of 8 years, urban land expansion among the five groups of cities showed different variations. The expansion rates of urban land reached its peak in 2000–2008 and decreased during the period 2008–2016 in both the super-cities and the megacities. However, the other three categories of cities showed continuous increase.
4.2.2. Different Urban Landscape Characteristics Exist among Cities in the MYRB
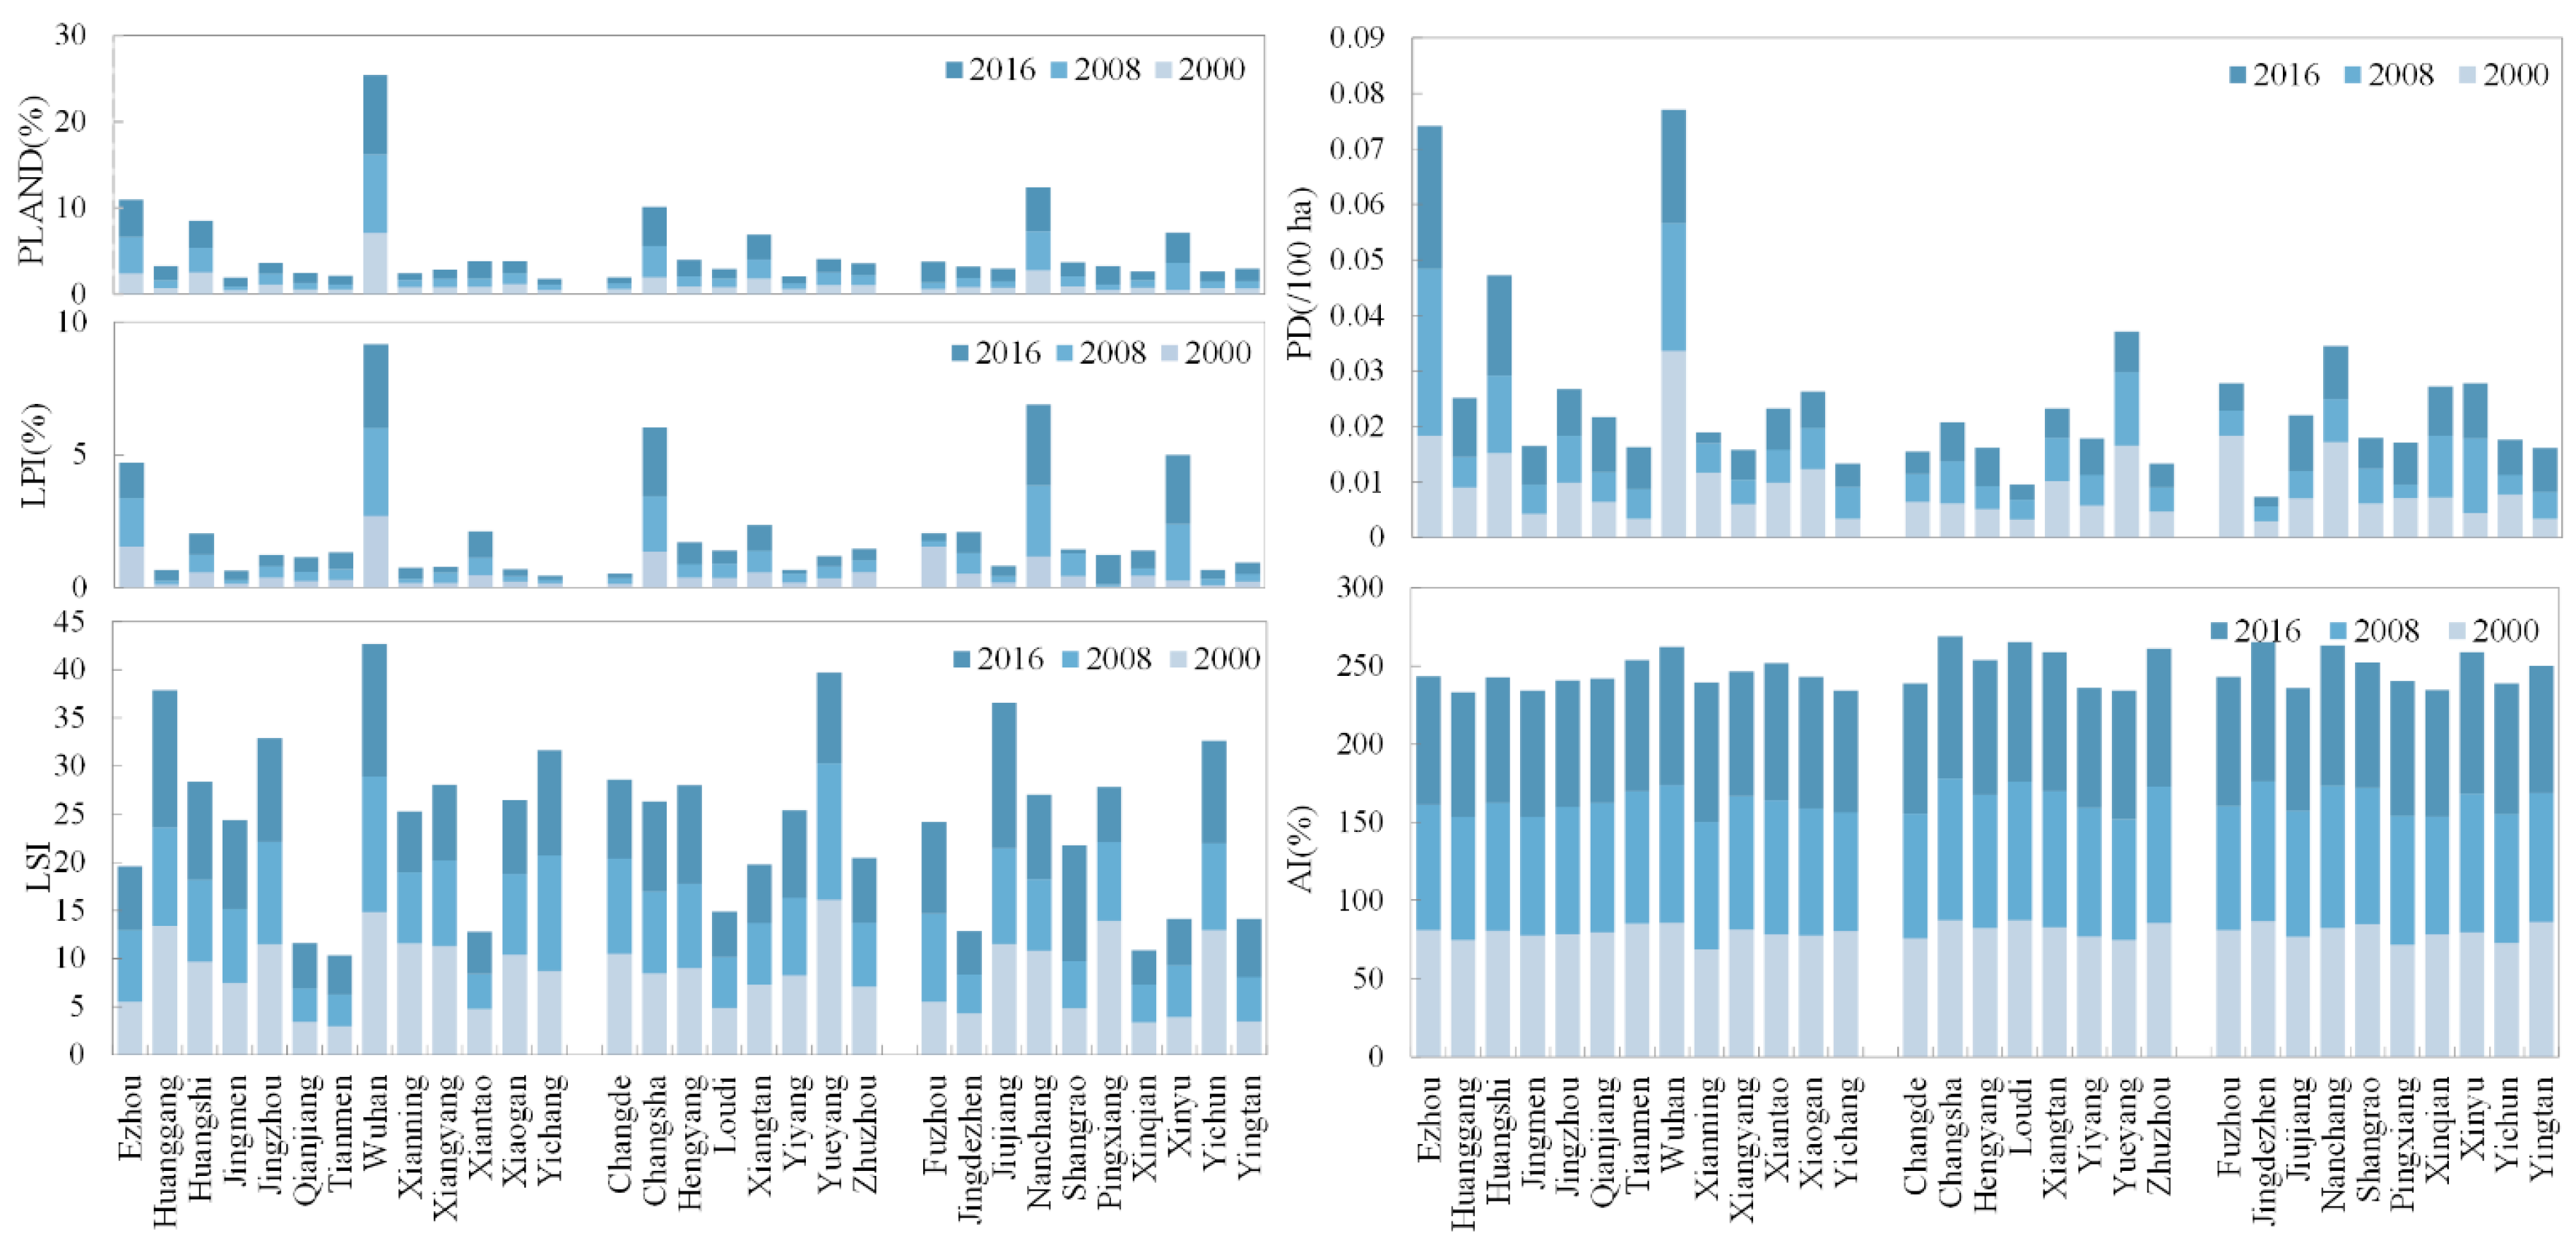
Figure 8 demonstrates the calculated landscape metrics for the 31 cities. During 2000–2016, it is obvious that urban land showed a continuous increase. Specifically, the cities of Wuhan in the WHM, Changsha in the CZTM, and Nanchang in the PYLM showed significant urban increases in the PLAND and LPI, indicating that the focus of development is still on more developed cities. For shape-related metrics, the LSI seemed to exhibit random behavior across the MYRB, meaning that urban settlements in different areas showed different growth patterns, such as infilling, edge-expansion or outlying. This changing trend is not in accordance with the trend at the regional level, indicating that it is necessary to analyze urban expansion at different administrative levels. The AI increased in most of the cities during both periods. This is an indicator that the urban form became more aggregated. The PD seemed to show a reversing trend in contrast to the AI. It decreased in most cities during 2000–2016 or increased first and then decreased. This trend is in consistent with the trend of the whole MYRB, but there were some distinct features for different cities.
The spatial indicators can reveal interesting conclusions about urban expansion, but their numbers often produce fuzzy and troubled explanations. Although it is difficult to find the most appropriate spatial indicators to properly describe urban expansion, we can understand the importance of these spatial indicators by indicating the sign of their differences. In other words, the key point is to focus on the increase or the decrease in the spatial indicators during the two time periods examined.
4.3. Urban Land Dynamic Change at the Inner-City Level
4.3.1. Outlying and Edge-Expansion Dominated the Spatial Pattern of Urban Land in the Three Capital Cities
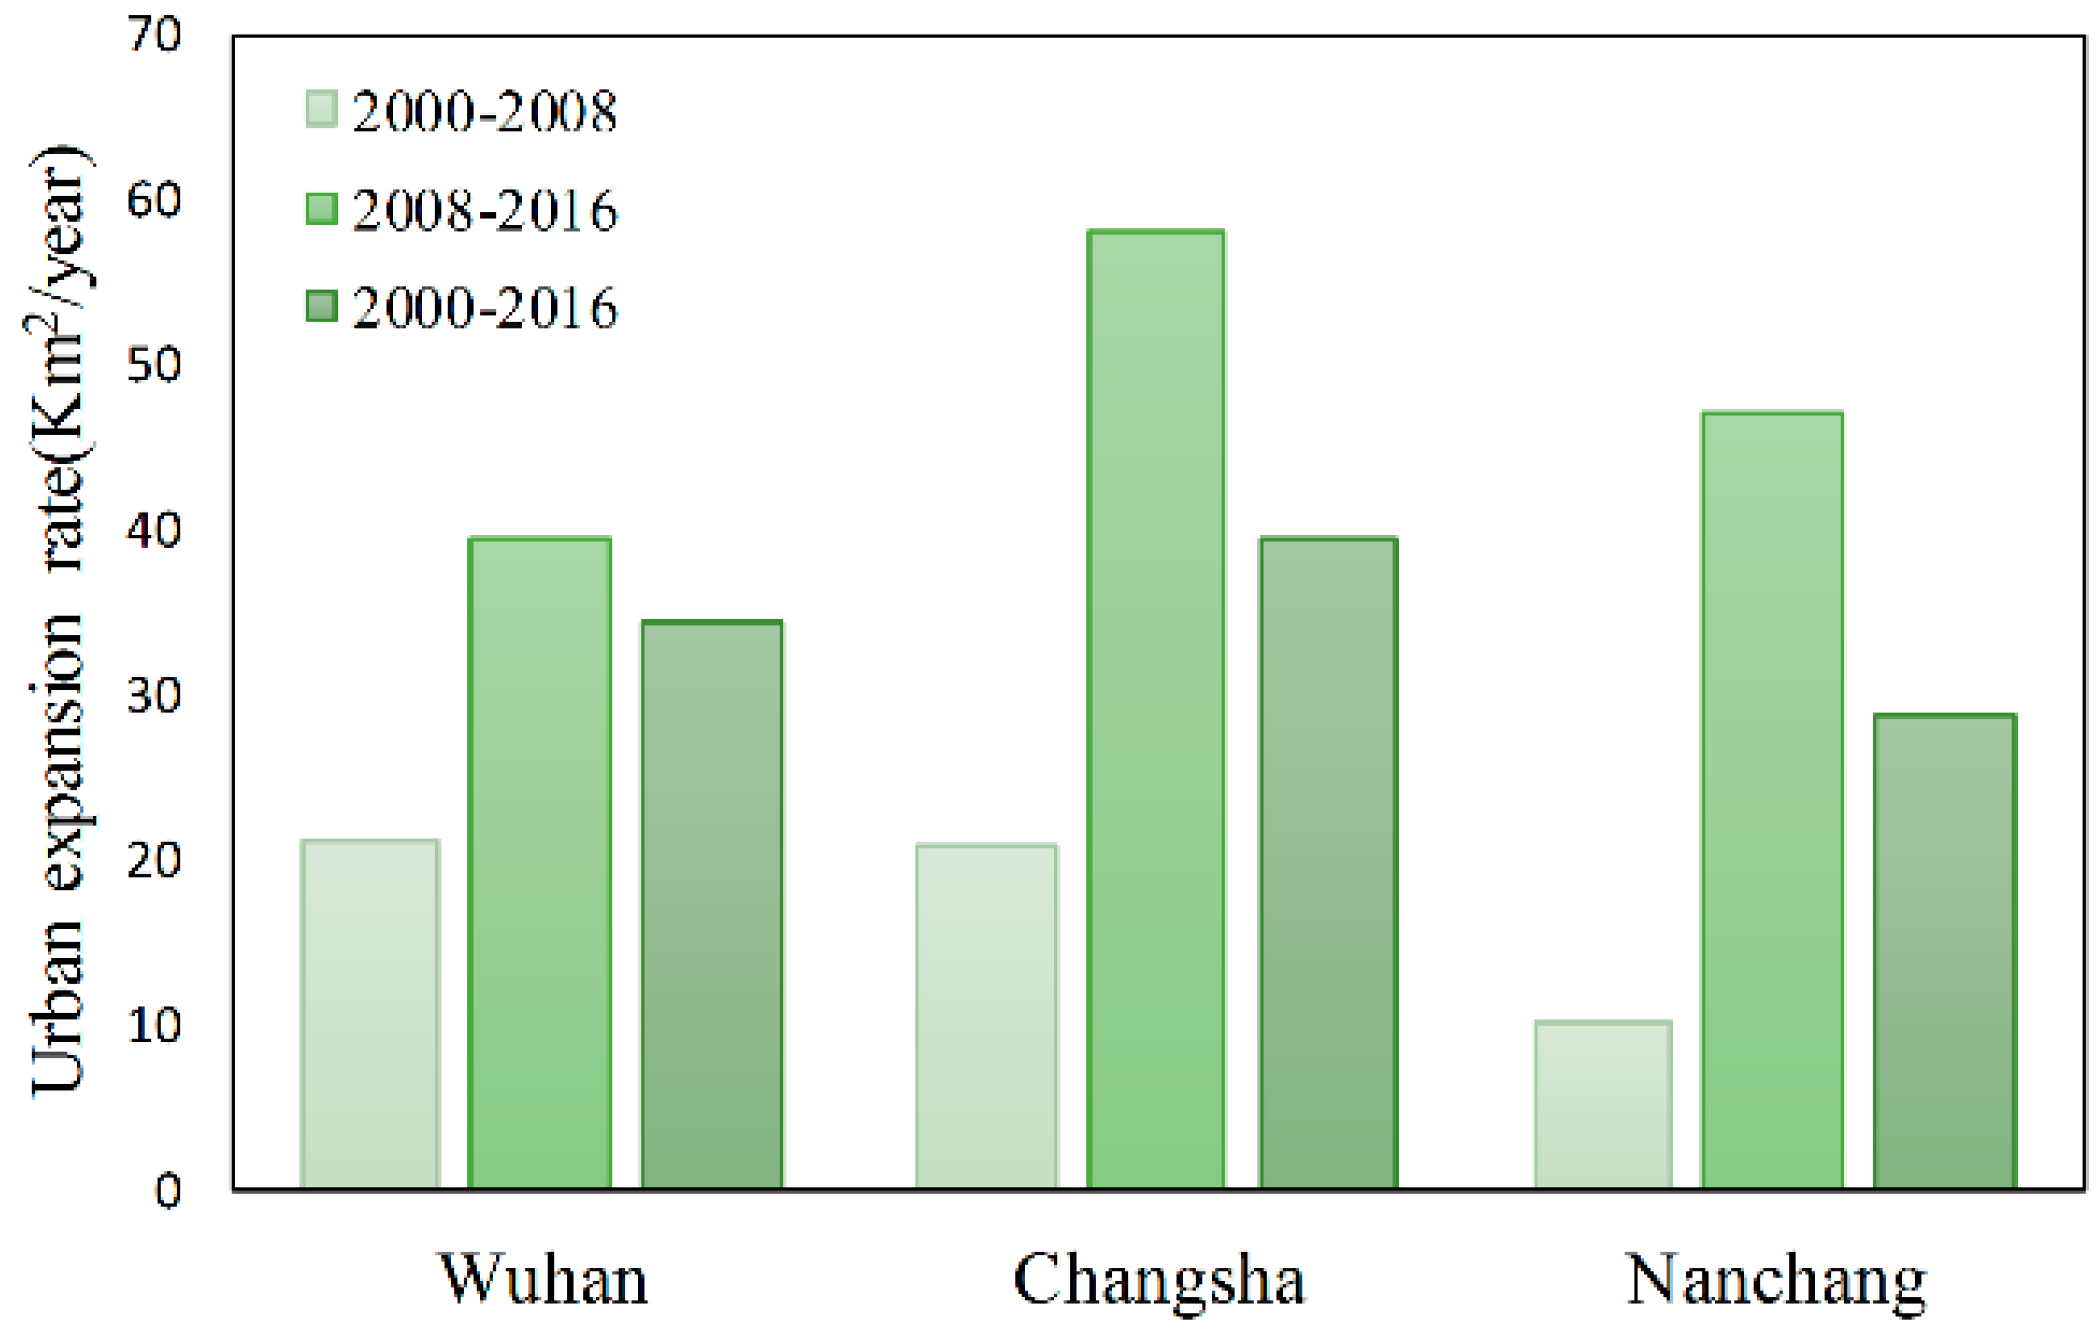
The three capital cities were finally selected to further study urban expansion within the inner cities. From the annual expansion rates of urban areas (Figure 9), each city had a very high growth rate (34.41% km2/year, 39.49 km2/year and 28.68 km2/year for Wuhan, Changsha and Nanchang, respectively) through the whole study period. In the two time periods, the annual expansion rates of urban area depicted continuous increases in the three cities. Meanwhile, each city indicated different urban expansion rates, which ranged from 10.14 km2/year to 58.13 km2/year. The most remarkable growth occurred in the urban areas of Changsha from 2008–2016, which was 58.13 km2/year. In contrast, Nanchang showed the lowest annual urban expansion rate at only 10.14 km2/year from 2000–2008. Wuhan illustrated the highest annual urban expansion rate during 2000–2008 but the lowest in 2008–2016. As capital cities and most developed cities involving rapid urbanization, Wuhan, Changsha, and Nanchang are representatives of the MYRB that are undergoing fast economic development.
Figure 10 illustrates the spatial distributions of the three urban growth types in each city during the two neighboring periods over the past 16 years. It is observed that the three cities were dominated by edge-expansion and outlying expansion throughout the study period. Meanwhile, urban expansion among the different cities shows different patterns during different periods. In Wuhan, edge-expansion, as the primary growth type, mainly occurred around the city center during 2000–2008. In 2008–2016, the outlying expansion sharply increased and distributed sparsely around peripheral areas, while infilling growth filled the gaps between them and had relatively smaller variations. For Changsha, outlying expansion was more extensive, taking up almost the entire expanded area during 2000–2008, while edge-expansion appeared mainly around the original urban area in all directions during 2008–2016. Infilling growth was little in Changsha during the past 16 years. For Nanchang, urban expansion occurred mostly to the south of the Yangtze River and to the south of the city during 2000–2008 to form new growth points. Edge-expansion was mainly distributed around the urban core with a southward-moving tendency from 2008 to 2016. In general, the spatial distribution of urban patches mainly expanded along the Yangtze River as well as outwards away from the original urban area. Relative to edge-expansion and outlying growth types, the infilling growth of the three cities was less obvious during the study periods.
Both the numerical and area proportions of urban patches of the three urban growth types during the two neighboring periods for each of the three cities are also presented in Figure 10. It is shown that a difference exists between the changes in the numerical proportion and the area proportion. Although the outlying numerical proportion occupied the majority of the expanded patches, the corresponding area proportion encompassed more of the overall expanded area in some cities. It can also be observed that the three cities exhibited differences in the compositions of urban growth types. Regarding the number of patches, outlying expansion was always the primary type for the three cities, especially for Changsha, and had an increase in the second period except for Wuhan, which showed a slight increase from infilling expansion. This suggests that the urban expansion of the three cities spatially reached areas far away from their existing urban coverage. With respect to the area proportion, outlying expansion was the dominant type for Changsha during 2000–2008, the trend for which reversed in 2008–2016. Edge-expansion contributed the largest urban area for Wuhan and Nanchang in the period 2000–2008 and showed a decrease for both cities, wherein Wuhan demonstrated a little increase from infilling growth. It should be noted that infilling accounted for relatively little in both of the proportions, indicating that all of the three cities are still in a state of the enlargement of the urban size instead of an optimized design.
4.3.2. The Existing Urban Land near the City Center Became Less Fragmented over Time
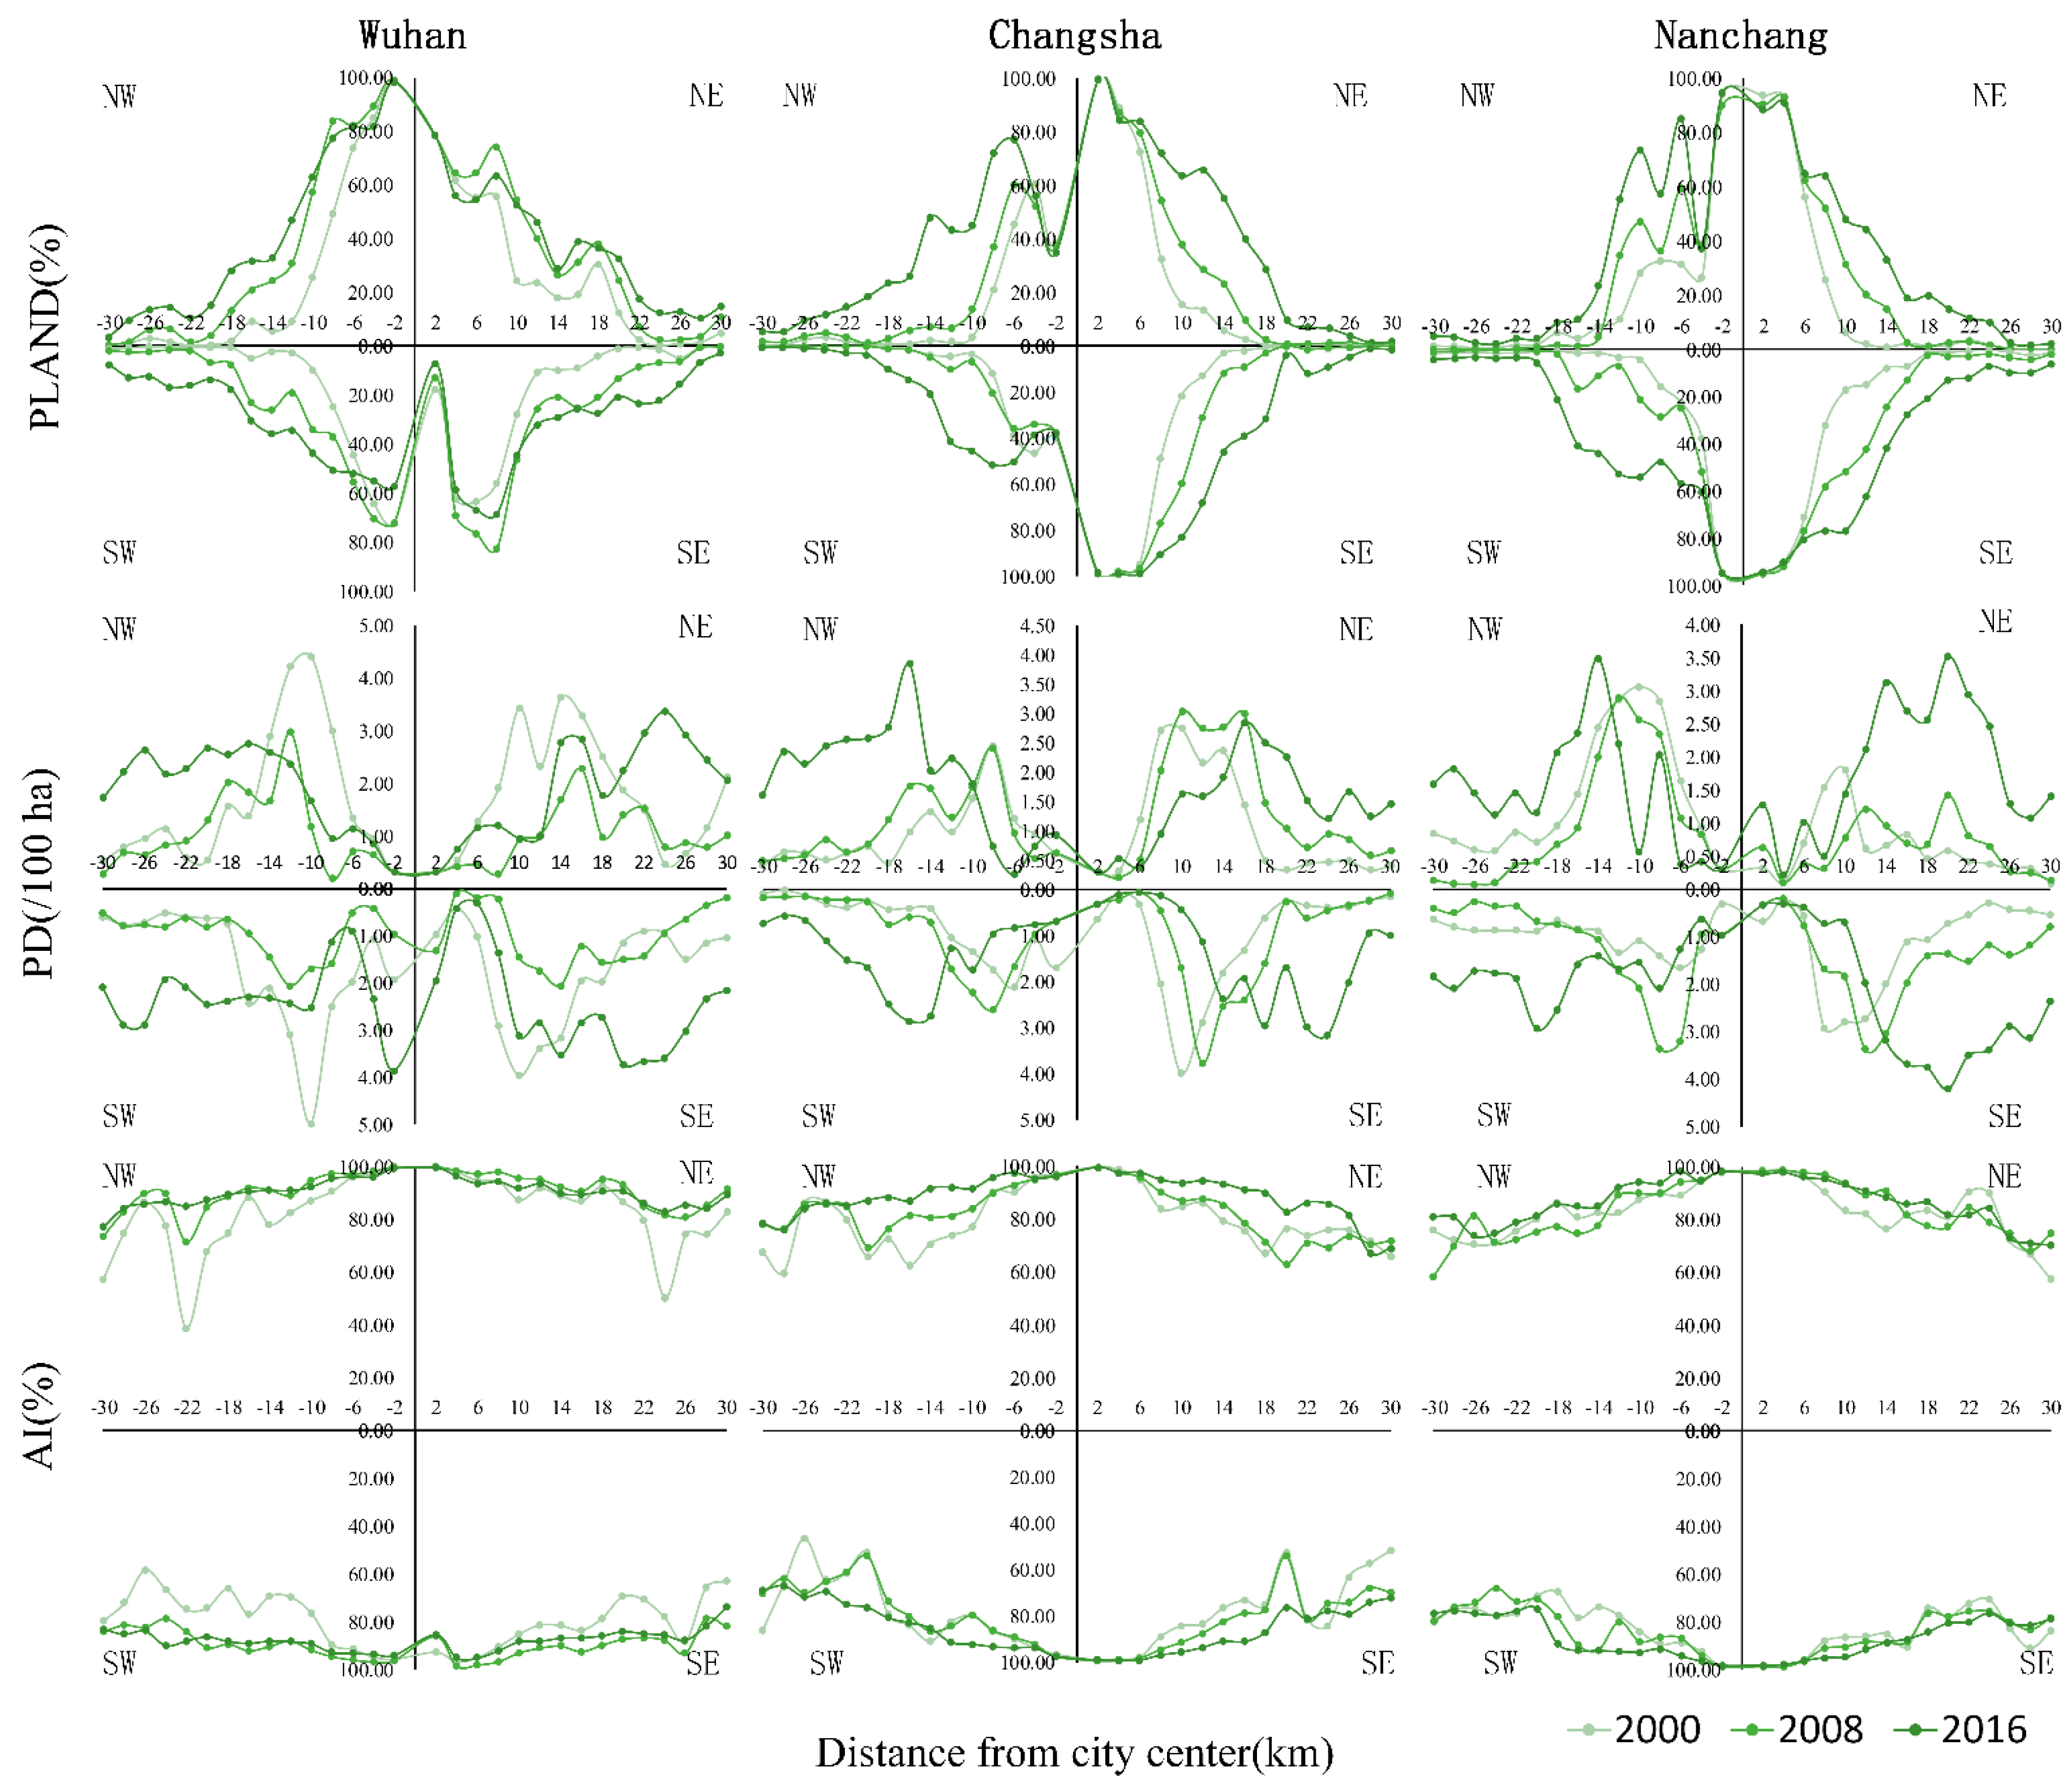
To further understand the detailed spatial patterns of the landscape within the three cities, the features and trends of urban landscape change were assessed for the three cities both across space and through time (Figure 11). To avoid redundancy, only three metrics were presented: the PLAND, PD, and AI. The curve for each city displays a pattern of single or multiple peaks in different landscape metrics. As urbanization proceeded, the three cities all showed a monotonically increasing trajectory in the PLAND. A zero value of the PLAND appeared at 18 km in the west sector in 2000 and increased over time in all directions with the largest urban percentages in the NW sector of Wuhan and in the eastern sectors of both Changsha and Nanchang. There are some fluctuations in the range of 2–6 km from the city centers due to the existence of the Yangtze River in the middle of the cities. For Wuhan, the PD decreased in nearly all sectors at the buffer distances of 2–15 km in 2000–2008 and increased again during 2008–2016. The change in the PD in Changsha showed some differences in comparison with that of Wuhan. It showed a continuous decrease over the past 16 years within approximately 14 km from the city center in the east and 10 km from the city center in the west. However, the trend reversed when the buffer distance was larger than 14 km. As for Nanchang, the PD increased dramatically when the buffer distance was larger than 23 km in the east and 15 km in the west from 2000 to 2016. A constant decrease was also observed at buffer distances of 2–14 km in the NW sector and 6–10 km in the SE sector, respectively. Meanwhile, similarities in the PD can still be found for these three cities. That is, the PD presented a multimodal pattern and showed a decrease for the area near the city centers, implying a decrease in landscape fragmentation of existing built-up areas. The AI decreased outward from the city center in all directions for each of the three cities, but there were some distinct features for the different cities (Figure 11). Specifically, for Wuhan, the AI sharply increased during 2000–2007 at buffer distances of 22–26 km in all directions. For Changsha, a similar spatial change of the AI mainly appeared during 2008–2016. As for Nanchang, the AI changed more in the SW sector in the past 16-year period.
5. Discussion
5.1. Urban Expansion in the MYRB Urban Agglomeration Compared with Other Large Urban Agglomerations in China
In China, there are other three national level urban agglomerations except for the MYRB agglomerations, that is the JJJ, the YRD, and the PRD [62]. Numerous previous researches have shown that rapid urban expansion have occurred in the above three urban agglomerations over time [17,20,22,23], however, less for the MYRB urban agglomeration. To better understand the urban expansion in the MYRB urban agglomeration and the differences between the four national level urban agglomerations, a comparison of urban expansion rate among the four urban agglomerations was made.
Unlike the other three urban agglomerations, which have experienced extremely rapid urban land expansion over the past several years. Xu et al. [27] reported that the AGR of 6.08%, 9.76%, 5.84% and 11.69% for the JJJ, YRD, and PRD during 1992 and 2015, respectively. These rates were much higher than that of the MYRB urban agglomeration, even though the time periods for comparison did not match exactly. Regional studies also support this observation of the rates of expansion in the three metropolises in earlier years. The rate of urban expansion in the WHM was reported to have an increase of 40.69 × 10⁴ ha from 2000 to 2011 [26] and urban expansion in the CZTM was reported to be dominated by edge-expansion in [63]. Meanwhile, infilling expansion mode was the primary expansion mode in the other three national level urban agglomerations as time went on [22,30], however, edge-expansion and outlying modes are still dominated the urban expansion mode in the MYRB urban agglomeration. The result indicates that the other three large urban agglomerations have begun to use land more intensively, while the MYRB is still at the stage of creating more urban land without a regular planning.
Two important factors that can explain the lower rate of urban land expansion in the MYRB are geographic location and economic growth. Urbanization of the JJJ, YRD and PRD has benefited from their geographic proximity to the coast areas of China where most industries and commercial centers are located [2,31,64]. These three urban agglomerations can be regarded as the most important centers of Chinese trade, commerce, manufacture and industry [21]. Additionally, the three most developed cities (Beijing, Shanghai, and Shenzhen) of China are located in the JJJ, YRD and PRD, respectively, which have promoted the development of the other cities nearby. In addition, most of the population of China dwell at the east of China, which also accelerates the expansion of urban land in these regions. The GDP of JJJ represented 43% of the national GDP in 2010 [21], the GDP per capita of the YRD was 3.92 times the national average level in 2005 [17], and the PRD accounts for 10% of China’s GDP and over 80% of Guangdong’s GDP, which shows highly concentration of economy activity [65]. However, the MYRB urban agglomeration, as shown in Table 4, consists of many less developed cities; these cities actually had smaller GDP than the above three urban agglomerations. Therefore, the MYRB urban agglomeration had relatively smaller expansion rate compared with the other three ones.
5.2. Evolution of the Spatial Structure in the MYRB Urban Agglomeration
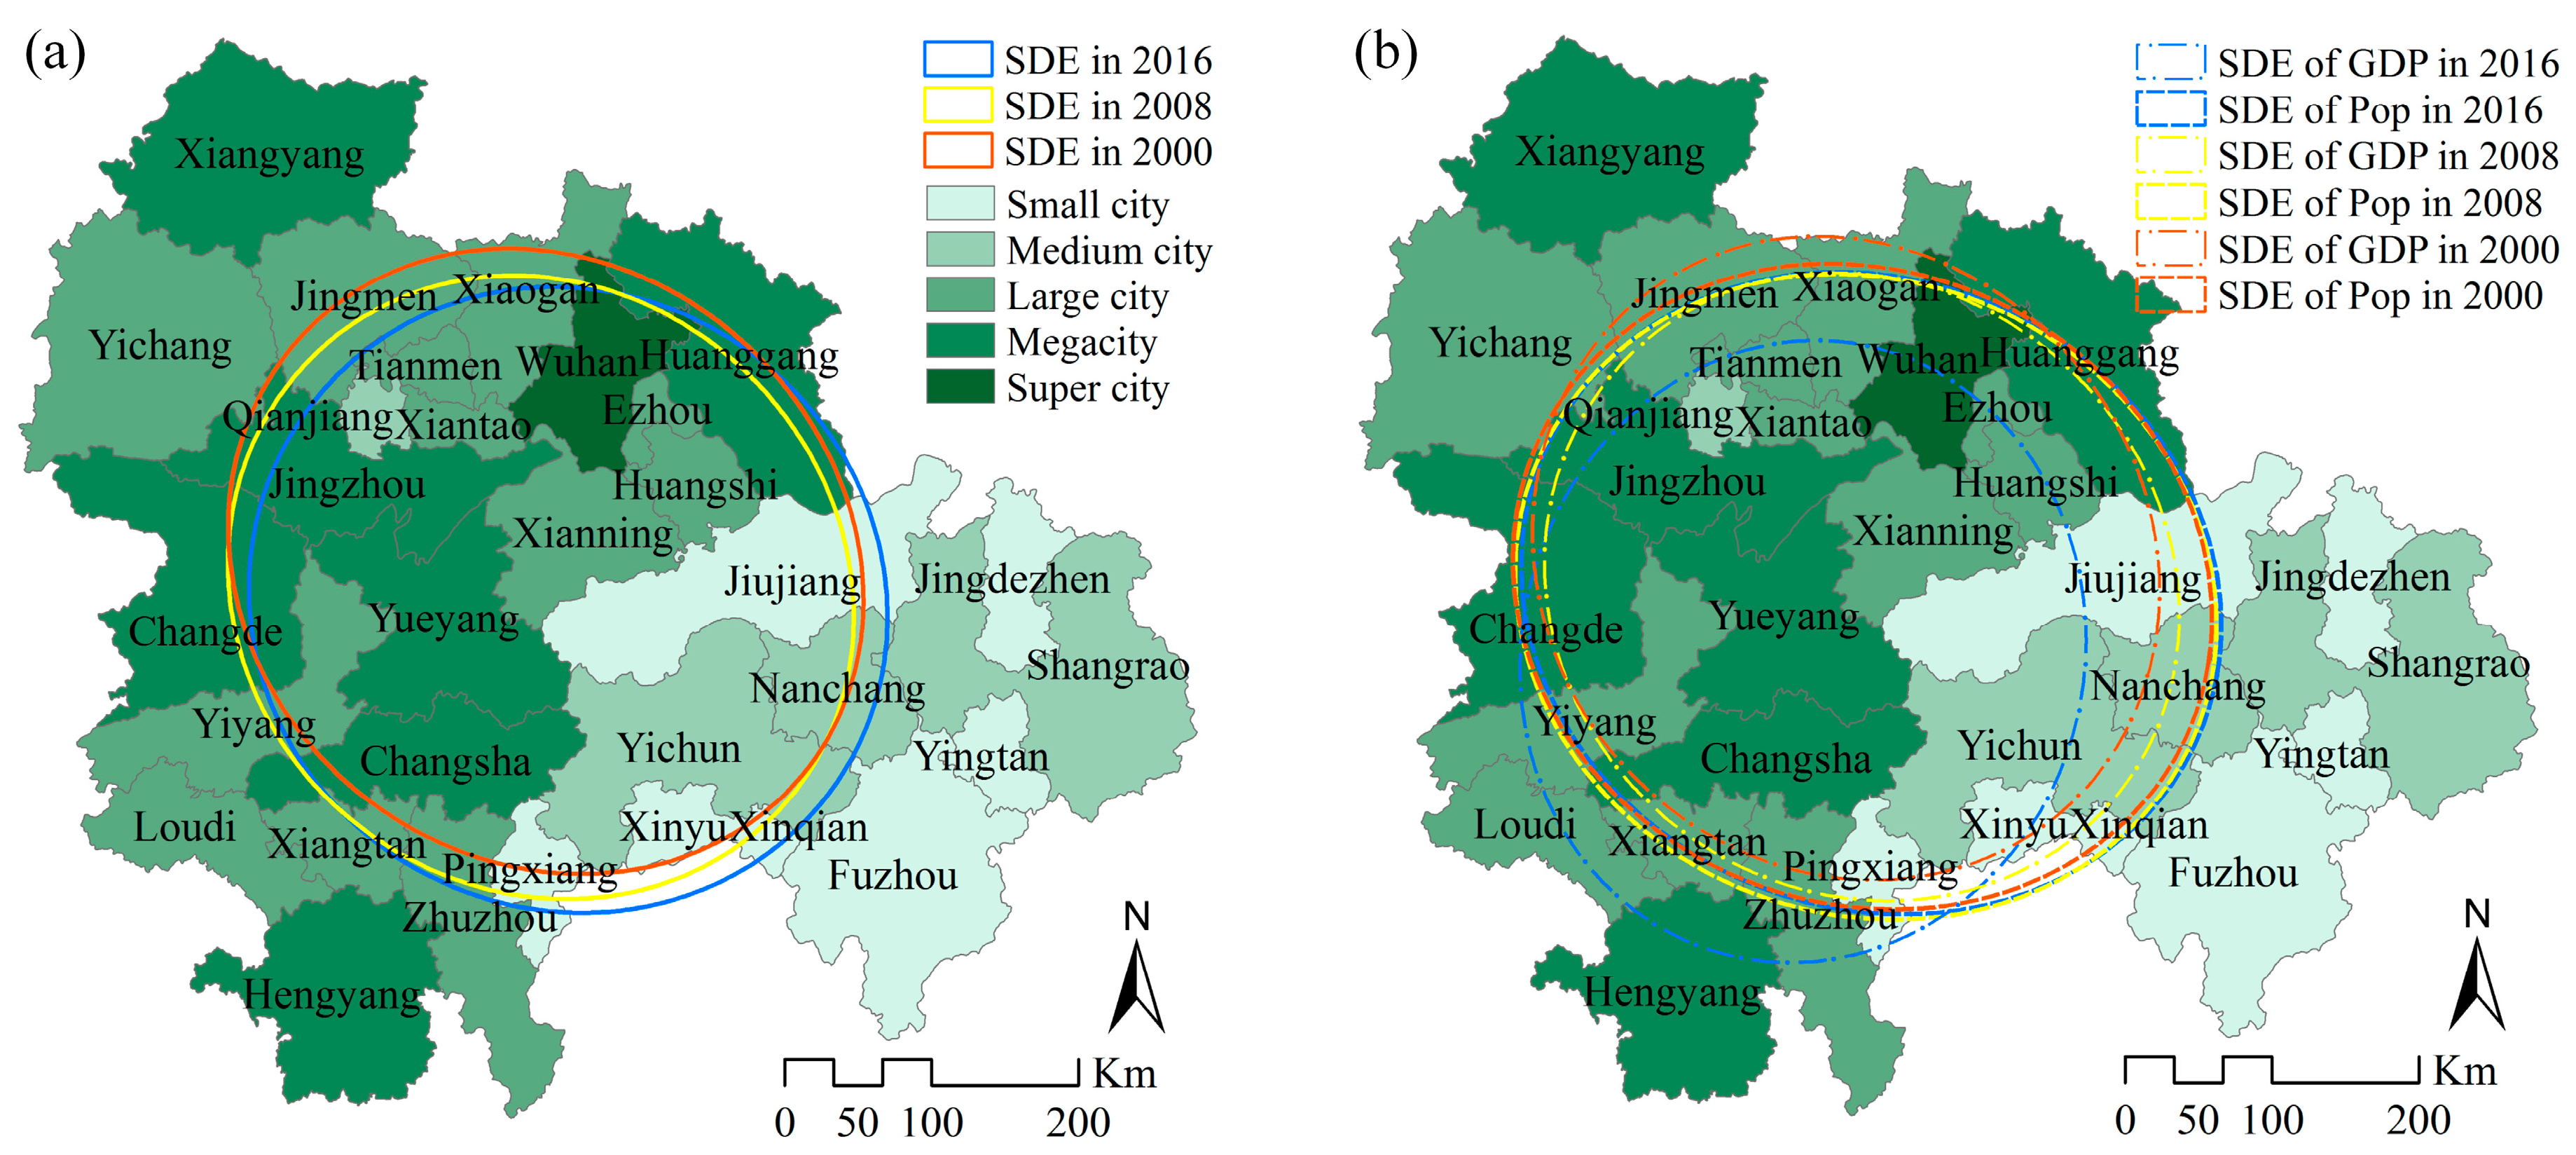
To further investigate the evolution of the socioeconomic situation during the process of urbanization in the MYRB urban agglomeration, the standard deviational ellipse (SDE) [66] and the gravity model [67] were used in this paper to better understand the direction of spatial evolution and spatial connections between the cities. The SDE can represent the gravitational center, range, and intensity, and represent the direction of discrete datasets and the temporal change of their form [68]. The gravity model originated from Newton’s law of universal gravitation. Here, we used it to quantify the interactions between the 31 cities in the MYRB urban agglomeration. A greater value of gravity, indicates a closer relationship between the cities. After the gravity among the cities was calculated, the maximum value between a city and other cities was then chosen to obtain the distribution of gravity connections.
As seen from the SDE results of urban expansion (Figure 12a), the spatial distribution of cities in the MYRB is centralized among the three metropolitan areas and presents a pattern with a “northwest-southeast” trend, which is consistent with the results of a previous study [69]. The change of the long axis is more obvious than that of the short one, meaning that the forces driving the spatial evolution mainly come from urban expansion in the “northwest-southeast” direction. Specifically, in 2000–2008, the short axis varied more than the long axis, that is, the “southwest-northeast” direction had rapid urban expansion during 2000–2008. In 2008–2016, the long axis varied more than the short axis, indicating that the “northwest-southeast” had rapid urbanization during 2008–2016. Furthermore, the SDEs of the population and GDP (Figure 12b) were also compared with that of the urban land in the three periods. The results show that, as a whole, the spatial evolution of urban land had the same trend with the demographic and economic changes, indicating that the population and economy are important forces on urban expansion.
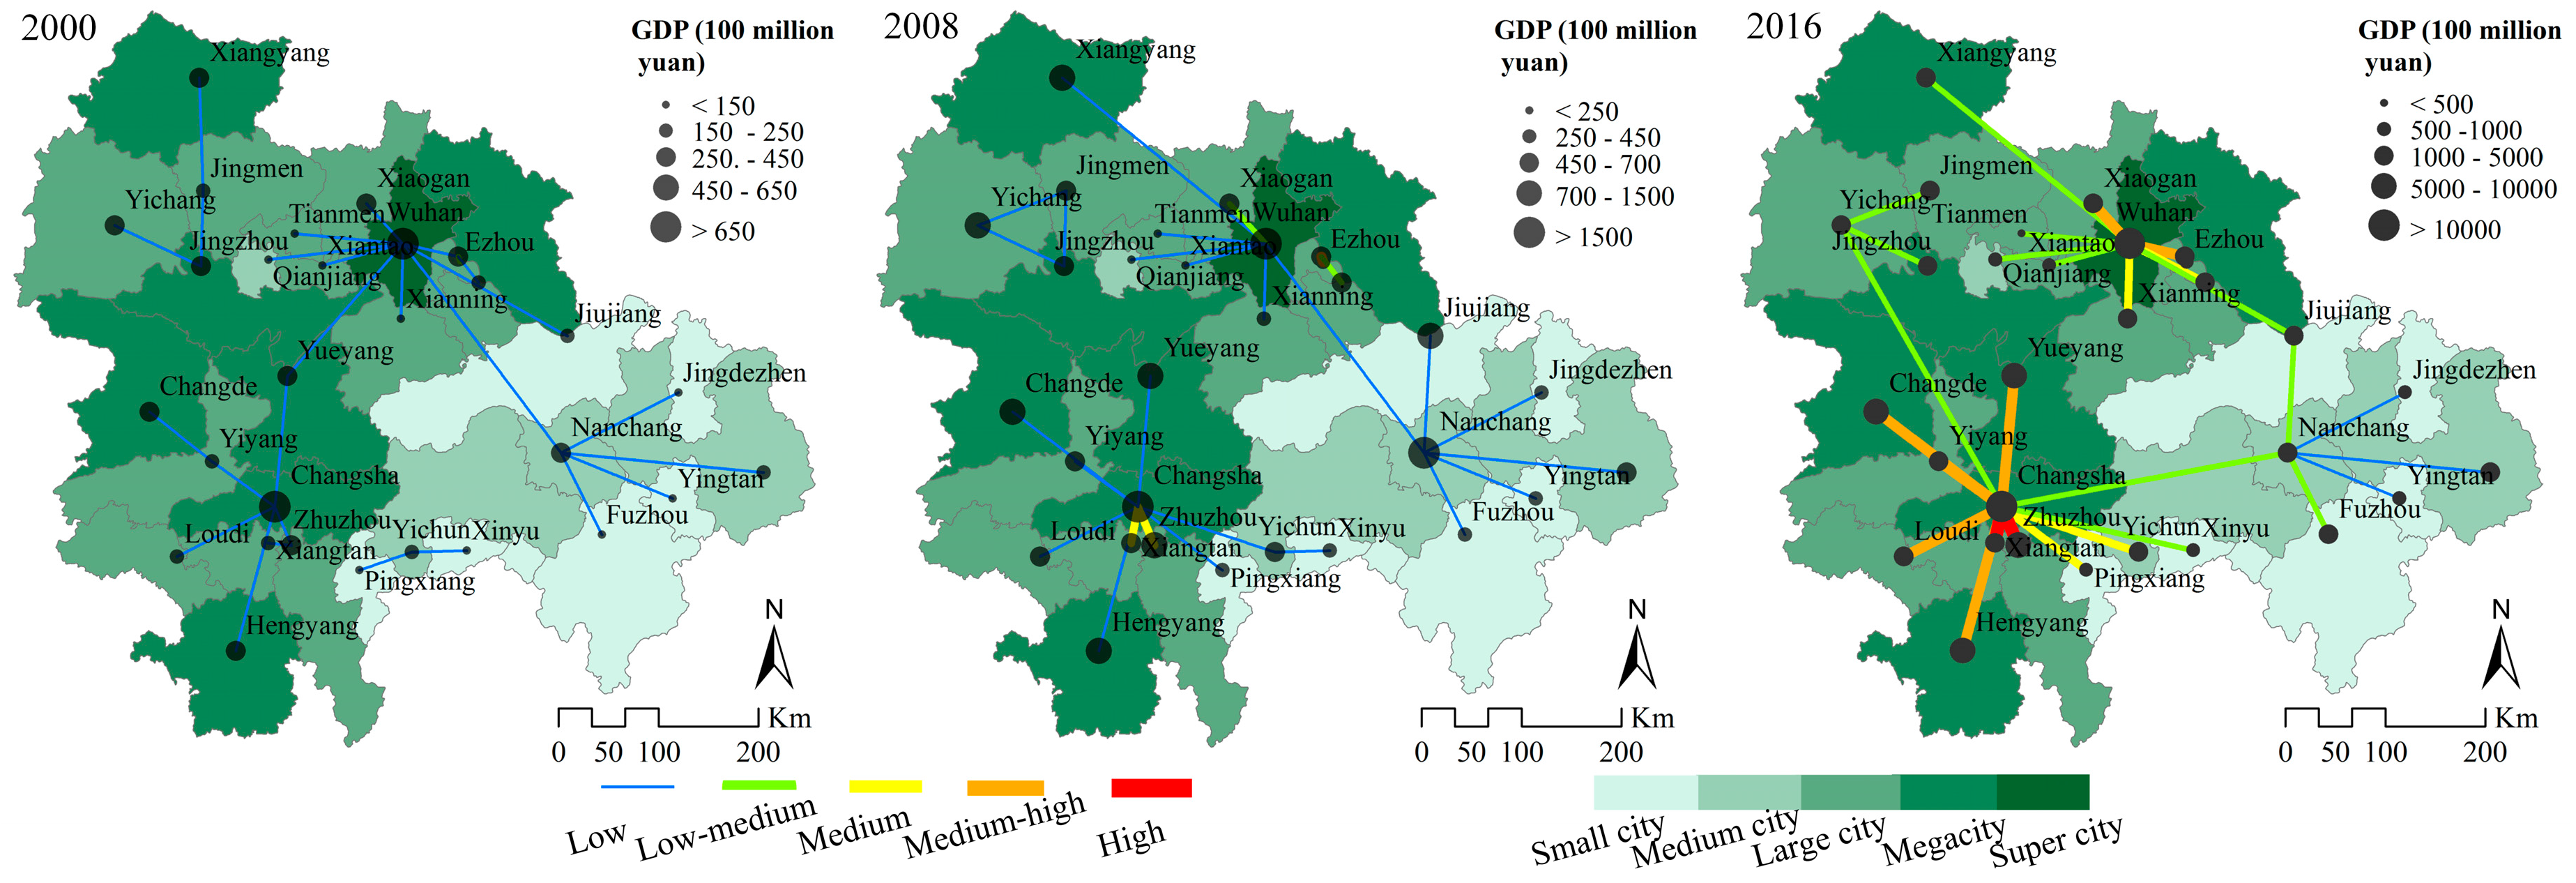
As Figure 13 shows, the connections among the cities became increasingly intensive as time progressed due to rapid economic development, which demonstrates the rapid urbanization in this area in these years. However, it can also be seen that the interactions among the cities mainly focused on the three capital cities and that there exist differences of the interaction intensities among the different cities, which show a pattern of “multi-polarization and fragmentation”. The reason for this may be geographical separation. On the other hand, it also indicates that the radiative driving forces of Wuhan, Changsha and Nanchang were not strong enough to bring all these cities together.
5.3. Implications for Regional Development Strategies
The detailed, distinctive characteristics of the directions and hot-zones of urban expansion in each city can be ascribed to the influences of urban planning and policy [23]. The Master Plan [39] for the MYRB urban agglomeration set the development targets of enhancing the economic strength of this region, realizing the rational distribution of the infrastructures, and improving the urban system and the driving forces of the central cities till 2020. In this subsection, two implications are highlighted according to the results of this paper.
First, strict controls should be applied to alleviate the extent and disorder of urban sprawl in the MYRB, especially for the small and medium cities. As the results show above, outlying and edge-expansion are the dominant expansion types in the MYRB urban agglomeration. It is commonly admitted that urbanization introduces much convenience; meanwhile, many problems caused by unplanned urban expansion have been witnessed and studied [8,70]. In this context, intensive land-use should be advocated and rigorous policies should be imposed to make room for our natural resources to build a society where people can live in harmony with nature. Although numerous policies have been enacted to constrain the abuse of the land in the past several years, the outcomes seem to be unsatisfying. Therefore, the enforcement of these policies should also be strengthened.
Second, the interactions among the inter-regions in the MYRB should be strengthened to form a new national economic growth pole. As Figure 13 shows that although the interactions between each capital city and their neighboring cities have enhanced over time, respectively, the interactions among the inter-regions are still relatively weak, indicating that the competition is stronger than the cooperation among the cities due to their lacking integrated coordination mechanism [71]. In 2016, the State Council of China adopted the “Plan for promoting the rise of central China (2016 to 2025)” [72] which emphasizes on accelerating the construction of urban agglomerations and forming an important support for the national economy. Recently, the topic of developing a “one belt one road” [73] strategy has been discussed heatedly. The planning for the development of central China and the promotions of “Belt and Road” construction, Beijing-Tianjin-Hebei coordinated development, and Yangtze River economic development have been converged to speed up the construction of urban and rural areas and promote the comprehensive strength and competitiveness of the central region to a new level. Under these circumstances, measures should be taken to break the limitation of physical distance among different regions in the MYRB, such as increasing the means of transportation between regions to decrease the cost of transportation, enhancing the regional cooperation to forge closer links among different regions in the MYRB and finally realizing the goal of forming a new national economic growth pole.
5.4. Limitations and Future Perspectives
There are several limitations to this study. First, although the spatial resolution of data used for extracting urban land at regional level is 250 m, it is still not accurate enough to characterize the urban land change for a wide range of area at finer scale due to the mixed pixel problem, therefore, a more accurate method that can merge various kinds of data sources should be the focus of our future study. Second, as a general problem, the accuracy of the classification may influence the subsequent analysis results. Although here, at the regional level, we used images with spatial resolutions of 250 m, which is relatively finer than those of most previous studies, it cannot be denied that some urban areas may have been overestimated due to misclassification. Therefore, the significance of our analysis does not reside in the individual values of the metrics at any given time, but rather the general spatiotemporal patterns of these metrics over several decades. Third, we explored the urban expansion in the MYRB urban agglomeration; however, the causes and impacts of urban expansion were not investigated. Future studies may focus on the investigation of these problems with the help of models such as the single layer urban canopy model (SLUCM) and Weather Research and Forecasting (WRF) model [74,75].
6. Conclusions
Urban agglomeration is the ultimate spatial urban form within China’s new urbanization strategy [76]. Over the past decade, central and provincial governments have sought to foster urban agglomerations as regional growth poles and as strategic core areas with the potential to drive continuous economic growth [77]. In this context, the study of urbanization in the MYRB is necessary. However, studies on urban expansion in the MYRB agglomeration are relatively limited.
Using multi-temporal remote sensing data, this paper details an investigation of the spatiotemporal change of urban land in the MYRB urban agglomeration from 2000 to 2016 at regional, prefectural, and inner-city levels. Three features of urban expansion are highlighted according to the results: (1) the MYRB has experienced significant urban land expansion over the past sixteen years. The CZTM and PYLM had higher expansion rates than the WHM. The urban expansion shows an obvious spatiotemporal heterogeneity across the 31 cities in the MYRB. This roughly represents the phenomenon wherein the development of cities surrounding other highly developed cities is not promoted; by contrast, highly developed cities usually suppress the development of neighboring cities, as most of the resources are attracted away from the latter by the former. This finding is based on the results of urban land change calculations for the 31 cities. (2) Small and medium cities in the MYRB experienced the highest level of expansion, which is consistent with the situation of China according to a previous study [78]. This is supported by our findings that the expansion rates and intensities of small and medium city were larger over the period 2000–2016. (3) The proportions of the three urban growth modes reveal that outlying and edge-expansion were still the dominant urban expansion types in the MYRB during the study period both at the regional and inner-city level, indicating that urban agglomeration in the MYRB is still focused on continuous urban sprawl. An infilling urban growth type is generally associated with compact urban development, while outlying expansion is typically associated with dispersed development. Which kind of type is better has long been a hot topic [79]; however, we believe that a balance between intensive and extensive development may benefit both urban areas and the environment. The landscape of urban land in the whole MYRB became more compact as time went on; however, different cities in the MYRB show great spatial heterogeneity at all the three levels, suggesting the necessity of studying urban expansion at different levels. Meanwhile, based on the above analysis, we conclude that the extent of urban expansion in the MYRB can be reliably measured using MODIS data and Landsat data as well as census data.
Our results also revealed a considerable regional disparity in the MYRB urban agglomeration by measuring the urban expansion of the 31 cities. It was also found that the economic spatial interaction among the cities demonstrated a pattern of “multi-polarization and fragmentation”, which illustrates the weak radiative driving forces of the central cities such as Wuhan, Changsha, and Nanchang. We believe that these results could be useful for monitoring the processes of urban growth in the Middle Yangtze River Basin urban agglomeration and have discussed some of the possible implications for planning.
Acknowledgments
This work was supported by the Foundation of Ministry of Education of the People’s Republic of China (6141A02022318), Creative Research Groups of Natural Science Foundation of Hubei Province of China (2016CFA003), and Fundamental Research Funds for the Central Universities (2042017GF0057). We would like to express our respects and gratitude to the anonymous reviewers and editors for their professional comments and suggestions.
Author Contributions
Dandan Liu and Nengcheng Chen conceived and designed the experiments; Dandan Liu performed the experiments and analyzed the data; Dandan Liu and Nengcheng Chen wrote the paper.
Conflicts of Interest
The authors declare no conflict of interest. The funders had no role in study design, data collection and analysis, decision to publish, or preparation of the manuscript.
References
- Sun, C.; Wu, Z.F.; Lv, Z.Q.; Yao, N.; Wei, J.B. Quantifying different types of urban growth and the change dynamic in Guangzhou using multi-temporal remote sensing data. Int. J. Appl. Earth Obs. 2013, 21, 409–417. [Google Scholar] [CrossRef]
- Kuang, W.H.; Liu, J.Y.; Dong, J.W.; Chi, W.F.; Zhang, C. The rapid and massive urban and industrial land expansions in China between 1990 and 2010: A CLUD-based analysis of their trajectories, patterns, and drivers. Landsc. Urban Plan. 2016, 145, 21–33. [Google Scholar] [CrossRef]
- Kaza, N. The changing urban landscape of the continental United States. Landsc. Urban Plan. 2013, 110, 74–86. [Google Scholar] [CrossRef]
- Montgomery, M.R. The urban transformation of the developing world. Science 2008, 319, 761–764. [Google Scholar] [CrossRef] [PubMed]
- Bai, X.M.; Shi, P.J.; Liu, Y.S. Realizing china’s urban dream. Nature 2014, 509. [Google Scholar] [CrossRef]
- Zeng, C.; Zhang, M.D.; Cui, J.X.; He, S.W. Monitoring and modeling urban expansion-a spatially explicit and multi-scale perspective. Cities 2015, 43, 92–103. [Google Scholar] [CrossRef]
- Li, X.C.; Liu, X.P.; Gong, P. Integrating ensemble-urban cellular automata model with an uncertainty map to improve the performance of a single model. Int. J. Geogr. Inf. Sci. 2015, 29, 762–785. [Google Scholar] [CrossRef]
- Song, W.; Pijanowski, B.C.; Tayyebi, A. Urban expansion and its consumption of high-quality farmland in Beijing, China. Ecol. Indic. 2015, 54, 60–70. [Google Scholar] [CrossRef]
- Li, X.M.; Zhou, W.Q.; Ouyang, Z.Y. Forty years of urban expansion in Beijing: What is the relative importance of physical, socioeconomic, and neighborhood factors? Appl. Geogr. 2013, 38, 1–10. [Google Scholar] [CrossRef]
- Zhao, M.Y.; Cai, H.Y.; Qiao, Z.; Xu, X.L. Influence of urban expansion on the urban heat island effect in Shanghai. Int. J. Geogr. Inf. Sci. 2016, 30, 2421–2441. [Google Scholar] [CrossRef]
- Zhao, S.Q.; Da, L.J.; Tang, Z.Y.; Fang, H.J.; Song, K.; Fang, J.Y. Ecological consequences of rapid urban expansion: Shanghai, China. Front. Ecol. Environ. 2006, 4, 341–346. [Google Scholar] [CrossRef]
- Li, H.; Wei, Y.H.D.; Huang, Z.J. Urban land expansion and spatial dynamics in globalizing Shanghai. Sustainability 2014, 6, 8856–8875. [Google Scholar] [CrossRef]
- Li, L.W.; Lu, D.S.; Kuang, W.H. Examining urban impervious surface distribution and its dynamic change in Hangzhou metropolis. Remote Sens. 2016, 8. [Google Scholar] [CrossRef]
- Yue, W.Z.; Liu, Y.; Fan, P.L. Measuring urban sprawl and its drivers in large Chinese cities: The case of Hangzhou. Land Use Policy 2013, 31, 358–370. [Google Scholar] [CrossRef]
- Fan, F.L.; Wang, Y.P.; Qiu, M.H.; Wang, Z.S. Evaluating the temporal and spatial urban expansion patterns of Guangzhou from 1979 to 2003 by remote sensing and GIS methods. Int. J. Geogr. Inf. Sci. 2009, 23, 1371–1388. [Google Scholar] [CrossRef]
- Ma, Y.L.; Xu, R.S. Remote sensing monitoring and driving force analysis of urban expansion in Guangzhou City, China. Habitat. Int. 2010, 34, 228–235. [Google Scholar] [CrossRef]
- Tian, G.J.; Jiang, J.; Yang, Z.F.; Zhang, Y.Q. The urban growth, size distribution and spatio-temporal dynamic pattern of the Yangtze River Delta megalopolitan region, China. Ecol. Model. 2011, 222, 865–878. [Google Scholar] [CrossRef]
- Du, H.Y.; Wang, D.D.; Wang, Y.Y.; Zhao, X.L.; Qin, F.; Jiang, H.; Cai, Y.L. Influences of land cover types, meteorological conditions, anthropogenic heat and urban area on surface urban heat island in the Yangtze River Delta urban agglomeration. Sci. Total Environ. 2016, 571, 461–470. [Google Scholar] [CrossRef] [PubMed]
- Ye, L. Urban transformation and institutional policies: Case study of mega-region development in China’s Pearl River Delta. J. Urban Plan. Dev. 2013, 139, 292–300. [Google Scholar] [CrossRef]
- Wang, X.M.; Liao, J.B.; Zhang, J.; Shen, C.; Chen, W.H.; Xia, B.C.; Wang, T.J. A numeric study of regional climate change induced by urban expansion in the Pearl River Delta, China. J. Appl. Meteorol. Clim. 2014, 53, 346–362. [Google Scholar] [CrossRef]
- Haas, J.; Ban, Y.F. Urban growth and environmental impacts in Jing-Jin-Ji, the Yangtze River Delta and the Pearl River Delta. Int. J. Appl. Earth Obs. 2014, 30, 42–55. [Google Scholar] [CrossRef]
- Wu, W.J.; Zhao, S.Q.; Zhu, C.; Jiang, J.L. A comparative study of urban expansion in Beijing, Tianjin and Shijiazhuang over the past three decades. Landsc. Urban Plan. 2015, 134, 93–106. [Google Scholar] [CrossRef]
- Zhang, Z.X.; Li, N.; Wang, X.; Liu, F.; Yang, L.P. A comparative study of urban expansion in Beijing, Tianjin and Tangshan from the 1970s to 2013. Remote Sens. 2016, 8. [Google Scholar] [CrossRef]
- Zhou, K.H.; Liu, Y.L.; Tan, R.H.; Song, Y. Urban dynamics, landscape ecological security, and policy implications: A case study from the Wuhan area of central China. Cities 2014, 41, 141–153. [Google Scholar] [CrossRef]
- Peng, W.F.; Zhao, J.F.; Zhou, J.M.; Yang, C.J.; He, Z.W. Dynamic detection on urban sprawl based on RS and GIS: A case study of Chengdu City. In Proceedings of the 2008 International Workshop on Education Technology and Training and 2008 International Workshop on Geoscience and Remote Sensing, Shanghai, China, 21–22 December 2008. [Google Scholar]
- Tan, R.H.; Liu, Y.L.; Liu, Y.F.; He, Q.S.; Ming, L.C.; Tang, S.H. Urban growth and its determinants across the Wuhan urban agglomeration, central China. Habitat. Int. 2014, 44, 268–281. [Google Scholar] [CrossRef]
- Xu, M.; He, C.Y.; Liu, Z.F.; Dou, Y.Y. How did urban land expand in China between 1992 and 2015? A multi-scale landscape analysis. PLoS ONE 2016, 11. [Google Scholar] [CrossRef] [PubMed]
- Xu, T.; Ma, T.; Zhou, C.H.; Zhou, Y.K. Characterizing spatio-temporal dynamics of urbanization in China using time series of DMSP/OLS night light data. Remote Sens. 2014, 6, 7708–7731. [Google Scholar] [CrossRef]
- Huang, Z.J.; Wei, Y.D.; He, C.F.; Li, H. Urban land expansion under economic transition in China: A multilevel modeling analysis. Habitat. Int. 2015, 47, 69–82. [Google Scholar] [CrossRef]
- Ou, J.P.; Liu, X.P.; Li, X.; Chen, Y.M.; Li, J. Quantifying spatiotemporal dynamics of urban growth modes in metropolitan cities of China: Beijing, Shanghai, Tianjin, and Guangzhou. J. Urban Plan. D 2017, 143. [Google Scholar] [CrossRef]
- Quan, B.; Bai, Y.J.; Romkens, M.J.M.; Chang, K.T.; Song, H.; Guo, T.; Lei, S. Urban land expansion in Quanzhou City, China, 1995–2010. Habitat. Int. 2015, 48, 131–139. [Google Scholar] [CrossRef]
- Kuang, W.H.; Chi, W.F.; Lu, D.S.; Dou, Y.Y. A comparative analysis of megacity expansions in China and the U.S.: Patterns, rates and driving forces. Landsc. Urban Plan. 2014, 132, 121–135. [Google Scholar] [CrossRef]
- Yue, W.Z.; Zhang, L.L.; Liu, Y. Measuring sprawl in large Chinese cities along the Yangtze River via combined single and multidimensional metrics. Habitat. Int. 2016, 57, 43–52. [Google Scholar] [CrossRef]
- Usman, M.; Liedl, R.; Shahid, M.A.; Abbas, A. Land use/land cover classification and its change detection using multi-temporal MODIS NDVI data. J. Geogr. Sci. 2015, 25, 1479–1506. [Google Scholar] [CrossRef]
- Huang, X.M.; Schneider, A.; Friedl, M.A. Mapping sub-pixel urban expansion in China using MODIS and DMSP/OLS nighttime lights. Remote Sens. Environ. 2016, 175, 92–108. [Google Scholar] [CrossRef]
- Ying, Q.; Hansen, M.C.; Potapov, P.V.; Tyukavina, A.; Wang, L.; Stehman, S.V.; Moore, R.; Hancher, M. Global bare ground gain from 2000 to 2012 using Landsat imagery. Remote Sens. Environ. 2017, 194, 161–176. [Google Scholar] [CrossRef]
- Li, X.C.; Gong, P. An “exclusion-inclusion” framework for extracting human settlements in rapidly developing regions of China from Landsat images. Remote Sens. Environ. 2016, 186, 286–296. [Google Scholar] [CrossRef]
- Sun, Y.L.; Yang, X.H.; Wang, X.S.; Chen, J.J. Land use classification based on decision tree using MODIS data. Resour. Sci. 2007, 29, 169–174. [Google Scholar]
- National Development and Reform Commission. Available online: http://www.ndrc.gov.cn/zcfb/zcfbtz/201504/t20150416_688229.html (accessed on 26 September 2017).
- Gu, Q.W.; Wang, H.Q.; Zheng, Y.N.; Zhu, J.W.; Li, X.K. Ecological footprint analysis for urban agglomeration sustainability in the middle stream of the Yangtze River. Ecol. Model. 2015, 318, 86–99. [Google Scholar] [CrossRef]
- Fan, C.; Myint, W.; Rey, S.J.; Li, W.W. Time series evaluation of landscape dynamics using annual Landsat imagery and spatial statistical modeling: Evidence from the Phoenix metropolitan region. Int. J. Appl. Earth Obs. 2017, 58, 12–25. [Google Scholar] [CrossRef]
- Tan, B.; Morisette, J.T.; Wolfe, R.E.; Gao, F.; Ederer, G.A.; Nightingale, J.; Pedelty, J.A. An enhanced timesat algorithm for estimating vegetation phenology metrics from MODIS data. IEEE J. Stars 2011, 4, 361–371. [Google Scholar] [CrossRef]
- McFeeters, S.K. The use of the normalized difference water index (NDWI) in the delineation of open water features. Int. J. Remote Sens. 1996, 17, 1425–1432. [Google Scholar] [CrossRef]
- Dwyer, J.; Schmidt, G. The MODIS reprojection tool. Earth Sci. Satell. Remote Sens. Data Comput. Process. Tools 2006, 2. [Google Scholar] [CrossRef]
- Jin, Y.; Sung, S.; Lee, D.K.; Biging, G.S.; Jeong, S. Mapping deforestation in North Korea using phenology-based multi-index and random forest. Remote Sens. 2016, 8, 997. [Google Scholar] [CrossRef]
- Hall, D.K.; Riggs, G.A.; Salomonson, V.V. Development of methods for mapping global snow cover using moderate resolution imaging spectroradiometer data. Remote Sens. Environ. 1995, 54, 127–140. [Google Scholar] [CrossRef]
- Yang, C.K.; Tan, C.H.; Juan, C.H.; Lin, M.L. Characterizing the meso-scale enviromental thermal effects due to different landuse types using remote sensing techniques and indices in Taoyuan, North Taiwan. In Proceedings of the Geoscience and Remote Sensing Symposium, Boston, MA, USA, 7–11 July 2008. [Google Scholar]
- Zha, Y.; Gao, J.; Ni, S. Use of normalized difference built-up index in automatically mapping urban areas from TM imagery. Int. J. Remote Sens. 2003, 24, 583–594. [Google Scholar] [CrossRef]
- Cherkassky, V. The nature of statistical learning theory. IEEE Trans. Neural Netw. 1997, 8, 1564. [Google Scholar] [CrossRef] [PubMed]
- Google Earth. Available online: https://www.google.com/earth/ (accessed on 26 September 2017).
- Chance, E.W.; Cobourn, K.M.; Thomas, V.A.; Dawson, B.C.; Flores, A.N. Identifying irrigated areas in the Snake River Plain, Idaho: Evaluating performance across compositing algorithms, spectral indices, and sensors. Remote Sens. 2017, 9, 546. [Google Scholar] [CrossRef]
- Pan, X.Z.; Uchida, S.; Liang, Y.; Hirano, A.; Sun, B. Discriminating different landuse types by using multitemporal NDXI in a rice planting area. Int. J. Remote Sens. 2010, 31, 585–596. [Google Scholar] [CrossRef]
- Foody, G.M. Status of land cover classification accuracy assessment. Remote Sens. Environ. 2002, 80, 185–201. [Google Scholar] [CrossRef]
- Zhang, Q.W.; Su, S.L. Determinants of urban expansion and their relative importance: A comparative analysis of 30 major metropolitans in China. Habitat. Int. 2016, 58, 89–107. [Google Scholar] [CrossRef]
- Liu, X.P.; Li, X.; Chen, Y.M.; Tan, Z.Z.; Li, S.Y.; Ai, B. A new landscape index for quantifying urban expansion using multi-temporal remotely sensed data. Landsc. Ecol. 2010, 25, 671–682. [Google Scholar] [CrossRef]
- Mcgarigal, K.; Marks, B.J. Fragstats: Spatial Analysis Program for Quantifying Landscape Structure; USDA Forest Service: Washington, DC, USA, 1995; p. 351.
- Jiang, L.; Deng, X.Z.; Seto, K.C. Multi-level modeling of urban expansion and cultivated land conversion for urban hotspot counties in China. Landsc. Urban Plan. 2012, 108, 131–139. [Google Scholar] [CrossRef]
- Wang, L.; Li, C.C.; Ying, Q.; Cheng, X.; Wang, X.Y.; Li, X.Y.; Hu, L.Y.; Liang, L.; Yu, L.; Huang, H.B.; et al. China’s urban expansion from 1990 to 2010 determined with satellite remote sensing. Chin. Sci. Bull. 2012, 57, 2802–2812. [Google Scholar] [CrossRef]
- Qi, W.; Liu, S.H.; Jin, H.R. Applicability of the new standard of city-size classification in China. Prog. Geogr. 2016, 35. [Google Scholar] [CrossRef]
- Jiao, L.M. Urban land density function: A new method to characterize urban expansion. Landsc. Urban Plan. 2015, 139, 26–39. [Google Scholar] [CrossRef]
- Li, H.; Wei, Y.D.; Liao, F.H.; Huang, Z.J. Administrative hierarchy and urban land expansion in transitional China. Appl. Geogr. 2015, 56, 177–186. [Google Scholar] [CrossRef]
- Yi, K.; Zeng, Y.; Wu, B. Mapping and evaluation the process, pattern and potential of urban growth in China. Appl. Geogr. 2016, 71, 44–55. [Google Scholar] [CrossRef]
- Zhang, Y.; He, L.; Jin, W.; Wu, K.; Xu, Y.; Yu, F. Quantitative analysis of the urban expansion models in Changsha-Zhuzhou-Xiangtan metroplan areas. Sci. Geogr. Sin. 2012, 32, 5. [Google Scholar] [CrossRef]
- Liu, L.; Leung, Y. A study of urban expansion of prefectural-level cities in south China using night-time light images. Int. J. Remote Sens. 2015, 36, 5557–5575. [Google Scholar] [CrossRef]
- Jing, L.P.; Zhong, X.M.; Huang, W.H.; Liu, Y.; Wang, M.; Miao, Z.; Zhang, X.P.; Zou, J.; Zheng, B.W.; Chen, C.; et al. HPV genotypes and associated cervical cytological abnormalities in women from the Pearl River Delta region of Guangdong province, China: A cross-sectional study. BMC Infect. Dis. 2014, 14, 388. [Google Scholar] [CrossRef] [PubMed]
- Lefever, D.W. Measuring geographic concentration by means of the standard deviational ellipse. Am. J. Sociol. 1926, 32, 88–94. [Google Scholar] [CrossRef]
- Boukebbab, S.; Boulahlib, M.S. The spatial interactions using the gravity model: Application at the evaluation of transport efficiency at Constantine City, Algeria. Theory Eng. Complex Syst. Dependability 2015, 365, 35–44. [Google Scholar] [CrossRef]
- Gangopadhyay, K.; Basu, B. City size distributions for India and China. Physics A 2009, 388, 2682–2688. [Google Scholar] [CrossRef]
- Wang, H.J.; Lan, Z.M.; Jin, H.; Zhang, C. Study on the spatial evolution of urban system in the middle reaches of Yangtze River urban agglomeration based on night light data. Inquiry Econ. Issues 2017, 3, 107–114. [Google Scholar]
- Deng, X.Z.; Huang, J.K.; Rozelle, S.; Zhang, J.P.; Li, Z.H. Impact of urbanization on cultivated land changes in China. Land Use Policy 2015, 45, 1–7. [Google Scholar] [CrossRef]
- Fang, C.L.; Zhou, C.H.; Wang, Z.P. Sustainable development strategy and priorities of spatially differentiated development of urban agglomerations along the Yangtze River Economic Belt. Prog. Geogr. 2015, 34, 1398–1408. [Google Scholar] [CrossRef]
- The State Council Information Office of the People’s Republic of China. Available online: http://www.scio.gov.cn/34473/34515/Document/1535229/1535229.htm (accessed on 26 September 2017).
- Yu, S.; Sun, Z.; Guo, H.; Zhao, X.; Sun, L.; Wu, M. Monitoring and analyzing the spatial dynamics and patterns of megacities along the Maritime Silk Road. J. Remote Sens. 2017, 21. [Google Scholar] [CrossRef]
- Kusaka, H.; Kimura, F. Coupling a single-layer urban canopy model with a simple atmospheric model: Impact on urban heat island simulation for an idealized case. J. Meteorol. Soc. Jpn. 2004, 82, 67–80. [Google Scholar] [CrossRef]
- Miao, S.G.; Chen, F.; Lemone, M.A.; Tewari, M.; Li, Q.C.; Wang, Y.C. An observational and modeling study of characteristics of urban heat island and boundary layer structures in Beijing. J. Appl. Meteorol. Clim. 2009, 48, 484–501. [Google Scholar] [CrossRef]
- Fang, C.L.; Yu, D.L. Urban agglomeration: An evolving concept of an emerging phenomenon. Landsc. Urban Plan. 2017, 162, 126–136. [Google Scholar] [CrossRef]
- Lu, S.S.; Guan, X.L.; Yu, D.L.; Deng, Y.; Zhou, L.J. Multi-scale analysis of regional inequality based on spatial field model: A case study of China from 2000 to 2012. ISPRS Int. Geo-Inf. 2015, 4, 1982–2003. [Google Scholar] [CrossRef]
- Gao, B.; Huang, Q.X.; He, C.Y.; Sun, Z.X.; Zhang, D. How does sprawl differ across cities in China? A multi-scale investigation using nighttime light and census data. Landsc. Urban Plan. 2016, 148, 89–98. [Google Scholar] [CrossRef]
- Lin, B.B.; Fuller, R.A. Sharing or sparing? How should we grow the world’s cities? J. Appl. Ecol. 2013, 50, 1161–1168. [Google Scholar] [CrossRef]
Figure 1.
The location of the study area: (a) the study area in China; (b) the study area in the YREB area; (c) topography of the study area; and (d) total GDP of the prefectural cities in the MYRB urban agglomeration in 2000, 2008 and 2016. (CC: Chengdu-Chongqing Urban Agglomeration; CY: Urban Agglomeration in the central Yunnan, China; CG: Urban Agglomeration in central Guizhou, China.).
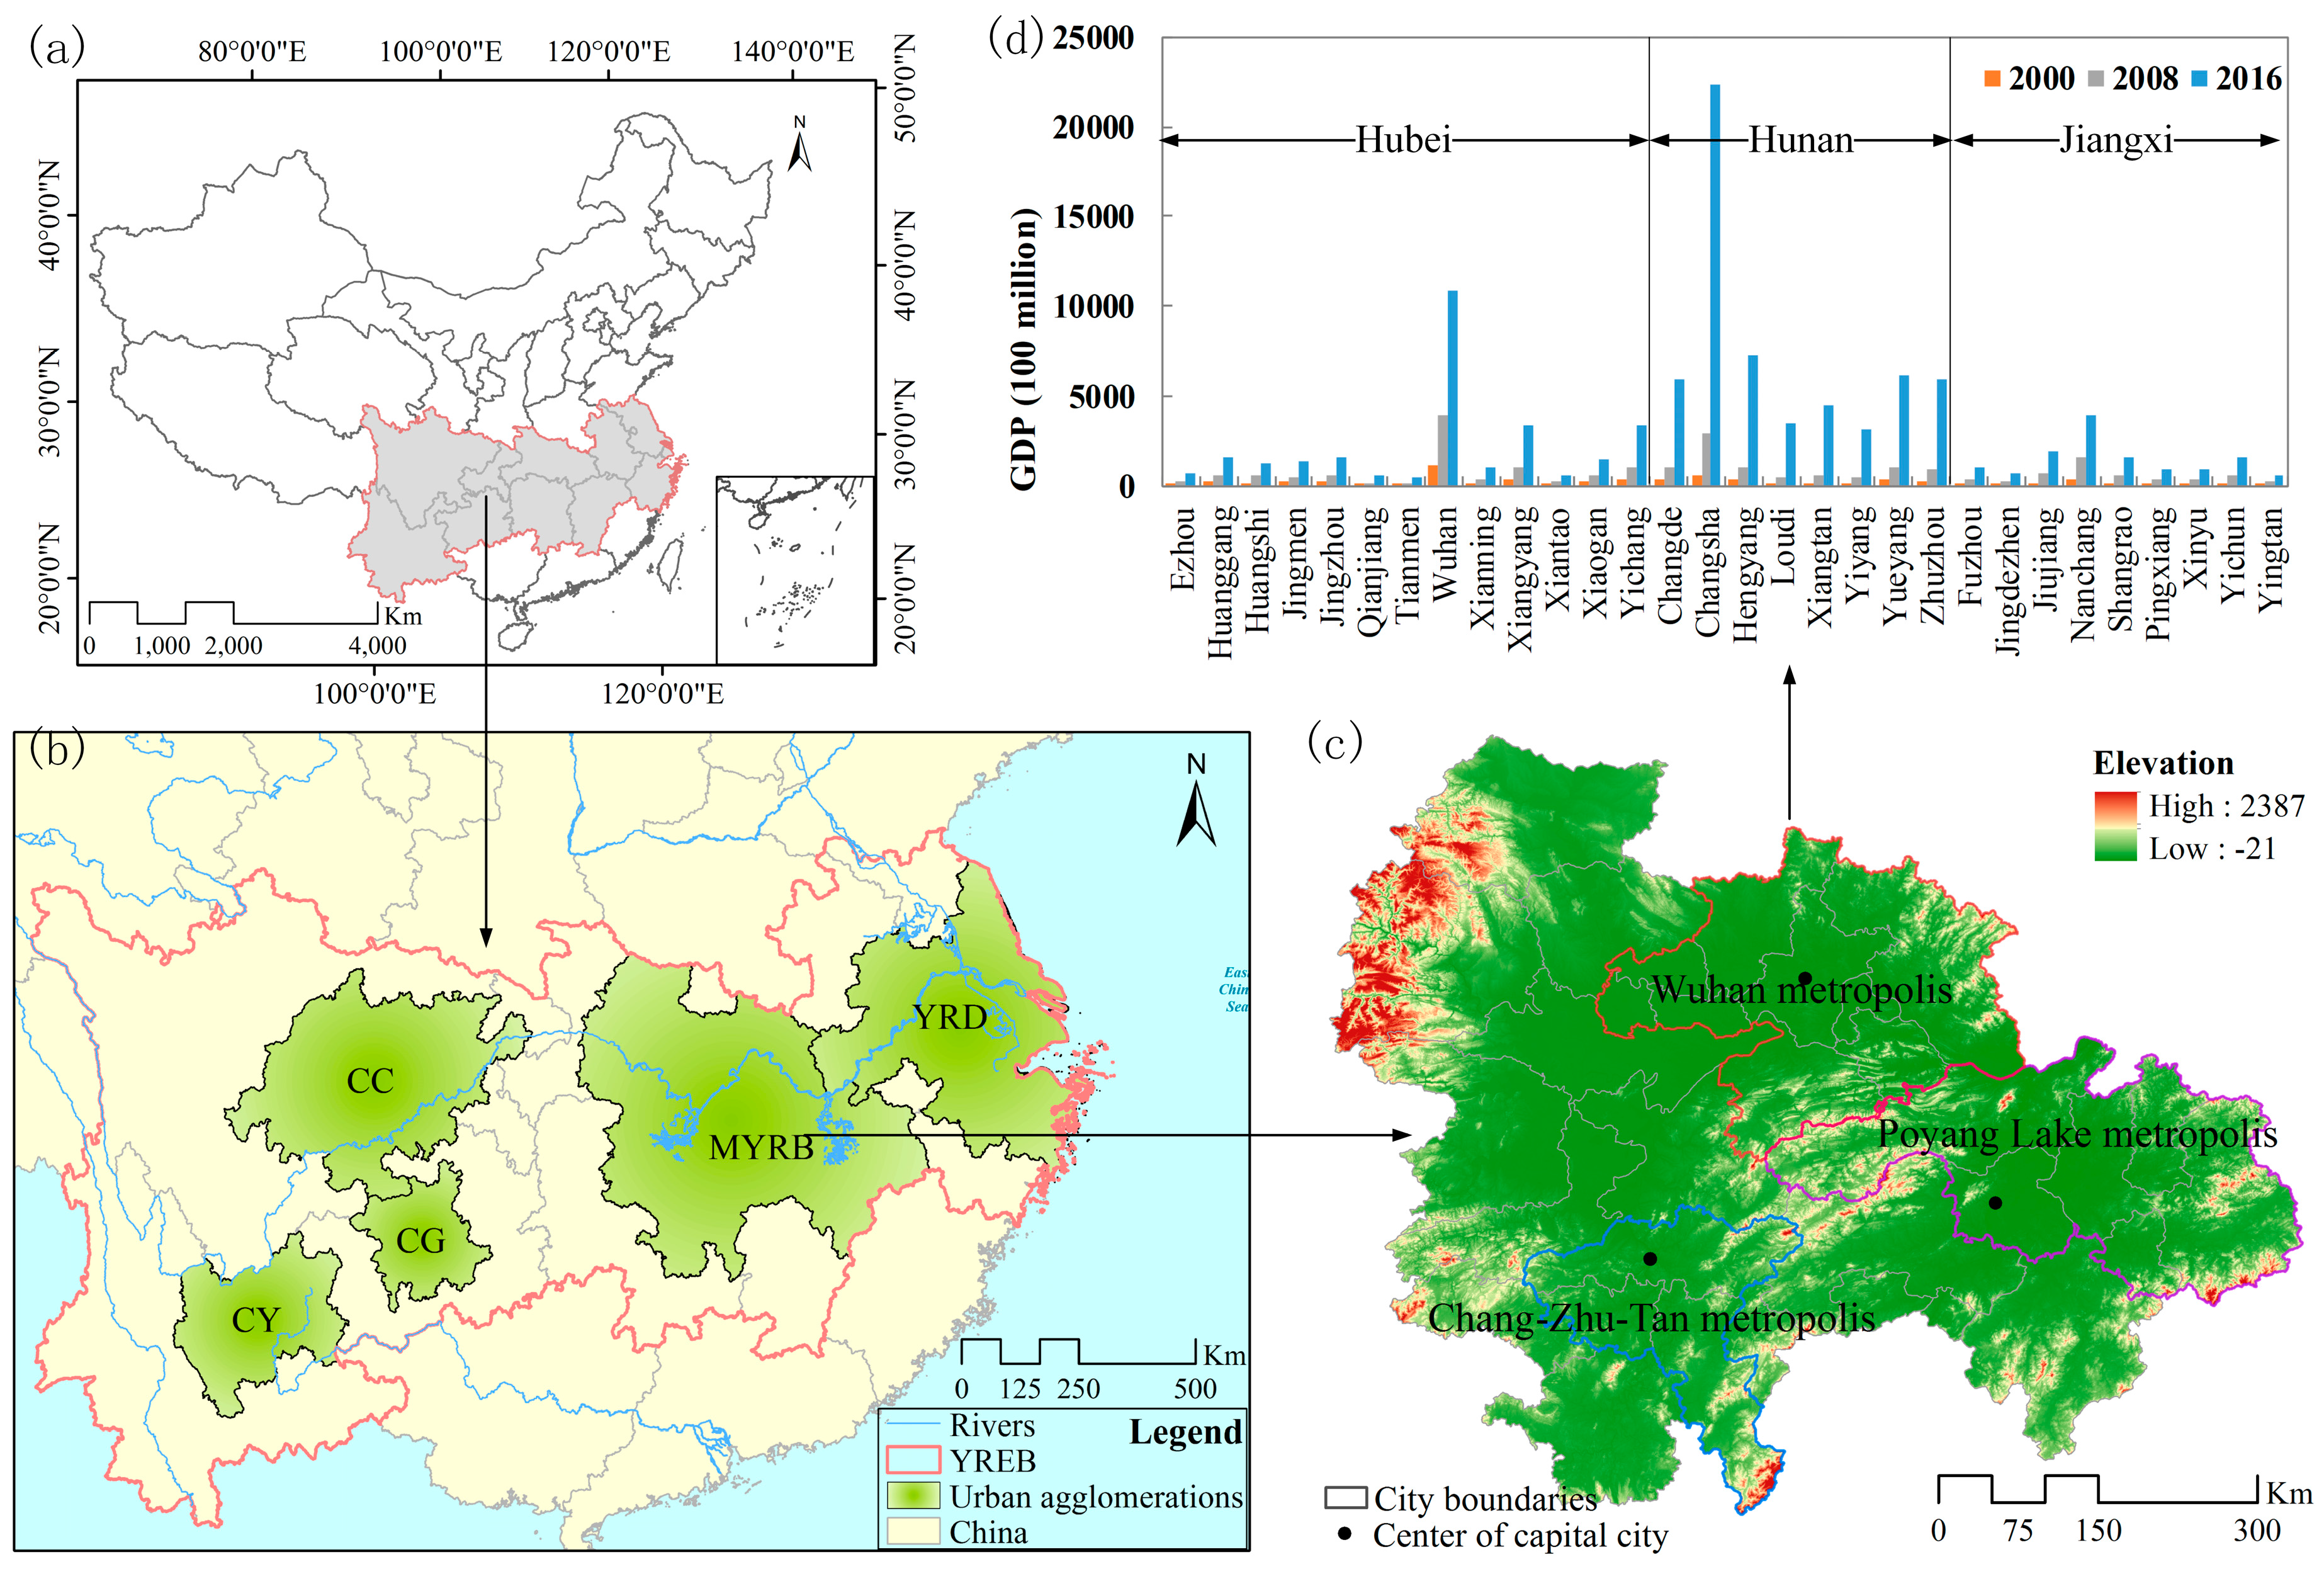
Figure 2.
Framework of data processing and analysis.

Figure 3.
The spatial distribution of the buffer rings in each of the three capital cities.

Figure 4.
The dynamics of urban expansion in MYRB urban agglomeration from 2000 to 2016.
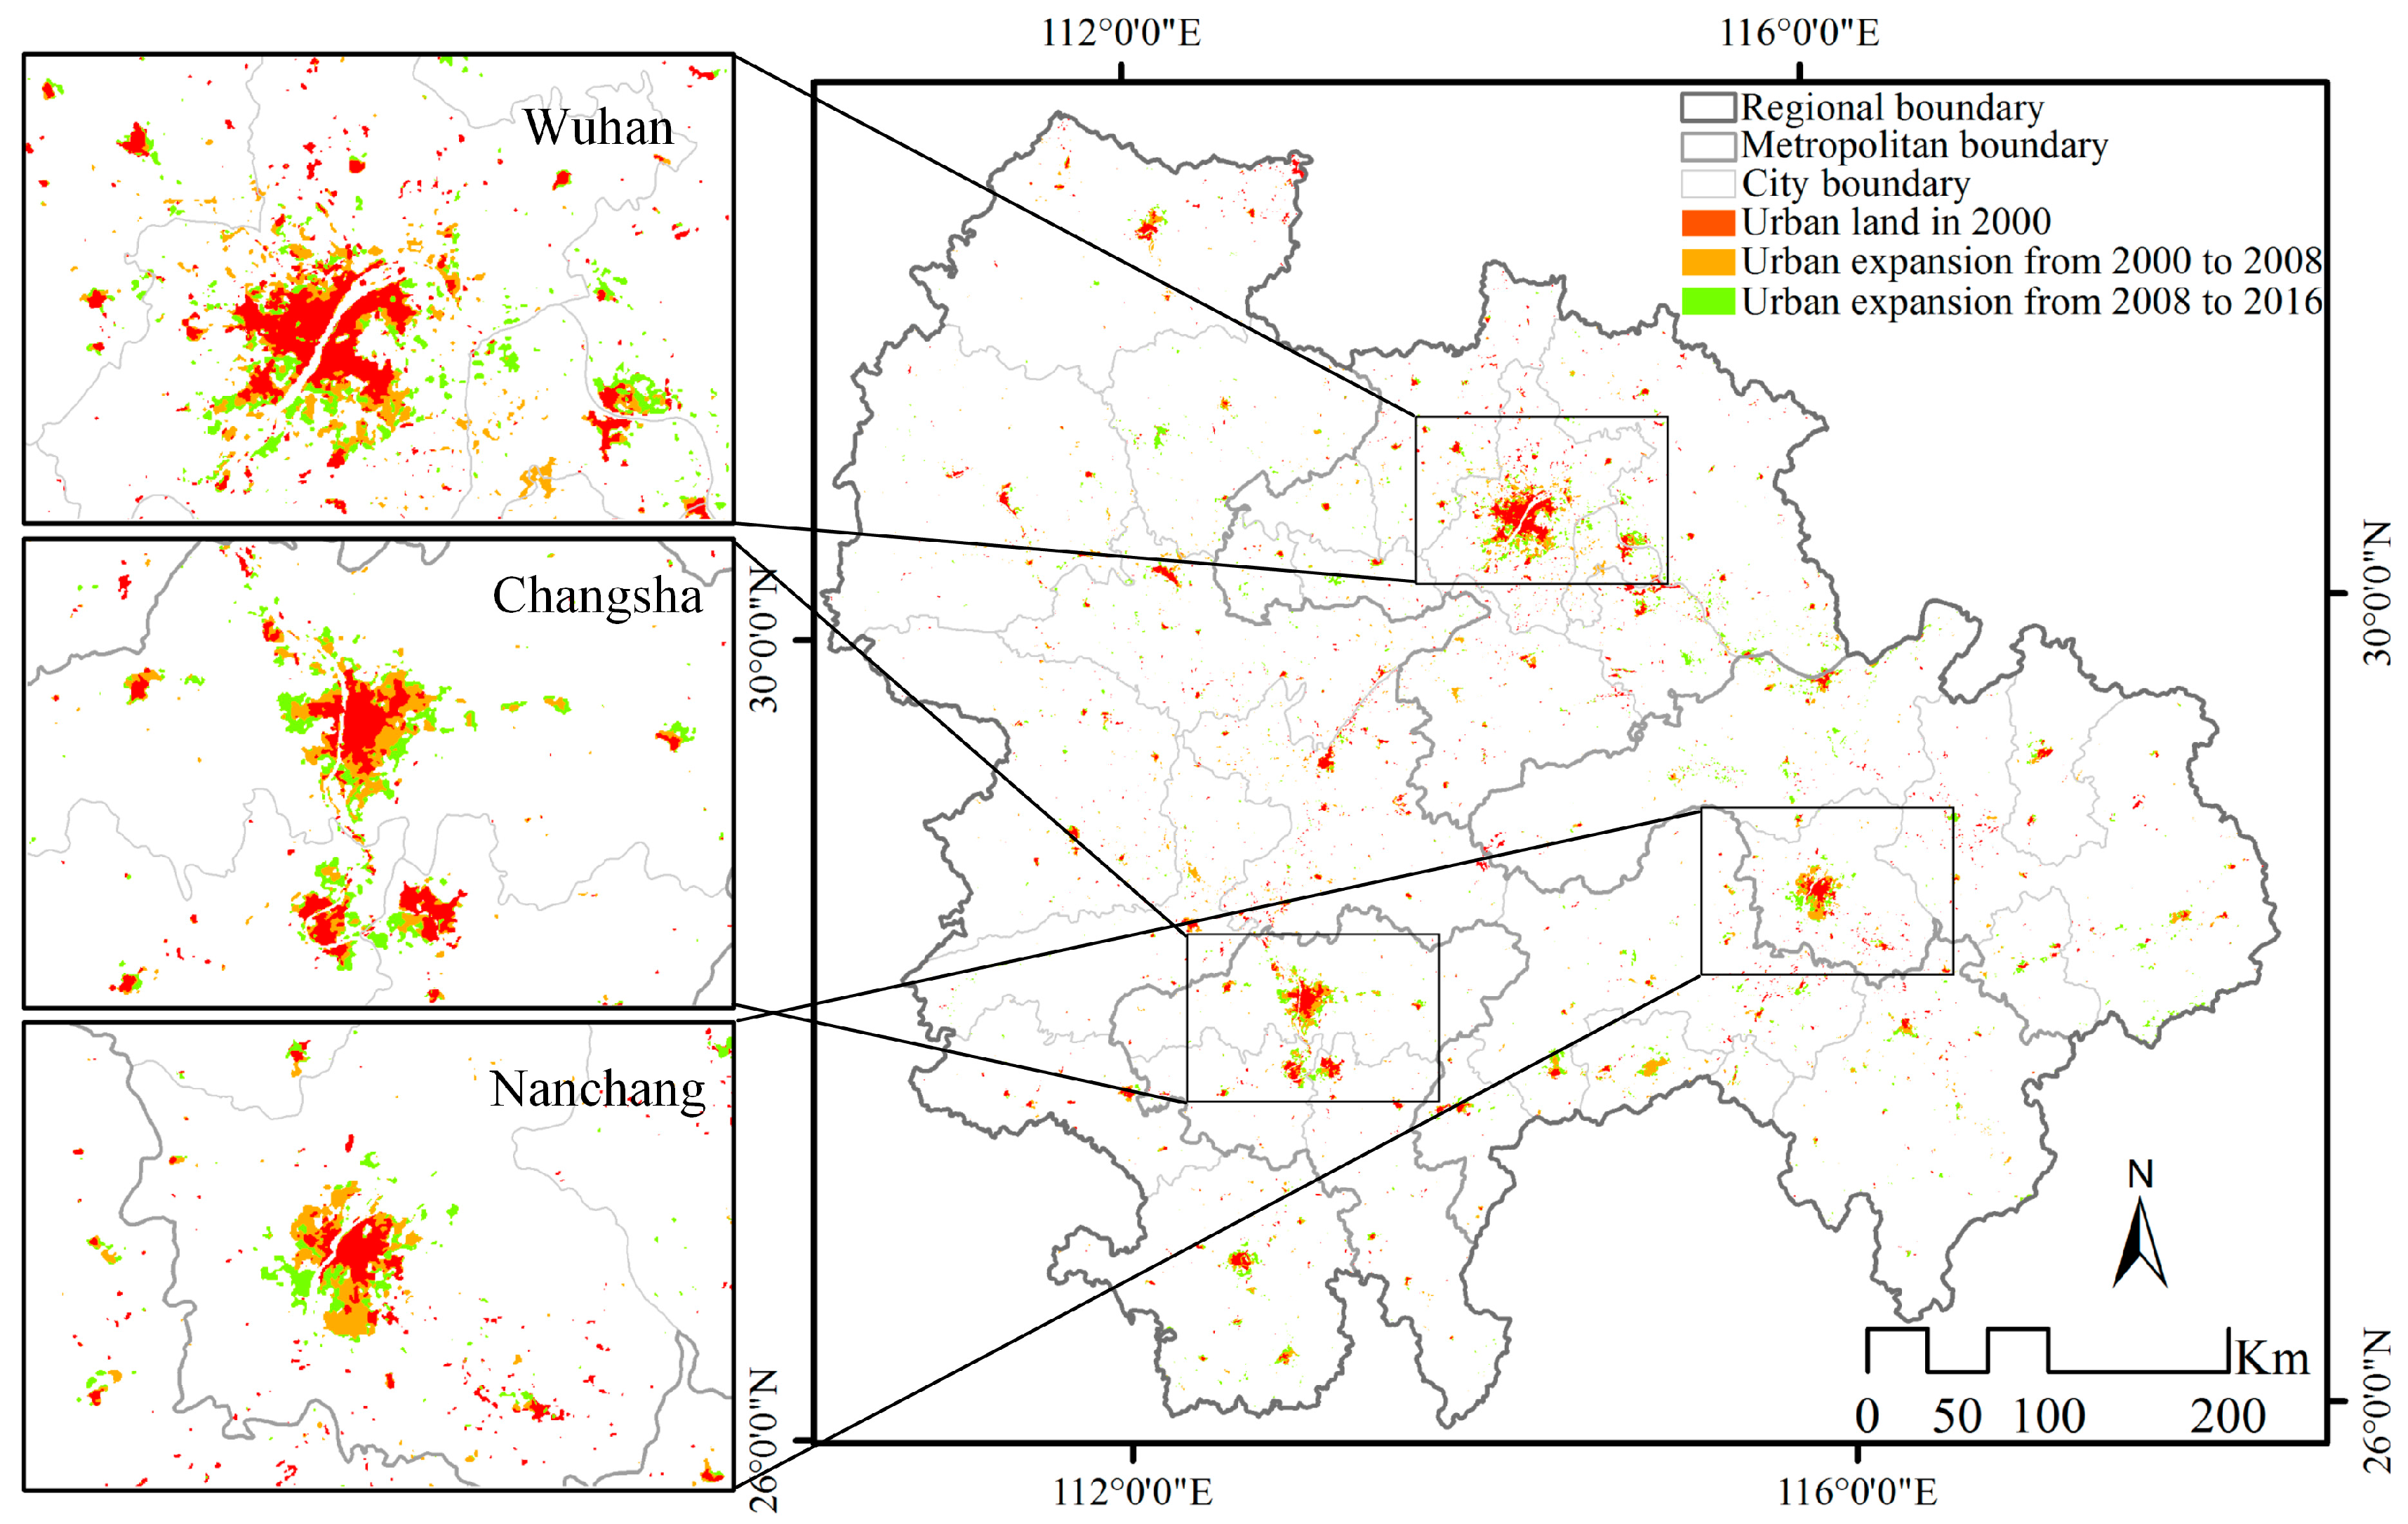
Figure 5.
Urban growth types in the MYRB urban agglomeration from 2000 to 2016.
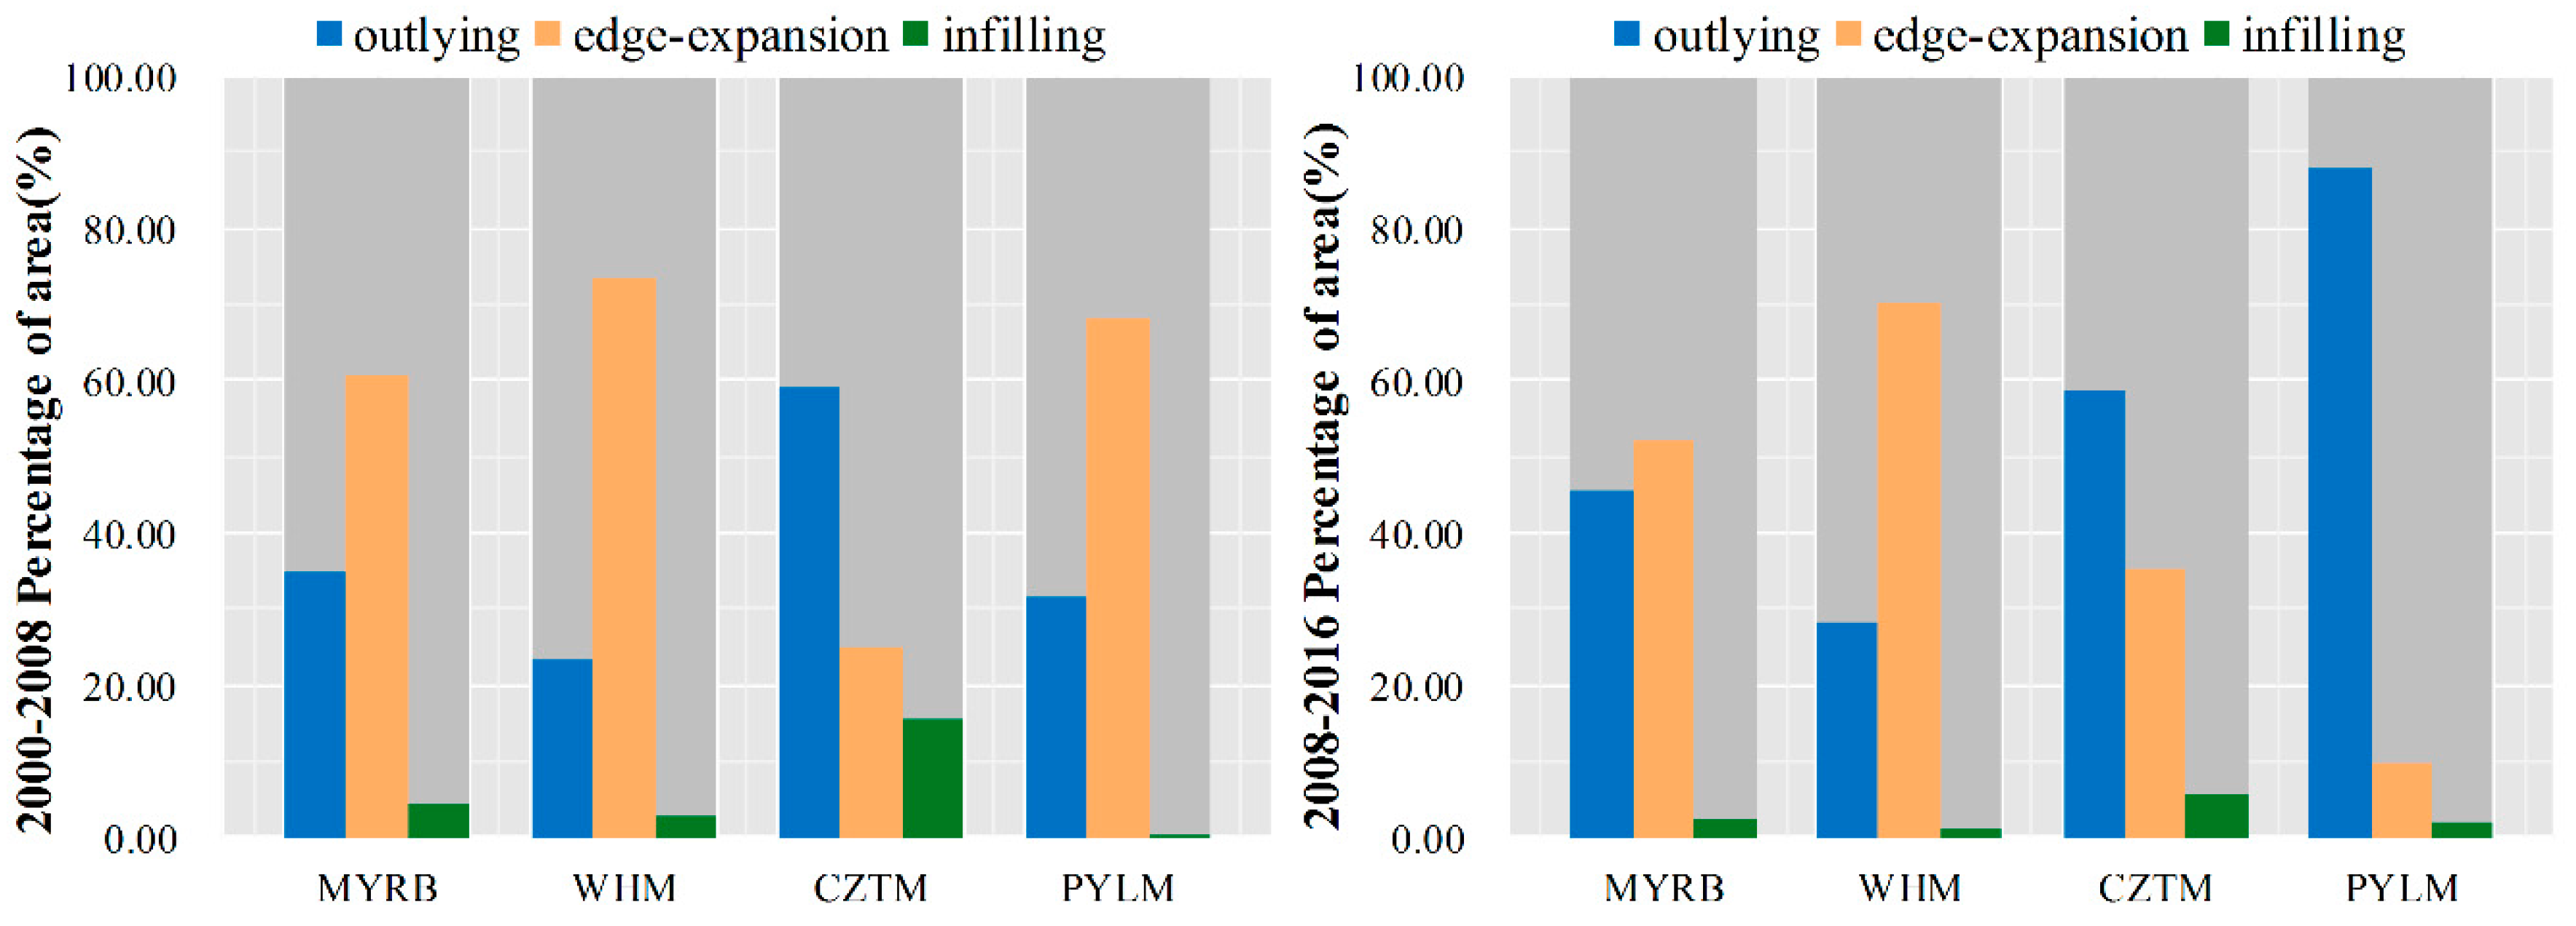
Figure 6.
Landscape metrics for the MYRB and the three metropolitan areas from 2000 to 2016: (a) PLAND (%); (b) PD (per 100 ha); (c) LPI (%); (d) LSI; and (e) AI (%).
Figure 6.
Landscape metrics for the MYRB and the three metropolitan areas from 2000 to 2016: (a) PLAND (%); (b) PD (per 100 ha); (c) LPI (%); (d) LSI; and (e) AI (%).

Figure 7.
Expansion of urban land of the 31 cities in the MYRB from 2000 to 2016.

Figure 8.
Landscape metrics for the 31 cities during 2000–2016.

Figure 9.
Urban expansion rate of the three cities from 2000 to 2016.

Figure 10.
Spatial distributions of the three urban expansion types and the composition (%) of the three types of expansion for the number of patches and area of newly developed urban patches for the three capital cities.
Figure 10.
Spatial distributions of the three urban expansion types and the composition (%) of the three types of expansion for the number of patches and area of newly developed urban patches for the three capital cities.
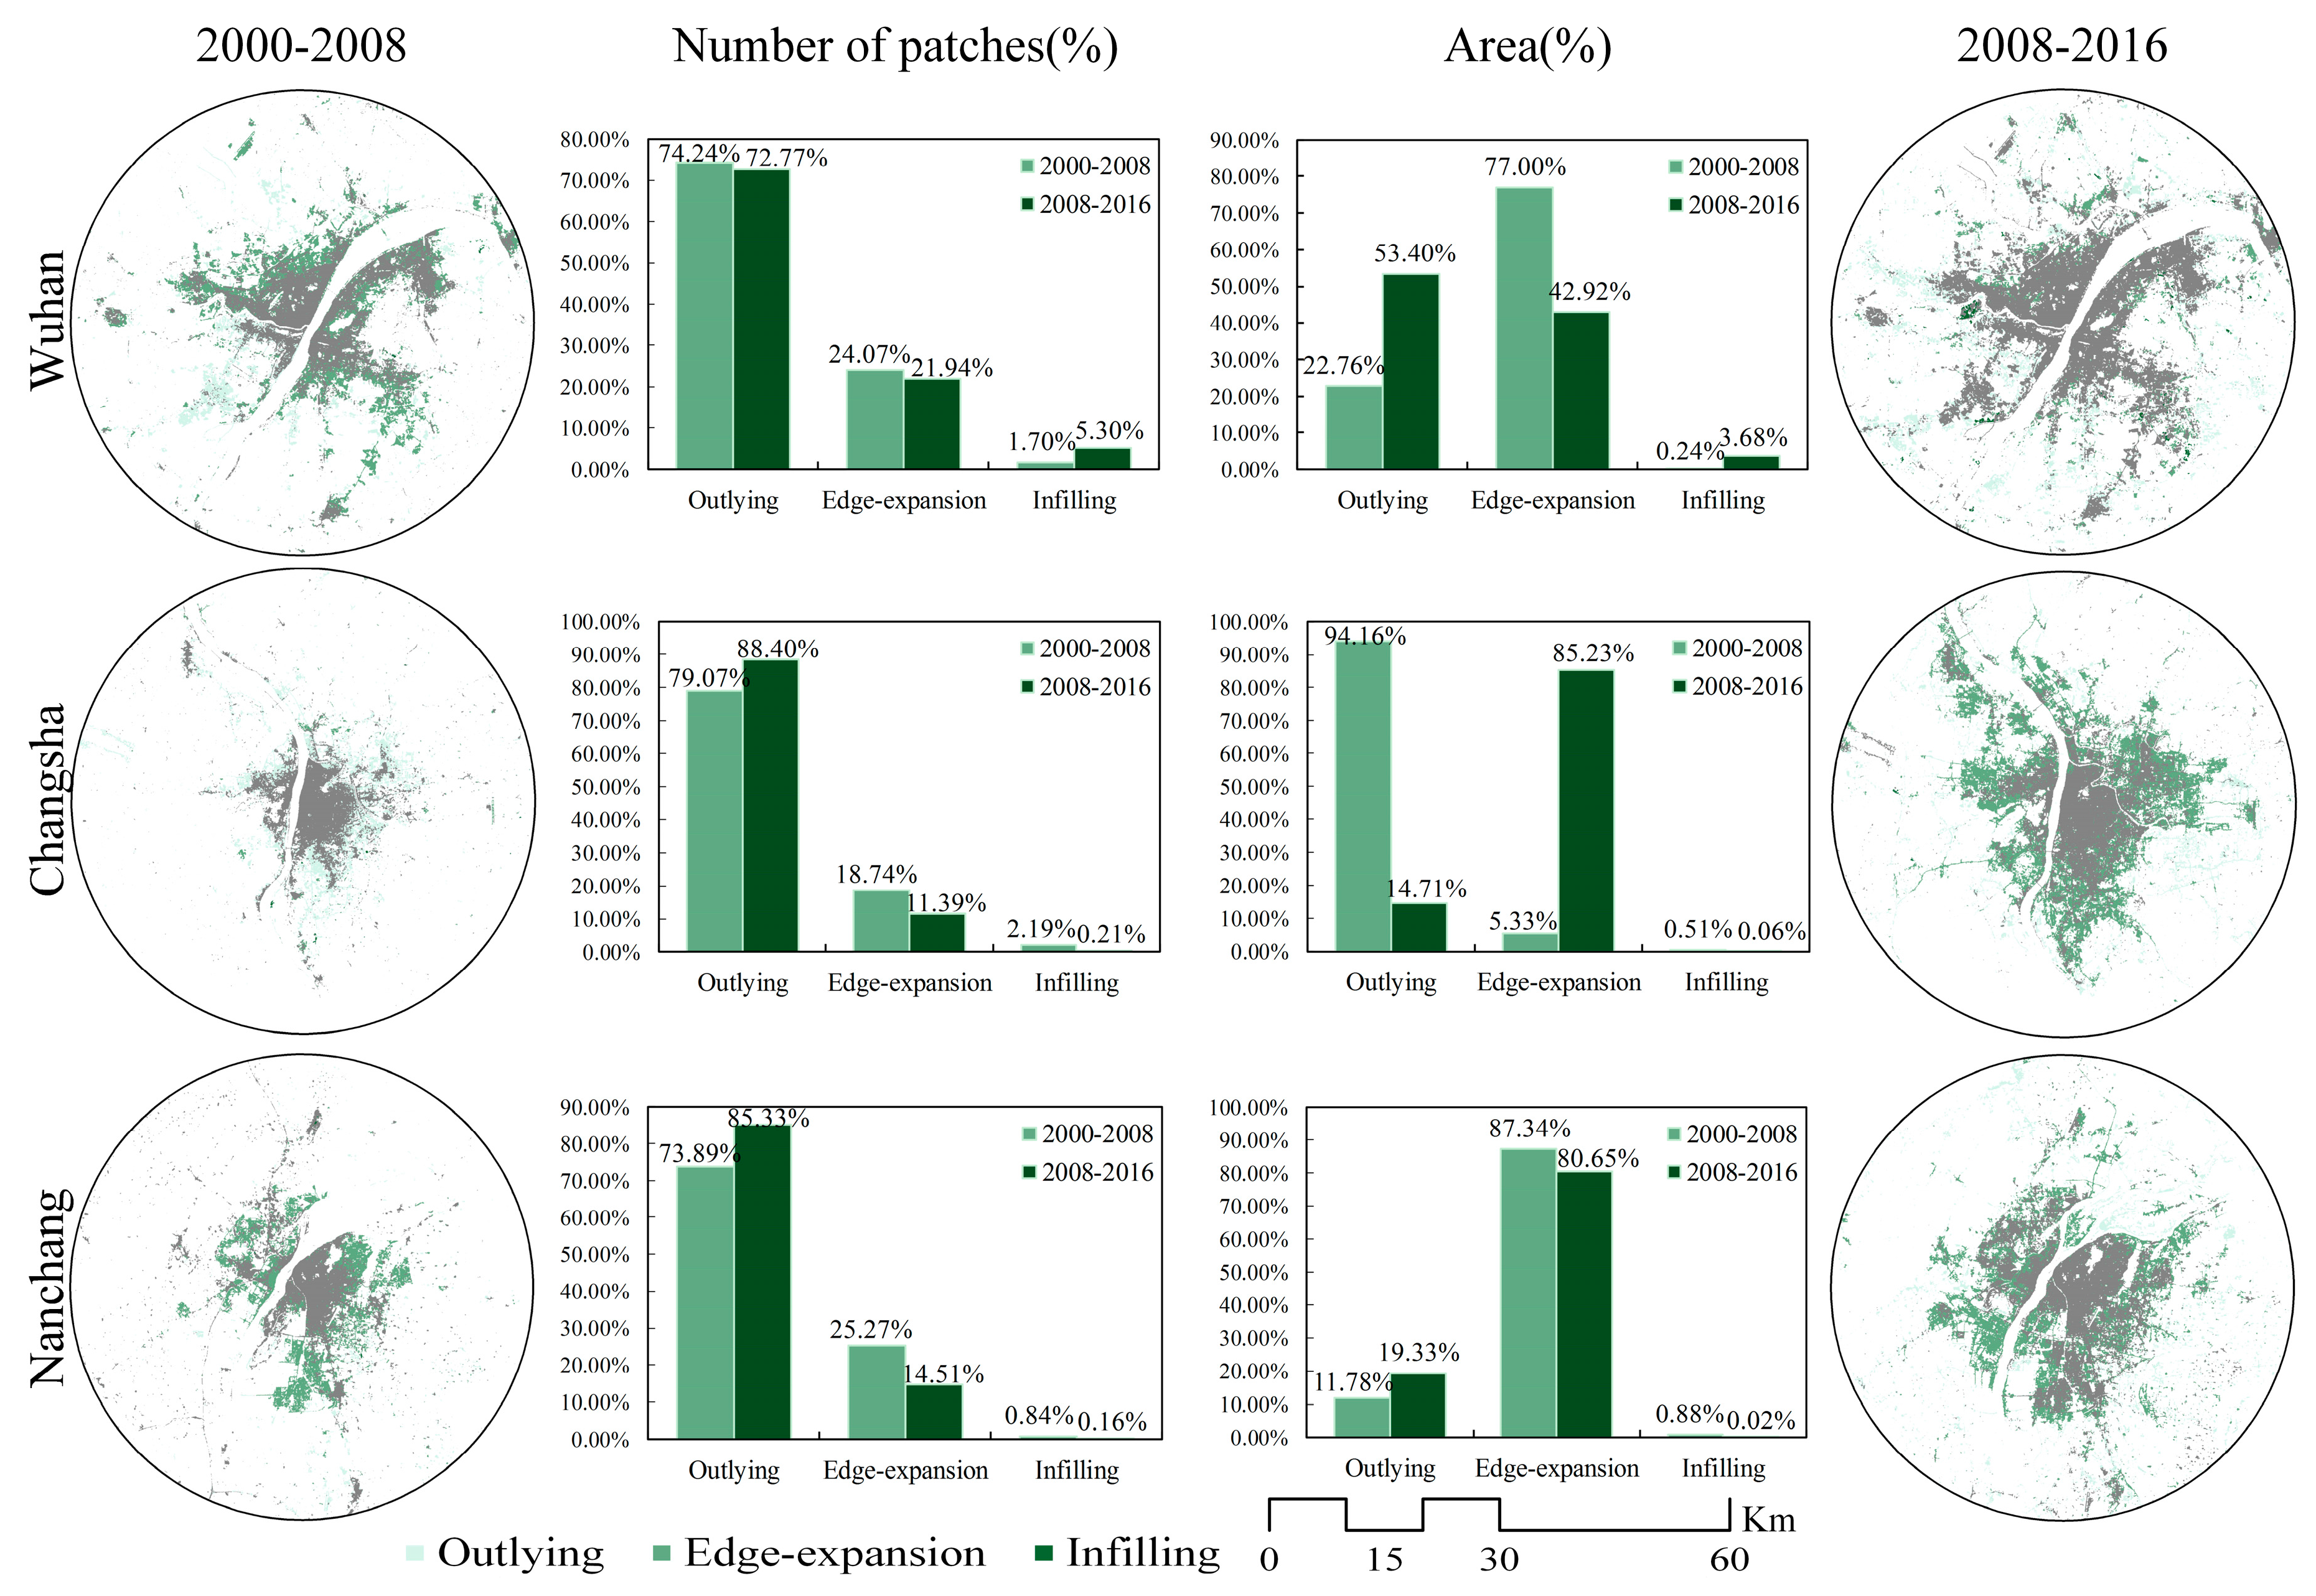
Figure 11.
Landscape metrics for the urban land area of Wuhan, Changsha and Nanchang at different distances (km) from the city center from 2000 to 2016.
Figure 11.
Landscape metrics for the urban land area of Wuhan, Changsha and Nanchang at different distances (km) from the city center from 2000 to 2016.

Figure 12.
Spatial evolution of the socioeconomic situation: (a) SDE of urban expansion; (b) SDE of the population and GDP during 2000–2016.
Figure 12.
Spatial evolution of the socioeconomic situation: (a) SDE of urban expansion; (b) SDE of the population and GDP during 2000–2016.

Figure 13.
The interactions among the cities within the MYRB by the gravity model.


Table 1.
RS data used in this study.
| MODIS Data | ||||||
| Product name | MOD09A1 | MOD09Q1 | MOD13Q1 | |||
| Tile | h27v05, h27v06, h28v05, h28v06 | |||||
| Band | bands 3–7 | bands 1–2 | EVI | |||
| Resolution | 500 m | 250 m | 250 m | |||
| DOY (Date) | 2000 | 201 (20 July–27 July) | 201 (20 July–27 July) | 001 (1 January–8 January), 097 (7 April–14 April), 193 (12 July–19 July), 273 (30 September–7 October) | ||
| 2008 | 217 (5 August–12 August) | 217 (5 August–12 August) | 001 (1 January–8 January), 097 (7 April–14 April), 193 (12 July–19 July), 273 (30 September–7 October) | |||
| 2016 | 201 (20 July–27 July) | 201 (20 July–27 July) | 001 (1 January–8 January), 097 (7 April–14 April), 193 (12 July–19 July), 273 (30 September–7 October) | |||
| Landsat data | ||||||
| Periods | Wuhan | Changsha | Nanchang | |||
| Path/row | DOY (Date) | Path/row | DOY (Date) | Path/row | DOY (Date) | |
| 2000 | 123/38 123/39 122/39 | 257 (14 September 2000) 257 (14 September 2000) 282 (9 October 2000) | 122/40 123/40 123/41 124/40 124/41 | 258 (15 September 2000) 267 (24 September 2001) 251 (8 September 2001) 258 (15 September 2001) 258 (15 September 2001) | 121/40 122/40 | 253 (10 September 2001) 258 (15 September 2000) |
| 2008 | 123/38 123/39 122/39 | 212 (31 July 2007) 212 (31 July 2007) 189 (8 July 2007) | 123/40 123/41 124/40 124/41 | 212 (31 July 2007) 263 (20 September 2008) 219 (7 August 2007) 219 (7 August 2007) | 121/40 122/40 | 206 (25 July 2007) 232 (20 August 2008) |
| 2016 | 123/38 123/39 122/39 | 205 (24 July 2016) 205 (24 July 2016) 214 (2 August 2016) | 123/40 123/41 124/40 124/41 | 205 (24 July 2016) 205 (24 July 2016) 212 (31 July 2016) 212 (31 July 2016) | 121/40 122/40 | 175 (24 June 2016) 134 (14 May 2016) |
Table 2.
Results of the commission error, omission error, overall accuracy, and kappa coefficient for assessing the urban category in each image (MOD: MODIS; WH: Wuhan; CS: Changsha; NC: Nanchang).
Table 2.
Results of the commission error, omission error, overall accuracy, and kappa coefficient for assessing the urban category in each image (MOD: MODIS; WH: Wuhan; CS: Changsha; NC: Nanchang).
| 2000 | 2008 | 2016 | ||||||||||
|---|---|---|---|---|---|---|---|---|---|---|---|---|
| MOD | Landsat | MOD | Landsat | MOD | Landsat | |||||||
| WH | CS | NC | WH | CS | NC | WH | CS | NC | ||||
| CE (%) | 6.27 | 1.87 | 2.23 | 2.32 | 3.09 | 1.57 | 1.39 | 1.32 | 2.67 | 1.73 | 1.94 | 1.50 |
| OE (%) | 9.13 | 2.48 | 4.07 | 2.43 | 6.30 | 1.32 | 3.63 | 2.28 | 3.63 | 2.71 | 3.83 | 2.28 |
| OA (%) | 78.34 | 89.01 | 89.10 | 89.52 | 90.74 | 94.68 | 89.56 | 92.09 | 92.50 | 93.10 | 89.51 | 89.30 |
| KC | 0.70 | 0.88 | 0.88 | 0.89 | 0.87 | 0.92 | 0.88 | 0.89 | 0.90 | 0.88 | 0.88 | 0.88 |
Table 3.
Landscape metrics used in this study.
| Acronym | Name of Landscape Metric (Units) | Description | |
|---|---|---|---|
| Area metrics | PLAND | Percentage of Landscape (%) | The percentage the landscape of the corresponding patch type. |
| LPI | Largest patch index (%) | Proportion of total area occupied by the largest patch of a patch type. | |
| Shape metrics | LSI | Landscape Shape Index | Provides a standardized measure of total edge or edge density that adjusts for the size of the landscape. |
| Density metrics | PD | Patch density (Number/100 ha) | The number of patches of per 100 ha. |
| AI | Aggregation Index (%) | The degree of fragmentation of a land cover type or a landscape. |
Table 4.
Criteria for the categorization of city sizes.
| City Size | Urban Population (Million) | City Count |
|---|---|---|
| Super city | >10 | 1 |
| Megacity | 5–10 | 7 |
| Large city | 1–5 | 12 |
| Medium city | 0.5–1 | 4 |
| Small city | <0.5 | 7 |
Table 5.
Magnitude of urban expansion in the MYRB urban agglomeration for the five categories of cities.
Table 5.
Magnitude of urban expansion in the MYRB urban agglomeration for the five categories of cities.
| Year/Period | Super-City | Megacity | Large City | Medium City | Small City |
|---|---|---|---|---|---|
| AI (km2/year) | |||||
| 2000–2008 | 21.646 | 32.098 | 17.430 | 15.952 | 19.509 |
| 2008–2016 | 1.234 | 33.179 | 22.308 | 29.346 | 32.642 |
| 2000–2016 | 11.440 | 32.639 | 19.869 | 22.649 | 26.076 |
| AGR (%) | |||||
| 2000–2008 | 3.206 | 2.449 | 1.825 | 3.020 | 4.751 |
| 2008–2016 | 0.158 | 2.111 | 2.008 | 4.199 | 5.364 |
| 2000–2016 | 1.671 | 2.279 | 1.916 | 3.608 | 5.057 |
| Rs (%) | |||||
| 2000–2008 | 3.590 | 2.669 | 1.946 | 3.359 | 5.620 |
| 2008–2016 | 0.159 | 2.021 | 2.155 | 4.871 | 6.487 |
| 2000–2016 | 1.898 | 2.714 | 2.218 | 4.769 | 7.513 |
| Is (%) | |||||
| 2000–2008 | 0.256 | 0.029 | 0.018 | 0.031 | 0.036 |
| 2008–2016 | 0.015 | 0.030 | 0.022 | 0.058 | 0.061 |
| 2000–2016 | 0.135 | 0.029 | 0.020 | 0.045 | 0.049 |
© 2017 by the authors. Licensee MDPI, Basel, Switzerland. This article is an open access article distributed under the terms and conditions of the Creative Commons Attribution (CC BY) license (http://creativecommons.org/licenses/by/4.0/).
Share and Cite
MDPI and ACS Style
Liu, D.; Chen, N. Satellite Monitoring of Urban Land Change in the Middle Yangtze River Basin Urban Agglomeration, China between 2000 and 2016. Remote Sens. 2017, 9, 1086. https://doi.org/10.3390/rs9111086
AMA Style
Liu D, Chen N. Satellite Monitoring of Urban Land Change in the Middle Yangtze River Basin Urban Agglomeration, China between 2000 and 2016. Remote Sensing. 2017; 9(11):1086. https://doi.org/10.3390/rs9111086
Chicago/Turabian StyleLiu, Dandan, and Nengcheng Chen. 2017. "Satellite Monitoring of Urban Land Change in the Middle Yangtze River Basin Urban Agglomeration, China between 2000 and 2016" Remote Sensing 9, no. 11: 1086. https://doi.org/10.3390/rs9111086
Note that from the first issue of 2016, this journal uses article numbers instead of page numbers. See further details here.