Spatial Recognition of the Urban-Rural Fringe of Beijing Using DMSP/OLS Nighttime Light Data

1
Northwest Institute of Eco-Environment and Resources, CAS, Lanzhou 730000, China
2
School of civil engineering, Lanzhou University of Technology, Lanzhou 730050, China
3
University of Chinese Academy of Sciences, Beijing 100049, China
4
Chongqing Engineering Research Center for Remote Sensing Big Data Application, Southwest University, Chongqing 400715, China
*
Author to whom correspondence should be addressed.
Remote Sens. 2017, 9(11), 1141; https://doi.org/10.3390/rs9111141
Submission received: 20 August 2017
/
Revised: 26 October 2017
/
Accepted: 31 October 2017
/
Published: 7 November 2017
Abstract
:Spatial identification of the urban-rural fringes is very significant for deeply understanding the development processes and regulations of urban space and guiding urban spatial development in the future. Traditionally, urban-rural fringe areas are identified using statistical analysis methods that consider indexes from single or multiple factors, such as population densities, the ratio of building land, the proportion of the non-agricultural population, and economic levels. However, these methods have limitations, for example, the statistical data are not continuous, the statistical standards are not uniform, the data is seldom available in real time, and it is difficult to avoid issues on the statistical effects from edges of administrative regions or express the internal differences of these areas. This paper proposes a convenient approach to identify the urban-rural fringe using nighttime light data of DMSP/OLS images. First, a light characteristics–combined value model was built in ArcGIS 10.3, and the combined characteristics of light intensity and the degree of light intensity fluctuation are analyzed in the urban, urban-rural fringe, and rural areas. Then, the Python programming language was used to extract the breakpoints of the characteristic combination values of the nighttime light data in 360 directions taking Tian An Men as the center. Finally, the range of the urban-rural fringe area is identified. The results show that the urban-rural fringe of Beijing is mainly located in the annular band around Tian An Men. The average inner radius is 19 km, and the outer radius is 26 km. The urban-rural fringe includes the outer portions of the four city center districts, which are the Chaoyang District, Haidian District, Fengtai District, and Shijingshan District and the part area border with Daxing District, Tongzhou District, Changping District, Mentougou District, Shunyi District, and Fangshan District. The area of the urban-rural fringe is approximately 765 km2. This paper provides a convenient, feasible, and real-time approach for the identification of the urban-rural fringe areas. It is very significant to extract the urban-rural fringes.
1. Introduction
The urban-rural fringe is the transitional region between city and rural areas where various social and economic factors intensely transform [1]. It is transitional, gradual, and dynamic in numerous aspects, such as population, economy, land use, and ecology [2,3,4]. Many problems have arisen in urban-rural fringes during the process of the urbanization in China. e.g., the contradiction between urban expansion and agricultural land protection, conflicts of interest in land expropriation, instability in land use changes, over-accumulation of large floating population with complex identities leading to serious crime and social harmfulness, arbitrary and aimless development and construction, and backward public infrastructure [5,6]. Thus, these areas can be regarded as the ones with the most land use problems and acute contradictions in the world [7,8]. Urban-rural fringes are also located at the intersection of sensitive zones of social contradiction and conflict in China. Spatial identification of the urban-rural fringes is very significant for solving social problems, optimizing urban land management, and promoting urban and rural integration.
Many approaches have been used to recognize the urban-rural fringe area, including quantitative methods such as measuring the distance to the built-up area and the population density standard [9,10]. Other methods include field surveys [7,8], statistical analysis methods using single or multiple factors [11,12,13], and mutation point analysis methods using remote sensing images [14]. The traditional methods mostly use the single or multiple comprehensive index factors: for example statistical analysis of parameters, population density, construction land ratio, proportion of the non-agricultural population, landscape disorder degree, and economic level [15,16,17]. In these studies, urban-rural fringes were identified using breakpoints analysis, information entropy, thresholds, and landscape disorder degree discrimination [18,19,20,21]. However, these methods have deficiencies: for example, the statistical data are not continuous, the statistical standards are not uniform, the data is seldom available in real time, and it is difficult to overcome problems caused by the fact that most data sets are available in the form of mean values for administrative regions, making it impossible to express the internal differences of the areas.
Nighttime light data is available in real time, which is not collected by administrative boundaries Therefore, there are no statistical limits to overcome the data continuity problem [22]. DMSP/OLS nighttime light images can be used to characterize human activities and has become a data source for monitoring and researching human activities [23] and used in urban expansion [24,25,26,27], estimation of social and economic factors [28,29,30], and other research fields, including environmental, disasters, fisheries, and energy [31,32,33,34].
Currently, most research on urban spatial distributions using nighttime light data has mainly focused on urban expansion. There are few studies on the identification of urban-rural fringes. This paper proposes a convenient approach to identify the urban-rural fringe using the DMSP/OLS nighttime light data. We used light intensity and fluctuant degree to construct a model and extracted the breakpoints of the model in 360 directions in Beijing to recognize the urban-rural fringe.
2. Study Area and Materials
2.1. Introduction of the Study Area
As one of the world’s largest cities, Beijing is the capital and the economic, political, cultural and international communication center of China. It has an important influence on the world and also has a large number of world cultural heritage sites. The center of Beijing is located at 39°54′ north and 116°23′ east, and it is on the northwest edge of the North China Plain. Beijing has a typical semi-humid continental climate of the northern hemisphere; the spring and autumn are short, the summer is hot and rainy, and the winter is cold and dry. The average elevation of the main city area is 43.5 m, the elevation of the plain in Beijing is 20–60 m, the mountain elevation is 1000–1500 m, and the area of the city is 16,411 km2. The plain area is 6339 km2, accounting for 38.6% of the total area, and the mountains area is 10,072 km2, accounting for 61.4%. The resident population of Beijing is 21,729,000 in 2016, and the population density is 1323 persons/ km2 in 2015 [35].
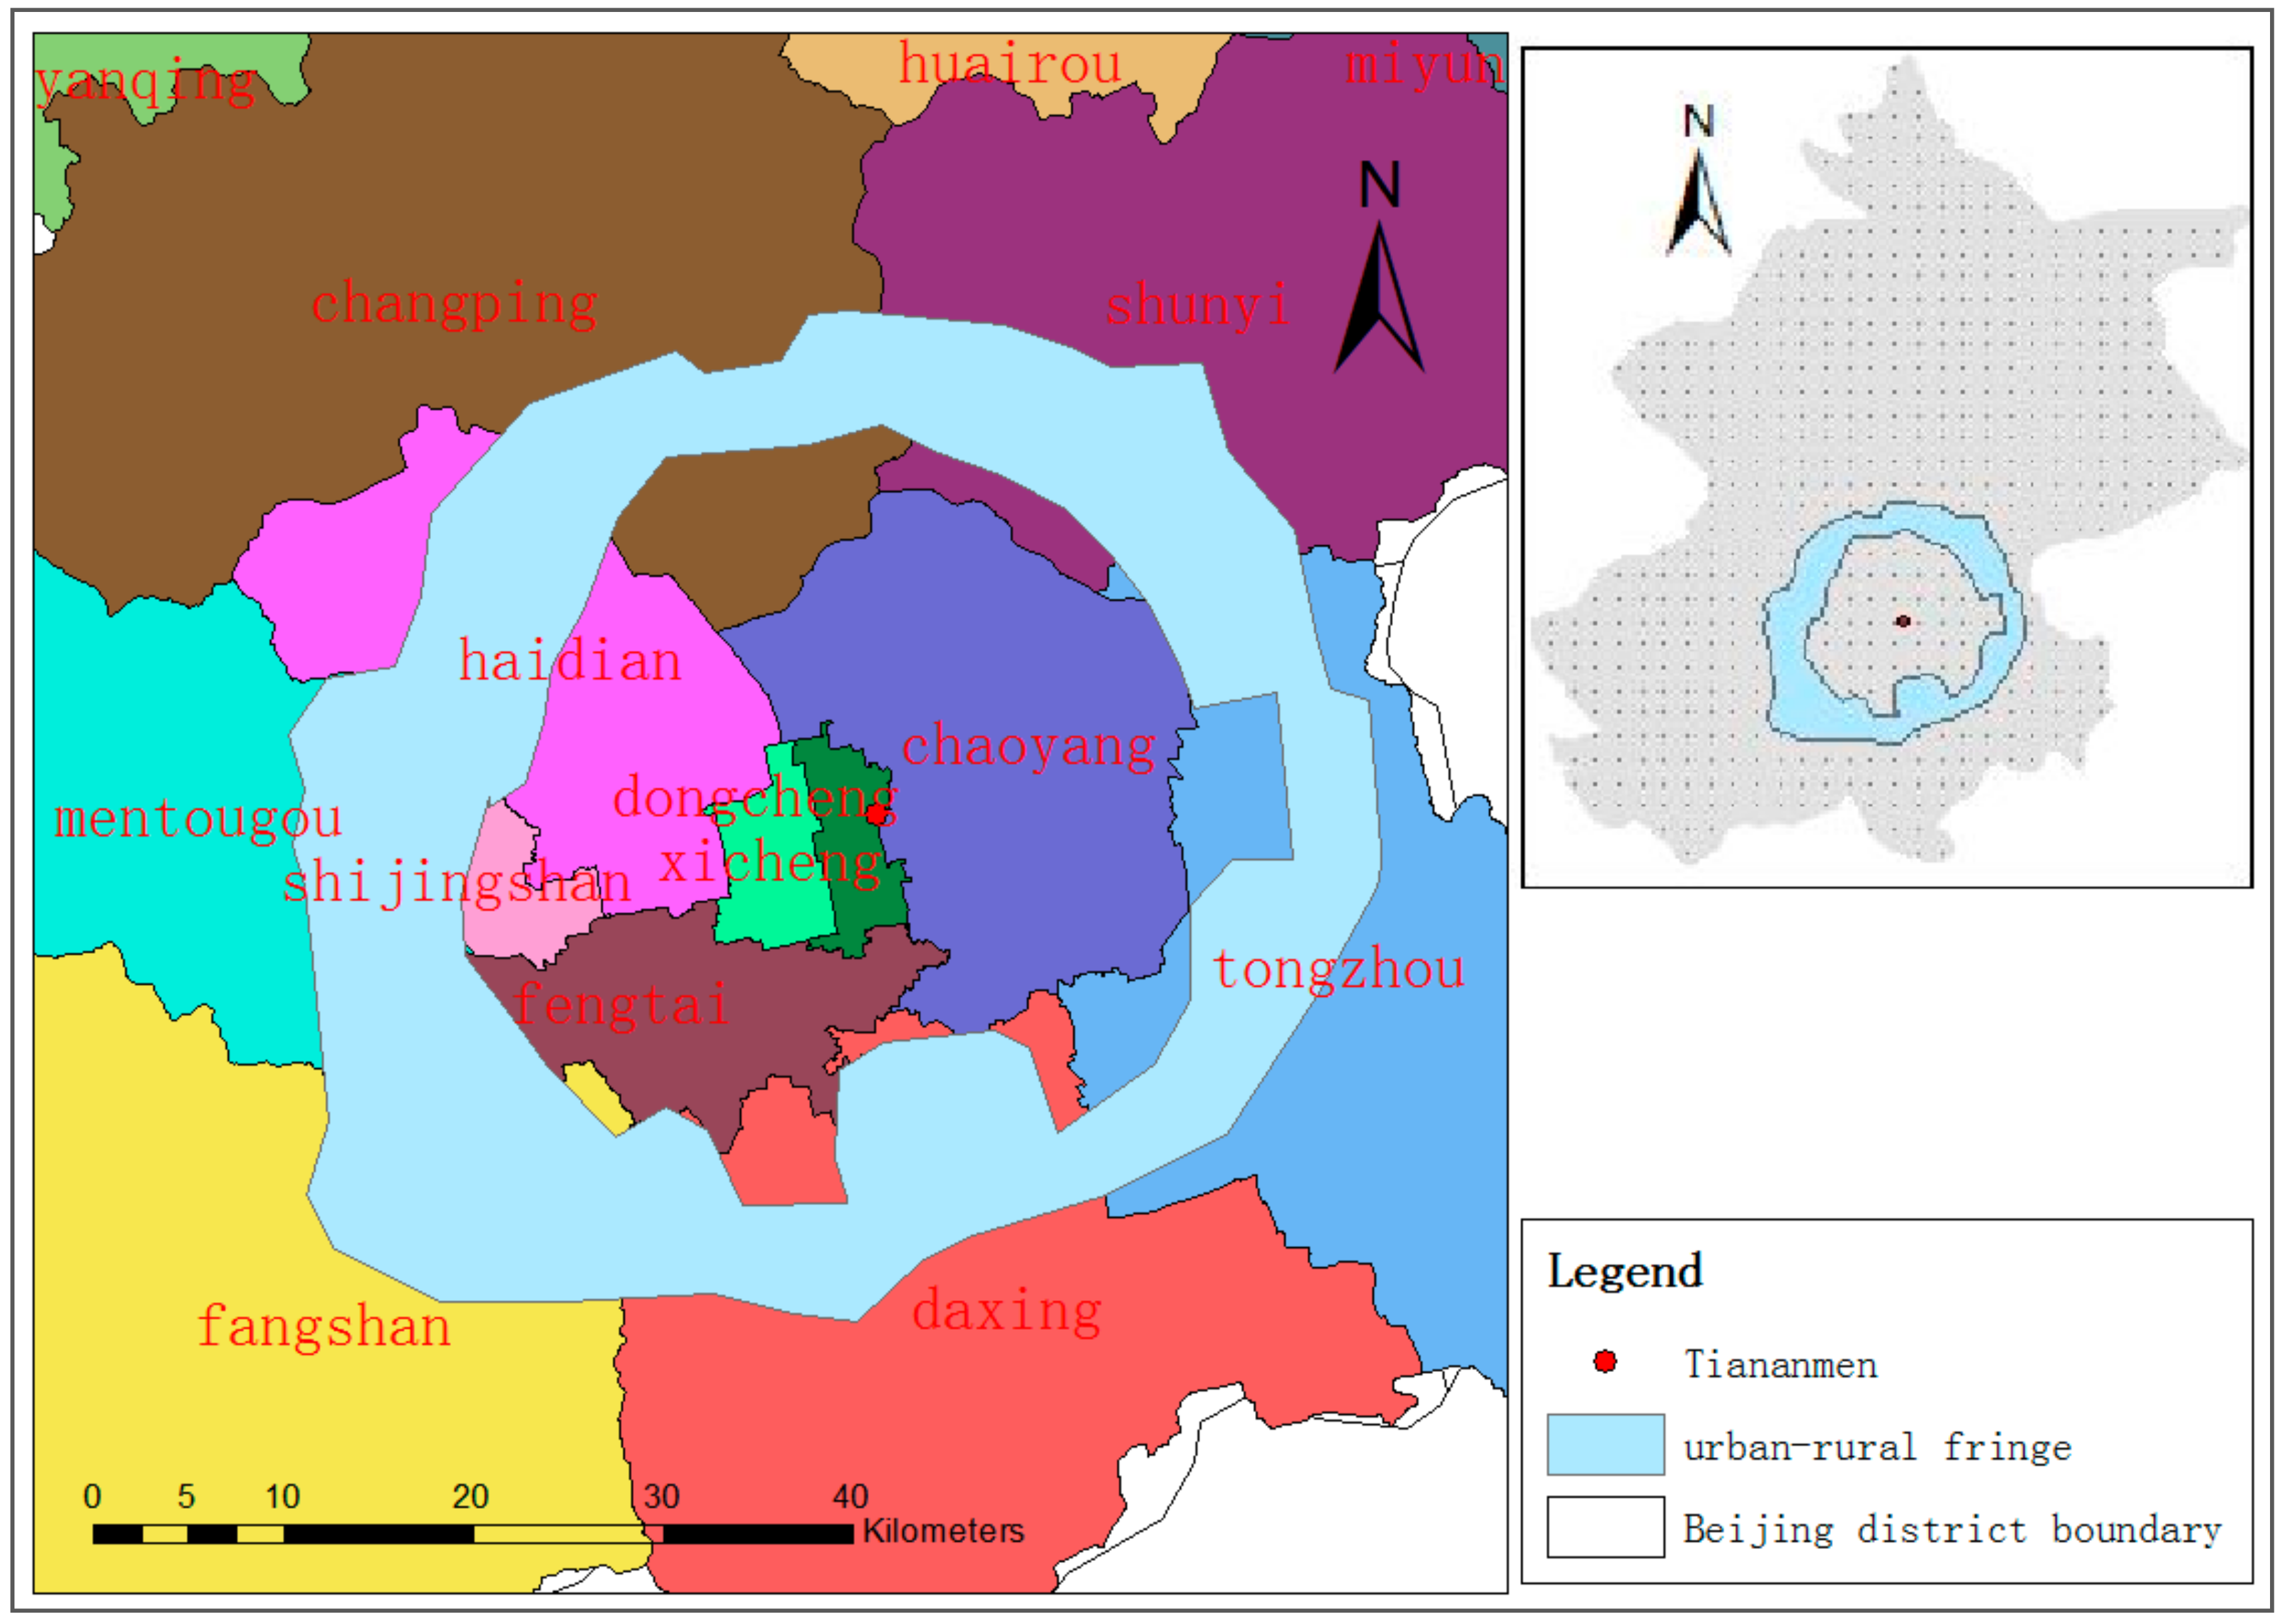
There are 16 districts in Beijing, including two core capital function zones: the Dongcheng District and Xicheng District; four city function expansion areas: the Chaoyang District, the Haidian District, the Shijingshan District, the Fengtai District; five new city development districts: the Fangshan District, the Daxing District, the Tongzhou District, the Shunyi District, the Changping District; and five ecological conservation development zones in Figure 1: the Mentougou District, the Yanqing District, the Huairou District, the Pinggu District, and the Miyun District [36].
The urban-rural fringe of Beijing has become the frontier to promote the integration of urban and rural development under the influence of urban radiation, regional driving, and other factors during of the new urbanization transformation of China [37]. The urban-rural fringe in Beijing has become a region that must be paid attention to during the current urbanization due to the strongest urban development vitality, the most obvious contradiction between population and environment, and the urgent demand of economic and social development in it [38].
2.2. Materials
The Defense Meteorological Satellite Program (DMSP) of the United States is equipped with an Operational Linescan System (OLS) sensor, which can work at night and detect light from cities or even low-intensity light from small-scale residential areas and vehicles. Lights make city areas obviously different from dark country backgrounds [39] and are more suitable for the dynamic monitoring of urbanization.
Version 4 DMSP-OLS nighttime light time data in 2013 were obtained from NOAA’s National Centers for Environmental Information (NCEI, formerly NGDC) website [40]. There are three types of annually averaged data in the dataset: cloud free coverage, average visible light, and stable lights. Among the three types of data, the stable light data contain the lights derived from cities, towns, and other sites with persistent lighting, while fires, volcanoes, background noise, and other ephemeral events have been discarded [41]. The DMSP-OLS nighttime stable light (NSL) data have a spatial resolution of 30 arc-seconds, about 1 km at the equator, and a coverage spanning −180° to 180° and −65°S to 75°N. The digital number (DN) values of pixels range from 0 to 63. A value of 0 represents an unlit area and the greater the value, the higher the light level of the region.
In this paper, the data preprocessing and brightness correction between years have been executed to the DMSP-OLS data, so the DMSP-OLS NSL data in 2013 is used. The original data use the WGS84 reference coordinate system, which is changed to Chinese Lambert conformal conic projection in ArcGIS 10.3 (ESRI, Redland, CA, USA). The central meridian of the projection is at 105° E, and the two standard parallels are 30°N and 62°N. The administrative boundaries of Beijing, including all districts, were obtained from the National Geomatics Center of China. The nighttime light data of Beijing in 2013 was extracted using the administrative boundary of Beijing.
3. Methods
3.1. Theory of the Analysis of Light Characteristics
The regional structure of the modern city can be divided into three parts: the urban core area, the urban and rural transition zone, and the rural area [42]. The urban and rural transition zone is also called the urban-rural fringe area. It usually includes the nearby suburbs of the periphery of the built-up area or the whole suburban district. It is the frontier of urban expansion [43]. The urban-rural fringes are different from the homogenous cities and countryside and shows characteristics of transition, diversity, and fluctuation [39]. Due to production and lifestyle differences, urban residents depend on the light at night much more than rural residents. Therefore, the light intensity and the degree of light intensity fluctuation in the urban-rural fringes show transitional characteristics from the city to the countryside.
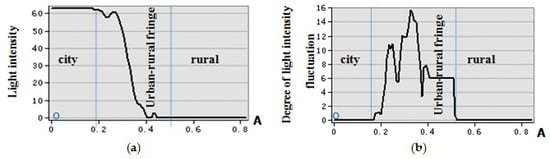
Taking the main urban area of Beijing as an example, the profile line OA in the DMSP/OLS nighttime light data of Beijing in 2013 was used to obtain the DN intensity value of the profile line (Figure 2). Degree of light intensity fluctuation was calculated according to the light intensity (Figure 3). It shows that the light intensity gradually declined from the city center to the rural hinterland, and degree of light intensity fluctuation was lower in the urban and rural areas and higher in the middle of the urban-rural fringe area.
3.2. Construction of Model Used to Identify Urban-Rural Fringes
From the center of the cities to the rural hinterland, the overall light intensity decreases. The greater the light intensity value, the higher the possibility that the region is a city. Conversely, the lower the light intensity value, the higher the possibility that the region is countryside.
3.2.1. Calculation of the Degree of Light Intensity Fluctuation
The degree of fluctuation of light intensity reflects the degree of variation of the light intensity in a certain range; the calculation is shown in Formula (1).
where DNw is the degree of light intensity fluctuation and DNnmax and DNnmin are the maximum and minimum values of light intensity value (DN) in the 3*3 neighborhood.
3.2.2. Extremum Normalization of Light Intensity and Degree of Light Intensity Fluctuation
Based on a related reference [44], an extremum normalization is performed on the light intensity DN and the degree of light intensity fluctuation (DNw) using Formulas (2) and (3). DN value is the digital number or the light intensity value of the pixels in the study area. The range of DN value of the pixels is from 0 to 63. DNn is the light intensity normalization value, DNwn is the degree of light intensity fluctuation normalization value, and the ranges of DNn and DNwn are (0, 1). DNmax and DNmin are the maximum and minimum values of light intensity in main urban areas, respectively. DNwmax and DNwmin are the maximum and minimum value of the degree of light intensity fluctuation in main urban areas, respectively.
3.2.3. Constructing the Formula of the Light Characteristic Combination Value
The coordination degree formula [44,45] was utilized to construct the light characteristic combination value formula that combines the light intensity and the degree of light intensity fluctuation. The characteristic combination value formula is shown in Formula (4), where C is the characteristics combination value.
In ArcGIS 10.3, according to the Formulas (2)–(4), the light characteristic combination value (C) was computed, and the range of the C value is 0–1, as shown in Figure 5.
3.2.4. Extraction of the Breakpoints of Light Characteristic Combination Value in 360 Directions of the Study Area
Taking Tian An Men, located in Beijing, as the center and starting in the east direction, 360 profile lines were created at intervals of one degree, which covered the entire research area. The longest distance from Tian An Men to the boundary of Beijing was used as radius. As shown in Figure 6, the profile lines covered the entire study area. After intersecting the light characteristic combination value data (C) with the 360 profile lines, the corresponding data in 360 directions of the study area were obtained. The light characteristic combination values (Ci) of each pixel in 360 directions were obtained, as shown in Figure 6.
The maximum attenuation distance (Di) in each direction is extracted using Formula (5) to obtain breakpoints in each direction.
where Di is the maximum attenuation distance of ith profile line, Cij is the jth sequence characteristic value of the ith profile line, and Ci(j+1) is the (j + 1)th sequence characteristic value of the ith profile line.
By looking up the FID_ grid field in the attribute table, the value of Di of each profile line can be obtained. After the attribute table of the above intersection result was exported, the Python programming language and the Formula (5) were used to extract the maximum distance attenuation value (Di) in each direction. The pixels with Di value were the breakpoints.
Last, the breakpoints were displayed over the original night light data. The inner and outer boundary line of the urban-rural fringe areas were obtained by measuring the distance between the breakpoint points and the center of the study area, eliminating the abnormal mutation points, and finally connecting the breakpoints using curves and smoothing the curves.
4. Results
4.1. Analysis of Light Intensity, Degree of Light Intensity Fluctuation, and the Characteristic Combination Value of Beijing
Overall, the light intensity in Beijing gradually decreases from Tian An Men outward. The pattern of the light intensity fluctuation shows the tendency that both the inside and the outside areas have small fluctuations, and the middle area has large fluctuation. Overall, the light characteristic combination value C increases from the city center to the outward suburban areas. However, some directions from the urban to the rural hinterland have exceptional small bright spots where the value of C suddenly decreases and then increases within a short distance. These spots break up the general trend of the variation of the C value in very small areas, as shown in Figure 7.
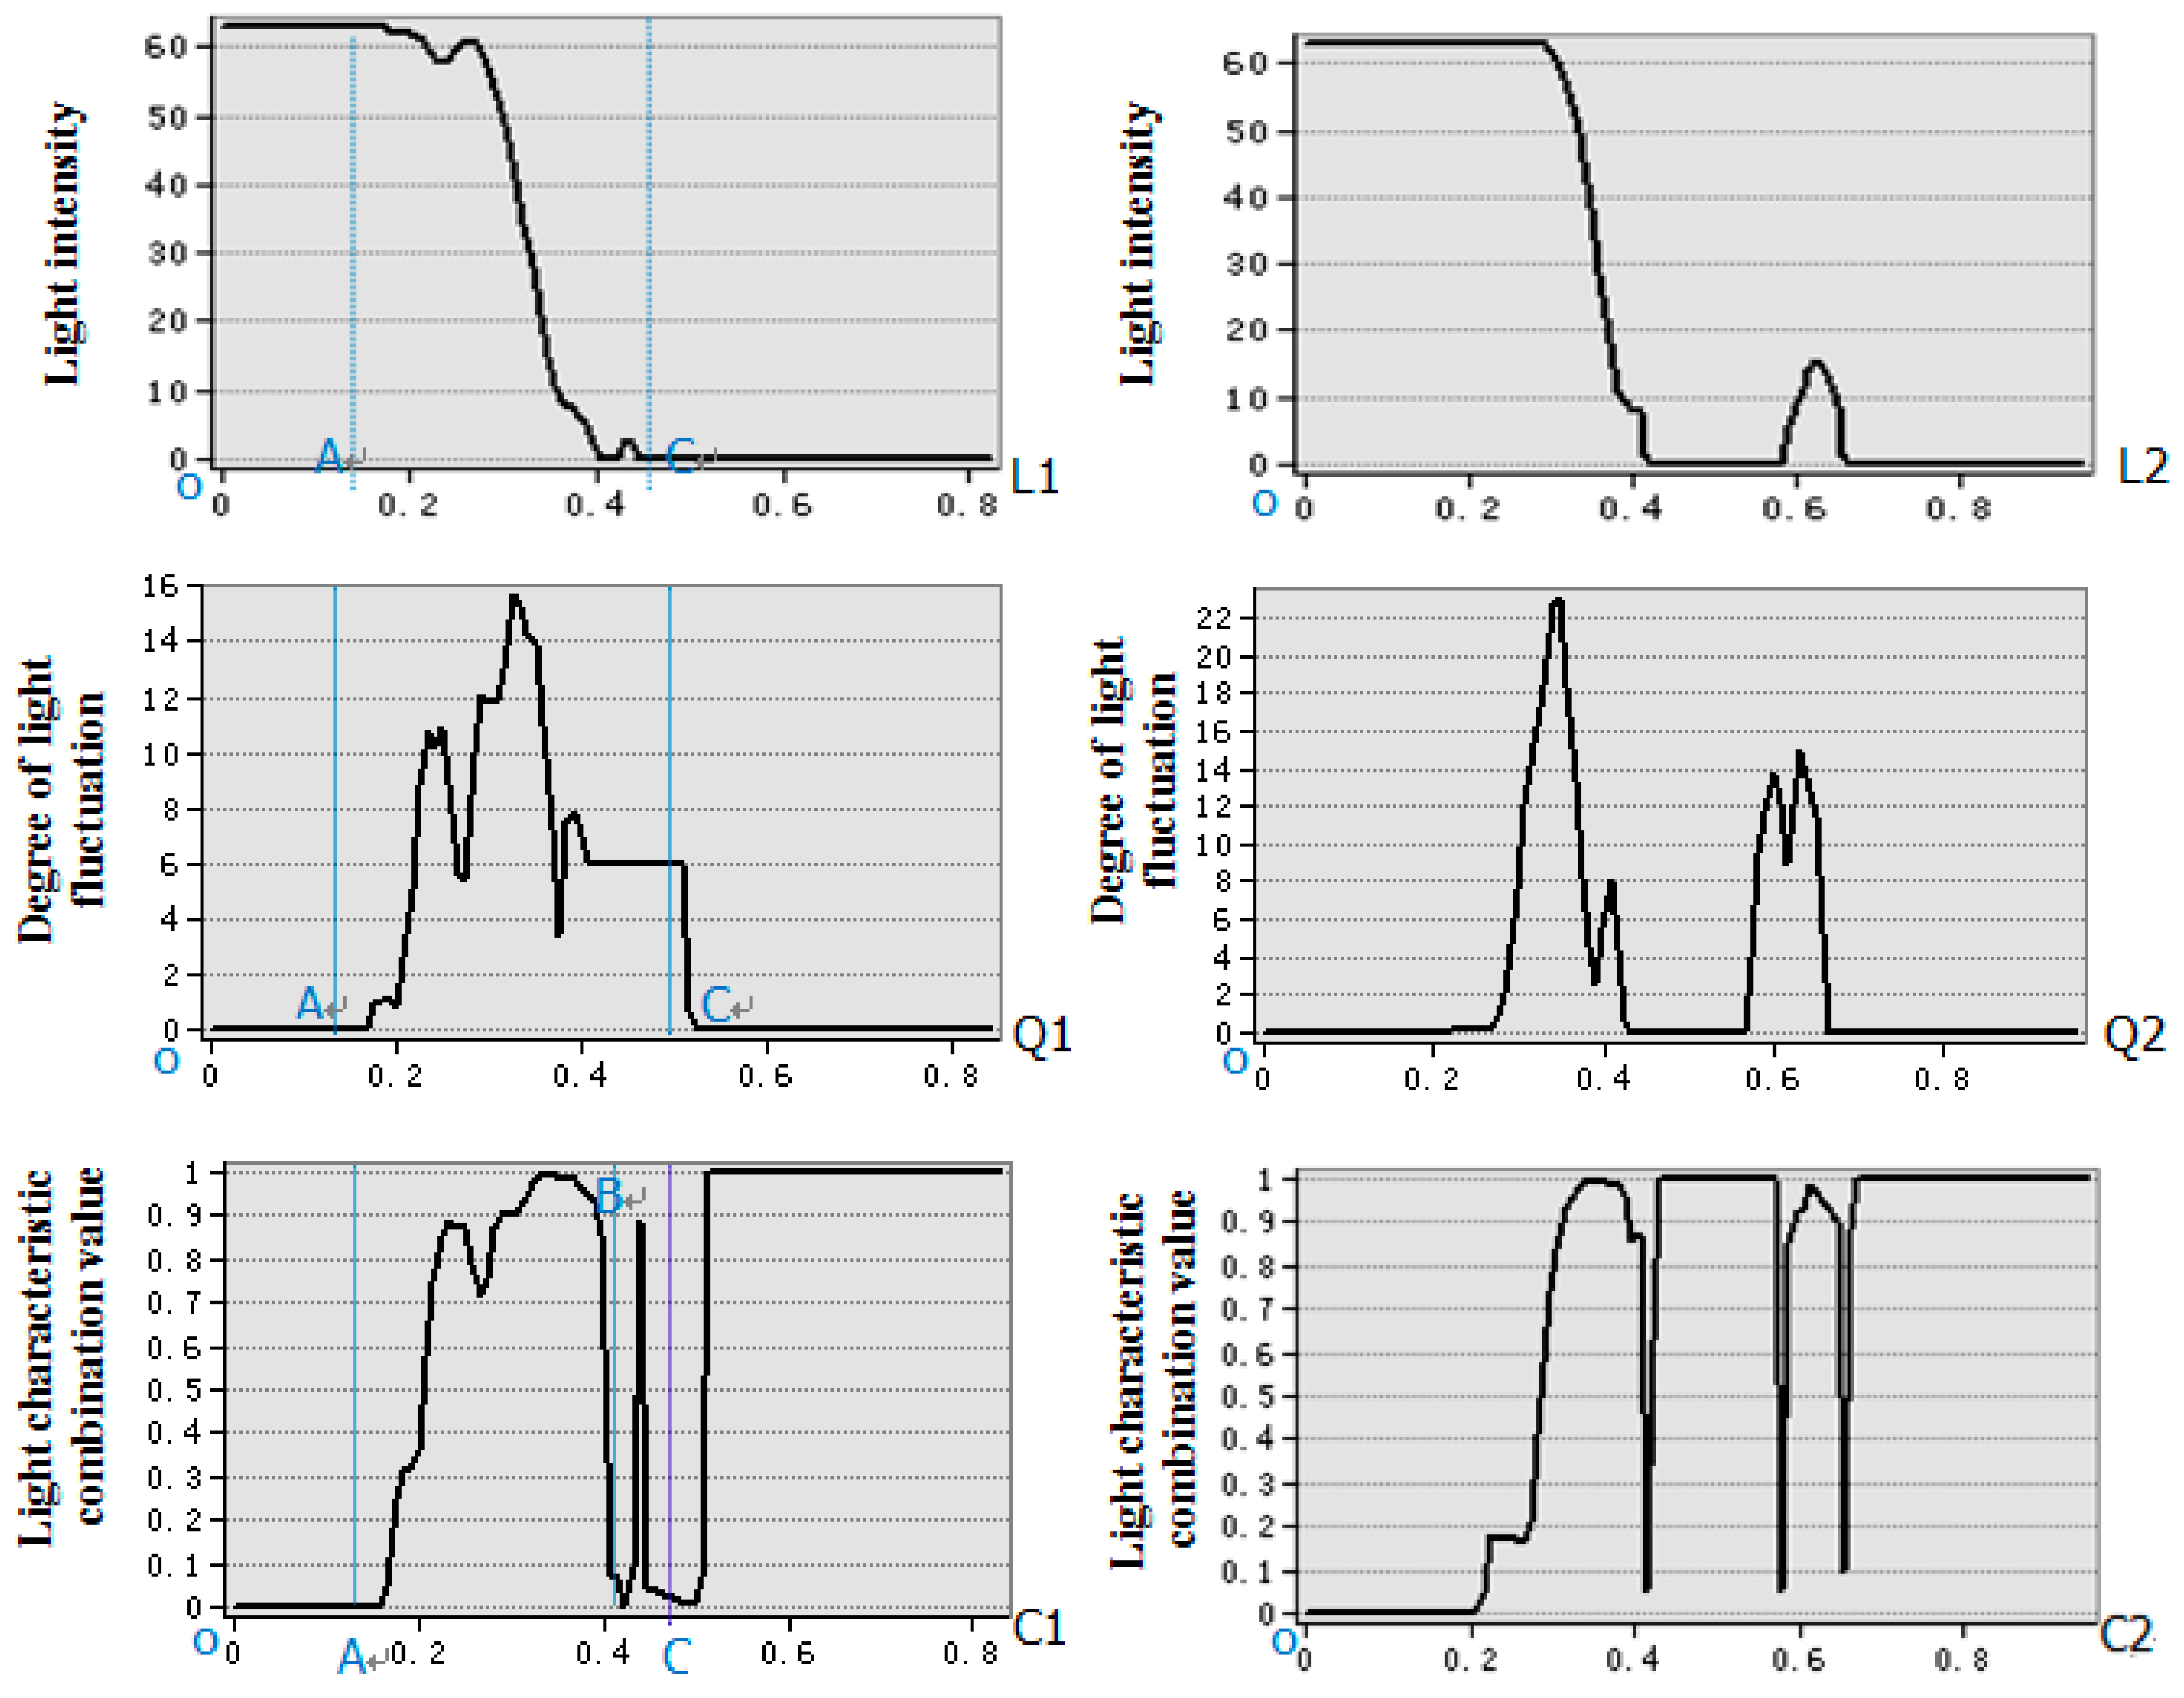
The north and west directions of Beijing extending from the center of Beijing to the hinterland of the countryside have the most obvious changes in light characteristics. Using Tian An Men as the center, profiles of the light intensity (DN), degree of light fluctuation (DNW), and light characterization combination value (C) were created in the northward (direction 1) and westward (direction 2), as shown in Figure 4 and Figure 5. The variation curves are shown in Figure 7, where point O is the center of the city. The curves in the northward (direction 1) direction are respectively L1, Q1, and C1 and the westward (direction 2) direction are L2, Q2, and C2.
Taking the northward (direction 1) direction as an example, the variations of light intensity DN, the degree of light intensity fluctuation DNW and the light Characteristic combination value (C) were analyzed, as shown by the curves L1, Q1, and C1 in Figure 7.
The urban area is located from Tiananmen Center to point A. In this area, the value of the light intensity DN is 61, the value of the degree of light fluctuation DNw is approximately 0, and the light characterization combination value C is also approximately 0. These values reflect the light characteristics of urban areas, which are high light intensities, low degree of light fluctuation, and low characterization combination value.
The urban-rural fringe is located between point A and point C. The value of the light intensity gradually decreases from 61 and reached approximately 0 near point C. The degree of light fluctuation DNW is high, and it increases from point A to the first peak of approximately 11, decreases to 6, then increases to the highest value 16 again, decreases to 4, and finally drops to 0 at point C. The light characteristic combination value C gradually increases from 0 to 1. However, near point B, which is between points A and C, there is a small bright spot. On both sides of point B, the light characteristic combination values sharply decline and then rapidly increase. The light characteristics of the urban-rural fringe area are shown from point A to C. The light intensity DN gradually decreases from high to low, the light intensity fluctuation degree DNw fluctuates greatly, and the light characteristic combination values show an overall increasing trend.
The rural area is from point C to the outer rural hinterland. In this area, the light intensity DN and the degree of light fluctuation DNW are also closed to 0, and the light characterization combination value C is approximately 1. These results indicate that the light characteristics of the rural area are low light intensity, a low degree of light fluctuation, and high characteristic combination values.
4.2. Urban Function Classification and the Range of Urban-Rural Fringe in Study Area
4.2.1. Regional Function Classification of Beijing
The inner and outer boundaries of the urban-rural fringe are obtained by displaying the breakpoints that were extracted by the above model in ArcGIS 10.3, calculating the distance between the breakpoints to Tian An Men, excluding the abnormal mutation points, and connecting the breakpoints, as shown in Figure 8. According to the boundary lines, Beijing is divided into three types of areas: the urban area with high light intensity and a low degree of light intensity fluctuation, the urban-rural fringe with moderate light intensity and a high degree of light intensity fluctuation, and the countryside with low light intensity and a low degree of light intensity fluctuation, as shown in Table 1. The area covered by the inner boundary line is approximately 1358 km2, the area enclosed by the outer boundary is approximately 2123 km2, and the difference between the inner and outer boundary lines is the area of the urban-rural fringe, which is approximately 765 km2.
4.2.2. Territorial Range of the Urban-Rural Fringe Area of Beijing
The urban-rural fringe area in Beijing is mainly located in the annular band with Tian An Men as the center. The average inner radius is 19 km, and the outer radius is 26 km. The area includes the outer edges of the four city center districts: Haidian District, Fengtai District, Chaoyang District, and Shijingshan District. Part of the urban-rural fringe area is located along the border of the Fangshan District, Daxing District, Changping District, Mentougou District, Shunyi District, Tongzhou District, and Fangshan District. The urban-rural fringe has an area of approximately 765 km2, as shown in Figure 8.
5. Discussion
DMSP/OLS night light images as a unique remote sensing data source that can detect the light of low intensity and provide a reliable and convenient way to research human activities associated with light use and their effects. The data can be widely used for the monitoring of urban expansion and the urbanization level, estimating of the population, GDP, energy consumption, and carbon emissions, and monitoring of light pollution and fire [46]. However, there are few studies on the identification of urban-rural fringes that have been based on nighttime light data.
In this study, DMSP-OLS nighttime light time data in 2013 was used to extract the urban-rural fringe of Beijing. Light intensity and fluctuation were used to define the transitional region between urban and rural. The model of light characteristics combination value was built to identify the urban-rural fringe. This paper provided a new rapid convenient and feasible approach for the identification of the urban-rural fringe areas. It is very meaningful for the application of nighttime light data.
In this research, the profile lines in 360 directions were selected, which can cover the entire research area, and the “breakpoint” method was used to improve the accuracy of the results. If only four or eight directions were selected, it would be impossible to correctly identify the range of the urban-rural fringe area. However, there some subjective and empirical judgments were required when the abnormal mutation points were eliminated in this method. The light parameters generally change regularly from the urban center to the rural hinterland. Some abnormal small bright spots do in some directions. These small bright spots may be a specific light source and are much brighter than the surrounding background area. When we use this approach to extract the breakpoints, the small bright spots break the regular change of the light parameters in the minimal area, and abnormal breakpoints will appear. So, we need to combine other data and subjective experience to judge whether the abnormal breakpoints are in the edge of the urban-rural fringe or to eliminate them. Additionally, the resolution of the DMSP/OLS nighttime light remote sensing data is relatively low, the spatial resolution of the nighttime light data is 1 km, and small-scale rural light is difficult to identify. Therefore, the light intensity and the degree of light intensity fluctuation were zero in some of the rural areas. Spatial identification of urban-rural fringe areas using nighttime light data together with traditional higher-resolution remote sensing images is worth studying in the future.
In this study, there are still some other related issues that need to be further considered and researched. Like many cities, the main city area of Beijing is annularly developed from the center to the outer area, so the city center is selected as the center of the circle to make profile lines in 360 directions to extract the urban-rural fringe. However, there are also some modern metropolises that are formed by combining multiple cities growing toward each other. As far as these particular cases are concerned, how to define a central point and deal with the remaining areas between urban and rural areas is still a problem that needs further study in the future. In addition, only the DMSP-OLS nighttime light time data in 2013 is used in this study. In the future work, NPP-VIIRS data can also be used to extract the urban-rural fringes using our method. The urban-rural fringes are dynamically changing with the development and change of the cities. Therefore, attention on the dynamic changes of the urban-fringe areas using long time series lighting data is necessary in the future. It can provide a more accurate and scientific reference for urban planning.
6. Conclusions
Night light data have the advantages that data acquisition is convenient and available in real time, and the data can break the administrative boundaries to reflect the differences within the administrative regions. In this study, an attempt was made to provide a convenient feasible and real- time approach for the identification of the urban-rural fringe areas using DMSP/OLS nighttime light data. DMSP/OLS night light data were used to analyze the characteristics of the light intensity and the degree of light intensity fluctuation in “urban,” “urban-rural fringe,” and “rural” areas. The light characteristic combination value model was built to analyze the maximum distance mutation value attenuation in 360 directions. Then, the breakpoints in each direction were extracted to identify the scope of the urban-rural fringe of Beijing.
Finally, we drew the conclusion that the urban-rural fringe area in Beijing is mainly located in the annular band with Tian An Men as the center. The average inner radius is 19 km, and the outer radius is 26 km. The area includes the outer edges of the four city center districts Haidian, Fengtai, Chaoyang, and Shijingshan. Part of the urban-rural fringe area is located along the border of the Fangshan, Daxing, Changping, Mentougou, Shunyi, Tongzhou, and Fangshan Districts. The area of the urban-rural fringe area is approximately 765 km2.
Through the study of relevant literature [19,47,48,49], the results showed that the spatial identification of the urban-rural fringe based on DMSP/OLS night light data was practical and reliable. The method is feasible and more convenient than the traditional methods, and the data and the recognition results are available in real time.
Acknowledgments
This research was supported by the Special Project of Science and Technology Basic Work (Grant No. 2014FY210800-5), the Project of Youth Science and Technology Foundation of Gansu in China under Grant No. 1610RJYA011, and in part by the Alumni Foundation of Civil Engineering 77, Lanzhou University of Technology of China, under Grant No. JK2015-29, and the Youth Project of the National Natural Science Foundation of China under Grant No. 41601066.
Author Contributions
Mingguo Ma and Yuli Yang designed the study. Yuli Yang and Wangping Li processed the data. Yuli Yang and Mingguo Ma drafted the paper. Chao Tan contributed to the English editing. All of the authors contributed to the result discussion and paper writing.
Conflicts of Interest
The authors declare no conflict of interest.
References
- Wang, S.; Li, S.; Liu, J. Discussion on land use regulation in urban-rural fringe zone. J. Geomat. 2000, 4, 15–19. [Google Scholar]
- Peterson, M.P.; Hunt, P.; Weiß, K. Mapping air population. J. Geovis. Spat. Anal. 2017, 1, 4. [Google Scholar] [CrossRef]
- Heitzler, M.; Lam, J.C.; Hackl, J.; Adey, B.T.; Hurni, L. GPU-accelerated rendering methods to visually analyze large-scale disaster simulation data. J. Geovis. Spat. Anal. 2017, 1, 3. [Google Scholar] [CrossRef]
- Fu, C.; Chen, M. Research progress of urban and rural fringe in China. Prog. Geogr. 2010, 29, 1525–1531. [Google Scholar]
- Lv, J.; Liu, L. Problems and Countermeasures of community management in urban-rural fringes. Future Dev. 2009, 6, 55–58. [Google Scholar]
- Fu, J.; Song, Y. Problems and Countermeasures in urban-rural fringes. Terr. Nat. Resour. Study 2002, 3, 6–8. [Google Scholar]
- Xun, W.; Wang, Y.; Jia, Y. Spatial identification and the evolvement of land use structure of rural-urban rapidly urbanized area—A case study of Shenyang. Terr. Nat. Resour. Study 2015, 5, 12–15. [Google Scholar]
- Chen, B. Land use problems and counter measures in Beijing urban-rural fringe. Econ. Geogr. 1996, 16, 46–50. [Google Scholar]
- Weir, R.E. A field guide to sprawl. J. Am. Cult. 2010, 28, 129–130. [Google Scholar] [CrossRef]
- Russwurm, L.H. The Development to Fan Urban Corridor System, Torontoto Stratford Area: 1941–1966; Department of Geography and Planning and Resources Institute, University of Waterloo: Waterloo, ON, Canada, 1969. [Google Scholar]
- Song, G. A Study of Social Structure Change in Urban and Rural Fringe; Northwest Normal University: Lanzhou, China, 2003. [Google Scholar]
- Zhang, Q.; Hao, Y. Analysis of income distribution gap of the residents in urban-rural fringe. Prod. Res. 2007, 2, 88–89. [Google Scholar]
- Xu, G.; Chen, B.; Yao, M. Research on the division methods of spatial boundary in urban-rural fringe. J. Anhui Agric. Sci. 2010, 38, 995–998. [Google Scholar]
- Bo, Z.W.; Qi, F.X.; Sheng, Z.L. Method to identify the urban-rural fringe by TM images. J. Remote Sens. 1999, 3, 210–220. [Google Scholar]
- Chen, B. Review on identification method and driving mechanism of Peri-urban Area. Prog. Geo 2012, 31, 210–220. [Google Scholar]
- Li, S.; Bai, R. Determination of zone feature in fringe of a big city based on fuzzy overall evaluation. J. China Agric. Univ. 2005, 10, 99–104. [Google Scholar]
- Xia, H. The Definition and Development Exploration of Shijiazhuang Urban Fringe; Hebei University: Baoding, China, 2008. [Google Scholar]
- Qian, Z.; Chen, X. The research on division methods of urban fringe—A case study of Xi’an. J. Grad. Sun Yat-Sen Univ. 2006, 26, 54–62. [Google Scholar]
- Lin, J. Spatial identification and land use of urban-rural lingkage area: A case study of the central city area in Beijing. City Plan. Rev. 2007, 31, 36–45. [Google Scholar]
- Cai, D.; Li, M.; Chen, Z.; Li, F.X.; Wei, W. A method of division of urban fringe based on message entropy—A case study in Nanjing city. Sci. Surv. Mapp. 2010, 35, 106–109. [Google Scholar]
- Cao, G.; Liao, Y.; Liu, T. Seeking a method for identifying the urban fringe spatially based on industrial activities: A case study of Beijing city. Geogr. Res. 2009, 28, 771–780. [Google Scholar]
- Peng, J.; Ma, J.; Yuan, Y. Research progress and prospect on the identification of urban fringe. Prog. Geogr. 2014, 33, 1068–1077. [Google Scholar]
- Elvidge, C.D.; Sutton, P.C.; Turtle, B.T. Change detection in satellite observed nighttime lights: 1992–2003. In Proceedings of the 2007 Urban Remote Sensing Joint Event, Paris, France, 11–13 April 2007; pp. 1–4. [Google Scholar]
- He, C.; Li, J.; Chen, J.; Shi, P.; Chen, J.; Pan, Y.; Li, J.; Zhuo, L.; Toshiaki, I. The urbanization process of Bohai Rim in the 1990s by using DMSP/OLS data. J. Geogr. Sci. 2006, 16, 174–182. [Google Scholar] [CrossRef]
- Cao, X.; Chen, J.; Imura, H.; Higashi, O. A SVM-based method to extract urban areas from DMSP-OLS and SPOT VGT data. Remote Sens. Environ. 2009, 113, 2205–2209. [Google Scholar] [CrossRef]
- Small, C.; Pozzi, F.; Elvidge, C.D. Spatial analysis of global urban extent from DMSP-OLS night lights. Remote Sens. Environ. 2005, 96, 277–291. [Google Scholar] [CrossRef]
- McDonald, R.I.; Kareiva, P.; Forman, R.T. The implications of current and future urbanization for global protected areas and biodiversity conservation. Biol. Conserv. 2008, 141, 1695–1703. [Google Scholar] [CrossRef]
- Sutton, P.; Taylor, M.; Elvidge, C.D. Using DMSP-OLS imagery to characterize urban populations in developed and developing countries. In Remote Sensing of Urban and Suburban Areas; Springer: Dordrecht, The Netherlands, 2010; pp. 329–348. [Google Scholar]
- Chand, T.K.; Badarinath, K.V.S.; Elvidge, C.D.; Tuttle, B.T. Spatial characterization of electrical power consumption patterns over India using temporal DMSP-OLS night-time satellite data. Int. J. Remote Sens. 2009, 30, 647–661. [Google Scholar] [CrossRef]
- Raupach, M.R.; Rayner, P.J.; Paget, M. Regional variations in spatial structure of nightlights, population density and fossil-fuel CO2 emissions. Energy Policy 2010, 38, 4756–4764. [Google Scholar] [CrossRef]
- Chalkias, C.; Petrakis, M.; Psiloglou, B.; Lianou, M. Modelling of light pollution in suburban areas using remotely sensed imagery and GIS. J. Environ. Manag. 2006, 79, 57–63. [Google Scholar] [CrossRef] [PubMed]
- Chand, T.K.; Badarinath, K.V.S.; Murthy, M.S.R.; Rajshekhar, G.; Elvidge, C.D.; Tuttle, B.T. Active forest fire monitoring in Uttaranchal State, India using multi-temporal DMSP-OLS and MODIS data. Int. J. Remote Sens. 2007, 28, 2123–2132. [Google Scholar] [CrossRef]
- Waluda, C.M.; Griffiths, H.J.; Rodhouse, P.G. Remotely sensed spatial dynamics of the Illex argentinus, fishery, Southwest Atlantic. Fish. Res. 2008, 91, 196–202. [Google Scholar] [CrossRef]
- Chand, T.K.; Badarinath, K. Quantification of trace gas emissions from shifting cultivation areas using remote sensing and ground based measurements. Curr. Sci. (India) 2007, 92, 891–894. [Google Scholar]
- Beijing (capital of People’s Republic of China)_Baidu Encyclopedia. Available online: https://baike.baidu.com/item/%E5%8C%97%E4%BA%AC/128981?fr=aladdin&fromid=126069&fromtitle=%E5%8C%97%E4%BA%AC%E5%B8%82 (accessed on 2 November 2017).
- Beijing Statistical Yearbook. Available online: http://www.bjstats.gov.cn/nj/main/2016-tjnj/zk/indexch.htm (accessed on 1 November 2017).
- Hu, N. Exploration of the Development of the Urban-Rural Fringe in Beijing under the New Situation. Real Estate Inf. China 2016, 4, 51. [Google Scholar]
- Research on Urbanization of Beijing Fringe Area Based on Urban-Rural Fringe. Available online: https://wenku.baidu.com/view/17c6caa4b0717fd5360cdc3b.html (accessed on 1 November 2017).
- He, C.; Shi, P.; Li, J.; Zhuo, L.; Ichinose, T. Spatial restruction of urbanization in Chinese mainland in 1990s Using DMSP/OLS night light data and statistical data. China Sci. Bull. 2006, 51, 856–861. [Google Scholar] [CrossRef]
- Version 4 DMSP-OLS Nighttime Lights Time Series. Available online: https://ngdc.noaa.gov/eog/DMSP/downloadV4composites.html (accessed on 12 October 2016).
- Baugh, K.; Elvidge, C.; Ghosh, T.; Ziskin, D. Development of a 2009 stable lights product using DMSP-OLS data. Proc. Asia Pac. Adv. Netw. 2010, 30, 114–130. [Google Scholar] [CrossRef]
- Zhang, W.; Fang, X.; Zhang, L. Study on the method of dividing urban and rural transition zones by remote sensing images. J. Remote Sens. 1999, 3, 199–202. [Google Scholar]
- Lv, H.; Yang, S.; Zhang, T. Research on urban-rural-integration area and information extraction based on remote sensing images—A case study of Wuxi. J. Nanjing Norm. Univ. 2004, 2, 98–102. [Google Scholar]
- Fan, H.; Liu, W.; Wu, B. Spatio-temperal characteristics of internal coordination of intensive urban land use: A case study of the downtown of Wuhan. Sci. Geogr. 2014, 34, 697–704. [Google Scholar]
- Zhang, W.; Zhou, Y.; Hu, W. Coupling mechanism and space-time coordination of new-approach urbanization, New-approach industrialization and service industry modernization in Megacity Behemoths: A case study of ten cities in China. Sci. Geogr. 2013, 33, 562–569. [Google Scholar]
- Yang, M. Review on applications of DMSP/OLS Night-time emissions data. Remote Sens. Technol. Appl. 2011, 26, 45–51. [Google Scholar]
- Bai, T.; Zheng, X.; Yang, X. The study of the division of the rural-urban fringe based on residential area density. In Exploitation and Utilization of Land Resources and Coordinated Development of Human and Land in Mountain Areas of China; Geospatial Information: Wuhan, China, 2010. [Google Scholar]
- Zeng, Z.; Wang, L. Research on land use and development mode of Beijing urban fringe under the “Green Divided” policy. Urban Stud. 2014, 21, 24–28. [Google Scholar]
- Qi, B.; Zhou, D. Development and enlightenment of urban and rural fringe of Beijing. Urban Probl. 2007, 1, 61–64. [Google Scholar]
Figure 1.
Administrative map of Beijing.
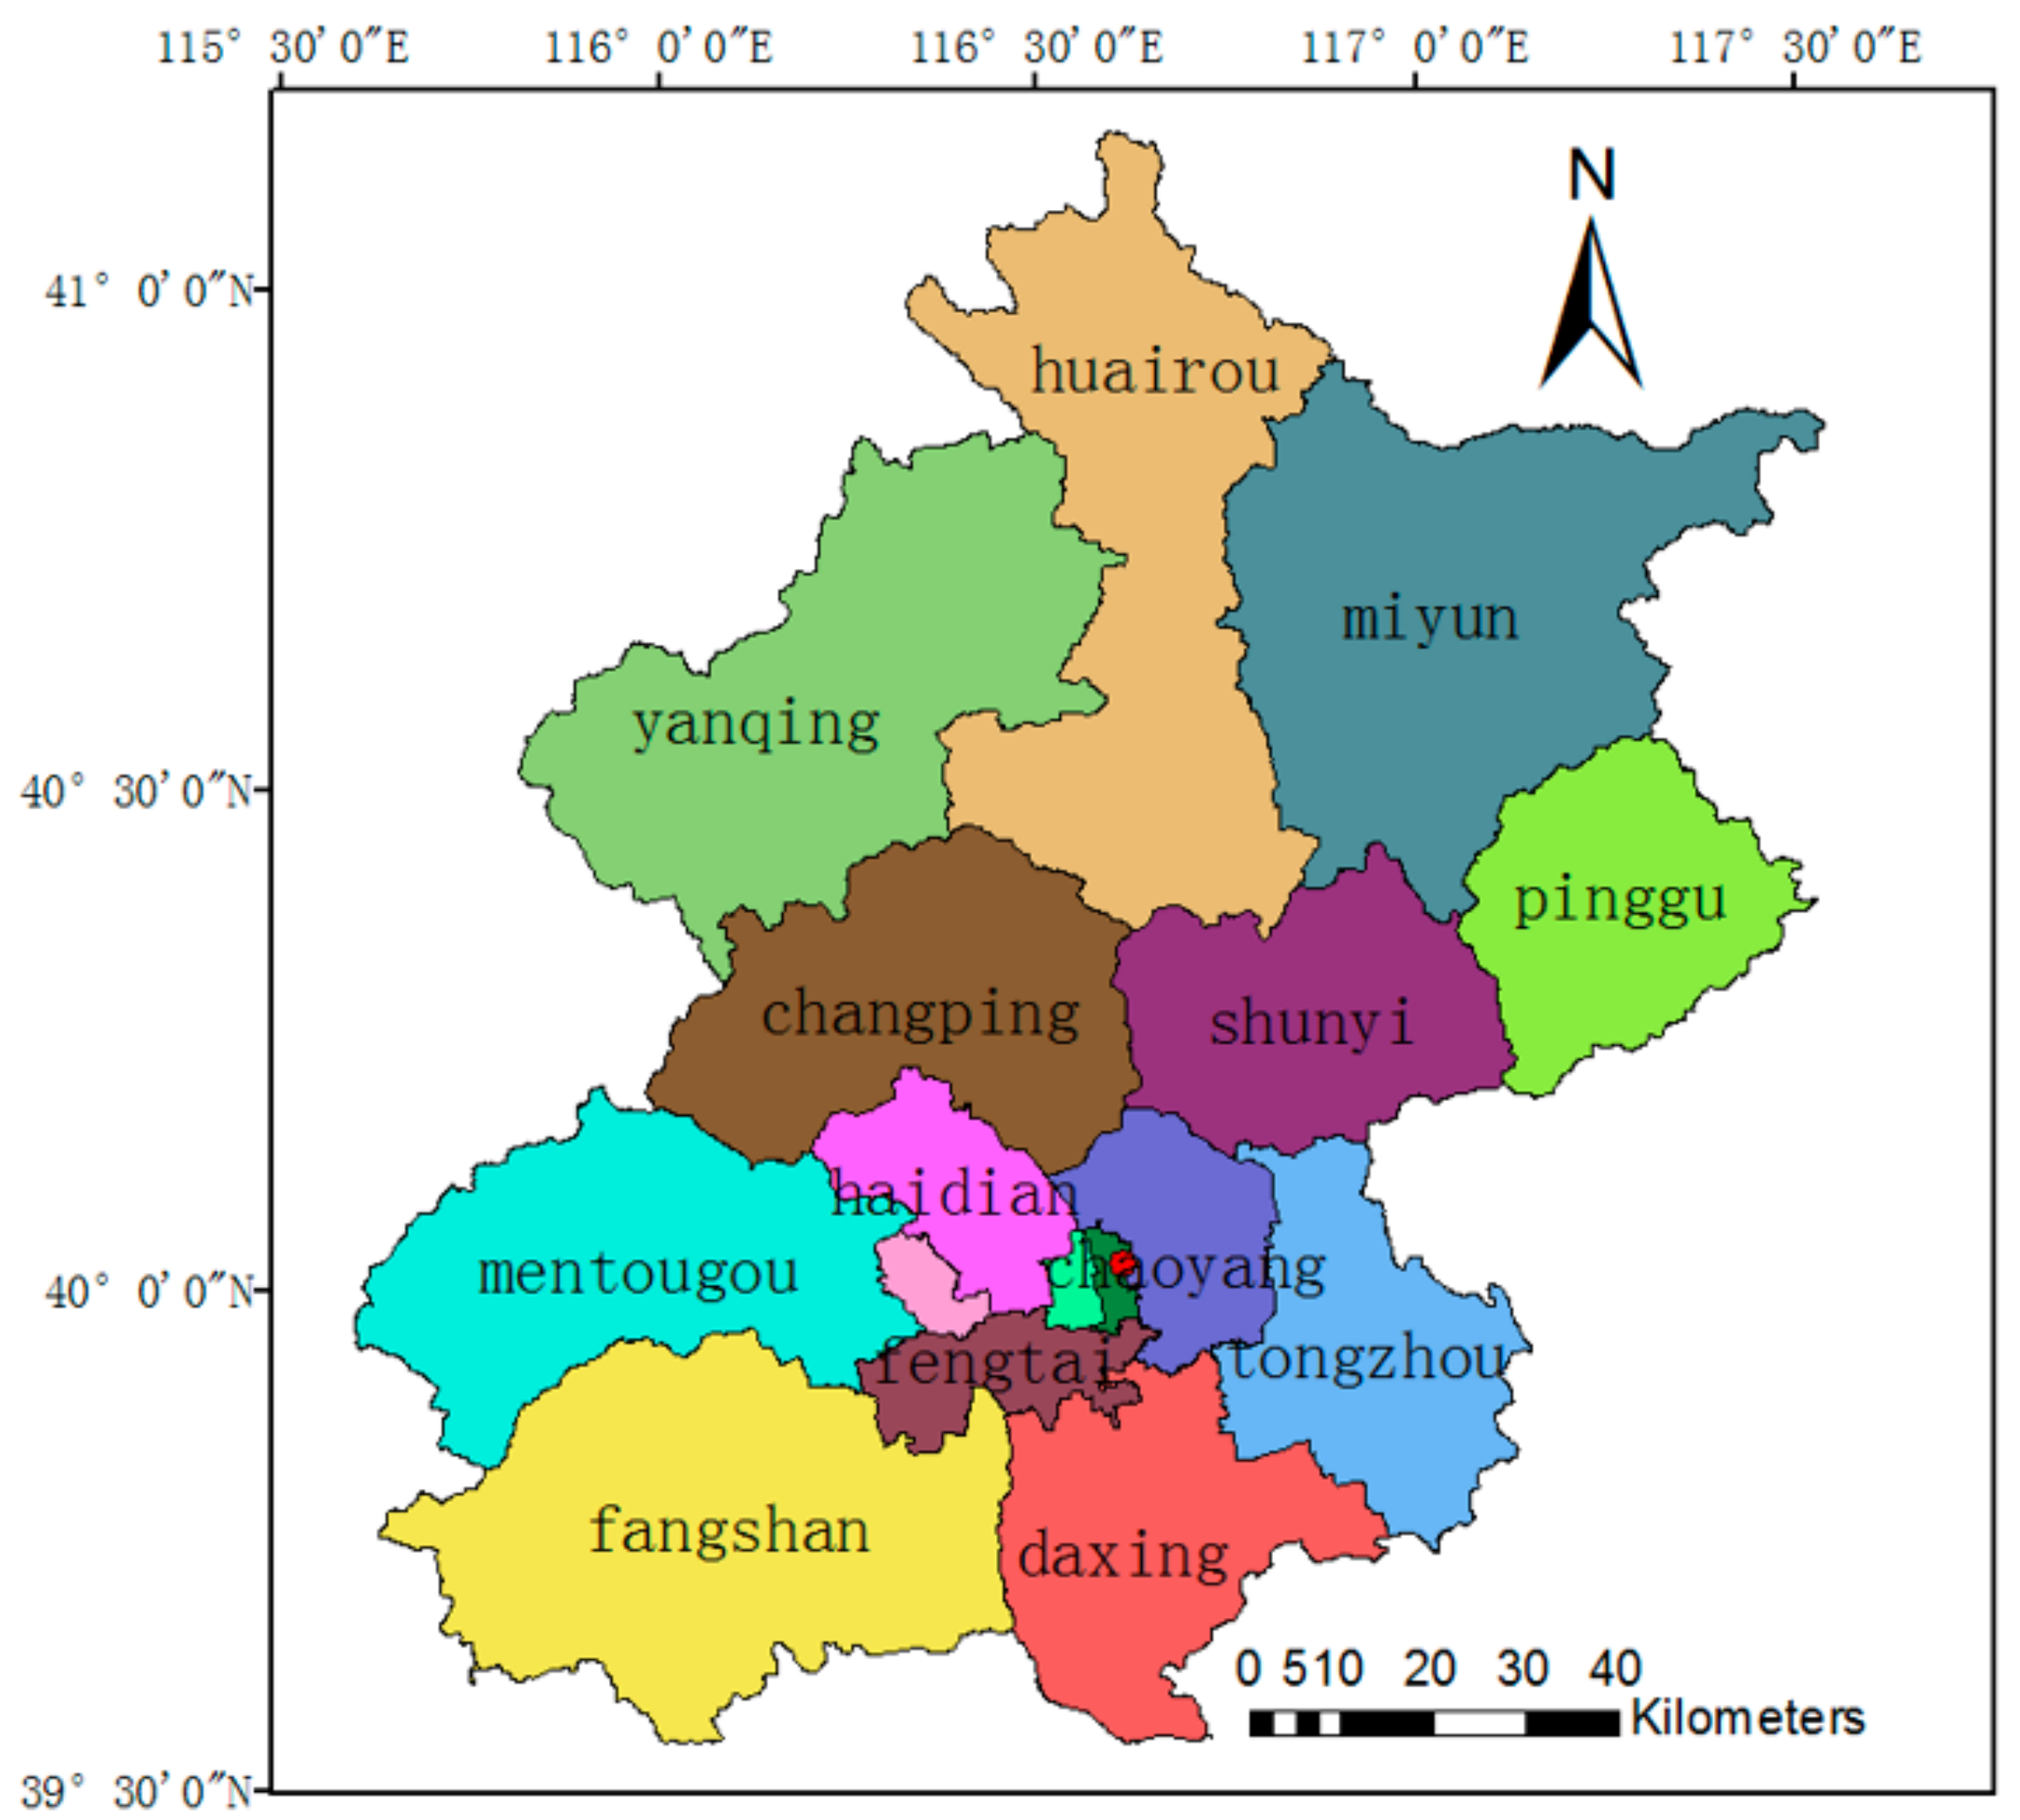
Figure 2.
Defense Meteorological Satellite Program (DMSP)/Operational Linescan System (OLS) nighttime light data of Beijing in 2013.
Figure 2.
Defense Meteorological Satellite Program (DMSP)/Operational Linescan System (OLS) nighttime light data of Beijing in 2013.

Figure 3.
Characteristics of light intensity (a) and degree of light intensity fluctuation (b).
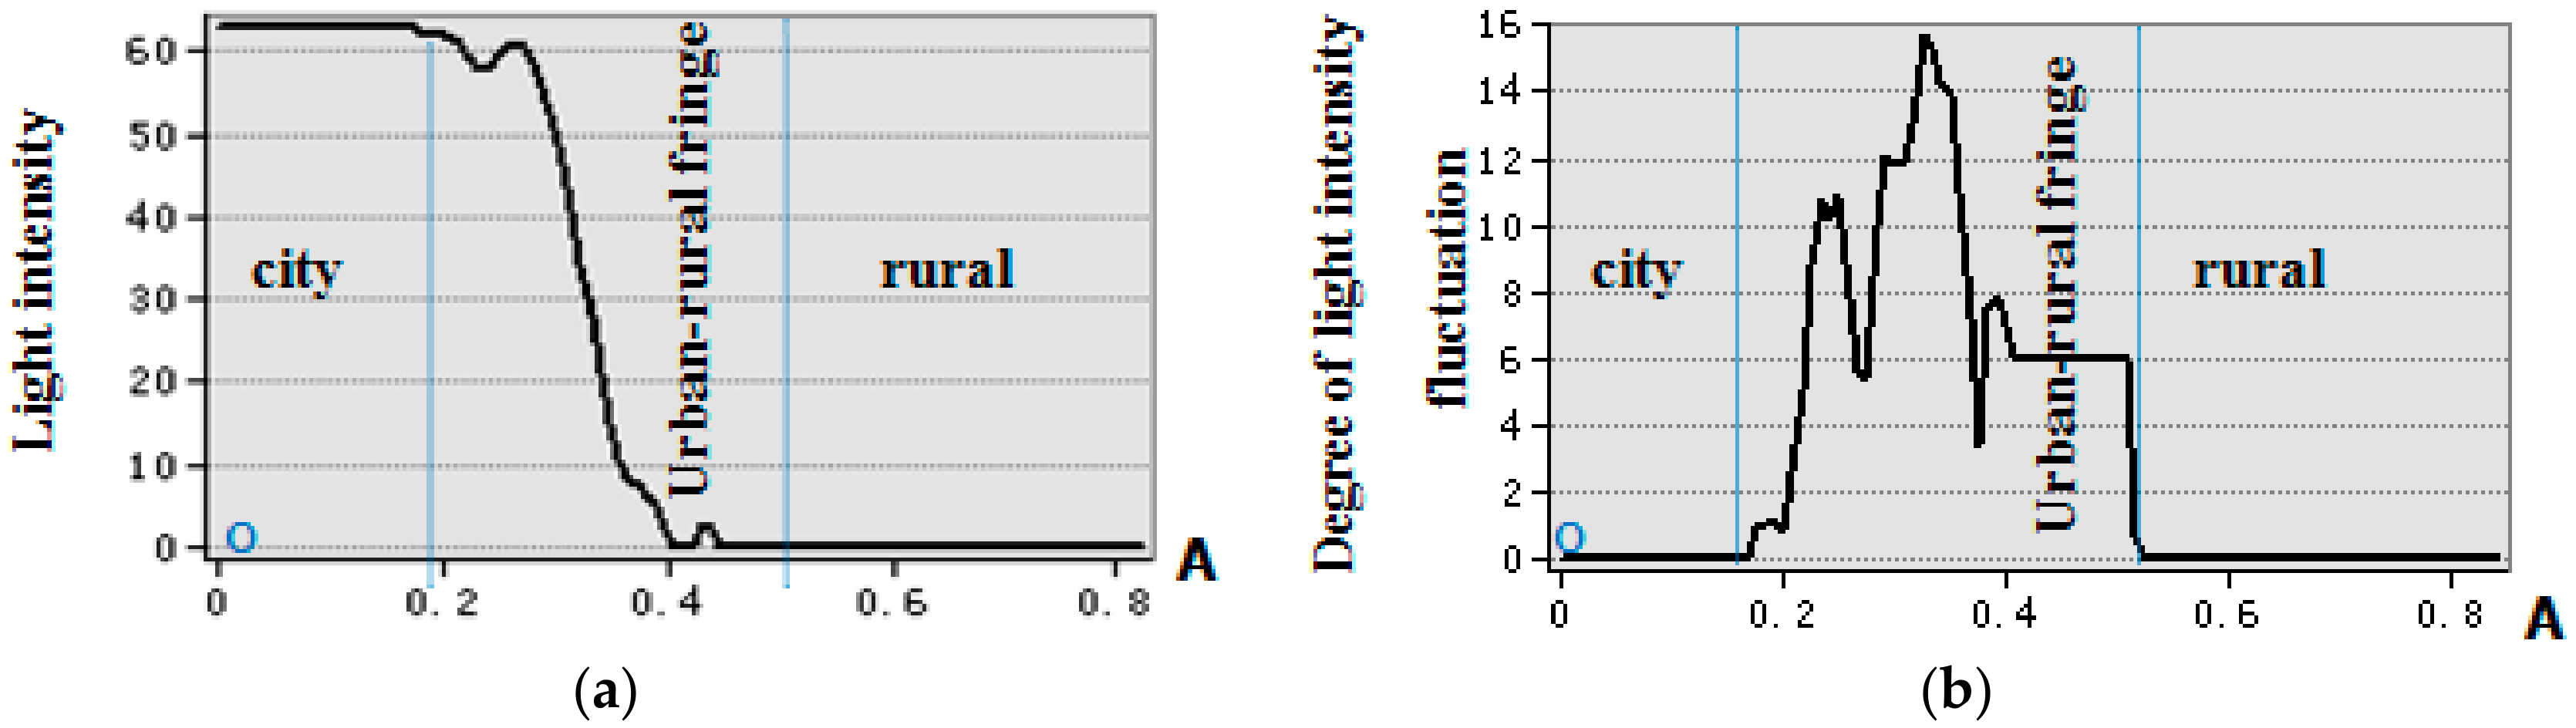
Figure 4.
Light intensity (a) and degree of light intensity fluctuation (b).
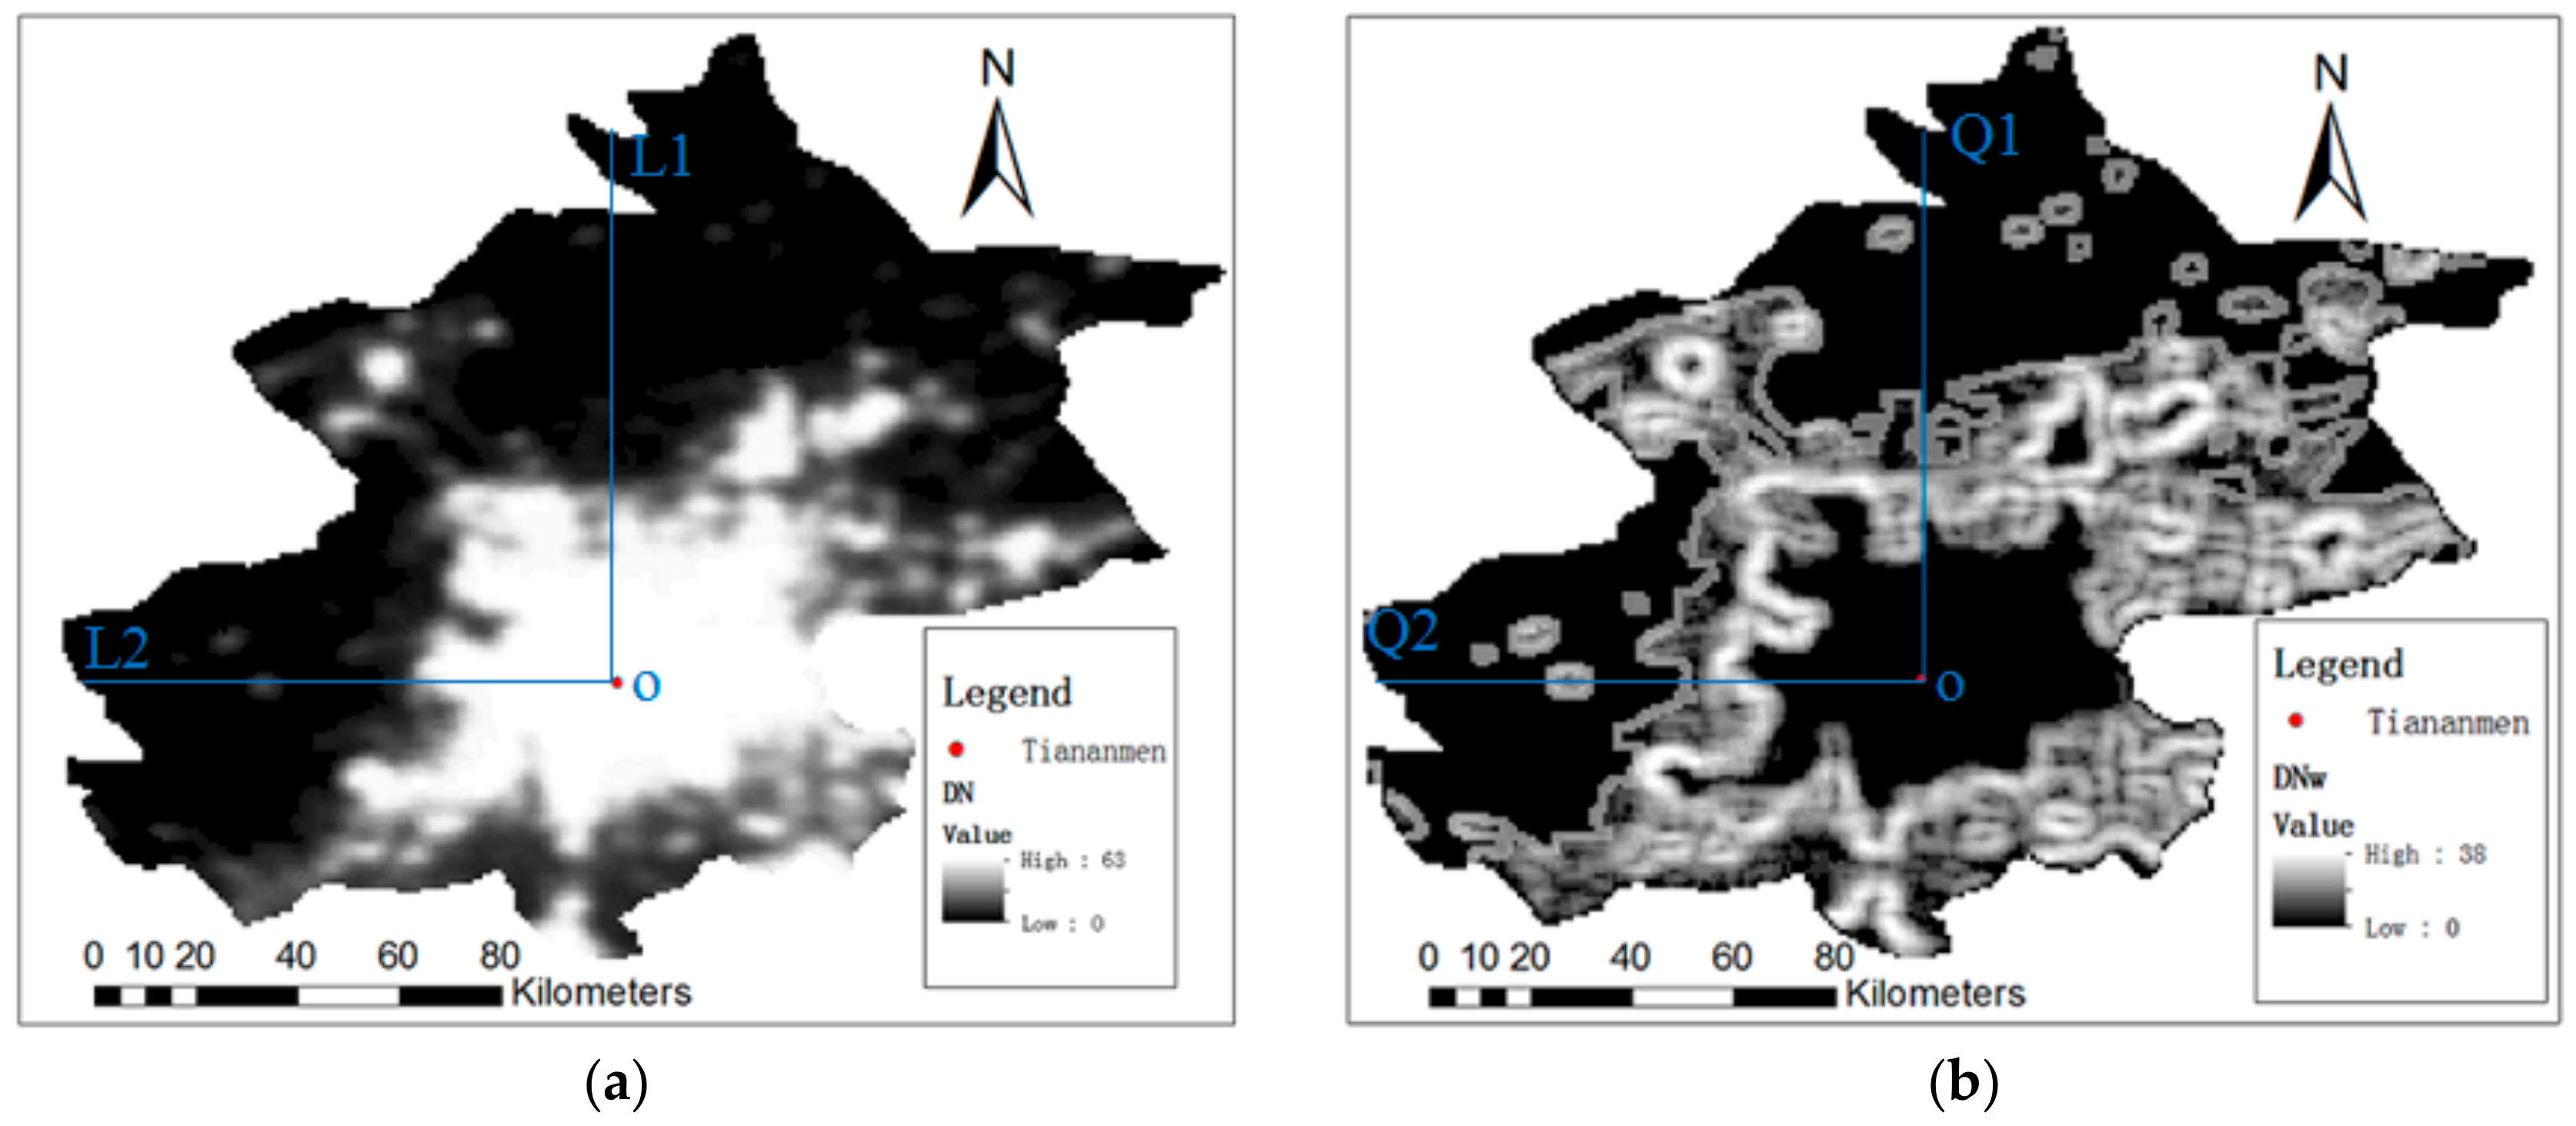
Figure 5.
Light characteristic combination value.

Figure 6.
Schematic diagram of the data columns derived in 360 directions. (The center of the circle is blurred because the 360 lines are too dense.)
Figure 6.
Schematic diagram of the data columns derived in 360 directions. (The center of the circle is blurred because the 360 lines are too dense.)
Figure 7.
Graph of light intensity (L1,L2), degree of light intensity fluctuation (Q1,Q2), and light characteristic combination value (C1,C2).
Figure 7.
Graph of light intensity (L1,L2), degree of light intensity fluctuation (Q1,Q2), and light characteristic combination value (C1,C2).

Figure 8.
Territorial scope of the urban-rural fringe area in Beijing.


Table 1.
Regional classification and light characteristics in Beijing.
| Region Type | Light Intensity | Degree of Light Intensity Fluctuation | Combination Characteristic |
|---|---|---|---|
| Urban area | High | Low | High-low |
| Urban-rural fringe area | Middle | High | Middle-high |
| Rural | Low | Low | Low-low |
© 2017 by the authors. Licensee MDPI, Basel, Switzerland. This article is an open access article distributed under the terms and conditions of the Creative Commons Attribution (CC BY) license (http://creativecommons.org/licenses/by/4.0/).
Share and Cite
MDPI and ACS Style
Yang, Y.; Ma, M.; Tan, C.; Li, W. Spatial Recognition of the Urban-Rural Fringe of Beijing Using DMSP/OLS Nighttime Light Data. Remote Sens. 2017, 9, 1141. https://doi.org/10.3390/rs9111141
AMA Style
Yang Y, Ma M, Tan C, Li W. Spatial Recognition of the Urban-Rural Fringe of Beijing Using DMSP/OLS Nighttime Light Data. Remote Sensing. 2017; 9(11):1141. https://doi.org/10.3390/rs9111141
Chicago/Turabian StyleYang, Yuli, Mingguo Ma, Chao Tan, and Wangping Li. 2017. "Spatial Recognition of the Urban-Rural Fringe of Beijing Using DMSP/OLS Nighttime Light Data" Remote Sensing 9, no. 11: 1141. https://doi.org/10.3390/rs9111141
Note that from the first issue of 2016, this journal uses article numbers instead of page numbers. See further details here.