Technical Note

A New Approach to Energy Calculation of Road Accidents against Fixed Small Section Elements Based on Close-Range Photogrammetry

by
Alejandro Morales
1,
Luis Javier Sánchez-Aparicio
2,
Diego González-Aguilera
2,*,
Pablo Rodríguez-Gonzálvez
2,5,
David Hernández-López
4,
Miguel A. Gutiérrez
3 and
Alfonso I. López
3
1
Department of Computer Engineering and Automation, University of Salamanca, Plaza de los Caídos s/n, Salamanca 37008, Spain
2
Department of Land and Cartographic Engineering, High Polytechnic School of Ávila, University of Salamanca, Hornos Caleros, 50, Ávila 05003, Spain
3
Departamento Tecnológico, Catholic University of Ávila, C\Canteros s/n, Ávila 05005, Spain
4
Institute for Regional Development (IDR), Albacete, University of Castilla La Mancha, Albacete 02071, Spain
5
Department of Mining Technology, Topography and Structures, University of León, Avda. Astorga s/n, Ponferrada 24401, Spain
*
Author to whom correspondence should be addressed.
Remote Sens. 2017, 9(12), 1219; https://doi.org/10.3390/rs9121219
Submission received: 26 October 2017 / Revised: 21 November 2017 / Accepted: 23 November 2017 / Published: 26 November 2017

Abstract

:
This paper presents a new approach for energetic analyses of traffic accidents against fixed road elements using close-range photogrammetry. The main contributions of the developed approach are related to the quality of the 3D photogrammetric models, which enable objective and accurate energetic analyses through the in-house tool CRASHMAP. As a result, security forces can reconstruct the accident in a simple and comprehensive way without requiring spreadsheets or external tools, and thus avoid the subjectivity and imprecisions of the traditional protocol. The tool has already been validated, and is being used by the Local Police of Salamanca (Salamanca, Spain) for the resolution of numerous accidents. In this paper, a real accident of a car against a fixed metallic pole is analysed, and significant discrepancies are obtained between the new approach and the traditional protocol of data acquisition regarding collision speed and absorbed energy.

Graphical Abstract

1. Introduction

Traffic accidents are one of the most common causes of mortality in the world. More than 1.2 million lives are lost each year, which costs affected countries around 3% of their gross domestic product (GDP) [1]. Commonly, the evaluation of these accidents is carried out through methods of energetic analyses [2,3,4] that have significant sources of error, which include: (i) geometrical errors derived from the data acquisition protocol; (ii) mathematical errors derived from the linear relation between force and deformation; and (iii) road–car interactions, such as the presence of frictional forces.
These geometrical errors are the result of traditional methods of data collection such as Campbell’s [2], McHenry’s [3] and Prasad’s [4], which rely on expedited measurements taken manually in the field. These measurements are then inserted into mathematical equations to measure the collision speed and energy transformed during accidents. These measurements are obtained through a discrete manual strategy that uses measuring tapes and plummets, as well as an idealization of the reference geometry (an undamaged vehicle). As a result, errors are introduced that worsen the accuracy of the obtained results, which is a critical problem for the court and judicial cases that assign responsibilities for speeding on urban roads.
According to the European Road Assessment Program (EuroRAP), the three most common types of traffic accidents are: (i) run-off road collisions; (ii) front–rear impacts; and (iii) side impact accidents at intersections. Currently, local and national authorities pay particular attention to road accidents against fixed and rigid elements (e.g., natural trees or artificial steel poles). The complex deformation suffered by the car along the contact area can induce errors of up to 30% in the linear mathematical models [5]. It should be noted that errors in measurements taken in the field can increase this deviation. A lack of consideration of the frictional forces involved also introduces great discrepancies between the computed collision speed and its real value.
From a mathematical point of view, several authors have investigated traffic accidents against rigid elements through the use of the equivalent barrier speed (EBS) [6,7]. This index was initially proposed by the National Transportation Safety Board (NTSB) in 1981 [8] for the evaluation of traffic accidents against trees, using the following three factors: (i) the maximum deformation on the impact area; (ii) the collision speed at which the rigid element does not suffer any deformation; and (iii) the linear relation between the collision speed and the deformation suffered by the vehicle. This equation was later extended to poles made with wood, including the dimensions of the pole, the vehicle’s mass, the maximum deformation suffered by the vehicle, and the absorbed energy as variables [9]. Since this equation did not take into account the energy absorbed by the pole, Nystron and Kost [10] proposed a new formula for the energetic analysis of traffic accidents against rigid elements based on the relation between the mass of the vehicle, the maximum deformation suffered by the car, and two empirical constants derived from a total of 19 tests carried out with rigid steel poles [10]. Parallel to this, Vomhof [11] proposed a new approach for the evaluation of the EBS based on a minimum speed equation. This equation related the deformation suffered by the vehicle to a drag factor (derived from the crush of the vehicle in the impact), and also included a correction factor that depended on the properties of the pole (rigid or not) [11]. This drag factor was obtained from an experimental campaign that involved a total of 1000 study cases. In 1993, Craig [12] developed a new equation for the analysis of this type of accident. This formula related the maximum deformation suffered by the vehicle to its size through using results provided by 49 frontal accidents against poles. However, if the accident implied an eccentric collision due to the rotation of the car, this equation’s results could underestimate the real effects [12]. Parallel to Craig, Wood et al. (1993) [5] developed a more realistic model for traffic accidents against rigid elements based on a total of 202 tests that involved the impact of a vehicle against a rigid element. Wood et al. concluded that the energy absorbed during the traffic accident was proportional to the mass of the vehicle and the normalised crushing distance through using measurements taken in the field, as well as two experimental coefficients that depend on the deformation and length of the vehicle [5].
Wood’s method has been considered the most sophisticated and robust model for the study of traffic accidents against fixed elements. As a result, data acquisition protocol is manual and expedited, which can entail the presence of large deviations and thus large discrepancies between the computed collision speed and its real value. Authors such as Luhmman et al. (2006) [13] and González-Aguilera et al. (2013) [14] among others, have proposed the use of photogrammetric approaches in order to estimate the deformation suffered by the vehicle after the traffic accident. This type of approach requires the use of metric cameras and/or coded targets for the external orientation of the photogrammetric network [13,14,15]. Recently, Morales et al. (2015) [16] have proposed the use of a motion approach for the energetic analysis of traffic accidents that combines the advantages offered by computer vision (automation and flexibility) and photogrammetry (accuracy and reliability). This combination obtains accurate 3D digitalisations of both damaged cars and their deformations, which enables accurate estimations of collision speed [16].
This paper extends this research [16] through focussing on accidents against small rigid elements, with special emphasis on the geometrical errors that arise from the traditional protocols. Additionally, this paper introduces an enhanced version of the photogrammetric approach proposed previously by Morales et al. (2015) [16]. Enhancements relate to the extraction of key points and the orientation and self-calibration of the photogrammetric network. For the former, the affine maximum self-dissimilarity (AMSD) algorithm is introduced. The aim of the AMSD algorithm, a novel detector, is to detect key points in unfavourable scenes characterised by important geometric and radiometric changes. An enhanced and robust version of the traditional L2-Norm (Euclidean Norm) is used as a complement to obtain better results in the matching stage. As for orientation and self-calibration, the proposed methodology includes a spatial filtering that ensures a homogeneous distribution of the key points along the camera’s sensor. This will guarantee more reliable results during the resolution of the bundle adjustment of the photogrammetric network.
Within this context, the paper has been organised as follows: Section 2 describes in detail the method proposed for the evaluation of traffic accidents against rigid poles; Section 3 defines CRASHMAP, the in-house tool developed; Section 4 shows the experimental results after applying the proposed method, and compares them with those obtained by the traditional approach; and finally, Section 5 summarises the conclusions arising from the use of the proposed method, as well as suggestions for future research.

2. Energy Analysis of the Accident in Impacts against Fixed Elements

2.1. Data Acquisition

Traditional methods such as those developed by McHenry et al. [3] and Wood et al. [5] have proposed the use of expeditious protocols based on manual measurements taken in the field. These procedures are highly dependent on the operator’s skills [15], as they require the use of complex tools for data acquisition (Figure 1a) and a high user intervention. These methods also depend on an idealisation of the vehicle’s geometry in order to obtain referenced measurements (Figure 1b). In the case of frontal accidents against rigid elements, this idealisation includes marking a line on the asphalt parallel to the rear axle of the car, at a distance from the deformed shape of the vehicle, for which all of the measurements are positive (Figure 1b). Once the reference line is placed, the user needs to take a total of two, four, or six measurements, in which the first and the last measurement should be in line with the lateral limits of the vehicle (Figure 1b). The number of measurements considered for the energetic analysis are dependent on the width of the vehicle, using a minimum of six measurements for widths over 60 cm [5].
From the measurements taken, Cn, it is necessary to deduce the distance between the reference line considered and the hypothetical position of the car’s front without deformation (X). This value can be obtained from Equation (1):
X = D − [E + F]
where X is the distance between the reference line and the front of the vehicle without any deformation, D is the distance between the reference line and the rear axle of the vehicle, E is the vehicle’s wheelbase, and F is the distance between the front axle and the front of the vehicle. The last two variables, E and F, can be obtained from the technical specifications of the vehicle.
As can be observed, the method does not consider the real geometry of the car. The measurements reference a horizontal line parallel to the rear axle of the vehicle, which is an element that can be damaged as a result of the impact. These measurements are taken at the height of the car bumper, which requires the use of several tools such as a measuring tape, a plummet, or ropes (Figure 1a).
The limitations of this method relate to the introduction of geometrical errors from the idealisation of car’s geometry, the limited number of measurements used to define the deformation, and human errors during the data acquisition. A simple photogrammetric protocol can address these limitations. This protocol has been designed to assist non-expert users in this type of data acquisition through using conventional cameras or even smartphones. In particular, the user only needs to focus on the part of the vehicle that has suffered the impact with the fixed object, and capture between five and nine images following a cross shape, as shown (Figure 2). The overlap between adjacent images needs to be at least 80%. The master image or central image will capture the area of interest. The remaining photos (between two and four images) are complementary, and should be taken above, below, and to the left and right of the central image. These photos should adopt a certain degree of perspective, turning the camera towards the middle of the interest area. This perspective enables the reconstruction of the surroundings parts of the vehicle without deformation.

2.2. Photogrammetric Processing

The photogrammetric processing was performed using the GRAPHOS open source tool (inteGRAted PHOtogrammetric Suite) developed by Gonzalez-Aguilera et al. (2016) [17] (available at https://github.com/itos3d/GRAPHOS). More details about the tool and the implemented photogrammetric workflow can be found in González-Aguilera et al., (2016) [17].
Next, the most representative novelties of the photogrammetric workflow are compared with those previously developed for the analysis of accidents [16], and improvements in feature extraction, matching, and orientation steps are highlighted.

2.2.1. Feature Extraction

A new detector, the affine maximal self-dissimilarity (AMSD) algorithm, was used to extract key points on the different images acquired. This algorithm can be considered a variant of the maximal self-dissimilarity (MSD) detector developed by Tombari and Di Stefano (2014) [18], as it includes the same main perspective and geometric parameters.
The MSD detector relies on a saliency operator, μ(k) (Equation (2)), which measures the contextual self-dissimilarity of a point, p, i.e., how much the patch around p is dissimilar from the most similar one in its surroundings, which in this case is the patch around a point, q. The terms p and q denote the pixel centre belonging to the patches under comparison:
μ ( k ) ( p , p ω , p a ) = 1 p ω 2 k i = 1 k δ i ( ω ( p , p ω ) , ω ( q , p ω ) )
where pω and pa define the size of the patches under comparison, and the size of the area from which the patches are drawn, respectively. ω(p, pω) denotes the operator defining a square image region centred at pixel p with a size equal to pω pixels, while k is the number of neighbours considered during the computation of μ(k), and δi denotes the distances between the vectors collecting the intensities of two equally-sized image patches, similar to the squared L2 distance.
It should be noted that pa defines the spatial support (local or global) of the saliency criterion. In our case, we replace the local self-dissimilarity that is usual in the most popular interest point detectors in photogrammetry (e.g., Förstner operator based on a 1-nearest neighbour (1-NN) search problem) with a contextual self-dissimilarity notion. As a result, the most similar patch among a set of candidates can be interpreted as a search of k-NN nearest neighbours, through estimating the minimum as the average across the k most similar patches. The parameter k provides distinctiveness and computational efficiency for repeatability and accurate localisation in noisy conditions, since the classical 1-NN search is potentially prone to noise, which could induce considerable variations in saliency scores, and thus hinder an accurate detection of salient points.
Through Equation (2), we determine a saliency map that encloses the dissimilarity of the patch centred at each pixel with respect to the surrounding area. In order to provide a more independent score of the patch size, pω, about the saliency, a normalisation by means of the number of pixels involved in the computation of the self-dissimilarity is considered.
However, while MSD performs well with radiometric changes (multimodal matching), the new AMSD algorithm also includes the main perspective geometric parameters, i.e., the angles defining the camera axis orientation (φ, θ). In this manner, the AMSD algorithm can find maximal self-dissimilarities in images that have a high scale and rotation difference, which is common in close-range scenes of road accidents. The result is an invariant detector that supports the hypothesis that image patches that are highly dissimilar over a relatively large extent of their surroundings hold the property of being repeatable and distinctive.
This result provides the next expression:
A F = [ a b c d ] = H λ R 1 ( ψ ) T t R 2 ( ϕ ) = λ [ c o s ψ s i n ψ s i n ψ c o s ψ ] [ t 0 0 1 ] [ c o s ϕ s i n ϕ s i n ϕ c o s ϕ ]
where AF is the affinity transformation that contains scale, λ, which is related to the zoom parameter; and ψ controls the camera rotation angle around the optical axis. This angle does not generate perspective; φ controls the longitude angle between the optical axis and a fixed vertical plane; θ = arccos (1/t) controls the latitude angle between the optical axis and the normal to the image plane. Tilt: t >1; θ [0°, 90°]. (φ, θ) control the perspective geometric parameters that correspond to the inclination of the camera optical axis.
Equation (3) comes from the singular value decomposition (SVD) of an affine map, and is based on the work of Morel and Yu [19], in which the second eigenvalue is set equal to one, and the first (variable t) has to be higher than one. The translations are dismissed by assuming (without loss of generality) that the camera axis meets the image plane at a fixed point [19].
Equation (3) is combined with Equation (2) following the same strategy established by Morel and Yu, (2009) [19]; that is, Equation (3) allows us to generate different viewpoints (transition tilts), which are employed to feed the MSD detector (Equation (2)). In particular, different transition tilts are generated to support the affine transformations. The images are transformed to simulate changes in the camera optical axis. These simulations are carried out by latitude (θ) and longitude (φ) rotations. The t (tilt) variable controlled by the user is employed to set, firstly, the longitude (φ) rotations defined as 72°/t, and secondly, the latitude rotation as t = 1/cos(latitude(θ)).

2.2.2. Robust Matching

Once the key points are extracted, a matching strategy should be applied to identify identical points between images. To this end, a robust matching approach was incorporated that provides considerable improvements in comparison with the classical L2-norm (Euclidean norm) matching strategy [20], or even the efficient FLANN (fast library for approximate nearest neighbours) strategy [21], independently from the protocol followed in data acquisition.
The robust matching approach applies a brute force matching strategy based on L2-norm distance but adding a twofold filtering process. The idea for implementing the sequential twofold process is to get the best matches, and avoid those that provide worse quality and possible outliers.
  • First, for each extracted point, the distance ratio between the two best candidates in the other image is compared with a threshold. If a high distance ratio is obtained, the match could be ambiguous or incorrect. According to the probability distribution function defined by Lowe (2004) [22], a threshold >0.8 provides a good separation among correct and incorrect matches. The greater the ratio value, the greater the amount of matched points, and thus the presence of outliers.
  • Second, those matches that overcome the ratio test are filtered by a threshold K, accepting only the matches for which the difference in descriptors is below K. To this end, the descriptors distances are normalised in the range [0,1], and the computation of the threshold K is established by multiplying the maximum descriptor distance for a factor between 0 and 1. The matches’ pairs whose distance is greater than the threshold K are rejected. A K = 1 factor implies that no refinement is done (all matches are kept).

2.2.3. Images Orientation and Self-Calibration

As result, the final set of valid correspondences is used to compute the relative orientation (fundamental matrix) between image pairs. Previously, the final image correspondences are filtered and assessed by a camera´s sensor assistant, which graphically checks the spatial distribution of interest points along the camera sensor. An asymmetric distribution of the key points will negatively affect the correct determination of image orientation and the camera’s self-calibration parameters, as well as increase the computation time. Therefore, if the matching points do not cover an area of more than two-thirds of the camera sensor format, the user will be alerted in order to modify the detector and matching parameters. Once the camera´s sensor spatial filtering has been applied, the images are oriented and self-calibrated through a bundle adjustment based on collinearity conditions [23]. This iterative adjustment can be performed with internal constraints (i.e., free network), or with external constraints (e.g., known distances or ground control points).

2.3. Energetic Analysis of Pole Impacts

As for energetic analysis, Wood’s method [5] was used to evaluate the energy absorbed by the car during the pole impact. This model relates the energy absorbed with the normalised deformation experienced by the vehicle. This is calculated using the following expression:
E a m T = A ( ( D m e d D m a x ) L n ( 1 ( 1 D m a x L ) ) + B )
where Ea is the energy absorbed by the car, mT is the total weight of the car (including passengers), and A and B are empirical coefficients obtained by Wood [5] (Equations (5) and (6)), while Dmed is the average deformation, obtained from two, four or six measurements, and Dmax is the maximum deformation suffered by the vehicle.
If   D m e d D m a x Ln ( 1 D m a x L ) 1 < 0.05 A   =   537   and   B   =   0.00072
If   D m e d D m a x Ln ( 1 D m a x L ) 1 > 0.05 A   =   1191   and   B   =   0.0235
where L is the length of the car.
Once the energy of deformation has been obtained in Equation (4), it is possible to calculate the EBS through the application of the following expression, Equation (7):
E B S = 2 E a m T
Finally, the collision speed, Vcol, is obtained through Equation (8). During this analysis, it is necessary to consider the presence of eccentricity (collision for which the longitudinal axis is not aligned with the contact surface generated between the car and the rigid element). In this case, the presence of eccentricity is corrected through the vehicle’s mass, according to the expression proposed by Wood et al. [5], which is shown in Equation (8):
V c o l = ( m T m S ) E B S
where ms is the weight of the car, and mT is the total weight (considering the weight of the car and its occupants):
m s e = m s ( k r 2 k r 2 + D 2 c e n t )
where mse is the corrected mass of the vehicle, kr is the horizontal pivot radius, and Dcent is the orthogonal distance between the action line of the principal impact force and the gravitational center of the vehicle.
For the pivot radius, the following expression can be used:
k r 2 = 0.931 ( L f 2 + L 2 ) 12
where Lf represents the width of the car, and L is the total length of the vehicle.
As can be observed, the mathematical model proposed by Wood depends on the values of the measurements taken in the field: the average deformation (Dmed), the maximum deformation (Dmax), and the horizontal pivot radius (kr). Usually, these measurements are taken in the field through the use of expedited techniques (e.g., the use of rods to mark the reference line, or the use of measuring tapes). This requires, in most of the cases, the visual interpretation of several factors, such as the point of maximum deformation or the estimation of the non-deformed front of the car. The geometrical errors introduced by using this method will affect the accuracy of the results provided by the subsequent energetic analysis.

3. CRASHMAP: A Software for the Energetic Analysis of Road Accidents

Currently available commercial products devoted to the reconstruction and energetic analysis of traffic accidents bypass the use of robust and accurate 3D models. In light of this limitation, in-house software named CRASHMAP has been developed in order to provide a robust tool for security forces. Based on the advantages offered by the structure from motion approach (low-cost and flexibility) and photogrammetry (accuracy and reliability), the different measurements defined before and the corresponding energetic analysis of traffic accidents can be computed and analysed. As a result, objective and accurate expert reports can be generated by the security forces.
Inside this software, two plugins can be highlighted (both programmed in C++/QT):
  • A desktop application, CRASHMAP_desktop (Figure 3), whose main goal is to assist the user during the energetic analysis of traffic accidents that involve one or several vehicles. This tool allows, among other things, the evaluation of the deformations suffered by the vehicle/s through the analysis of the 3D photogrammetric models. For these deformations, CRASHMAP_desktop can carry out energetic analysis. In its current version, CRASHMAP_desktop allows the evaluation of the following:
    -
    The analysis of the deformation energy and the equivalent barrier speed in different types of traffic accidents (including impacts against small-section elements) through the use of Prasad’s [24] and Wood’s [5] methods.
    -
    The energy dissipated during the traffic accident due to the friction and the deformation experience, by means of the analysis of the braking time, braking distance, and the evaluation of the skid marks on the road.
    -
    The calculation of the speed of the vehicle through the analysis of the skid marks.
    -
    The evaluation of the braking distance by means of the speed of the vehicle.
    -
    Analysis of pedestrian accidents using Searle’s method [25].
  • A cloud application, CRASHMAP_cloud (Figure 4), allows the photogrammetric reconstruction of crashed vehicles in a semi-automatic way (see Section 2.2) through using proprietary architecture built on the cloud, and avoiding the use of high-end computers by the user. This requires only the uploading of the images acquired, as well as basic information about the camera and the measurements taken in the field (in order to scale the model). Once CRASHMAP_cloud ends the reconstruction of the damaged vehicle, the user receives an alert to download the generated 3D model.
The CRAHSMAP_desktop offers two possibilities for obtaining the measurements required for energetic analysis:
  • Manual approach: This option is a reproduction of the traditional method. In this case, the user selects a point on the damaged model, and the software computes the orthogonal distance between this point and the undamaged model. This approach offers a more robust and reliable alternative to measurements taken in the field. Complementary to this, the software provides additional tools to create lines and rotate the model or the measurement of angles, among other options.
  • Automatic approach: If the user selects this option, the software loads a 3D model (without deformation) of the car. Then, the software carries out an automatic registration of both models by means of the approach proposed by Makadia et al. [26], considering the undamaged model as reference. Once the model is properly registered, the CRASHMAP_desktop applies the symmetrical Hausdorff metric [27] with the aim of obtaining the discrepancies (deformations) presented between the damaged and the undamaged models. Thanks to this, it is possible to get the required values, Dmax, Dmed, and Dcent (in the case of eccentric accidents), in order to evaluate the speed of the vehicle at the moment of the impact, as well as the EBS.

4. Experimental Results

In order to validate the proposed methodology, a frontal collision between a Citroën Berlingo Combi and an advertising marquee (rigid steel pole) was evaluated (Figure 5a). The technical specifications of the van are shown in Table 1. Based on the visual inspection of the van, the presence of an asymmetric deformation pattern is observed (Figure 5b), suggesting the occurrence of an eccentric frontal accident against a fixed element.

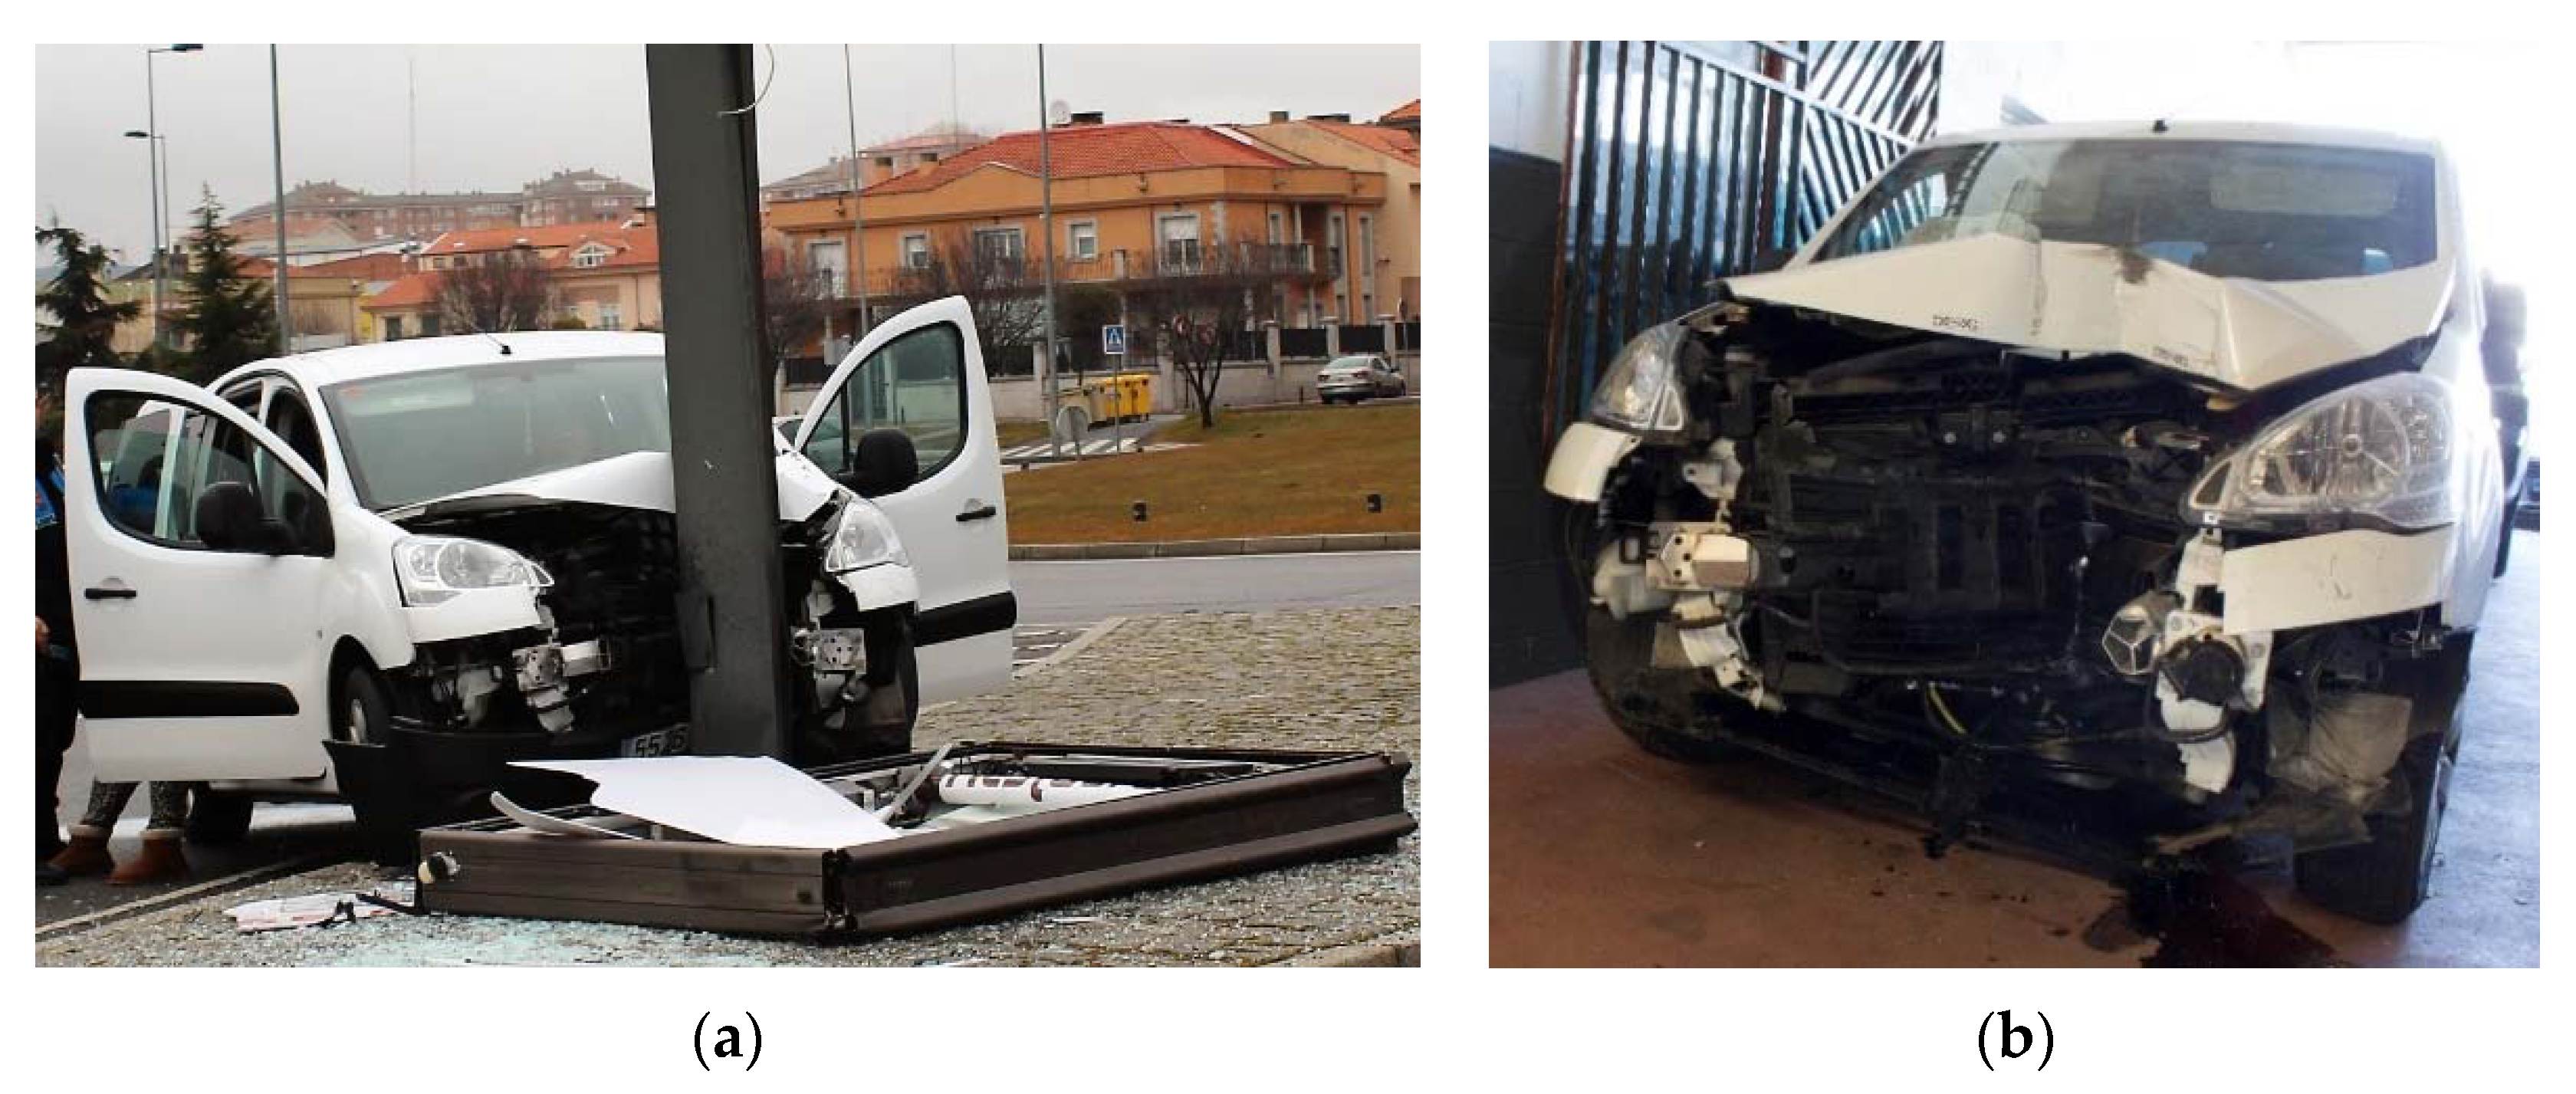
4.1. Data Acquisition Protocol

With the aim of analysing the energy involved in the traffic accident, two reconstructions were carried out: (i) the reconstruction of the car after the crash (damaged model), and (ii) the reconstruction of the car without any damage (undamaged model). For the reconstruction of the undamaged model, a similar vehicle (same model and year) was used (Figure 6).
Concerning the photogrammetric protocol, both models (damaged and undamaged) were reconstructed following the guidelines defined in Section 2.1. Seven images were captured: five following a cross shape in the center of the interest area, and two complementary images to capture the non-deformed shape (Figure 6). A consumer reflex camera Canon 700D equipped with a zoom lens 18–70 mm was used to capture the images (Table 2). During the image acquisition, a constant focal length of 18 mm was maintained. In order to scale the photogrammetric model, several magnetic scaled stickers were placed along the interest area (Figure 6).

4.2. Photogrammetric Processing

With regard to the photogrammetric processing, the proposed method (AMSD and robust matching) showed better results during the stages of detection and the matching of key points in comparison with its predecessor (MSD + L2-Norm) [18]. The proposed method allowed the extraction of 1500 key points (738 key points were extracted through the use of the MSD detector) and the matching of 246 points (only eight points were matched by means of the MSD + L2-norm) (Figure 7). Both cases were carried out in similar conditions of repeatability (e.g., similar thresholds and illumination conditions).
Previous to the orientation and self-calibration of the photogrammetric network (Table 3), an analysis of the distribution of the matching points along the camera’s sensor was performed (Figure 8). This analysis allowed the evaluation of their spatial distribution, forcing a better distribution of the points considered during the orientation and self-calibration phases.
Concerning the final accuracy of the photogrammetric network, the proposed approach (AMSD + robust matching + camera´s sensor spatial filtering) obtained a root mean square error (RMSE) of 1.2 pixels (Figure 8a). This approach showed better accuracy than the results obtained by the application of the AMSD algorithm + robust matching without applying the camera´s sensor spatial filtering, with a RMSE of 2.8 pixels (Figure 8b).
Based on the robust orientation obtained from applying the AMSD algorithm, the robust matching, and camera´s sensor spatial filtering, a dense reconstruction process was carried out through applying the MicMac algorithm [28]. As a result, two point clouds were obtained: (i) the damaged point cloud composed by 1,922,543 points, and (ii) the undamaged point cloud composed by 1,721,951 points. Both models were placed in different coordinates systems and registered following the approach defined in Section 2.1, which allowed the evaluation of the deformation suffered by the car during the traffic accident. This analysis was carried out using the symmetrical Hausdorff distance as a metric of comparison [27].

4.3. Energetic Analysis of the Pole Impact

As outlined in Section 2.3, Wood’s method was used to analyse the energy involved in the traffic accident [4]. During this evaluation, the following considerations were taken into account: (i) the energy absorbed by the car through the deformation of its non-structural components, and (ii) the rotation energy generated due to the eccentricity of the impact. The frictional energy due to the lack of skid marks on the road, and the energy absorbed by the structural components due to their rigidity and resistance were both dismissed.
It should be noted that the accuracy of this method depends on the accuracy of the following values: Dmax, Dmed, and Dcent, in the case of eccentric accidents against fixed elements. With the aim of evaluating this dependency, two tests were carried out: (i) test A was based on the traditional protocol; and (ii) test B was carried out following the proposed method. The results provided by these two approaches were compared as follows:
  • Evaluation of the discrepancies between the traditional methods and the proposed method.
  • Analysis of the average deformation (Dmed) through the traditional protocol (with a total of six measurements manually taken in the field), and through the proposed method (with 30 automatic measurements equally spaced along the width of the car).
  • Comparison of the results obtained by both methods (EBS and the collision speed of the vehicle).
For the first test, test A, the traditional protocol was applied. In this case, the first step was the creation of an approximate reference line at the height of the vehicle’s bumper, and parallel to the rear axle of the car. Once the reference line was created, a total of six equally-spaced measurements were taken between the limits of the reference line in order to calculate the average deformation (Dmed). An additional measurement was taken for the maximum deformation (Dmax). Since the accident presented an eccentricity, the evaluation of the variable Dcent was required. This variable was calculated through measuring the orthogonal distance between the point of maximum deformation and the longitudinal axis of the vehicle (placed in the middle of the car), obtaining the results shown in Table 4. The difficulty of guaranteeing that both profiles (in tests A and B) were taken at the same height should be noted. This reflects some of the main limitations of the traditional protocol, which is based on expeditious methods using an approximate reference line and collecting data under unfavourable conditions.
According to Wood’s method, six equidistant measurements were taken following a specific protocol (Section 2.1). In addition, the officer should appreciate the area with the highest deformation and take an additional measurement, Dmax.
With respect to the second test, test B, the photogrammetric models obtained in Section 4.2 were used to evaluate the deformations suffered by the vehicle after the traffic accident. The software CRASHMAP, through the use of the plugin CASHMAP_desktop, was used to evaluate the discrepancies between the damaged and the undamaged models, allowing the analysis of the energy absorbed (EBS) and the collision speed (Vcol). In the first stage, the automatic registration method proposed by Makadia et al. [26] was used to place both models in the same coordinate system, considering the undamaged model as reference. During this stage, different 3D detectors (e.g., VoxelGrid, Harris3D) and descriptors (e.g., SHOT, PFH) were used in order to find the best registration solution. It should be noted that these detectors/descriptors are only applied to the common parts of the vehicle without deformation; otherwise, the automatic alignment would be impossible. Following the proper registration of the damaged model, the software applied the symmetrical Hausdorff metric [27] with the aim of evaluating the discrepancies (deformations) between the original car’s shape (undamaged model) and the shape of the car after the traffic accident (damaged model). During this evaluation, the CRASHMAP_desktop creates a pseudo-colour map, assigning a pseudo-colour to each deformation value. This pseudo-colour map allows the full-field evaluation of the deformations suffered by the vehicle (Figure 9).
In order to obtain the values of the deformations experienced by the vehicle (Dmax and Dmed), the CRASHMAP_desktop applies the following workflow (Figure 10): (i) analysis of the histogram of discrepancies; (ii) extraction of the maximum value (Dmax); (iii) creation of the comparison section at the height of the point with maximum deformation; (iv) extraction of the deformations based on a user-input threshold (spacing between measurements); and (v) evaluation of the average deformation (Dmed). Through the histogram of discrepancies generated from our method, we can know the whole deformation geometry of the vehicle and also estimate Dmax and Dmed with more accuracy. The results obtained are shown in Table 5.
Additionally to this, and due to the presence of eccentricity during the traffic accident, it was necessary to evaluate the orthogonal distance, Dcent, between the longitudinal axis of the vehicle and the point with the maximum deformation. The CRASHMAP_desktop evaluates the width of the vehicle (undamaged model), calculates the longitudinal axis of the car, and obtains the value of the variable Dcent (Table 6).
As expected, the value of the deformations (Dmax and Dmed), as well as the value of the distance between the longitudinal axis and the point of maximum deformation (Dcent) differ between both methods (Table 6). These discrepancies can be attributed to the introduction of human errors during the data acquisition, which can include the stress of the situation, the expeditious nature of the method, the idealisation of the front of the car, and the use of a low number of measurements to represent the whole deformation of the vehicle. As a result, a discrepancy of 21,827.67 J (17% of variation) in the absorbed energy and a variation of 6.19 km/h in the collision speed, is observed (Table 6). This discrepancy can be considered critical if the speed limit of the road is close to the collision speed of the vehicle (e.g., limitation of 30 km/h for the present study case).

5. Conclusions

This article proposes a new approach for the energetic analysis of traffic accidents against fixed elements. It exploits the geometrical features of photogrammetric point clouds in order to evaluate the energy that is transformed during a traffic accident, and thus, the speed at which the car impacts against a fixed element.
In comparison with the previous work carried out by the authors, several improvements were introduced during the photogrammetric reconstruction, namely: (i) the novel algorithm AMSD (affine maximal self-dissimilarity); (ii) a robust matching of key points; and (iii) an analysis of the spatial distribution of the matching points along the camera´s sensor. This photogrammetric approach has shown a better performance in comparison with its predecessor, which is based on the MSD algorithm and the standard L2-norm. It makes the reconstruction of unfavourable scenes possible, and introduces important radiometric and geometric changes, without requiring the use of pre-processing stages.
Concerning the energetic method used to evaluate the traffic accident, the present approach has enabled the minimisation of the geometrical errors derived from the traditional method, which was based on expeditious protocols and relied on an idealisation of the geometry of the car. It can also use a large number of measurements for the evaluation of the maximum (Dmax), the average deformations (Dmed), and the orthogonal distance between the longitudinal axis of the car and the point with maximum deformation (Dcent).
With respect to the case study analysed to validate the method, it is possible to observe relevant discrepancies between the results derived from the traditional protocol (with a collision speed of 36.05 km/h and an absorbed energy of 84,619.46 J) and those obtained by the proposed approach (collision speed of 30.31 km/h and an absorbed energy of 62,791.79 J). These discrepancies emphasise the importance of the geometry in the rigorous evaluation of traffic accidents, and thus the use of robust 3D modelling strategies. These energetic analyses were carried out with CRASHMAP, an in-house tool developed for this purpose. CRASHMAP has been built following a client–server architecture composed by a total of two plugins: (i) CRASHMAP_cloud, a plugin that allows the 3D reconstruction of traffic accidents on the cloud, avoiding the use of high-end computers and; (ii) CRASHMAP_desktop, a plugin that enables the evaluation of traffic accidents through the analysis of the deformations suffered by the vehicle. From this analysis, the energy involved during the accident and the collision speed can be obtained. This last parameter is a critical factor for the resolution of court and judicial cases.
Future works will be focussed on carrying out further experimental campaigns that simulate different traffic accidents and conditions in order to improve the empirical coefficients used in the different equations. In particular, a robust comparison of photogrammetric and manual results with controlled experiments that also include a calibration of coefficients will be considered in future study. Last but not least, several approaches will be tested in order to automatically recognise the scale bars used during the data acquisition. This recognition will enable the full automatic reconstruction of traffic accidents.

Acknowledgments

We are grateful to the local police and the Avila’s firefighters. In addition, the authors want to thank cars owners for allowing us to reconstruct the vehicles.

Author Contributions

All authors conceived and designed the study. A.M. implemented the methodology. All authors discussed the basic structure of the manuscript. A.M. and D.G.-A. wrote the document and all authors read and approved the final manuscript.

Conflicts of Interest

The authors declare no conflict of interest.

References

  1. Global Status Report on Road Safety 2015. Available online: http://www.who.int/violence_injury_prevention/road_safety_status/2015/en/ (accessed on 10 July 2017).
  2. Campbell, K.L. Energy Basis for Collision Severity; SAE Technical Paper: Warrendale, PA, USA, 1974. [Google Scholar]
  3. McHenry, R. A Comparison of Results Obtained with Different Analytical Techniques for Reconstruction of Highway Accidents; SAE Technical Paper: Warrendale, PA, USA, 1975. [Google Scholar]
  4. Prasad, A. Energy Absorbed by Vehicle Structures in Side-Impacts; SAE Technical Paper: Warrendale, PA, USA, 1991. [Google Scholar]
  5. Wood, D.P.; Doody, M.; Mooney, S. Application of a Generalised Frontal Crush Model of the Car Population to Pole and Narrow Object Impacts; SAE Technical Paper: Warrendale, PA, USA, 1993. [Google Scholar]
  6. Burdzik, R.; Folęga, P.; Konieczny, B.Ł.; Stanik, Z.; Warczek, J. Analysis of material deformation work measures in determination of a vehicle’s collision speed. Arch. Mater. Sci. 2012, 58, 13–21. [Google Scholar]
  7. Fenton, S.; Johnson, W.; LaRocque, J.; Rose, N.; Ziernicki, R. Using Digital Photogrammetry to Determine Vehicle Crush and Equivalent Barrier Speed (EBS); SAE Technical Paper: Warrendale, PA, USA, 1999. [Google Scholar]
  8. National Transportation Safety Board. Special Study: Motor Vehicle Collisions with Trees along Highways, Roads, and Streets: An Assessment; The Board: Washinton, DC, USA, 1981; p. 69. [Google Scholar]
  9. Morgan, J.R.; Ivey, D.L. Analysis of Utility Pole Impacts; SAE Technical Paper: Warrendale, PA, USA, 1987. [Google Scholar]
  10. Nystrom, G.A.; Kost, G. Application of the NHTSA Crash Database to Pole Impact Predictions; SAE Technical Paper: Warrendale, PA, USA, 1992. [Google Scholar]
  11. Vomhof, D.W. Speed from crush formula. In Proceedings of the Conference on Reconstruction And Safety on the Highway (CRASH’98), College Station, TX, UISA, 26–30 October 1998. [Google Scholar]
  12. Craig, V. Analysis of pole barrier test data and impact equations. Accid. Reconstr. J. 1993, 5. [Google Scholar]
  13. Luhmann, T.; Robson, S.; Kyle, S.; Harley, I. Close Range Photogrammetry: Principles, Methods and Applications; Whittles Publishing: Scotland, UK, 2006. [Google Scholar]
  14. González-Aguilera, D.; Muñoz-Nieto, Á.; Rodríguez-Gonzalvez, P.; Mancera-Taboada, J. Accuracy assessment of vehicles surface area measurement by means of statistical methods. Measurement 2013, 46, 1009–1018. [Google Scholar] [CrossRef]
  15. Du, X.; Jin, X.; Zhang, X.; Shen, J.; Hou, X. Geometry features measurement of traffic accident for reconstruction based on close-range photogrammetry. Adv. Eng. Softw. 2009, 40, 497–505. [Google Scholar] [CrossRef]
  16. Morales, A.; Gonzalez-Aguilera, D.; Gutiérrez, M.A.; López, A.I. Energy analysis of road accidents based on close-range photogrammetry. Remote Sens. 2015, 7, 15161–15178. [Google Scholar] [CrossRef]
  17. González-Aguilera, D.; López-Fernández, L.; Rodriguez-Gonzalvez, P.; Guerrero, D.; Hernandez-Lopez, D.; Remondino, F.; Menna, F.; Nocerino, E.; Toschi, I.; Ballabeni, A. Development of an all-purpose free photogrammetric tool. ISPRS Int. Arch. Photogramm. Remote Sens. Spat. Inf. Sci. 2016, 6, 31–38. [Google Scholar] [CrossRef]
  18. Tombari, F.; Di Stefano, L. Interest points via maximal self-dissimilarities. In Proceedings of the Asian Conference on Computer Vision, Singapore, 1–5 November 2014; pp. 586–600. [Google Scholar]
  19. Morel, J.-M.; Yu, G. ASIFT: A new framework for fully affine invariant image comparison. SIAM J. Imaging Sci. 2009, 2, 438–469. [Google Scholar] [CrossRef]
  20. Kullback, S.; Leibler, R.A. On information and sufficiency. Ann. Math. Stat. 1951, 22, 79–86. [Google Scholar] [CrossRef]
  21. Muja, M.; Lowe, D.G. Flann, fast library for approximate nearest neighbors. In Proceedings of the International Conference on Computer Vision Theory and Applications (VISAPP’09), Lisboa, Portugal, 5–8 February 2009. [Google Scholar]
  22. Lowe, D.G. Distinctive image features from scale-invariant keypoints. Int. J. Comput. Vis. 2004, 60, 91–110. [Google Scholar] [CrossRef]
  23. Kraus, K.; Jansa, J.; Kager, H. Advanced Methods and Applications Vol 2. Fundamentals and Standard Processes Vol. 1; Institute for Photogrammetry Vienna University of Technology: Bonn, Germany, 1993. [Google Scholar]
  24. Prasad, A. CRASH3 Damage Algorithm Reformulation for Front and Rear Collisions; SAE Technical Paper: Warrendale, PA, USA, 1990. [Google Scholar]
  25. Searle, J.A.; Searle, A. The Trajectories of Pedestrians, Motorcycles, Motorcyclists, etc., Following a Road Accident; SAE Technical Paper: Warrendale, PA, USA, 1983. [Google Scholar]
  26. Makadia, A.; Patterson, A.; Daniilidis, K. Fully automatic registration of 3d point clouds. In Proceedings of the 2006 IEEE Computer Society Conference on Computer Vision and Pattern Recognition, New York, NY, USA, 17–22 June 2006; pp. 1297–1304. [Google Scholar]
  27. Hausdorff, F.; Brieskorn, E. Felix Hausdorff-Gesammelte Werke Band III: Mengenlehre (1927, 1935) Deskripte Mengenlehre und Topologie; Springer Science & Business Media: Berlin/Heidelberg, Germany, 2008; Volume 3. [Google Scholar]
  28. Micmac Website. Available online: http://www.tapenade.gamsau.archi.fr/TAPEnADe/Tools.html (accessed on 20 October 2017).
Figure 1. Classical protocol: (a) procedure used to take the measurements, and (b) graphical representation of the measurements considered during the energetic analysis.
Remotesensing 09 01219 g001
Figure 2. Photogrammetric data acquisition protocol based upon capturing between five and nine images of the part of the vehicle that has suffered an impact. The master image is in green, and the complementary photos are in red.
Remotesensing 09 01219 g002
Figure 3. CRASHMAP_desktop interface: tool for the visualisation of photogrammetric 3D models, which can create deformation maps for comparison, dimensional analysis, and energetic analysis.
Remotesensing 09 01219 g003
Figure 4. CRASHMAP_Cloud interface: tool for photogrammetric cloud computing. In addition, an external database is created for each accident, as well as a 3D database of original vehicles, which is useful for automatically computing deformations.
Remotesensing 09 01219 g004
Figure 5. Traffic accident evaluated: (a) results after the impact of the van against the fixed element, and (b) detailed view of the car’s frontal after the accident.
Remotesensing 09 01219 g005
Figure 6. Data acquisition protocol used to digitalise the car’s frontal: (a) deformed model; and (b) non-deformed model.
Remotesensing 09 01219 g006
Figure 7. Results obtained during the key point extraction and matching stage: (a) affine maximum self-dissimilarity (AMSD) with robust matching; and (b) maximal self-dissimilarity (MSD) and L2-norm matching approach.
Remotesensing 09 01219 g007
Figure 8. Results obtained during the analysis of the distribution of the key points extracted along the camera’s sensor: (a) AMSD, robust matching, and camera´s sensor spatial filtering; and (b) AMSD and robust matching without camera sensor´s spatial filtering.
Remotesensing 09 01219 g008
Figure 9. Comparison between 3D photogrammetric models: (a) isometric view of the damaged model, and (b) plan view of the section considered for the energetic analysis. The points belonging to the undamaged model are in black.
Remotesensing 09 01219 g009
Figure 10. Interface of the CRASHMAP_desktop during the energetic evaluation.
Remotesensing 09 01219 g010
Table 1. Technical characteristics of the vehicle involved in the traffic accident.
VehicleWheelbaseLengthWidthTrackWeight
Citroen Berlingo Combi2.728 m4.380 m1.810 m1.505 m1482 kg
Table 2. Technical specifications of the photographic sensor and lens system used for the photogrammetric reconstruction.
Canon EOS 700D
Sensor typeCMOS (Complementary Metal-Oxide-Semiconductor)
Sensor size22.3 × 14.9 mm
Pixel size4.29 μm
Image size5184 × 3456 pixels
Resolution18 Mp
Focal length18 mm
Table 3. Internal parameters obtained during the photogrammetric reconstruction of the damaged and undamaged model.
Parameter Values (Damaged Model)Values (Undamaged Model)
Focal length (mm) 18.5718.45
Format size (mm)Height (mm)
Width (mm)
22.30
14.90
22.30
14.90
Principal point (mm)X value10.9011.24
Y value7.377.53
Radial lens distortionK1 value (mm−2)0.050.05
K2 value (mm−4)−1.01 × 10⁻²−0.91 × 10⁻²
Decentring lens distortionP1 value (mm−1)−1.40 × 10⁻⁴−2.25 × 10⁻⁴
P2 value (mm−1)−2.06 × 10⁻⁴−9.78 × 10⁻⁴
Table 4. Results derived from the six measurements taken with a measuring tape following the traditional protocol.
D1D2D3D4D5D6DmedDmaxDcent
0.250 m0.207 m0.217 m0.305 m0.552 m0.193 m0.287 m 0.625 m0.231 m
Table 5. Values of deformation obtained from the comparison between photogrammetric point clouds. An interval of 5 cm between measurements was used.
MeasurementValue (m)MeasurementValue (m)
D10D160.226
D20.052D170.291
D30.092D180.352
D40.182D190.618
D50.179D200.581
D60.193D210.547
D70.224D220.518
D80.247D230.225
D90.188D240.235
D100.199D250.159
D110.126D260.200
D120.141D270.184
D130.134D280.227
D140.230D290.185
D150.150D300.113
Table 6. Results obtained from energetic analysis.
DmaxDmedDcentEaEBSVcol
Traditional method0.625 m0.287 m0.231 m84,619.46 J39.45 km/h36.50 km/h
Proposed method0.619 m0.233 m0.176 m62,791.79 J33.16 km/h30.31 km/h

