Characterizing the Seasonal Crustal Motion in Tianshan Area Using GPS, GRACE and Surface Loading Models


1
Key Laboratory of Earthquake Geodesy, Institute of Seismology, China Earthquake Administration, Wuhan 430071, China
2
Key Laboratory of Earthquake Prediction, Institute of Earthquake Forecasting, China Earthquake Administration, Beijing 100036, China
3
Earth System Science Programme, Faculty of Science, The Chinese University of Hong Kong, Hong Kong, China
4
College of Surveying and Geo-Informatics Engineering, Tongji University, Shanghai 200092, China
*
Author to whom correspondence should be addressed.
Remote Sens. 2017, 9(12), 1303; https://doi.org/10.3390/rs9121303
Submission received: 23 October 2017
/
Revised: 7 December 2017
/
Accepted: 11 December 2017
/
Published: 12 December 2017
(This article belongs to the Special Issue Multi-Constellation Global Navigation Satellite Systems: Methods and Applications)
Abstract
:Complex tectonic and non-tectonic movements exist in the Tianshan area. However, we have not acquired good knowledge of such movements yet. In this study, we combine Global Positioning System (GPS), the Gravity Recovery and Climate Experiment (GRACE) and Surface Loading Models (SLMs) data to study the seasonal vertical crustal displacements in the Tianshan area. The results show that all three datasets exhibit significant annual variations at all 26 local GPS stations. Correlation coefficients higher than 0.8 between the GRACE and GPS data were observed at 85% of the stations, and it became 92% when comparing GPS and SLMs. The Weighted Root Mean Squares (WRMS) reductions were 41% and 47% after removing the annual displacements of GRACE and SLMs from the GPS time series, respectively. The consistency between the GPS and SLMs data was higher than that between the GPS and GRACE data, which is mainly due to the dominant position of atmospheric loading in the study area. For the abnormal station XJYN (43°N, 81°E), the GPS time series showed an abnormal uplift from early 2013 to early 2015, but this not shown in the GRACE and SLMs results. We attribute this discrepancy to groundwater variations, which are not resolvable by GRACE and SLMs for small-scale regions.
1. Introduction
Under the enormous northward extrusion dynamics of the Indian Plate, the crust in the Tianshan region has been subject to intense compression and uplift, resulting in the formation of a large-scale intraplate regenerated orogenic belt [1,2]. Since 1999, more than 20 continuous Global Positioning System (GPS) observatories have been established in this region by the Crustal Movement Observation Network of China (CMONOC) of the China Earthquake Administration. A large number of observations has been obtained to provide important information for accurate determination of the three-dimensional velocity field of the crust in Tianshan area, as well as for studying regional crustal movements and tectonic activities [3,4,5,6].
In addition to tectonic deformation, the vertical deformations of the surface observed by GPS also include significant non-tectonic seasonal variations, for which it is difficult to distinguish the sources of these signals. However, the seasonal vertical deformation, caused by environmental mass redistribution, can be observed through some other geodetic techniques, such as the Gravity Recovery and Climate Experiment (GRACE) and surface loading models (SLMs) [7,8,9,10,11]. The crustal vertical deformation obtained by GRACE can be used to exclude the non-tectonic impact caused by land water storage in the GPS results. SLMs can not only remove the corresponding seasonal effect of surface loadings in the GPS results, but also provide smaller scale change information that cannot be resolved by GRACE [12,13,14]. The combination of GRACE and SLMs is used to remove the effect of non-tectonic seasonal signals in the GPS data, which is helpful for obtaining accurate tectonic deformation field information and other geophysical phenomena we are interested in within the target area [15,16,17,18,19].
Moreover, there are many ice sheets in the Tianshan Mountains, and the rapid warming since 1985 has resulted in sharp glacial degeneration in this area [19,20]. Changes in the snow and ice resources in the mountains will have significant impacts on the redistribution of the terrestrial water storage and the socio-economic development of the region. Therefore, there is an exigency to study the seasonal variations in regional crustal deformation of Tianshan Mountains.
The primary purpose of this study is to analyze the consistency between the seasonal vertical crustal displacements derived from GPS, GRACE and SLMs in the Tianshan area and to obtain more information on the crustal tectonic deformation field of this area. Furthermore, Singular Spectrum Analysis (SSA) was used to analyze abnormal stations to obtain important information for studying regional environmental loading changes.
2. Data Processing and Methods
2.1. GPS Data
The GPS measurements used in this paper are provided by CMONOC and were collected from 26 continuous GPS stations in the Tianshan area. The data availability and locations of the GPS stations are shown in Figure 1. All 26 continuous GPS stations contains more than five years of observations.
The GPS observations were processed using the Bernese Software Version 5.2 [21], with general models recommended by the International Earth Rotation Service (IERS) [22]. In addition, Finite Element Solutions 2004 (FES2004) ocean tidal loading corrections, diurnal (S1) and semi-diurnal (S2) atmosphere tidal loading corrections and absolute phase-center corrections for satellites and receivers, as issued by International GNSS Service (IGS) [23], were used to correct corresponding errors. The tropospheric delay was modeled using the Global Mapping Function (GMF) [24]; first-order ionospheric delays were eliminated by means of the ionosphere-free linear combination, and higher-order terms were also modeled [25]. The final coordinates were aligned with the the International Terrestrial Reference Frame 2008 (ITRF2008) with minimum constraint [26].
According to the above GPS data processing strategy, atmospheric loading, non-tidal ocean loading and terrestrial water storage loading remain present in the GPS vertical coordinate time series [27].
2.2. GRACE Data
GRACE Level-2 monthly data were obtained from the GSM Release-05 products provided by the Center for Space Research (CSR), University of Texas, for the same period as the GPS stations and up to harmonic degree 60. This product has already removed the mass contributions from the ocean and atmosphere. We replaced the C20 spherical harmonic coefficients with the results observed by satellite laser ranging [28]. The remaining signals represent the terrestrial water storage change and GRACE errors [29,30]. The GRACE gravity field has no geocenter motion contribution because GRACE is not sensitive to degree-one signals, whereas GPS data contain degree-one terms; therefore, we replaced the degree-one components in GRACE with the results obtained by Swenson et al. (2008) [31].
First, the average mean gravity field model between 2002 and 2016 was removed from the data product. Then, we applied Gaussian smoothing with a radius of 250 km to suppress errors at high degrees. The Empirical Orthogonal Function (EOF) analysis proposed by Wouters and Schrama (2007) [32] was directly applied to the spherical harmonic coefficients of the gravity fields.
To make the GRACE data comparable to GPS data, we added the GRACE Atmosphere and Ocean De-aliasing Level-1B (AOD1B) product to the GRACE spherical harmonic solutions.
The vertical surface displacement due to changes in mass loading can be expressed in terms of the spherical harmonics coefficients of the gravity field and the load Love numbers as follows [7,33]:
where is the Earth surface displacements in the radial directions, is the average radius of the Earth, represents the fully-normalized Legendre functions of degree and order , and are the spherical harmonic coefficients anomalies with respect to the mean gravity field for the period ranging from 2002–2016 and and are the load Love numbers at degree . Here, we adopt the load Love numbers from Farrell (1972) [34].
2.3. SLMs Data
The surface load models used for comparison with GPS and GRACE data include atmospheric, non-tidal ocean and terrestrial water storage loading. A summary of the models used to quantify the surface mass variations is provided in Table 1. The atmosphere and terrestrial water storage loading are from National Centers for Environmental Prediction-Department of Energy (NCEP-DOE) Reanalysis 2 products, which are an improved version of the NCEP Reanalysis 1 model that fixed errors and updated the parameterizations of physical processes. For the non-tidal ocean loading, we used Version kf080 [35] of the Estimating the Circulation and Climate of the Ocean (ECCO) ocean bottom pressure products. We can see that the spatial resolution of SLMs is slightly better than that of GRACE.
Note that the groundwater is not included in the terrestrial water storage loading used in this study. Only the Soil Moisture (SM), Snow Water Equivalent (SWE) and canopy water content were used as input to calculate the land water storage loading time series, and there were two layers of SM (0–10 cm and 10–200 cm) in NCEP-DOE Reanalysis 2.
The displacement of a point on the Earth’s surface driven by SLMs can be determined by using Farrell’s functions [34] and the approach outlined in van Dam and Wahr (1987) [36]. Here, Green’s function derived in the Center of Figure (CF) frame was chosen to maintain consistency between the SLM loadings and GPS heights [37,38]. All the loading displacement time series were resampled to match the daily GPS result.
3. Results
With the above data processing strategy, GPS, GRACE and SLMs vertical deformation time series for each of the 26 CMONOC stations were obtained. The linear trends caused by tectonic process were removed from the time series [8,11,18].
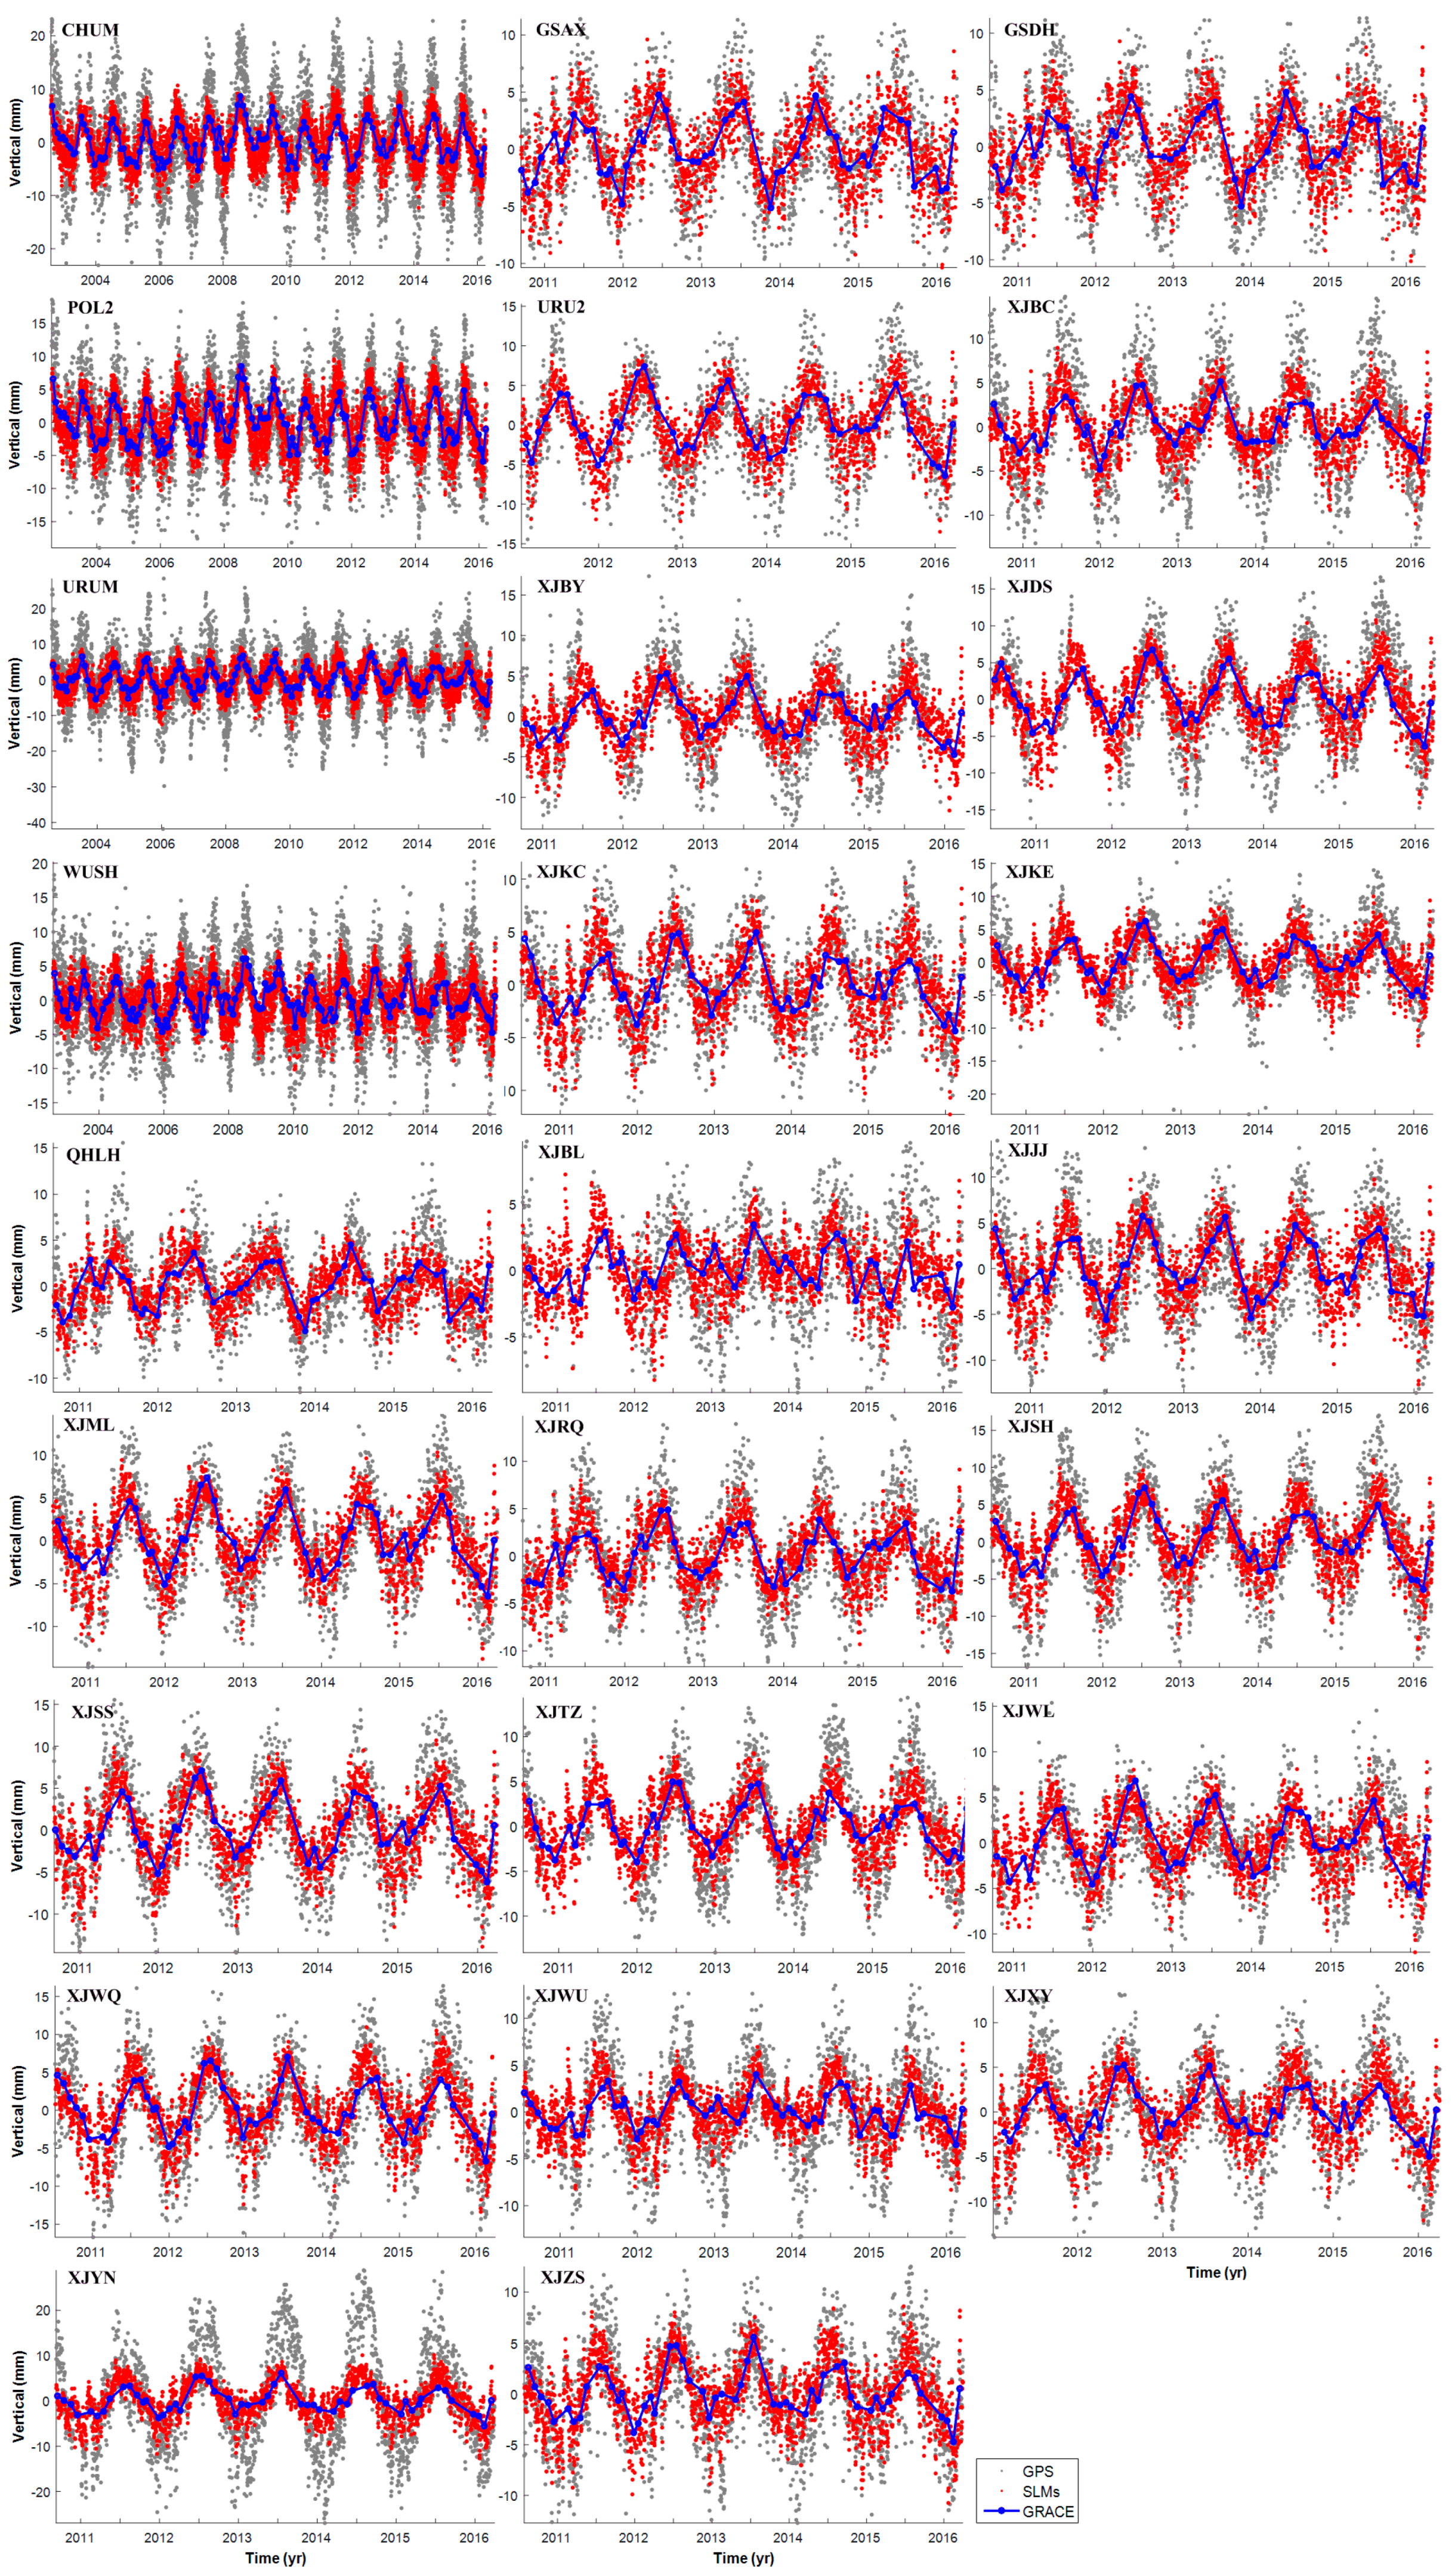
Figure 2 shows the detrended vertical displacement time series for the 26 stations in our study areas. It can be seen that the GPS, GRACE and SLMs vertical time series show clear significant seasonal signals.
To further analyze the correlation between the three time series, the mean, trend, annual and semiannual signals were simultaneously fitted using Equation (2) [39].
where is the daily solution epochs in decimal year, is a constant, is the uplift rate, coefficients and describe the annual periodic motion, and coefficients and describe semi-annual motion.
3.1. Seasonal Variations in GPS, GRACE and SLMs
The semi-annual signals of vertical displacements obtained from GPS, GRACE and SLM data are very small in the study area, only submillimeter; therefore, we merely compare annual signals herein. The best-fit annual amplitudes and phases from the GPS, GRACE and SLMs are listed in Table 2. The phase represents the time when annual vertical variations reach the peak value.
It can be seen from Table 2 that among the three components of SLMs in the Tianshan area, atmospheric loading shows a maximum vertical seasonal variation amplitude of 5.1 mm, an average variation of 3–5 mm and a mean of 4.1 mm. Compared with other areas in the Chinese mainland, the Tianshan area is a region with less annual precipitation, where the vertical seasonal variation of the land water storage is small, in the range of 1–2 mm with a mean of 1.1 mm. However, the effect of non-tidal ocean loading can almost be ignored given the far distance between this area and the ocean. This indicates that atmospheric loading is the dominant environmental loading in the study area. At the 26 GPS stations in the study area, the annual peak of atmospheric loading usually appears around June, while that of terrestrial water loading varies greatly, usually reaching a maximum during February–March and October–December, which may be related to a smaller terrestrial water reserve and the exclusion of groundwater variations.
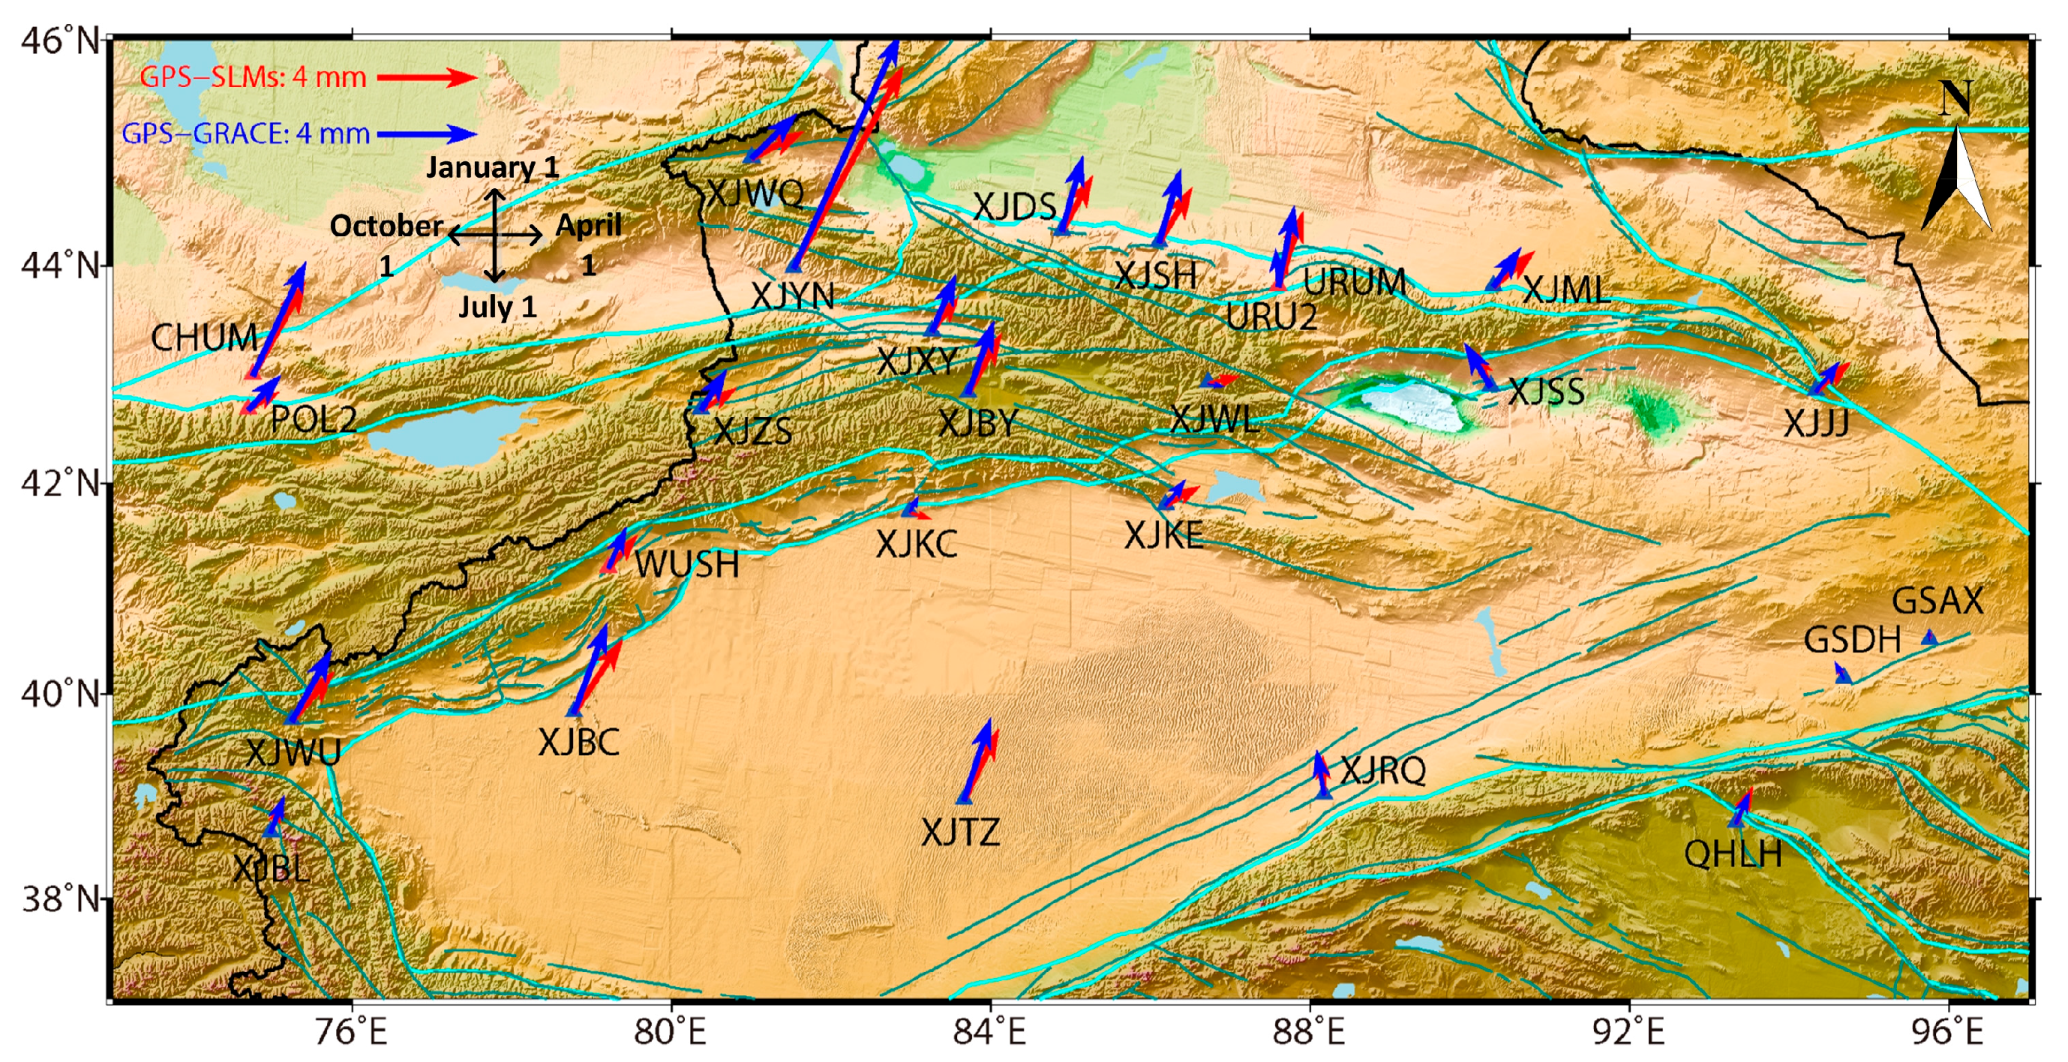
To provide a distinct view of the annual vertical displacements at the 26 stations obtained from GPS, GRACE and SLMs data, the amplitudes and phases of these signals are shown in Figure 3.
In general, the three geodetic datasets are highly consistent in terms of the amplitudes and phases of the vertical annual signals at most stations. GRACE and SLM data show better consistency, while the GPS results are different from both of them. The main reason for the difference is that GRACE and SLMs represent smooth results limited by spatial resolution, while GPS observations are more sensitive to local effects [17].
Here, we provide more statistical results. The mean amplitudes of annual signal variances are 5.68 mm, 3.30 mm and 3.75 mm, and the corresponding mean phases are 192.5 d, 188.3 d and 181.8 d for the GPS, GRACE and SLMs solutions, respectively. The results suggest that a slight systematic difference exists between the GPS and GRACE/SLMs results for both amplitude and phase. The GPS amplitudes are larger than the GRACE or SLMs amplitudes by an average factor of approximately 1.7, and the phases come later in the GPS observations compared with the GRACE or SLMs data for more than 80% of the stations. The discrepancies may be partly attributed to the GRACE data processing strategy [8,10,17,40], the shortcomings in groundwater variation simulations for the terrestrial water storage loading models [41,42,43], systematic errors in GPS solutions and local processes [8,44,45,46].
The difference vectors of the vertical annual signals between the GPS and GRACE/SLMs are given in Figure 4, which have a mean amplitude of 2.5 mm for GPS-GRACE and 2.2 mm for GPS-SLMs. It is important to note that for an abnormal station named XJYN, the differences in the annual amplitudes are 10.2 mm and 9.2 mm for GPS-GRACE and GPS-SLMs, respectively. The large discrepancy suggests that GPS appears to observe additional annual signals at this station, probably because the GPS observations are more sensitive to local effects, resulting in larger impacts.
3.2. GPS Residuals after Removing GRACE and SLMs
To quantitatively evaluate the consistency in seasonal variation among the three datasets, we calculated the relative correlation coefficients between each dataset. Although the correlation coefficient can effectively evaluate the similarity between two signals, it is only sensitive to the signal phase. Therefore, we removed the GRACE/SLMs-derived seasonal displacements from the GPS-observed height time series and computed the Weighted Root-Mean-Squares (WRMS) reductions using Equation (3) to give a more integrated explicit assessment [7,8,10,17]:
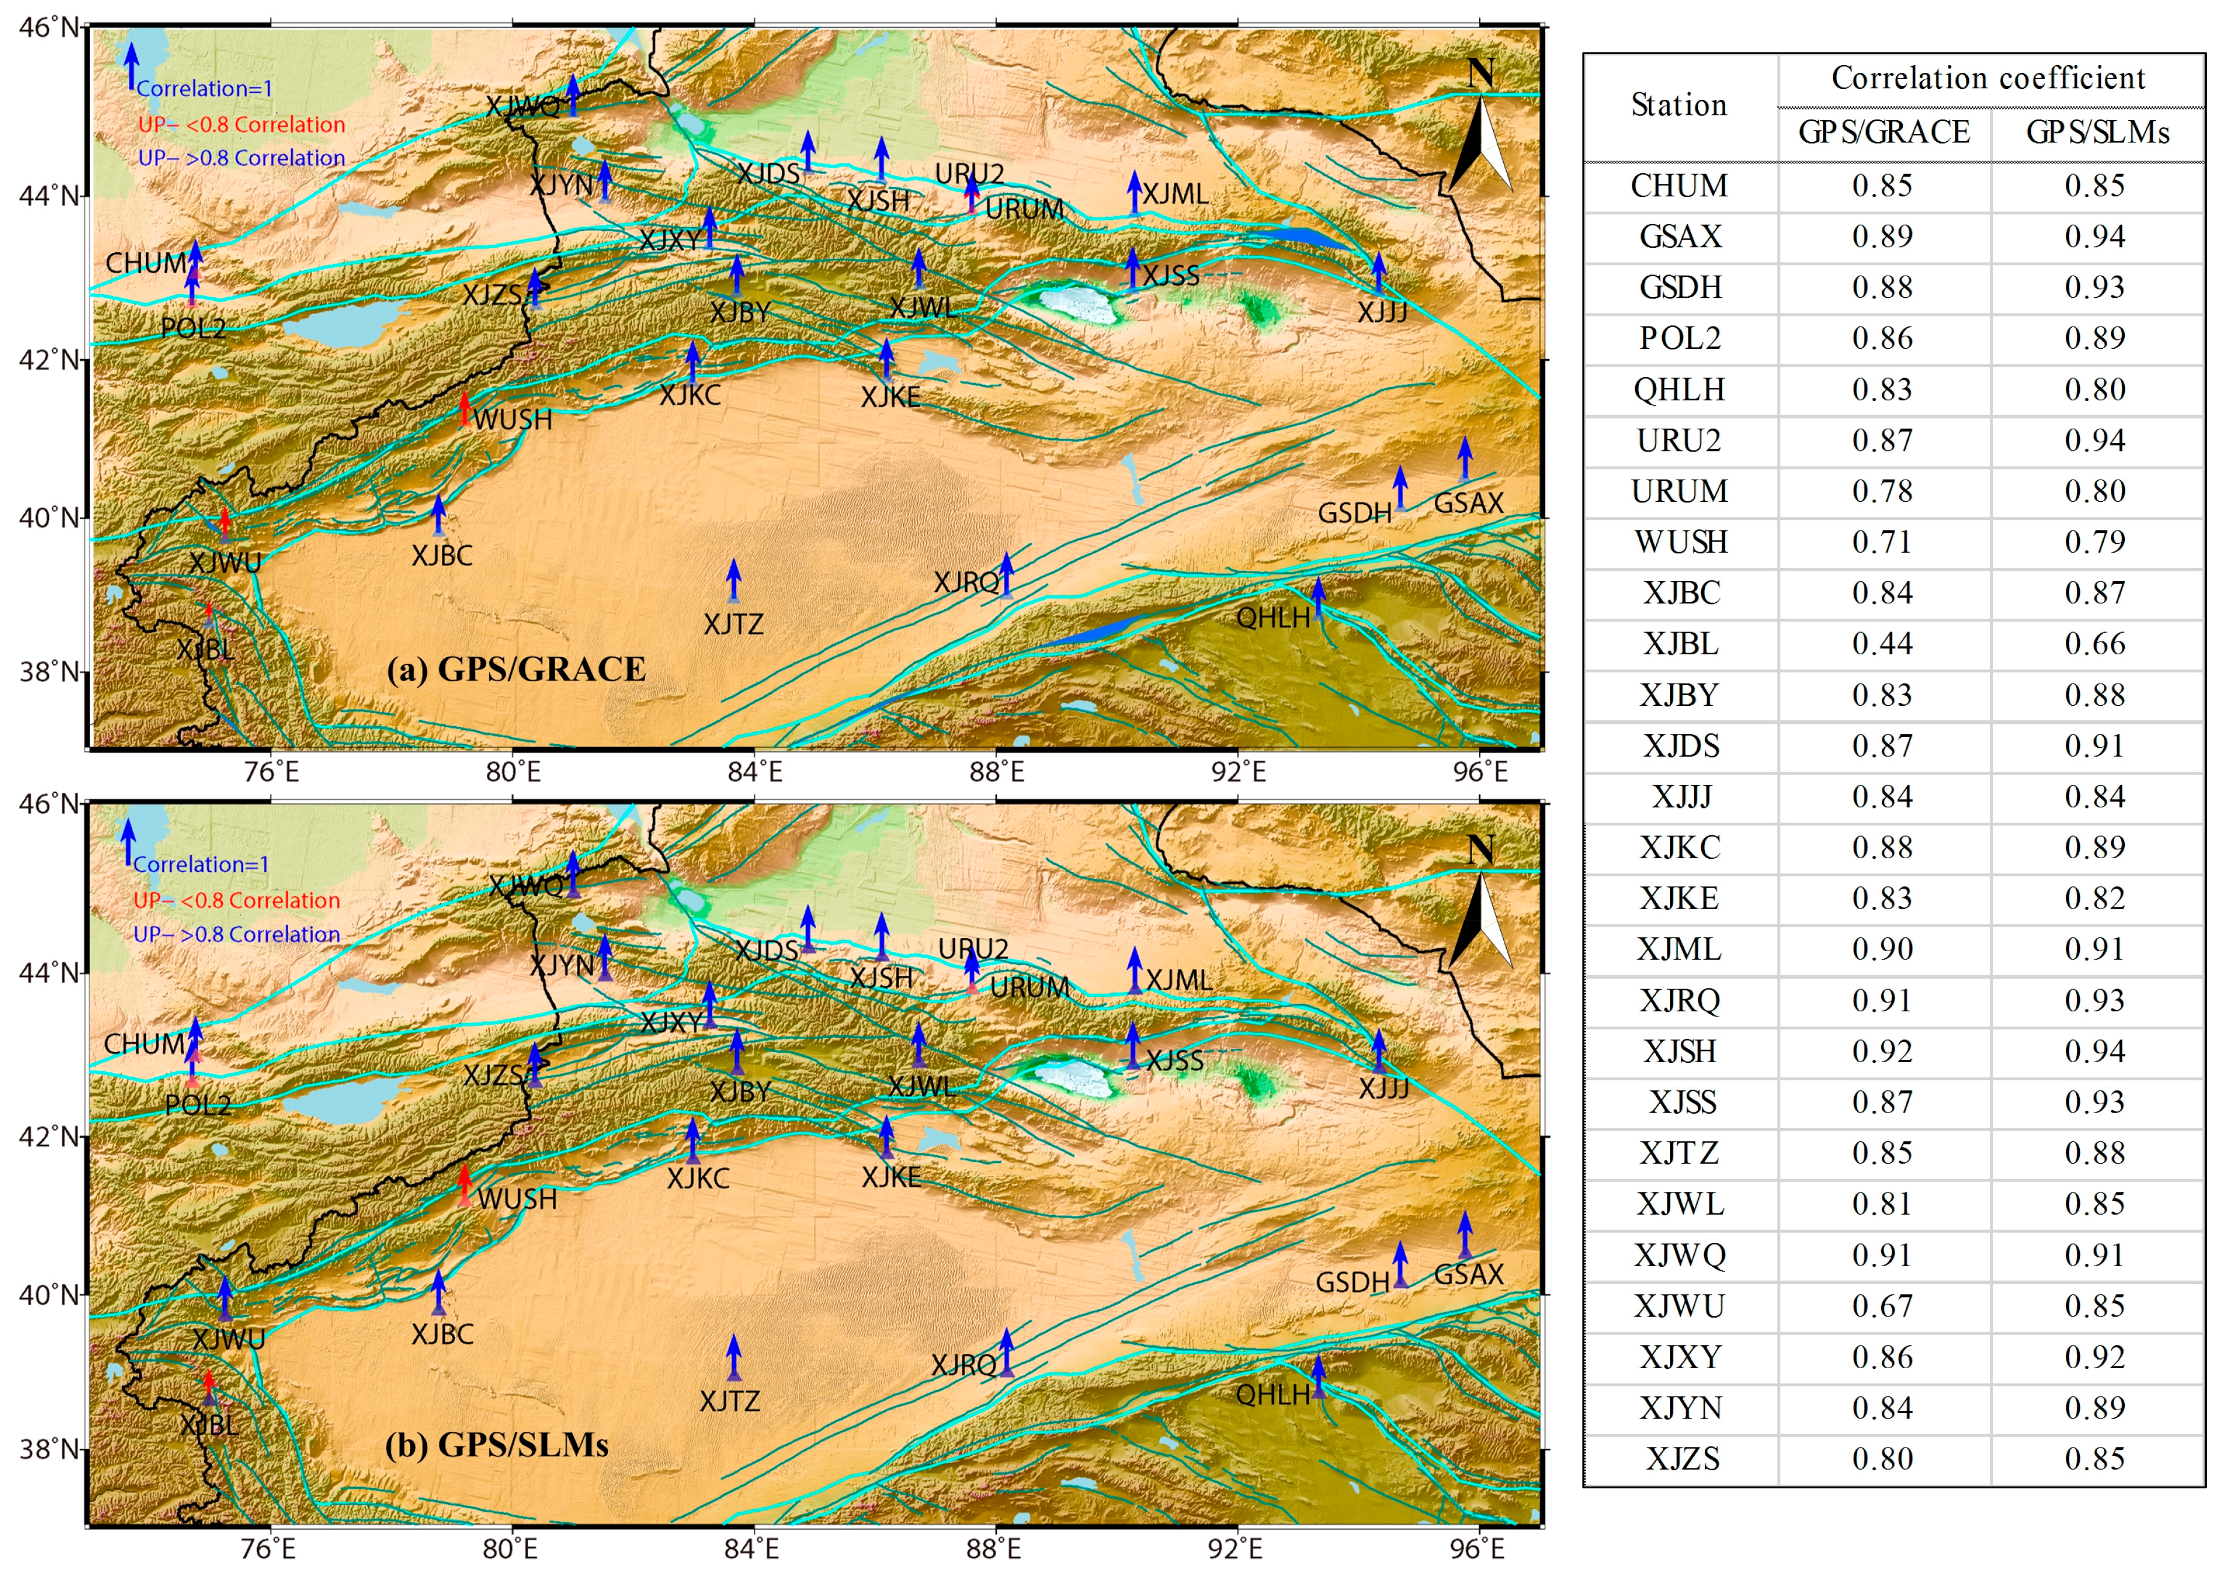
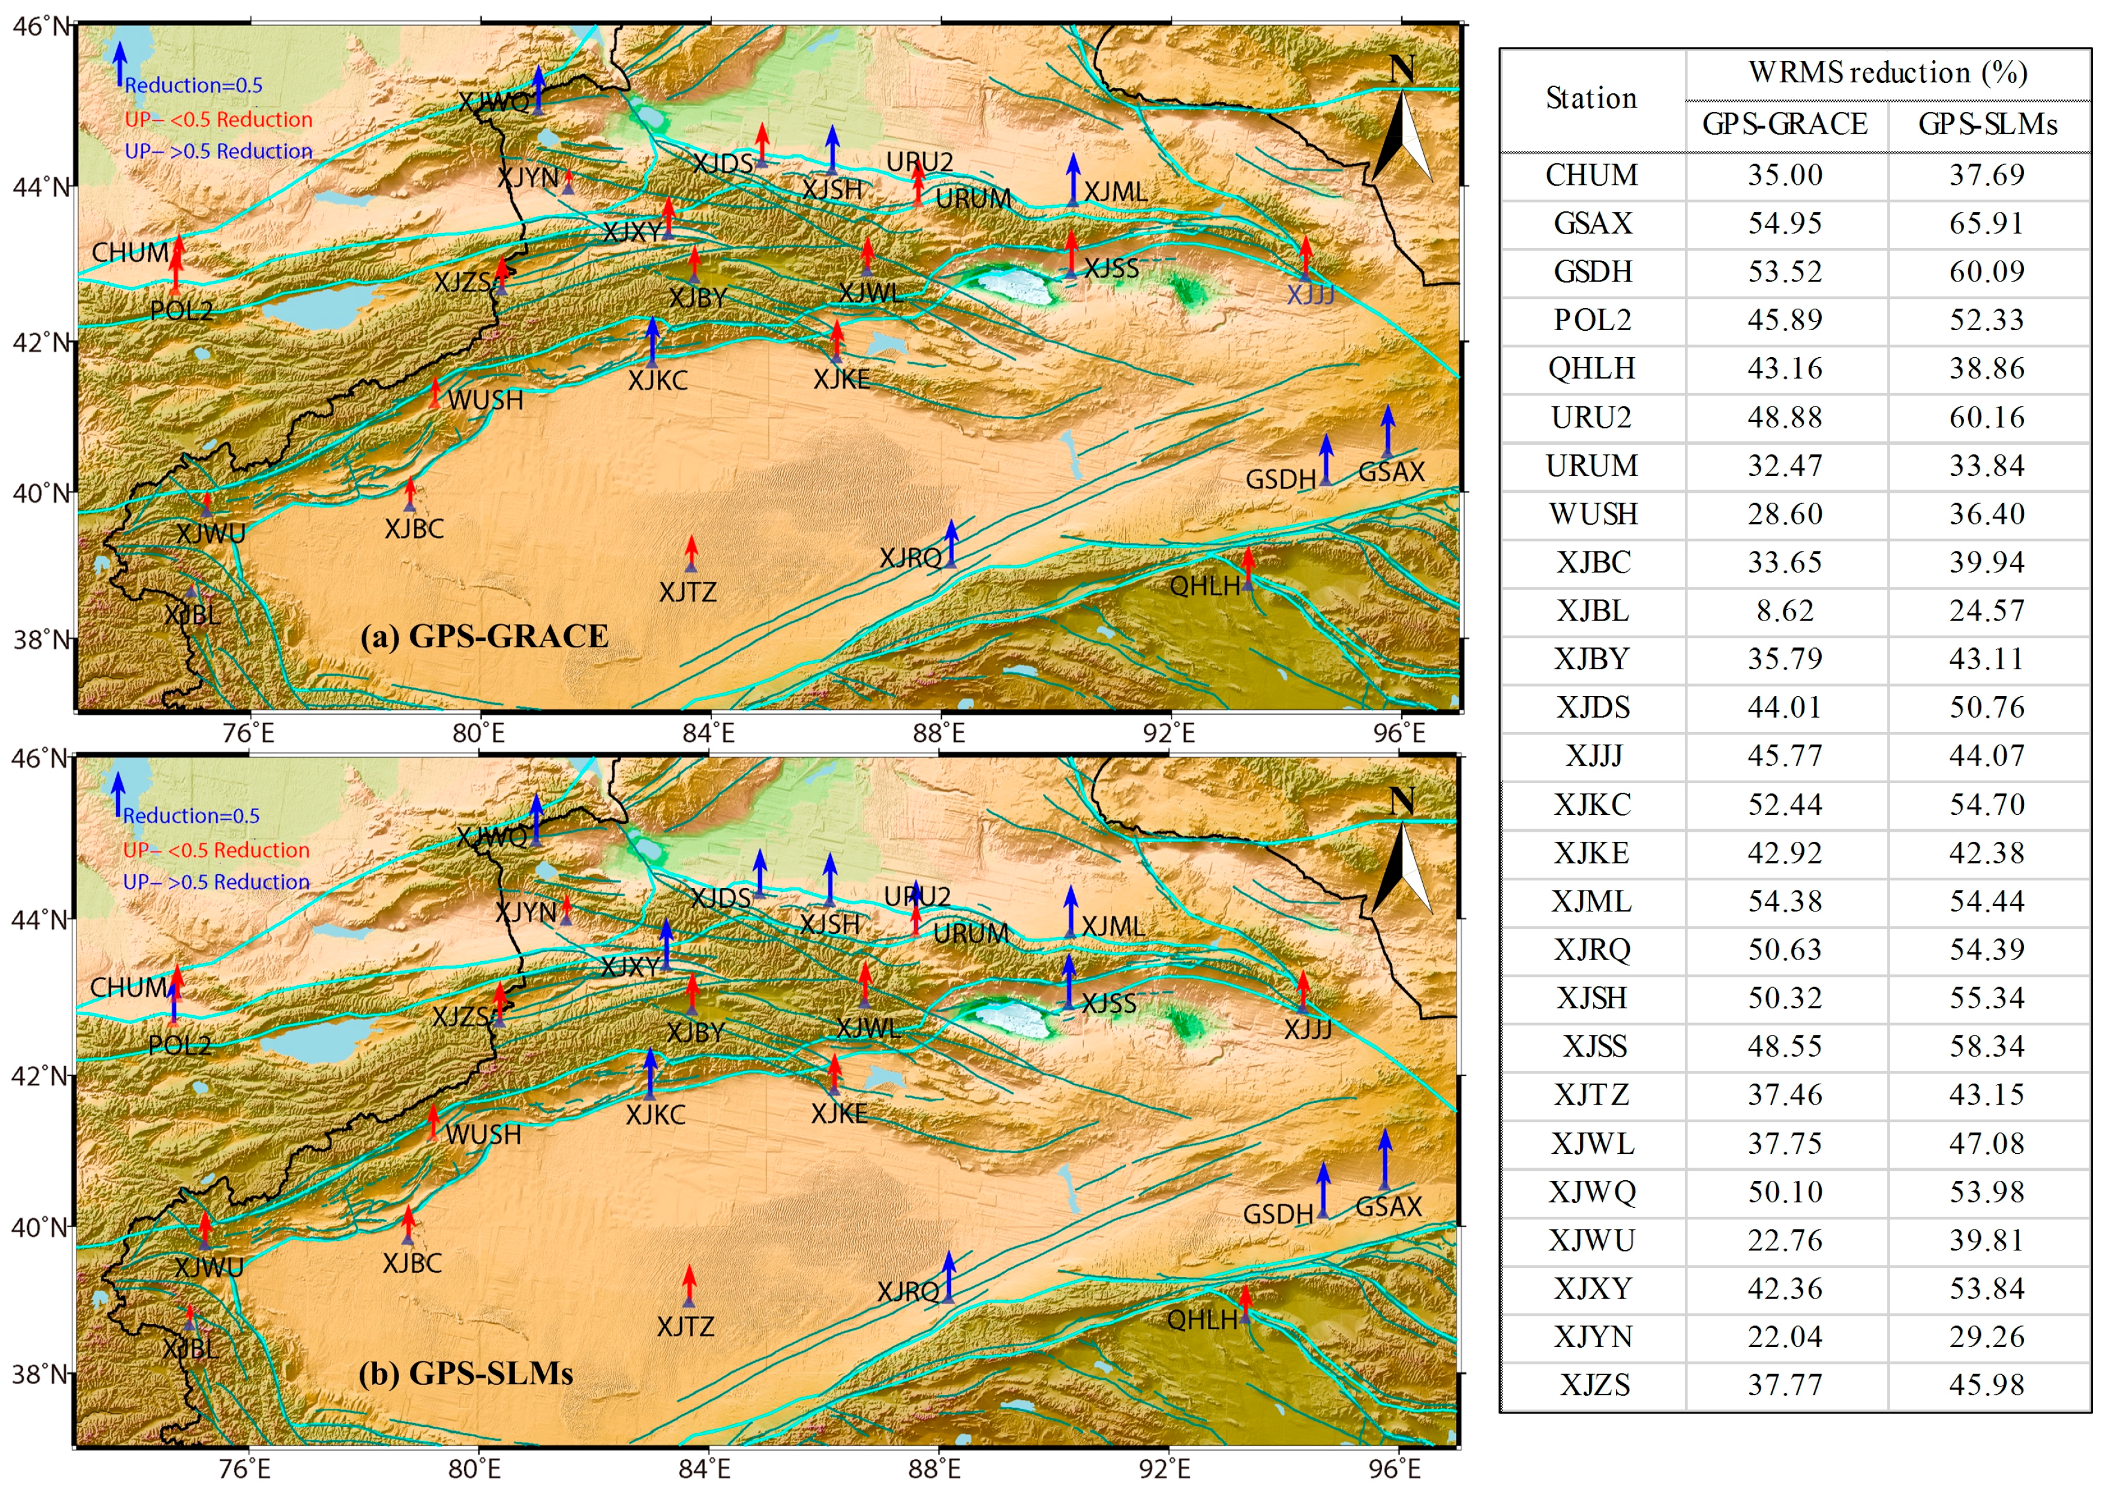
Most stations showed a high correlation in terms of annual variation between the GPS and GRACE/SLMs datasets in the Tianshan Mountains and its surrounding areas (Figure 5). Among these stations, 85% had a correlation greater than 0.8, and the mean correlation was 0.83 for GPS and GRACE. For GPS and SLMs, 92% had a correlation greater than 0.8, and the mean correlation coefficient was 0.87, indicating that the seasonal variations might originate in the same geophysical process in this area. Figure 6 shows the percentage reduction in GPS signal WRMS. All stations showed significant and consistent WRMS reductions: 58% of the stations had a WRMS reduction of more than 40%, and the mean reduction for all 26 stations was 40.76% for GPS-GRACE. For GPS-SLMs, 73% of the stations had a WRMS reduction of more than 40%, and the mean reduction was 46.94%.
It can be seen from the above results that the consistency between the GPS and SLMs vertical annual variations is higher than that between GPS and GRACE vertical annual variations. Compared with SLMs, GRACE provides a more accurate view of variations in the terrestrial water storage. However, atmospheric loading is the dominant environmental loading in the study area, rather than the land water storage loading. Furthermore, the spatial resolution of SLMs is slightly better than that of GRACE. Therefore, the consistency in the regional vertical annual signals between the GPS and SLM data is superior to that between the GPS and GRACE data.
For GRACE and SLMs, the consistency in vertical seasonal deformation was higher, and the statistical result of the correlation coefficients between them is only given herein. For GRACE and SLMs, 88% of the stations had a correlation coefficient greater than 0.9, and the mean correlation coefficient was 0.93. As SLMs data exclude groundwater variations, this result also indicates a small change in groundwater in the study area or that groundwater variations are unresolved under the spatial resolutions of GRACE and SLMs.
4. Analysis and Discussion of Abnormal Station
The vertical deformation at most stations in the study area showed high consistency and correlation between the GPS, GRACE and SLMs datasets. However, there were some abnormal stations. For example, at station XJYN, the vertical deformation time series obtained by GPS was quite different from those derived by GRACE and SLMs (Figure 2). Due to different spatial resolutions, GRACE and SLMs (whose resolutions only reach about 300 km and 200 km, respectively) are both insensitive to local signal changes, while the GPS seasonal signals represent the loading response at a single point, which can be significantly influenced by local environmental variations. Therefore, it is speculated that there are some local signals unresolved by GRACE and SLMs in this region, leading to differences in the GPS vertical displacement at this station.
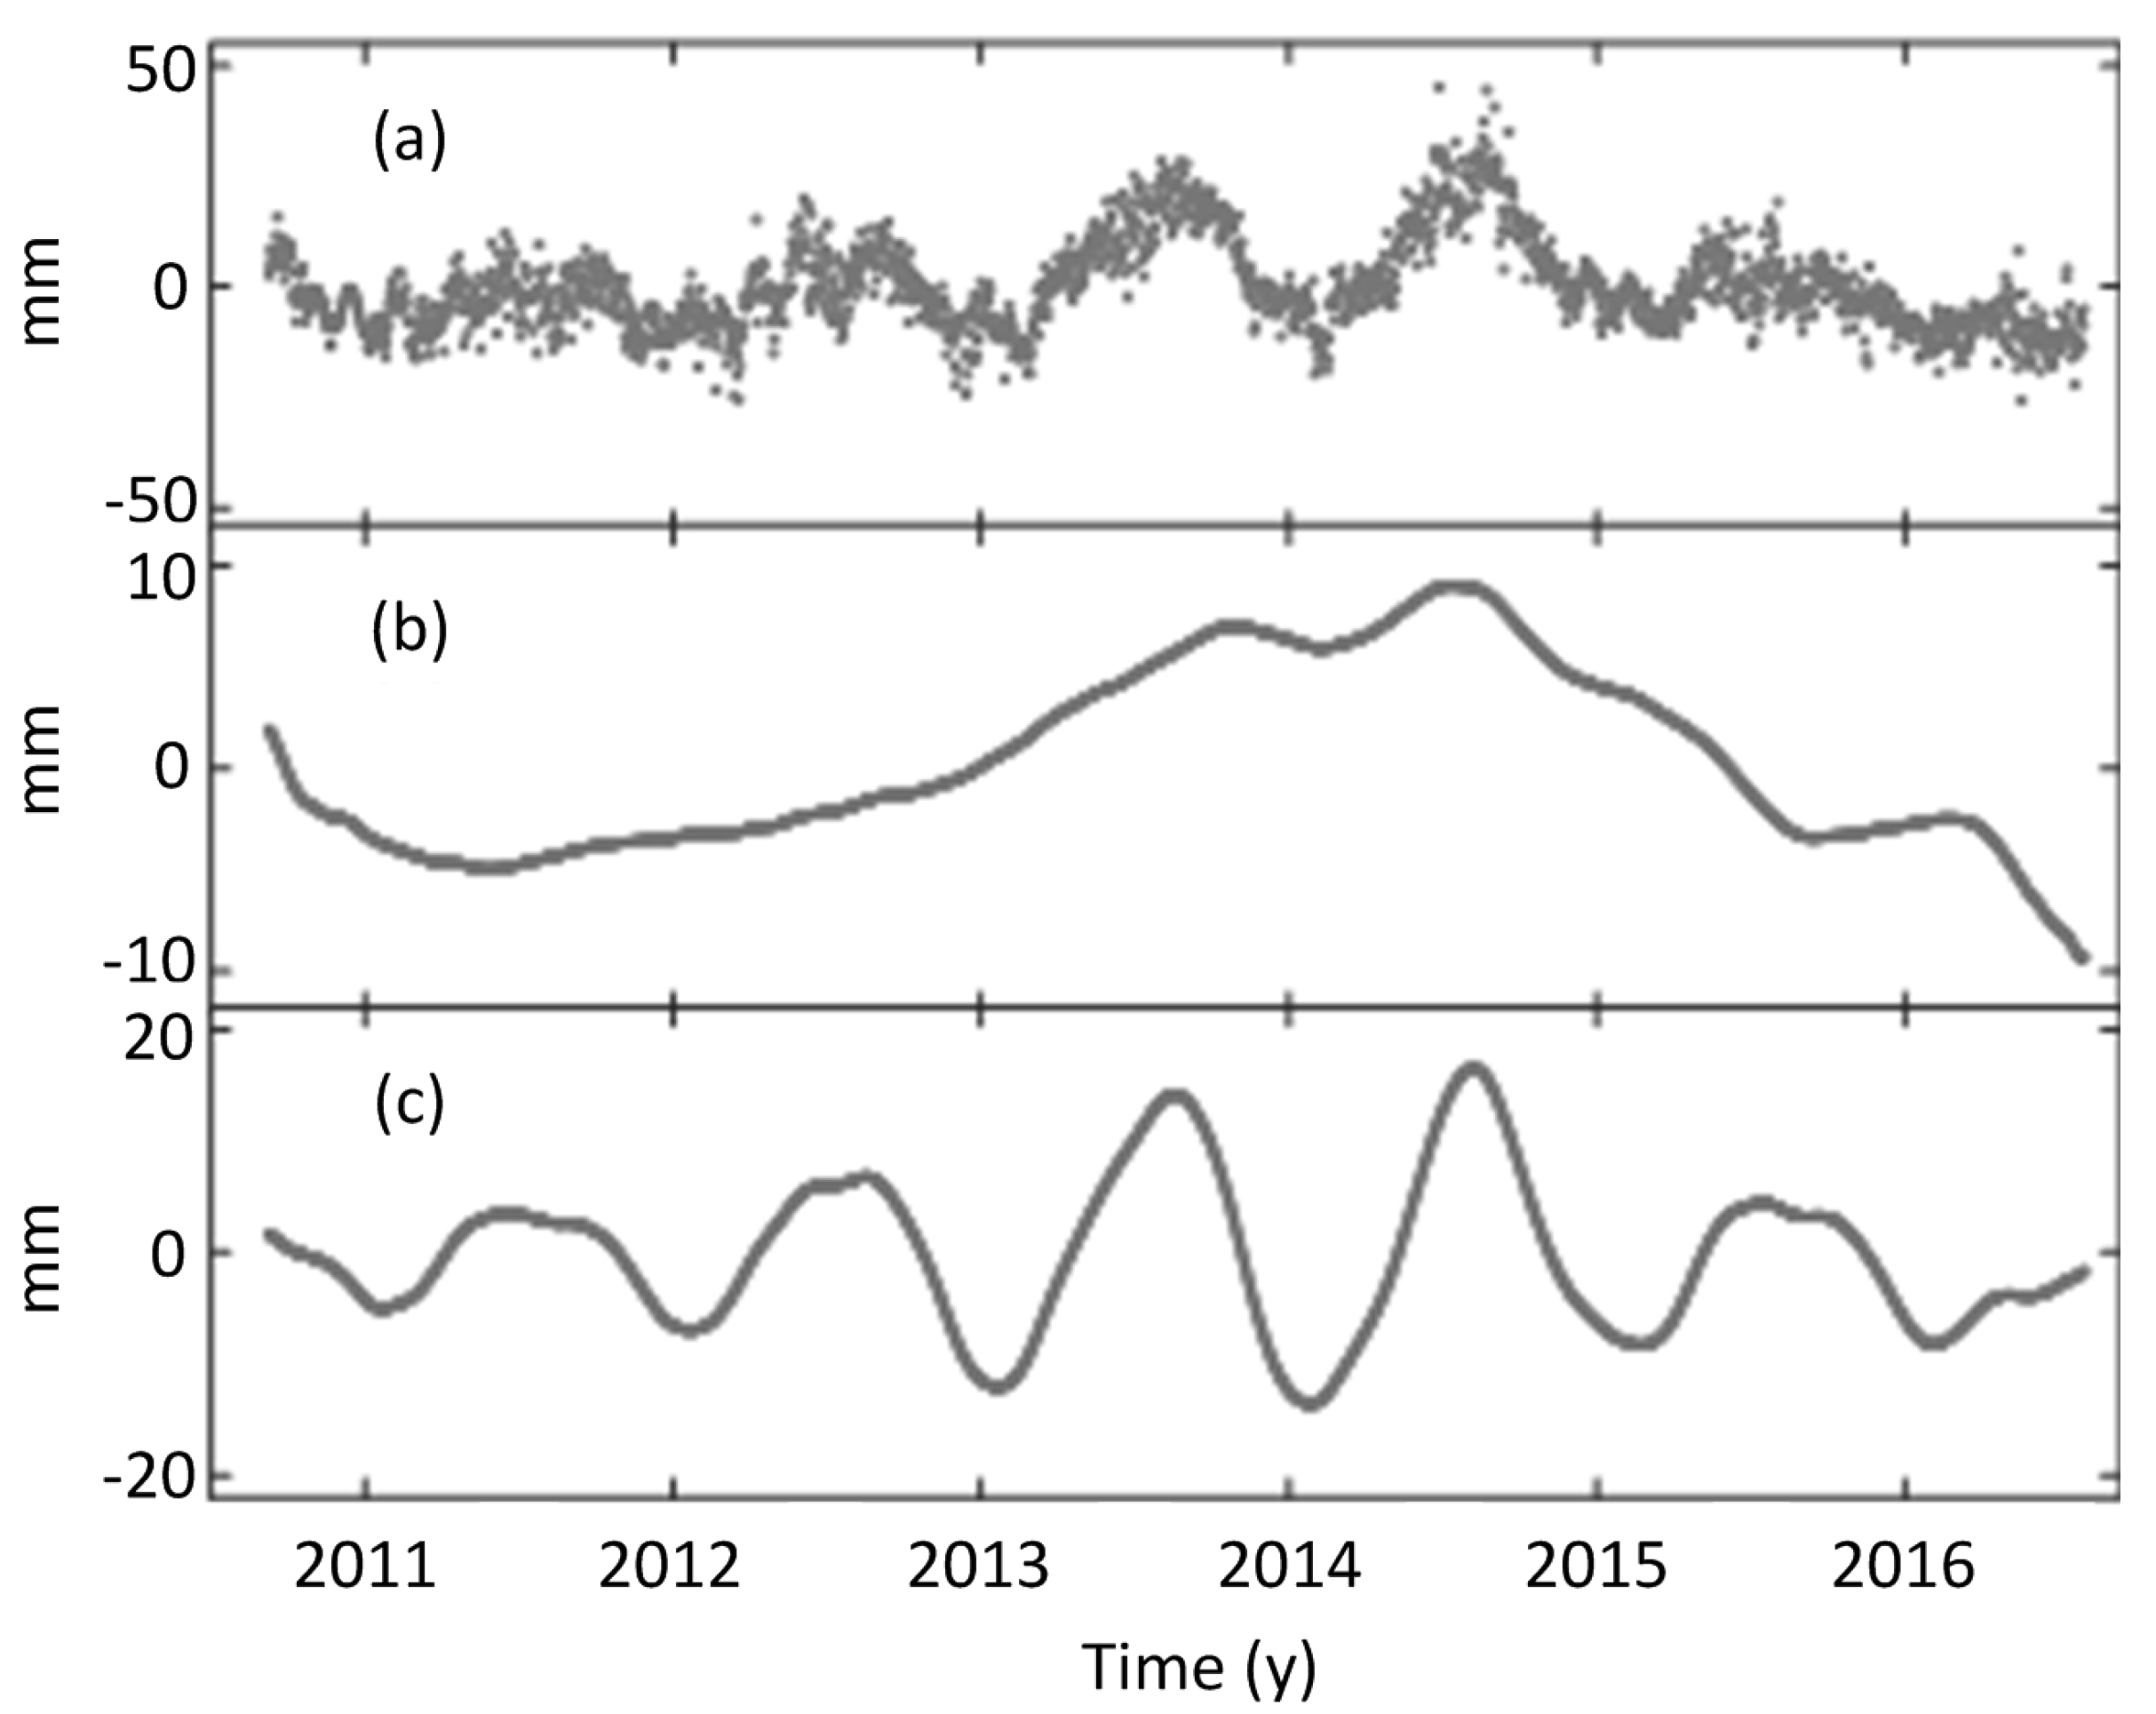
To simplify the problem, we applied singular spectral analysis (SSA) [47] to the detrending of GPS time series (Figure 7a) and separating the abnormal signal (Figure 7b) and seasonal signal (Figure 7c). To exclude impacts from other geophysical signals, the vertical deformations induced by the atmosphere and non-tidal ocean model, as well as the terrestrial water storage were removed from the GPS vertical time series.
Figure 7b clearly shows that the abnormal variations have an uplift as large as ~10 mm, which is unusual in detrended GPS time series. In 2013 and 2014, the amplitude of the seasonal signal also became significantly larger than in the other years. This variation is synchronized with the abnormal signal, indicating that a geophysical event occurred during 2013 and 2014 and that this event had a seasonal feature. Therefore, tectonic movements can be ruled out. As the atmospheric loading and land water storage loading have been removed beforehand, the residuals are unlikely to cause such large signals. The nearest lake (Lake Sailimu) to station XJYN is ~70 km away and has an area of only ~470 km2. It would need an ~100-m change in water level to cause the 10-mm uplift seen at XJYN station according to disk load calculation [48]. This possibility can also be excluded as the mean water depth of Lake Sailimu is only 46 m. The remaining possibility is groundwater variation. Station XJYN is located in the lowest part of the Ili Valley, and there are abundant water resources there; therefore, we consider that the event that occurred in 2013 and 2014 is related to groundwater variation.
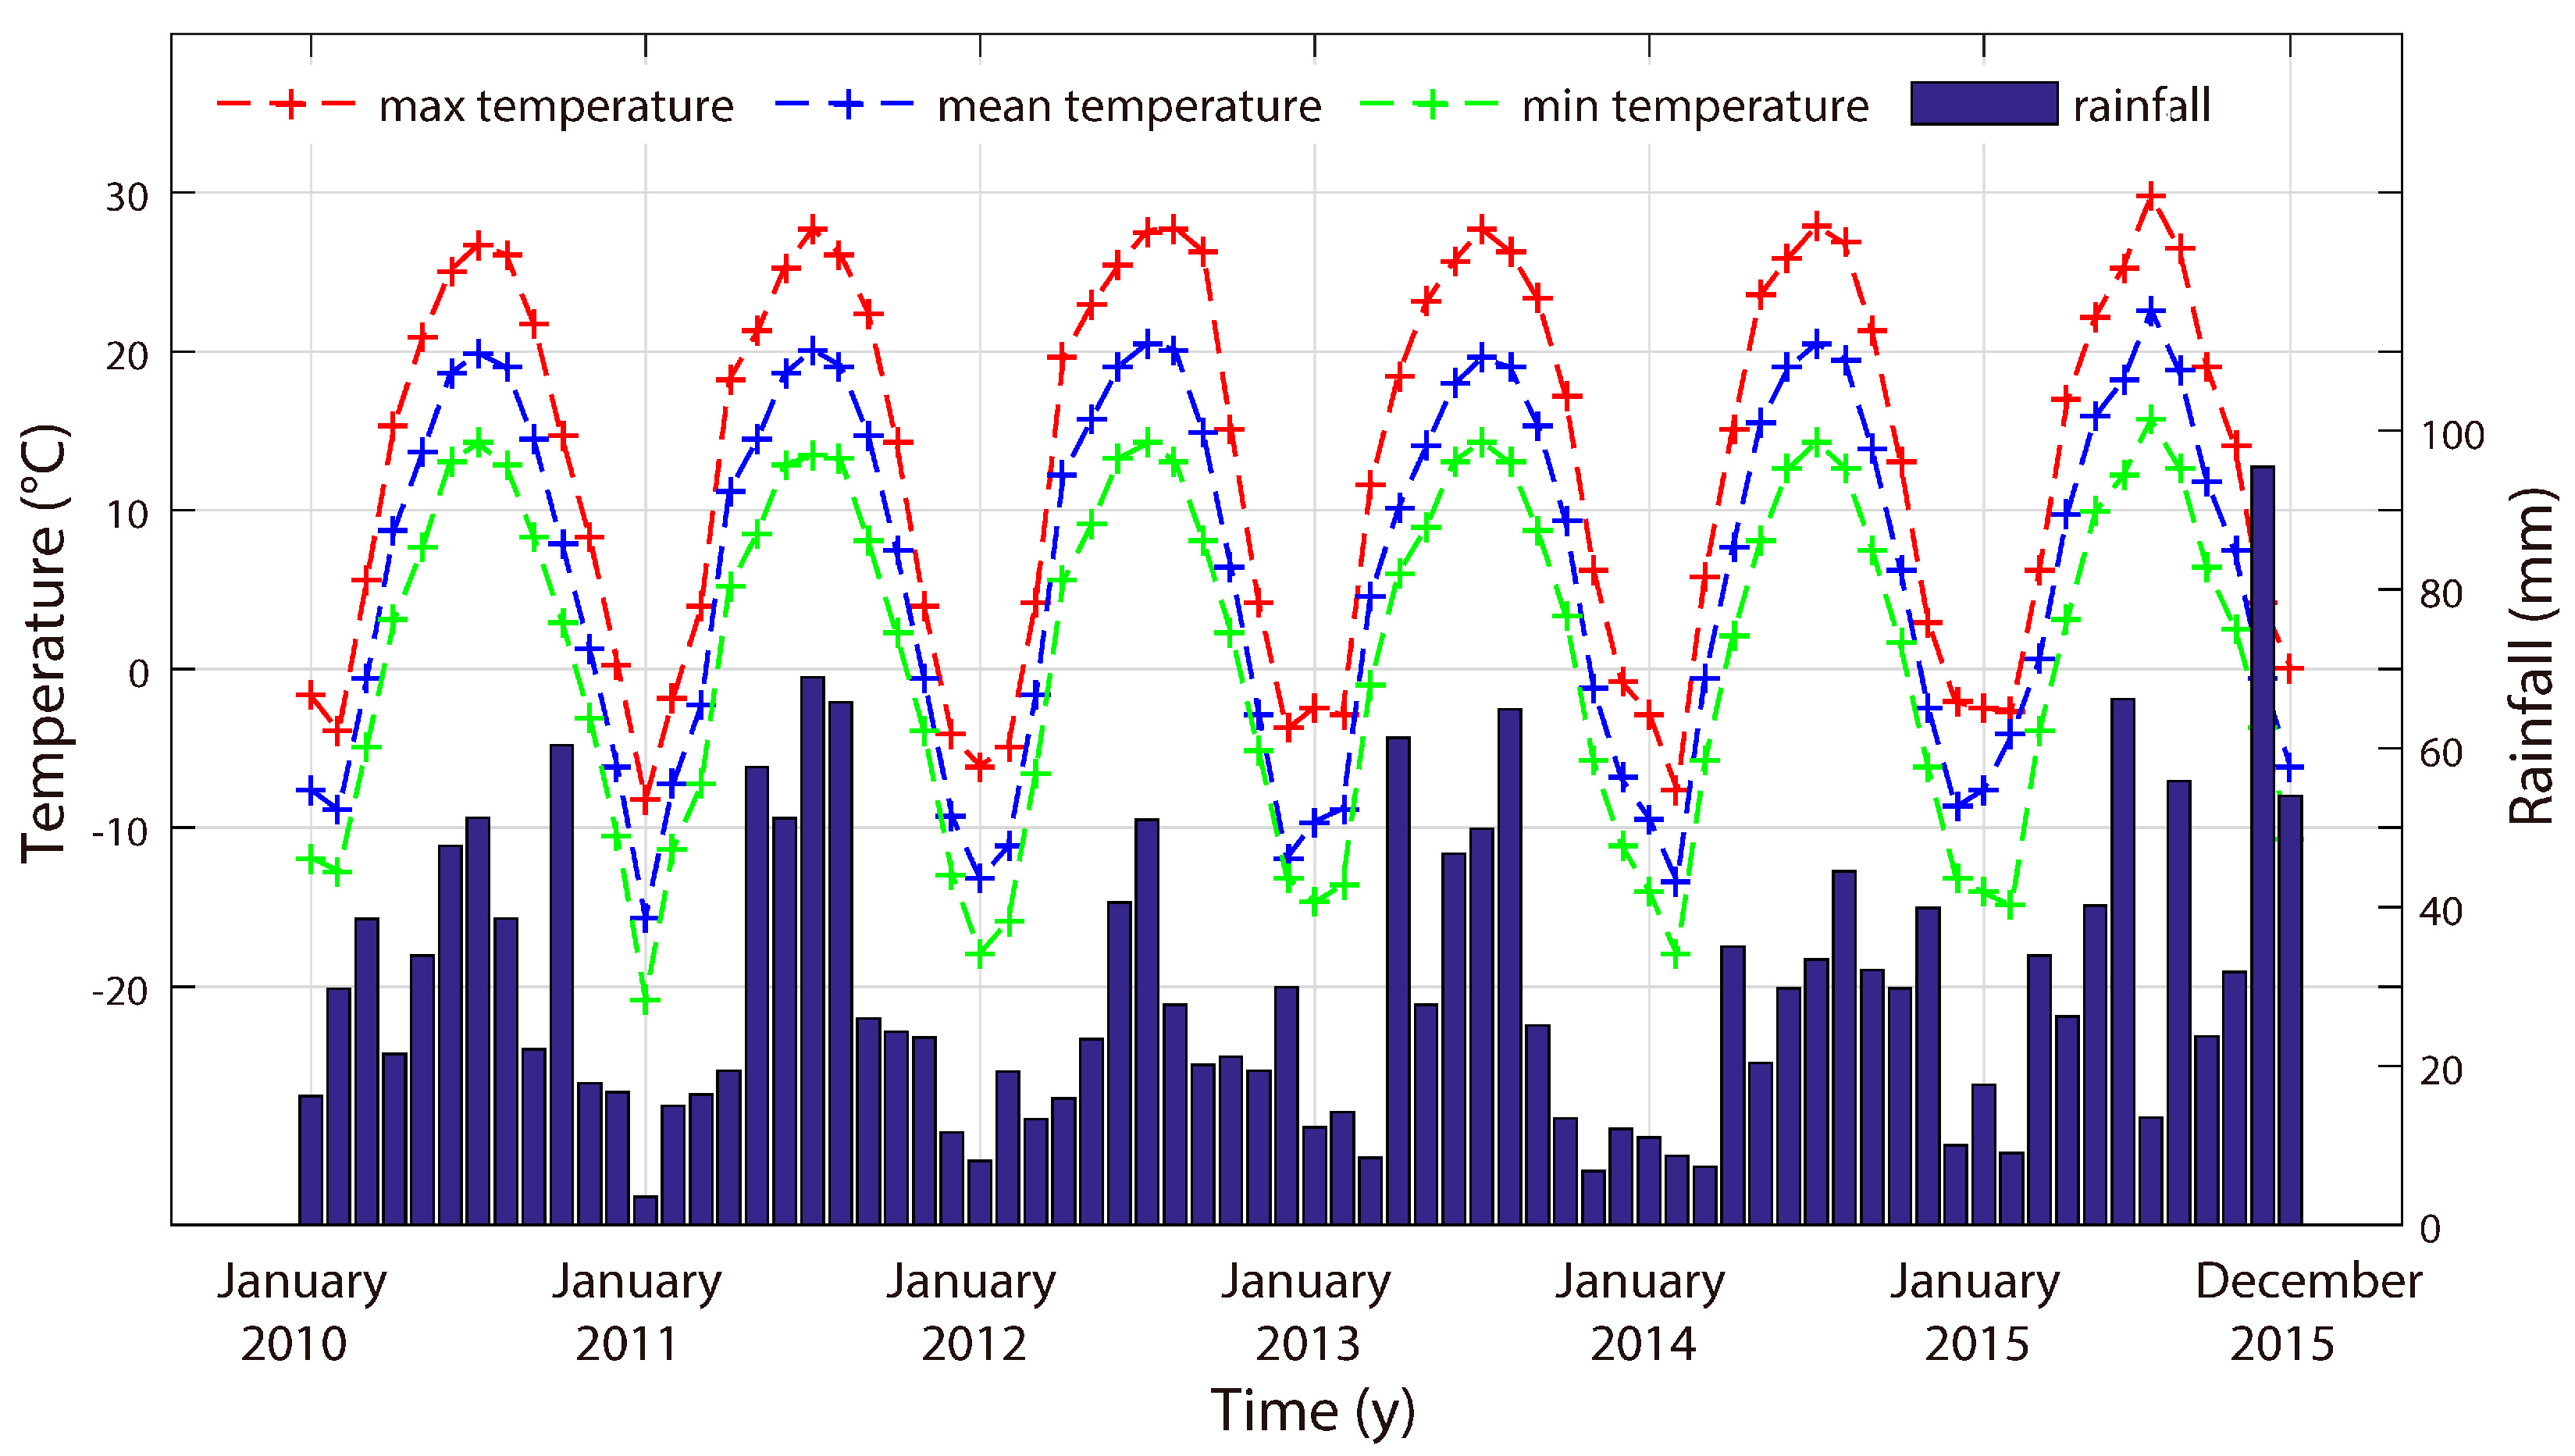
The monthly precipitation and temperature variations at station XJYN from January 2010–December 2015 are shown in Figure 8. It can be seen that since 2013, regional winter and summer precipitation has increased slightly compared with previous years. The low temperature and rainfall in winter are conducive to the rapid accumulation of snow and ice, while the high temperature in summer can accelerate the melting of glaciers, providing favorable conditions for dramatic changes in regional groundwater reserves. However, such signal changes in this region are most likely to be captured by GPS on a small scale, while on a larger scale range, this change is neglected.
However, due to a lack of effective groundwater observation data for station XJYN, a more detailed quantitative comparison was not possible to confirm this speculation, but it is considered through analysis that small-scale groundwater change is the main factor causing abnormal changes in the GPS vertical displacement at station XJYN. In addition to the contribution of the influence from regional groundwater variations, some factors unidentified by GRACE and SLMs, such as thermal elastic deformation [49], local load change and the difference in data processing strategy, may also lead to small differences in the results.
5. Conclusions
In this study, we combined GPS, GRACE and SLMs data to study vertical deformation on the Tianshan area. All of the GPS, GRACE and SLMs vertical time series showed significant seasonal variations.
The annual amplitudes and phases of the different components of the SLMs showed that in the Tianshan area, atmospheric loading is the dominant environmental effect, and the amplitude of terrestrial water storage loading is very small, accounting for about one-fifth of the atmospheric loading, while the influence of non-tidal ocean loading can be ignored. For the three geodetic datasets, the amplitude and phase of the vertical annual signal in the GRACE and SLMs data showed high consistency, while the results of GPS were different. The main reason for this difference may be that GPS observations are more sensitive to small-scale local effects, while the GRACE and SLM data are limited by low spatial resolution.
Moreover, the vertical components of more than 85% of the GPS stations exhibited a correlation of more than 0.8 with respect to the corresponding GRACE components, and 92% of the stations had a correlation greater than 0.8 for GPS and SLMs. In addition, the mean WRMS reductions were 41% and 47% after removing the annual displacements of GRACE and SLMs from GPS height time series, respectively. Compared with the consistency between GPS and GRACE vertical annual variations, the consistency between GPS and SLMs results was higher in our study area. Therefore, we consider that the campaign GPS time series can be modified by removing seasonal impacts using SLMs-derived seasonal variations in this area in the future.
Finally, the reasons for the abnormality at station XJYN were analyzed. First, SSA was used to separate the short and seasonal signals from the GPS time series, which confirmed a geophysical signal with seasonal variation at this station during 2013 and 2014. After excluding the influences from tectonic movements, atmospheric loading and land water storage loading, as well as the recent changes in the level of Lake Sailimu, the reason for the abnormal variation at this station was attributed to changes in groundwater. Meanwhile, monthly precipitation and temperature variations at station XJYN provided by the China Meteorological Data Network gave auxiliary evidence that this anomaly was caused by groundwater change. However, due to a lack of effective groundwater observation data for station XJYN, this conjecture is discussed, but not confirmed by further quantitative comparison.
Acknowledgments
This research was financially supported by the National Natural Science Foundation of China (Grant Nos. 41504008 and 41304018), the Basic Research Project of the Institute of Earthquake Science, China Earthquake Administration (Grant Nos. 2014IES010102 and 2016IES0402) and the International Science & Technology Cooperation Program of China (2015DFR21100). The GRACE data products are from the University of Texas Center for Space Research. Some of the figures were prepared using the GMT graphics package (Wessel and Smith, 1991).
Author Contributions
Y.W. and Q.Z. conceived and designed the experiments and performed the experiments; B.Z. and W.W. analyzed the data; Q.Z. wrote the main manuscript text; and the other authors helped with the writing of the text.
Conflicts of Interest
The authors declare no conflict of interest.
References
- Tapponnier, P.; Molnar, P. Active faulting and cenozoic tectonics of the Tien Shan, Mongolia, and Baykal regions. J. Geophys. Res. 1979, 84, 3425–3459. [Google Scholar] [CrossRef]
- Deng, Q.D.; Feng, X.Y.; Zhang, P.Z. Active reverse fault-fold zones and earthquakes along northern Tianshan, Xinjiang, China. Seismol. Geol. 1996, 18, 21–36. [Google Scholar]
- Niu, Z.J.; You, X.Z.; Yang, S.M. Analysis of contemporary crustal deformation characteristics with GPS data of Tianshan Mountain. J. Geodesy Geodyn. 2007, 27, 1–9. (In Chinese) [Google Scholar]
- Yang, S.M.; Li, J.; Wang, Q. The deformation pattern and fault rate in the Tianshan Mountains inferred from GPS observations. Sci. China Ser. D 2008, 51, 1064–1080. [Google Scholar] [CrossRef]
- Zubovich, A.V.; Wang, X.Q.; Scherba, Y.G.; Schelochkov, G.G.; Reilinger, R.; Reigber, C.; Mosienko, O.I.; Molnar, P.; Michajljow, W.; Makarov, V.I.; et al. GPS velocity field for the Tien Shan and surrounding regions. Tectonics 2010, 29. [Google Scholar] [CrossRef]
- Wang, W.; Yang, S.M.; Tan, K.; Zhao, B.; Huang, Y.; Zhang, C.H.; Wang, D.J. Present-day crustal deformation and strain rate field of Tianshan Mountain analyzed with GPS data. J. Geodesy Geodyn. 2014, 34, 75–80. (In Chinese) [Google Scholar]
- Van Dam, T.; Wahr, J.; Lavallée, D. A comparison of annual vertical crustal displacements from GPS and gravity recovery and climate experiment (GRACE) over Europe. J. Geophys. Res. 2007, 112, B03404. [Google Scholar] [CrossRef]
- Tregoning, P.; Watson, C.; Ramillien, G.; McQueen, H.; Zhang, J. Detecting hydrologic deformation using GRACE and GPS. Geophys. Res. Lett. 2009, 36, L1540. [Google Scholar] [CrossRef]
- Khan, S.A.; Wahr, J.; Bevis, M.; Velicogna, I.; Kendrick, E. Spread of ice mass lose into northwest Greenland observed by GRACE and GPS. Geophys. Res. Lett. 2010, 36, L06501. [Google Scholar]
- Tesmer, V.; Steigenberger, P.; van Dam, T.; Mayer-Gürr, T. Vertical deformations from homogeneously processed GRACE and global GPS long-term series. J. Geodesy 2011, 85, 291–310. [Google Scholar] [CrossRef]
- Fu, Y.; Freymueller, J.T. Seasonal and long-term vertical deformation in the Nepal Himalaya constrained by GPS and GRACE measurements. J. Geophys. Res. 2012, 117, B03407. [Google Scholar] [CrossRef]
- Liu, R.; Li, J.; Fok, H.S.; Shum, C.K.; Li, Z. Earth surface deformation in the North China Plain detected by joint analysis of GRACE and GPS data. Sensors 2014, 14, 19861–19876. [Google Scholar] [CrossRef] [PubMed]
- Hao, M.; Freymueller, J.T.; Wang, Q.; Cui, D.; Qin, S. Vertical crustal movement around the southeastern Tibetan Plateau constrained by GPS and GRACE data. Earth Planet. Sci. Lett. 2016, 437, 1–8. [Google Scholar] [CrossRef]
- Xu, C. Evaluating mass loading products by comparison to GPS array daily solutions. Geophys. J. Int. 2017, 208, 24–35. [Google Scholar] [CrossRef]
- Tan, W.J.; Dong, D.N.; Chen, J.P.; Wu, B. Analysis of systematic differences from GPS-measured and GRACE-modeled deformation in Central Valley, California. Adv. Space Res. 2016, 57, 19–29. [Google Scholar] [CrossRef]
- Li, W.W.; van Dam, T.; Li, Z.; Shen, Y.Z. Annual variation detected by GPS, GRACE and loading models. Stud. Geophys. Geod. 2016, 60, 608–621. [Google Scholar] [CrossRef]
- Gu, Y.C.; Yuan, L.G.; Fan, D.M.; You, W.; Su, Y. Seasonal crustal vertical deformation induced by environmental mass loading in mainland China derived from GPS, GRACE and surface loading models. Adv. Space Res. 2016, 59, 88–102. [Google Scholar] [CrossRef]
- Liu, L.; Khan, S.A.; van Dam, T.; Ma, J.H.Y.; Bevis, M. Annual variations in GPS-measured vertical displacements near upernavik isstrøm (Greenland) and contributions from surface mass loading. J. Geophys. Res. 2017, 122, 677–691. [Google Scholar] [CrossRef]
- Li, Z.Q.; Li, K.M.; Wang, L. Study on recent glacier changes and their impact on water resource in Xinjiang, north western China. Quat. Sci. 2010, 30, 96–106. (In Chinese) [Google Scholar]
- Yang, P.; Chen, Y. An analysis of terrestrial water storage variations from grace and gldas: The Tianshan Mountains and its adjacent areas, Central Asia. Quat. Int. 2015, 358, 106–112. [Google Scholar] [CrossRef]
- Dach, R.; Lutz, S.; Walser, P.; Fridez, P. Bernese GNSS Software Version 5.2; University of Bern, Bern Open Publishing: Bern, Switzerland, 2015. [Google Scholar]
- Steigenberger, P.; Rothacher, M.; Dietrich, R.; Fritsche, M.; Rülke, A.; Vey, S. Reprocessing of a global GPS network. J. Geophys. Res. 2006, 111, 0148–0227. [Google Scholar] [CrossRef]
- Schmid, R.; Dach, R.; Collilieux, X.; Jäggi, A.; Schmitz, M.; Dilssner, F. Absolute IGS antenna phase center model igs08.atx: Status and potential improvements. J. Geodesy 2016, 90, 343–364. [Google Scholar] [CrossRef]
- Böhm, J.; Niell, A.; Tregoning, P.; Schuh, H. Global Mapping Function (GMF): A new empirical mapping function based on numerical weather data. Geophys. Res. Lett. 2006, 33, L07304. [Google Scholar] [CrossRef]
- Petrie, E.J.; King, M.A.; Moore, P.; Lavallée, D.A. Higher order ionospheric effects on the GPS reference frame and velocities. J. Geophys. Res. 2010, 115, 153–164. [Google Scholar] [CrossRef]
- Altamimi, Z.; Métivier, L.; Collilieux, X. ITRF2008 plate motion model. J. Geophys. Res. 2012, 117, B07402. [Google Scholar] [CrossRef]
- Geng, J.; Williams, S.D.P.; Teferle, F.N.; Dodson, A.H. Detecting storm surge loading deformations around the southern North Sea using subdaily GPS. Geophys. J. Int. 2012, 191, 569–578. [Google Scholar] [CrossRef]
- Cheng, M.; Tapley, B.D. Variations in the Earth’s oblateness during the past 28 years. J. Geophys. Res. 2004, 109, B09402. [Google Scholar] [CrossRef]
- Bettadpur, S. Gravity Recovery and Climate Experiment UTCSR Level-2, Processing Standards Document for Level-2; Center for Space Research, University of Texas at Austin: Austin, TX, USA, 2005. [Google Scholar]
- Rangelova, E.; van der Wal, W.; Braun, A.; Sideris, M.G.; Wu, P. Analysis of gravity recovery and climate experiment time-variable mass redistribution signals over North America by means of principal component analysis. J. Geophys. Res. 2007, 112, F03002. [Google Scholar] [CrossRef]
- Swenson, S.; Chambers, D.; Wahr, J. Estimating geocenter variations from a combination of GRACE and ocean model output. J. Geophys. Res. 2008, 113, B08410. [Google Scholar] [CrossRef]
- Wouters, B.; Schrama, E.J.O. Improved accuracy of GRACE gravity solutions through empirical orthogonal function filtering of spherical harmonics. Geophys. Res. Lett. 2007, 34, L23711. [Google Scholar] [CrossRef]
- Kusche, J.; Schrama, E.J.O. Surface mass redistribution inversion from global GPS deformation and gravity recovery and climate experiment (GRACE) gravity data. J. Geophys. Res. 2005, 110, B09409. [Google Scholar] [CrossRef]
- Farrell, W.E. Deformation of the Earth by surface loads. Rev. Geophys. 1972, 10, 761–797. [Google Scholar] [CrossRef]
- Marcus, S.L.; Dickey, J.O.; Fukumori, I.; Viron, O.D. Detection of the Earth rotation response to a rapid fluctuation of Southern Ocean circulation in November 2009. Geophys. Res. Lett. 2012, 39, L04605. [Google Scholar] [CrossRef]
- Van Dam, T.; Wahr, J. Displacements of the Earth’s surface due to atmospheric loading: Effects on gravity and baseline measurements. J. Geophys. Res. 1987, 92, 1281–1286. [Google Scholar] [CrossRef]
- Dong, D.N.; Dickey, J.O.; Chao, Y.; Cheng, M.K. Geocenter variations caused by atmosphere, ocean and surface ground water. Geophys. Res. Lett. 1997, 24, 1867–1870. [Google Scholar] [CrossRef]
- Blewitt, G. Self-consistency in reference frames, geocenter definition, and surface loading of the solid earth. J. Geophys. Res. 2003, 108, 2103. [Google Scholar] [CrossRef]
- Nikolaidis, R. Observation of Geodetic and Seismic Deformation with the Global Positioning System. Ph.D. Thesis, University of California San Deigo, San Deigo, CA, USA, 2002; pp. 1–115. [Google Scholar]
- Chen, J.L.; Wilson, C.R.; Famiglietti, J.S.; Rodell, M. Attenuation effect on seasonal basin-scale water storage change from GRACE time-variable gravity. J. Geodesy 2007, 81, 237–245. [Google Scholar] [CrossRef]
- Rodell, M.; Houser, P.R.; Jambor, U.E.A.; Gottschalck, J.; Mitchell, K.; Meng, C.J.; Arsenault, K.; Cosgrove, B.; Radakovich, J.; Bosilovich, M.; et al. The global land data assimilation system. Bull. Am. Meteorol. Soc. 2004, 85, 381–394. [Google Scholar] [CrossRef]
- Li, Z.; van Dam, T.; Collilieux, X.; Altamimi, Z.; Rebischung, P.; Nahmani, S. Quality evaluation of the weekly vertical loading effects induced from continental water storage models. In IAG 150 Years; Springer: Cham, Switzerland, 2015; pp. 1–10. [Google Scholar]
- Chen, J.L.; Famigliett, J.S.; Scanlon, B.R.; Rodell, M. Groundwater storage changes: Present status from GRACE observations. Surv. Geophys. 2016, 37, 397–417. [Google Scholar] [CrossRef]
- Dong, D.N.; Fang, P.; Bock, Y.; Cheng, M.K.; Miyazaki, S. Anatomy of apparent seasonal variations from GPS-derived site position time series. J. Geophys. Res. 2002, 107, 2075. [Google Scholar] [CrossRef]
- Ray, J.; Altamimi, Z.; Collilieux, X.; van Dam, T. Anomalous harmonics in the spectra of GPS position estimates. GPS Solut. 2008, 12, 55–64. [Google Scholar] [CrossRef]
- Nahmani, S.; Bock, O.; Bouin, M.N.; Santamaría-Gómez, A.; Boy, J.P.; Collilieux, X.; Métivier, L.; Panet, I.; Genthon, P.; Linage, C.; et al. Hydrological deformation induced by the West African Monsoon: Comparison of GPS, GRACE and loading models. J. Geophys. Res. 2012, 117, B05409. [Google Scholar] [CrossRef]
- Ghil, M.; Allen, M.R.; Dettinger, M.D.; Ide, K.; Kondrashov, D.; Mann, M.E.; Robertson, A.W.; Saunders, A.; Tian, Y.; Varadi, F.; et al. Advanced spectral methods for climatic time series. Rev. Geophys. 2002, 40, 1003. [Google Scholar] [CrossRef]
- Bevis, M.; Melini, D.; Spada, G. On computing the geoelastic response to a disk load. Geophys. J. Int. 2016, 205, 1804–1812. [Google Scholar] [CrossRef]
- Fang, M.; Dong, D.N.; Hager, B.H. Displacements due to surface temperature variation on a uniform elastic sphere with its centre of mass stationary. Geophys. J. Int. 2014, 196, 194–203. [Google Scholar] [CrossRef]
Figure 1.
Data availability (left) and the locations (right) of the GPS stations in the Tianshan area. This includes four long occupational sites (CHUM, POL2, URUM and WUSH) with approximately 15 years of observations (red triangles) and the other stations with nearly five years of observations (blue triangles).

Figure 2.
Detrended vertical displacement time series of GPS, GRACE and Surface Loading Models (SLMs) data for 26 GPS stations. The gray dots, red dots and blue lines represent the GPS, SLM and GRACE time series, respectively.
Figure 2.
Detrended vertical displacement time series of GPS, GRACE and Surface Loading Models (SLMs) data for 26 GPS stations. The gray dots, red dots and blue lines represent the GPS, SLM and GRACE time series, respectively.

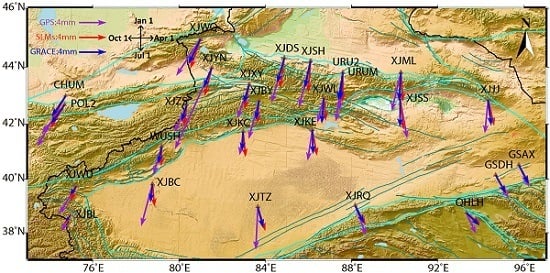
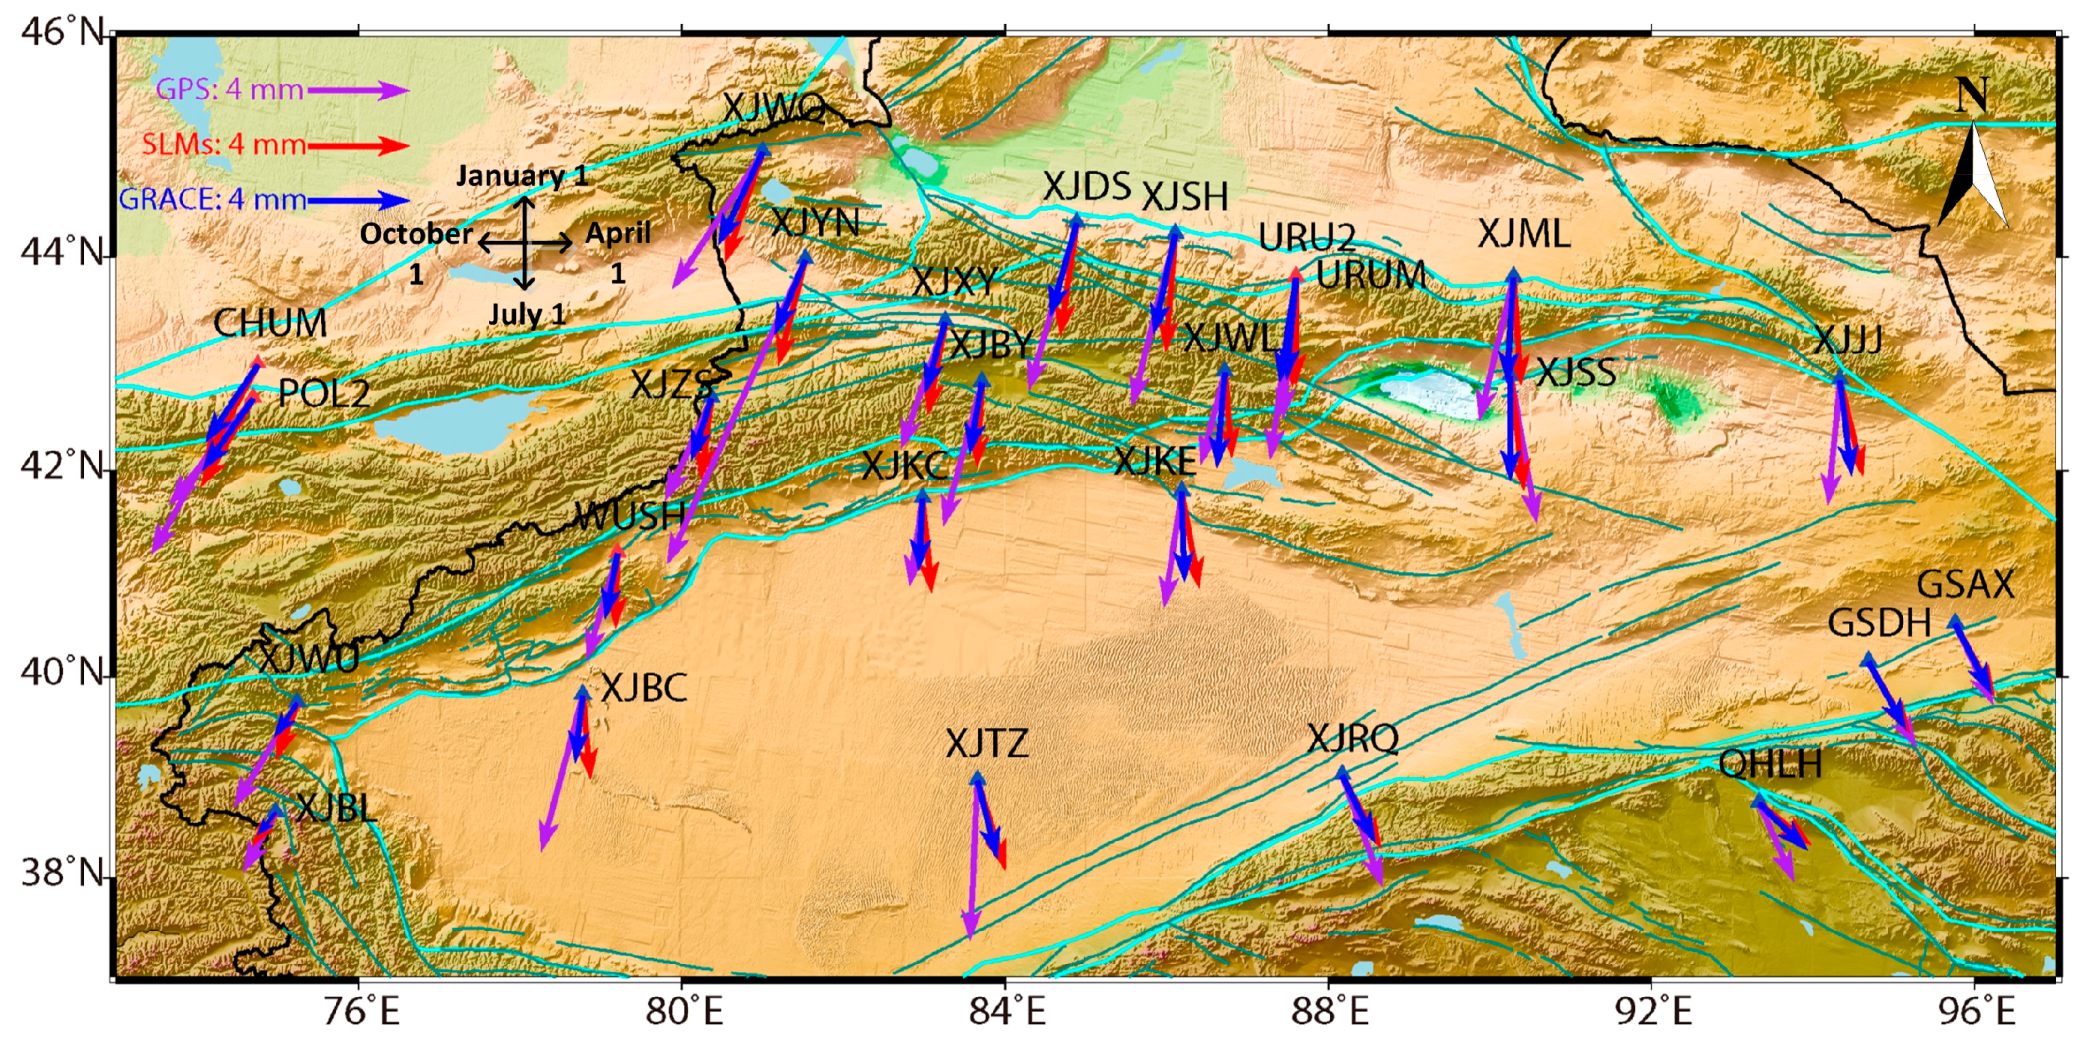
Figure 3.
Annual vertical deformations from GPS, GRACE and SLMs data. The length of the vector represents the amplitude, and the phasors point directly in the direction of the maximum (‘up’ = max in January, ‘right’ = max in April, ‘down’ = max in July, ‘left’ = max in October) [10]. The red triangles represent the four long occupational sites (CHUM, POL2, URUM and WUSH) with approximately 15 years of observations and the blue triangles represent the other stations with nearly five years of observations.

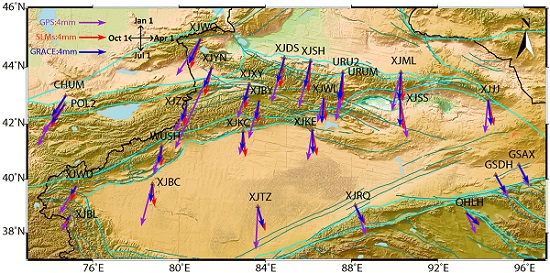
Figure 4.
GPS-GRACE and GPS-SLMs difference vectors for the vertical annual signals. The red triangles represent the four long occupational sites (CHUM, POL2, URUM and WUSH) with approximately 15 years of observations and the blue triangles represent the other stations with nearly five years of observations.

Figure 5.
Correlation coefficients computed for the annual vertical time series from the 26 stations based on the (a) GPS and GRACE and the the (b) GPS and SLMs datasets. The red triangles represent the four long occupational sites (CHUM, POL2, URUM and WUSH) with approximately 15 years of observations and the blue triangles represent the other stations with nearly five years of observations.

Figure 6.
GPS Weighted Root-Mean-Squares (WRMS) reduction (%) obtained by subtracting (a) GRACE or (b) SLMs vertical annual deformation from GPS height. The red triangles represent the four long occupational sites (CHUM, POL2, URUM and WUSH) with approximately 15 years of observations and the blue triangles represent the other stations with nearly five years of observations.

Figure 7.
GPS vertical time series at station XJYN. (a) Detrended GPS time series; (b) separated abnormal signal; (c) separated seasonal signal.
Figure 7.
GPS vertical time series at station XJYN. (a) Detrended GPS time series; (b) separated abnormal signal; (c) separated seasonal signal.

Figure 8.
Monthly precipitation and temperature changes at station XJYN from January 2010–December 2015. Data source: China Meteorological Data Network (http://data.cma.cn/site/index.html).
Figure 8.
Monthly precipitation and temperature changes at station XJYN from January 2010–December 2015. Data source: China Meteorological Data Network (http://data.cma.cn/site/index.html).


Table 1.
Details of the surface loading models used. ECCO, Estimating the Circulation and Climate of the Ocean.
Table 1.
Details of the surface loading models used. ECCO, Estimating the Circulation and Climate of the Ocean.
| Surface Loading Models | Atmosphere NCEP | Non-Tidal Ocean ECCO | Terrestrial Water Storage NCEP |
|---|---|---|---|
| Version | Reanalysis 2 | kf080 | Reanalysis 2 |
| Time solution | 6 h | 12 h | Daily |
| Grid spacing | 2.5° | 1° (except near the Equator) | 1.875° |
| Spatial extent | Global | 79.5°S–78.5°N | Global |
Table 2.
Annual amplitudes and phases from the GPS, GRACE and SLMs (including atmosphere, non-tidal ocean and terrestrial water storage loadings). The units of annual amplitude (Amp.) and phase are mm and days, respectively.
Table 2.
Annual amplitudes and phases from the GPS, GRACE and SLMs (including atmosphere, non-tidal ocean and terrestrial water storage loadings). The units of annual amplitude (Amp.) and phase are mm and days, respectively.
| Station | GPS | GRACE | SLMs | Atmosphere | Non-Tidal Ocean | Terrestrial Water Storage | ||||||
|---|---|---|---|---|---|---|---|---|---|---|---|---|
| Amp. | Phase | Amp. | Phase | Amp. | Phase | Amp. | Phase | Amp. | Phase | Amp. | Phase | |
| CHUM | 8.8 | 211.5 | 3.8 | 216.2 | 4.5 | 210.8 | 4.2 | 179.2 | 0.04 | 107.0 | 2.3 | 279.9 |
| GSAX | 3.6 | 157.7 | 3.2 | 155.4 | 3.3 | 154.4 | 3.7 | 173.0 | 0.06 | 143.7 | 1.3 | 47.6 |
| GSDH | 3.9 | 153.7 | 3.1 | 153.6 | 3.3 | 152.8 | 3.7 | 172.6 | 0.06 | 139.9 | 1.3 | 44.4 |
| POL2 | 5.4 | 220.4 | 3.5 | 217.4 | 4.1 | 212.9 | 3.9 | 177.7 | 0.04 | 102.7 | 2.4 | 281.0 |
| QHLH | 3.4 | 158.6 | 2.7 | 136.6 | 2.6 | 131.3 | 2.8 | 164.5 | 0.06 | 131.8 | 1.6 | 41.1 |
| URU2 | 5.7 | 187.7 | 4.2 | 191.1 | 4.5 | 184.4 | 4.7 | 180.3 | 0.05 | 138.0 | 0.5 | 334.7 |
| URUM | 7.4 | 190.4 | 4.1 | 187.6 | 4.3 | 182.6 | 4.8 | 178.9 | 0.05 | 138.0 | 0.7 | 331.9 |
| WUSH | 4.5 | 198.6 | 2.7 | 193.3 | 3.0 | 184.1 | 3.7 | 174.0 | 0.05 | 95.1 | 0.9 | 319.9 |
| XJBC | 6.5 | 197.2 | 2.7 | 188.7 | 3.4 | 177.3 | 4.1 | 176.9 | 0.05 | 82.4 | 1.0 | 361.9 |
| XJBL | 2.7 | 211.1 | 1.2 | 221.8 | 1.6 | 217.5 | 2.4 | 166.5 | 0.06 | 65.4 | 2.2 | 321.2 |
| XJBY | 6.0 | 197.3 | 2.9 | 192.0 | 3.4 | 185.8 | 3.8 | 176.7 | 0.05 | 122.8 | 0.7 | 318.0 |
| XJDS | 7.0 | 198.3 | 3.9 | 198.2 | 4.6 | 190.8 | 4.8 | 180.8 | 0.05 | 136.3 | 0.9 | 290.2 |
| XJJJ | 5.1 | 187.9 | 3.9 | 175.6 | 4.0 | 169.3 | 4.4 | 177.0 | 0.06 | 146.6 | 0.8 | 67.2 |
| XJKC | 3.6 | 190.8 | 2.9 | 185.5 | 3.8 | 177.1 | 4.4 | 177.9 | 0.05 | 111.6 | 0.7 | 347.5 |
| XJKE | 4.7 | 191.0 | 3.7 | 180.7 | 4.0 | 172.4 | 4.6 | 178.1 | 0.05 | 122.1 | 0.7 | 77.6 |
| XJML | 5.9 | 195.8 | 4.2 | 186.1 | 4.4 | 178.5 | 4.7 | 179.0 | 0.05 | 143.0 | 0.4 | 350.2 |
| XJRQ | 4.8 | 162.9 | 3.0 | 156.7 | 3.3 | 154.6 | 3.9 | 174.2 | 0.05 | 111.3 | 1.3 | 48.8 |
| XJSH | 7.2 | 196.4 | 4.1 | 194.6 | 4.8 | 187.1 | 4.9 | 180.9 | 0.05 | 137.5 | 0.6 | 300.2 |
| XJSS | 6.1 | 172.8 | 4.3 | 182.8 | 4.7 | 176.1 | 5.1 | 179.4 | 0.05 | 138.8 | 0.7 | 68.8 |
| XJTZ | 6.5 | 185.2 | 3.2 | 168.4 | 3.8 | 165.4 | 4.4 | 177.0 | 0.05 | 92.6 | 0.9 | 65.8 |
| XJWL | 3.9 | 197.0 | 3.9 | 187.2 | 3.5 | 177.7 | 4.0 | 177.0 | 0.05 | 130.9 | 0.5 | 351.3 |
| XJWQ | 6.6 | 215.6 | 4.1 | 207.7 | 4.7 | 201.1 | 4.3 | 180.8 | 0.05 | 135.3 | 1.6 | 279.5 |
| XJWU | 4.9 | 213.5 | 1.7 | 216.2 | 2.4 | 202.9 | 2.9 | 171.4 | 0.05 | 72.9 | 1.7 | 308.7 |
| XJXY | 5.4 | 201.5 | 3.0 | 198.3 | 3.8 | 193.0 | 4.0 | 178.3 | 0.05 | 126.2 | 1.1 | 282.3 |
| XJYN | 13.5 | 206.6 | 3.2 | 204.5 | 4.4 | 196.6 | 4.3 | 180.2 | 0.05 | 127.6 | 1.4 | 279.7 |
| XJZS | 4.5 | 206.6 | 2.6 | 200.3 | 3.3 | 189.9 | 3.6 | 175.9 | 0.04 | 112.7 | 0.9 | 298.5 |
© 2017 by the authors. Licensee MDPI, Basel, Switzerland. This article is an open access article distributed under the terms and conditions of the Creative Commons Attribution (CC BY) license (http://creativecommons.org/licenses/by/4.0/).
Share and Cite
MDPI and ACS Style
Wu, Y.; Zhao, Q.; Zhang, B.; Wu, W. Characterizing the Seasonal Crustal Motion in Tianshan Area Using GPS, GRACE and Surface Loading Models. Remote Sens. 2017, 9, 1303. https://doi.org/10.3390/rs9121303
AMA Style
Wu Y, Zhao Q, Zhang B, Wu W. Characterizing the Seasonal Crustal Motion in Tianshan Area Using GPS, GRACE and Surface Loading Models. Remote Sensing. 2017; 9(12):1303. https://doi.org/10.3390/rs9121303
Chicago/Turabian StyleWu, Yunlong, Qian Zhao, Bao Zhang, and Weiwei Wu. 2017. "Characterizing the Seasonal Crustal Motion in Tianshan Area Using GPS, GRACE and Surface Loading Models" Remote Sensing 9, no. 12: 1303. https://doi.org/10.3390/rs9121303
Note that from the first issue of 2016, this journal uses article numbers instead of page numbers. See further details here.