
Identifying the Relative Contributions of Climate and Grazing to Both Direction and Magnitude of Alpine Grassland Productivity Dynamics from 1993 to 2011 on the Northern Tibetan Plateau

Abstract
:
1. Introduction
2. Materials and Methods
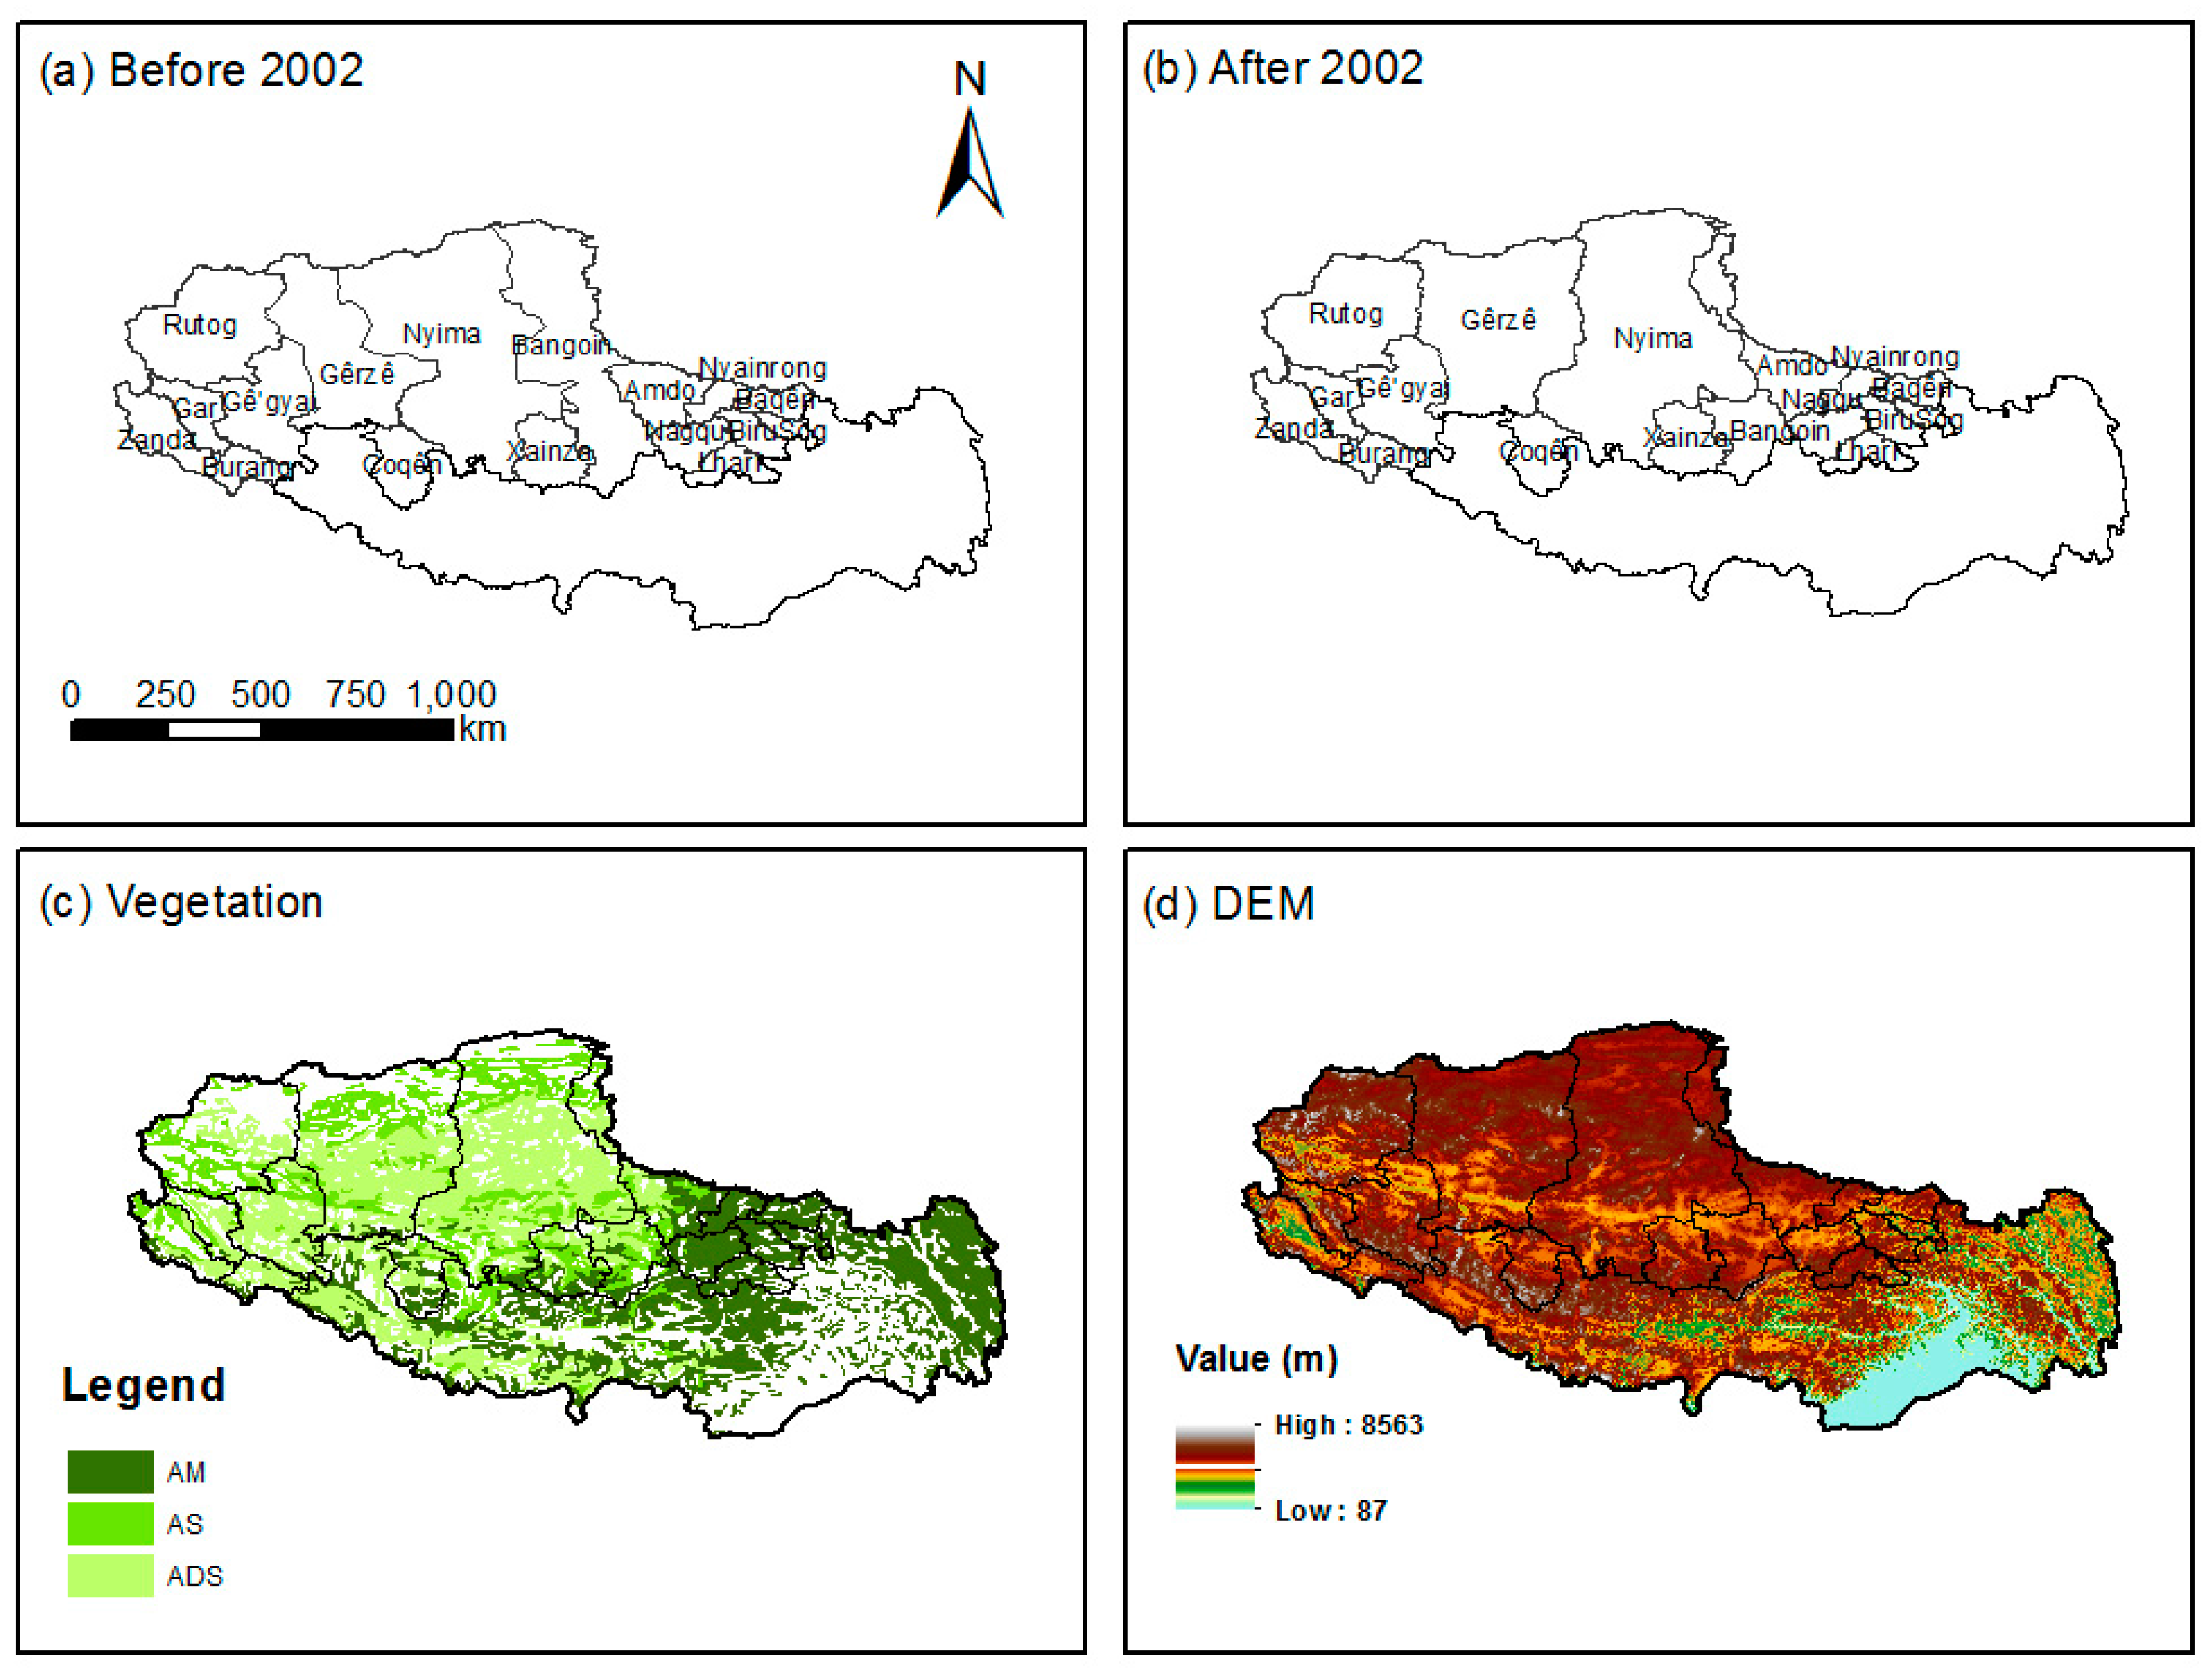
2.1. Study Area
2.2. Simulated Potential and Actual Grassland Productivity
2.3. Productivity Actually Consumed by Domestic Herbivores
2.4. Precipitation and Temperature Data
2.5. Time Series Analyses
3. Results
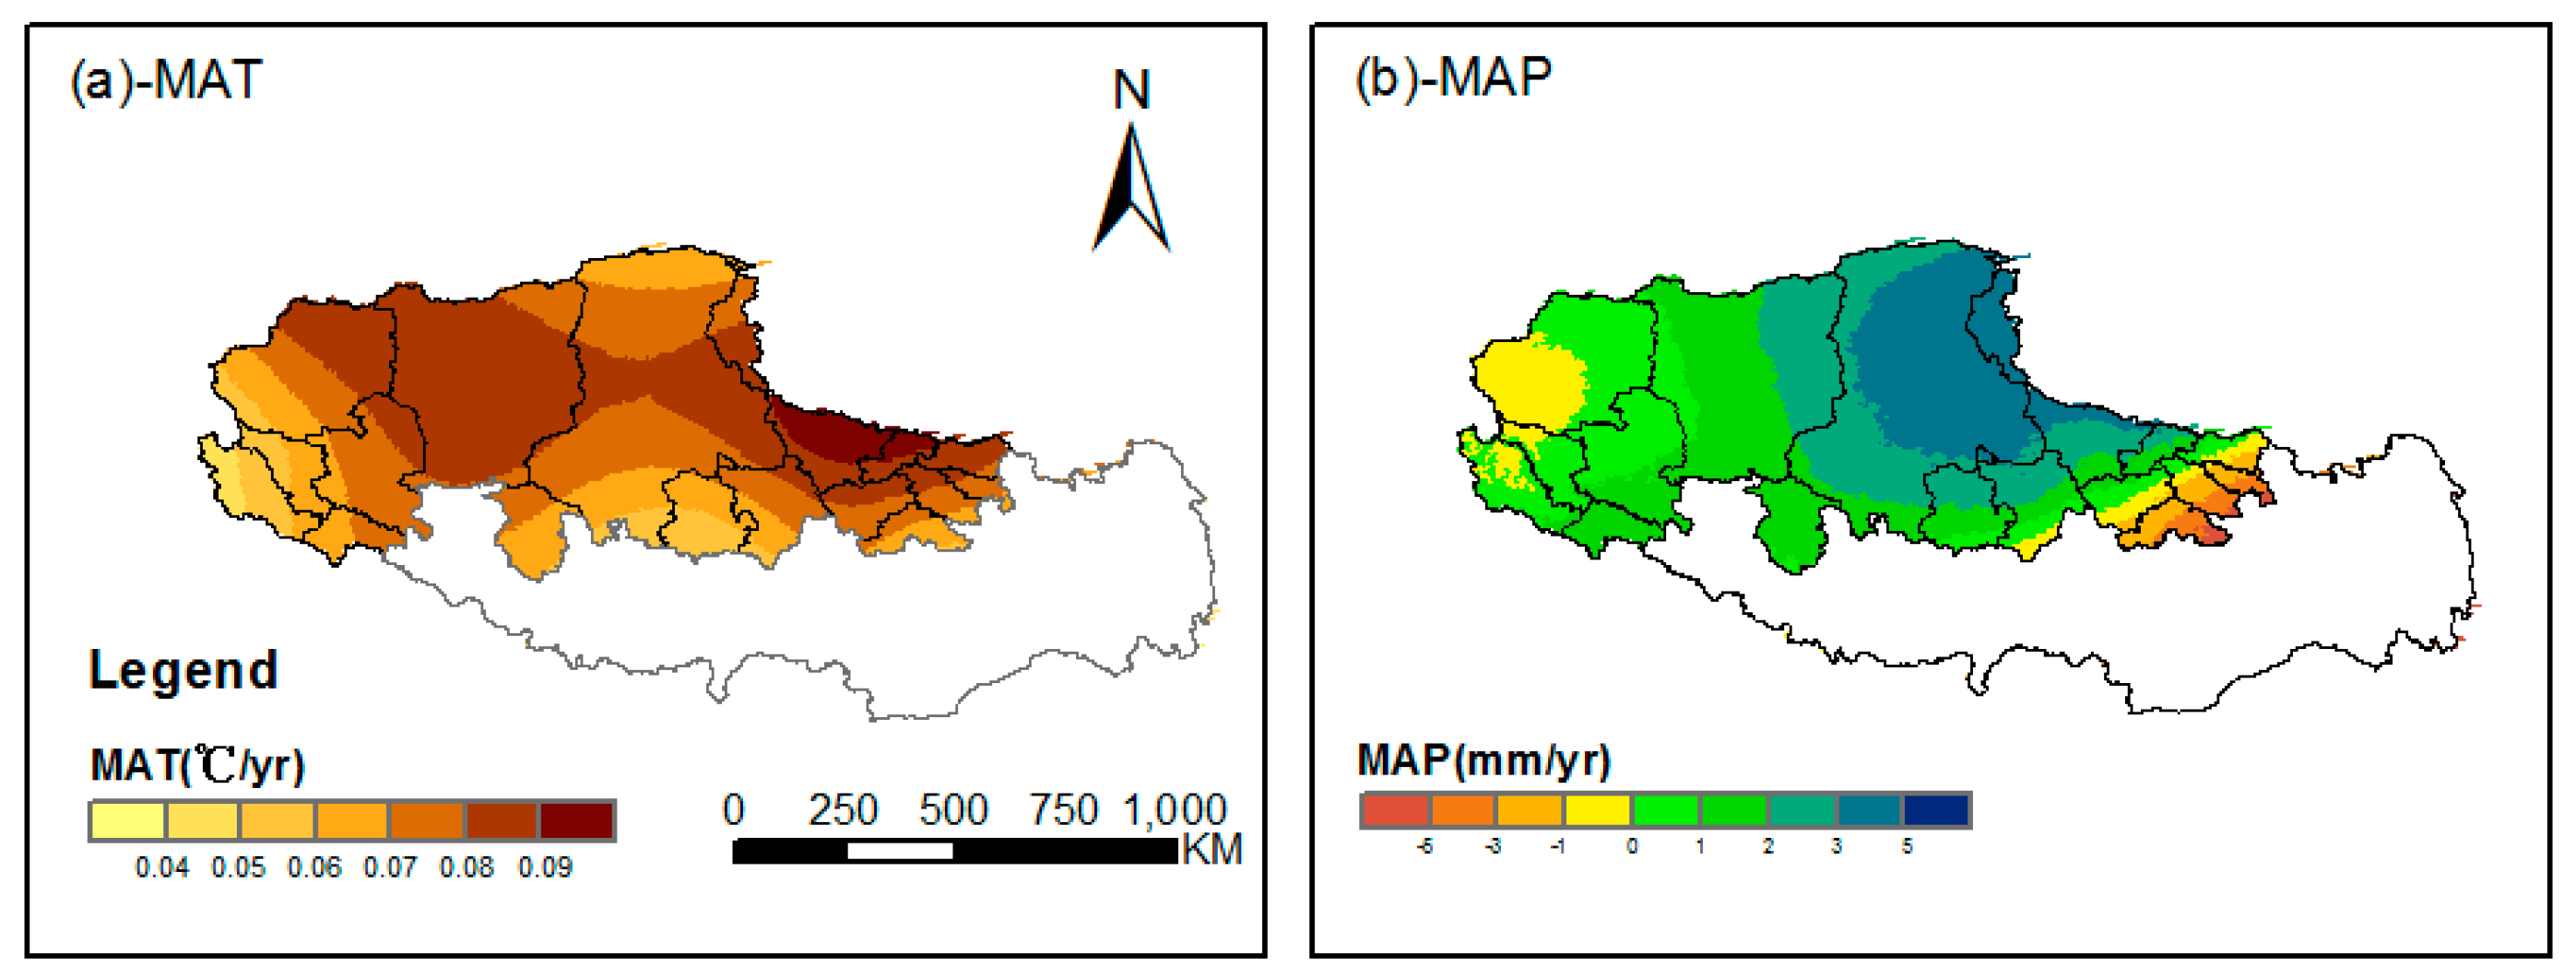
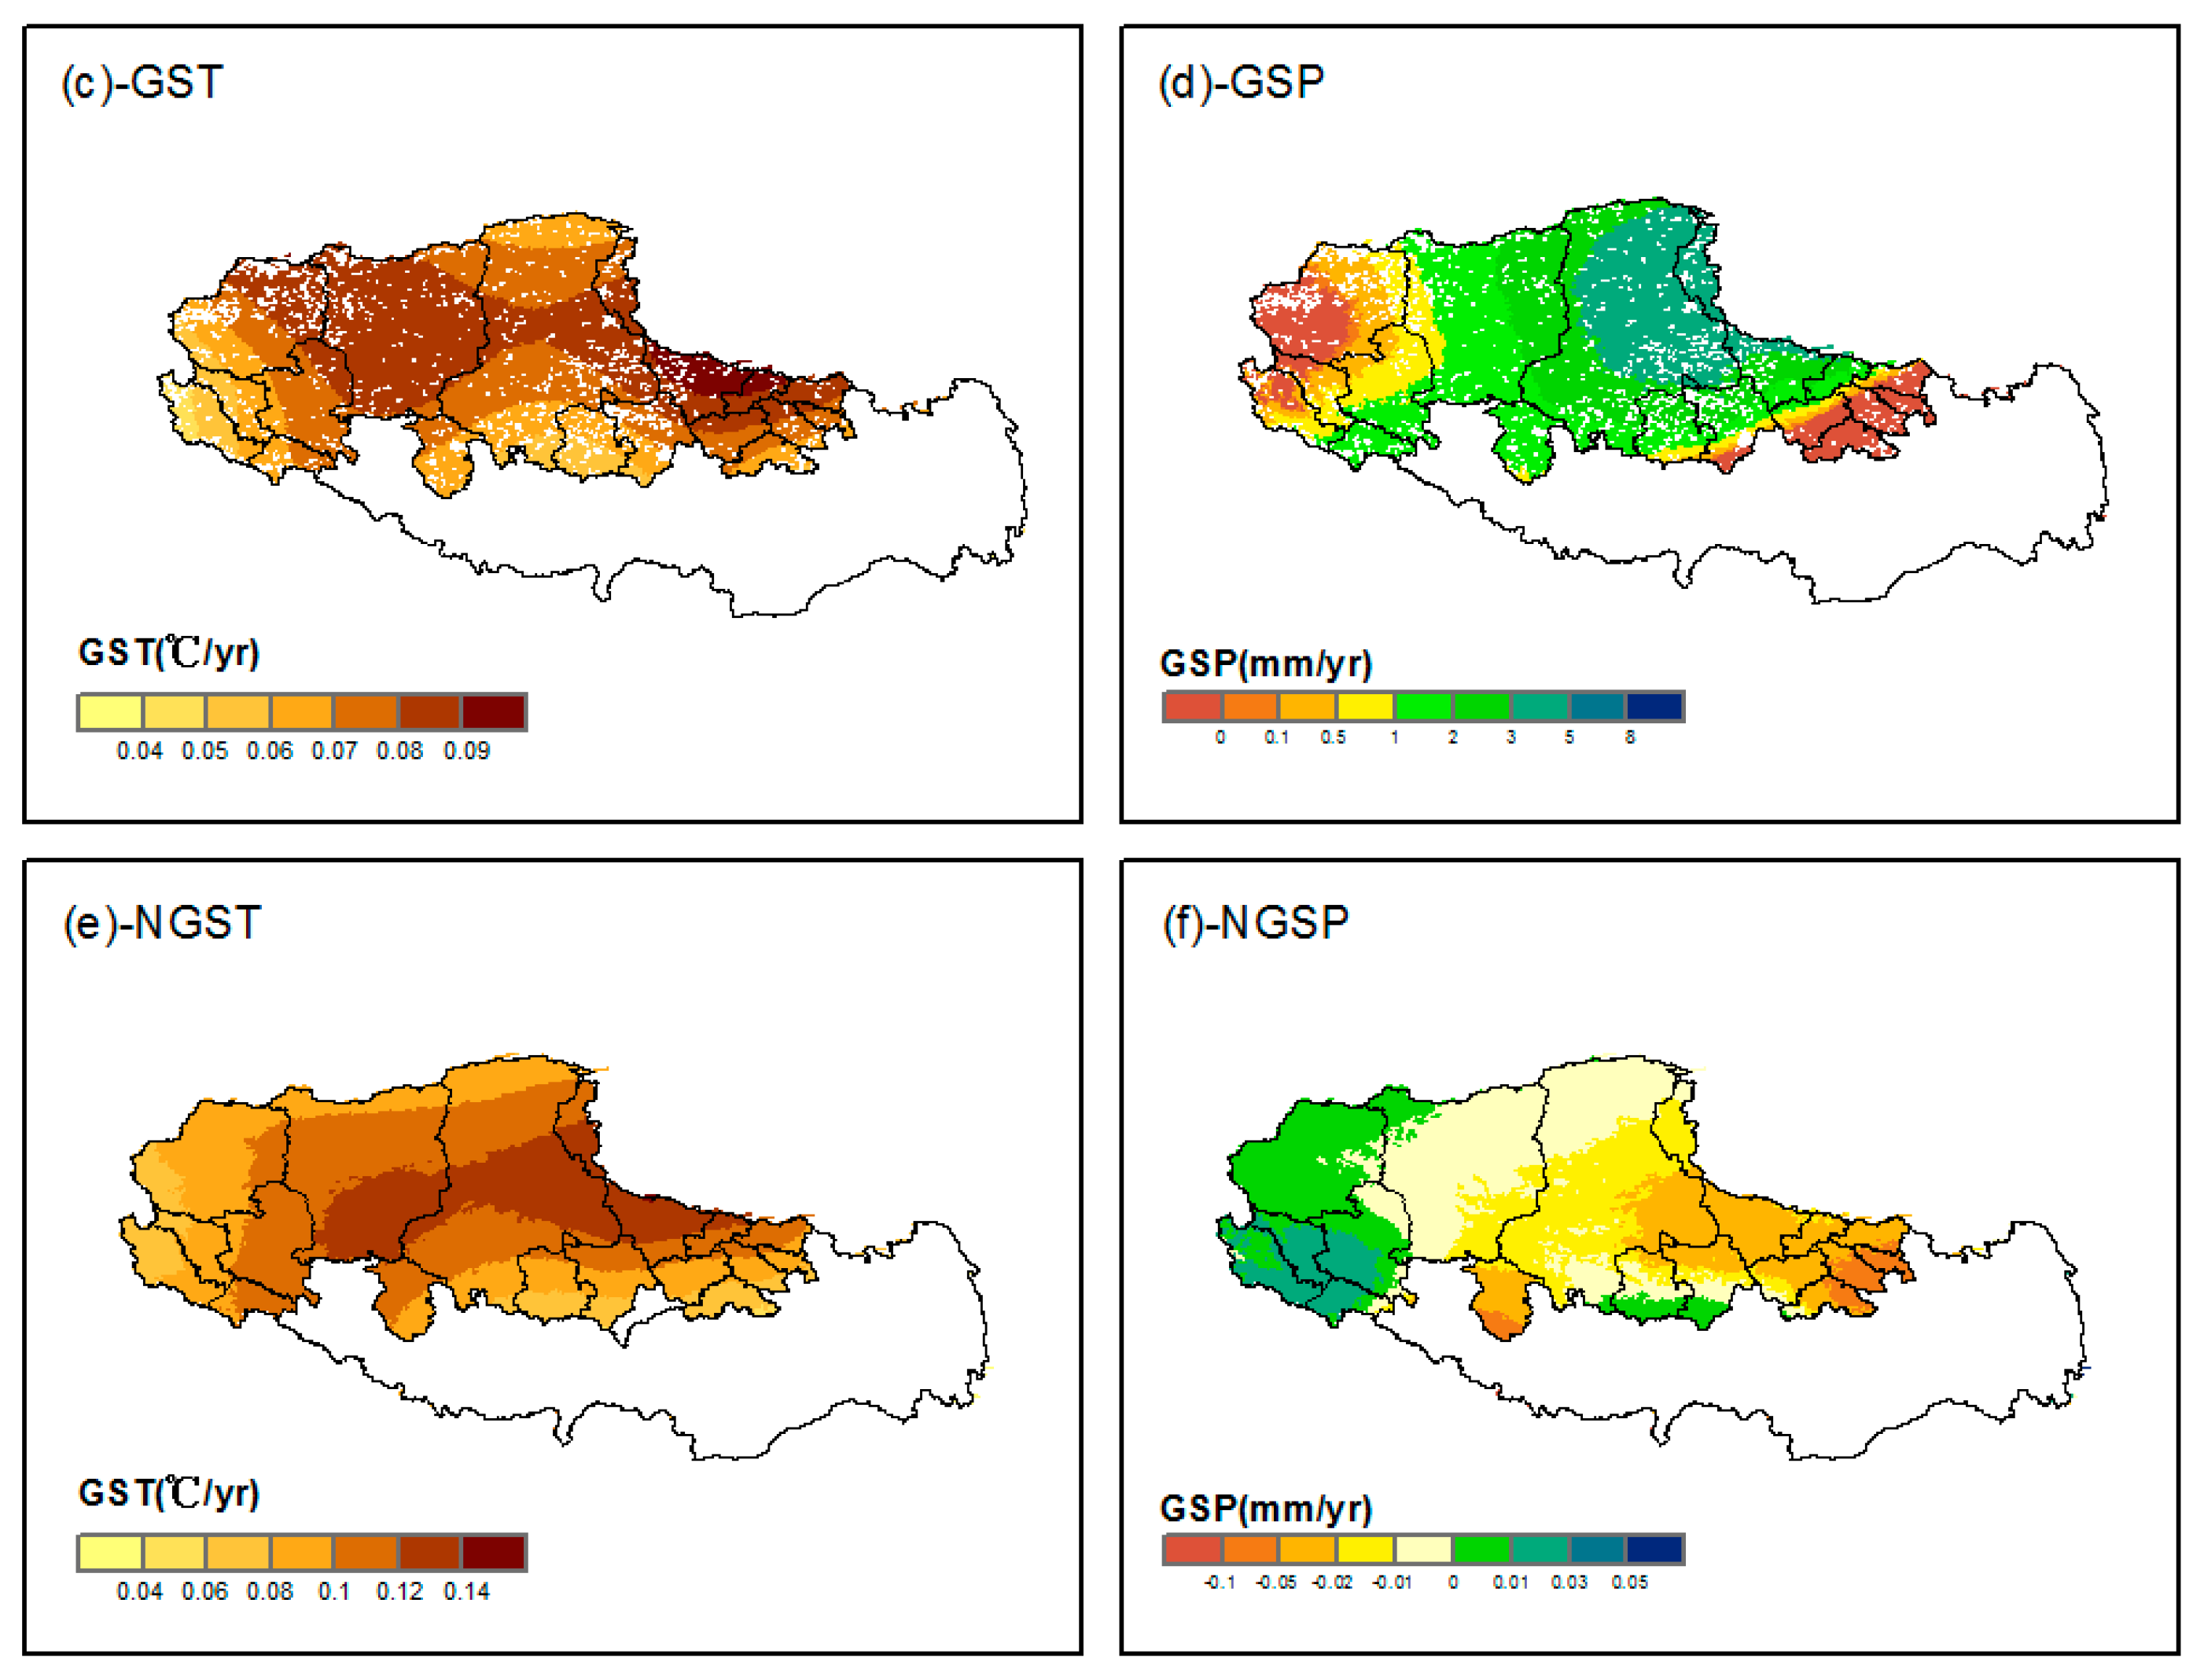
3.1. Trends of Precipitation and Temperature from 1993 to 2011
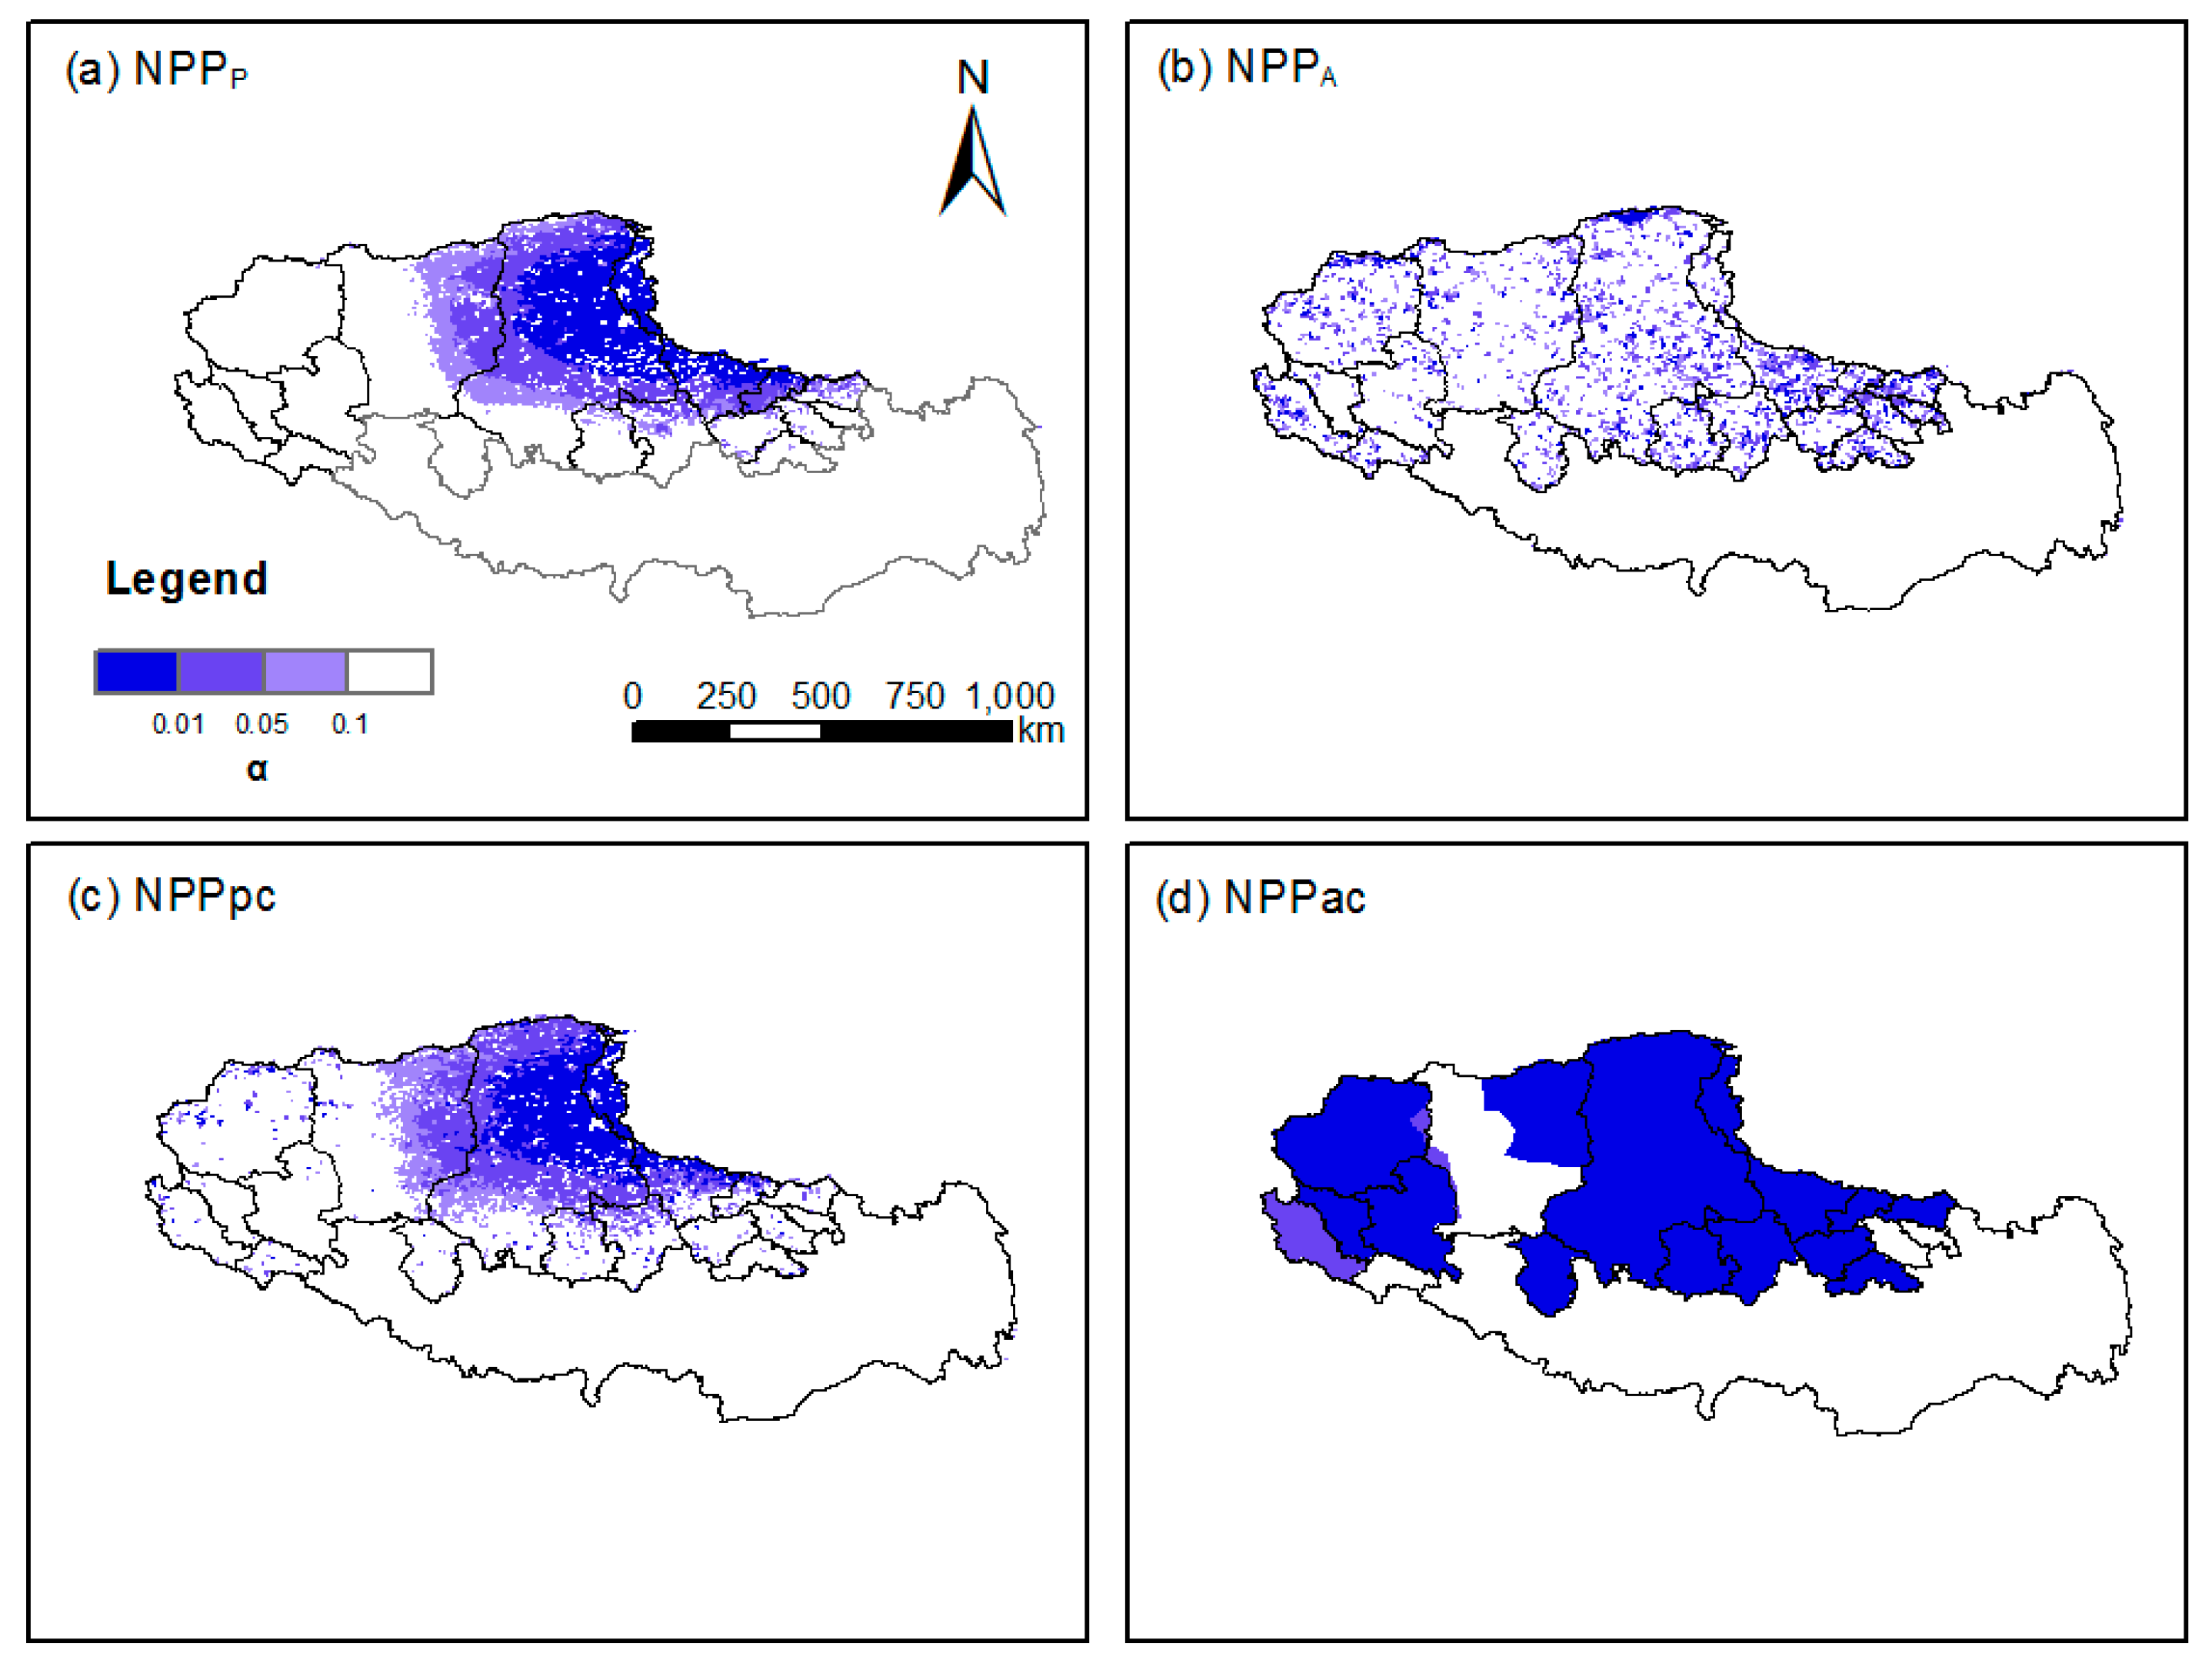
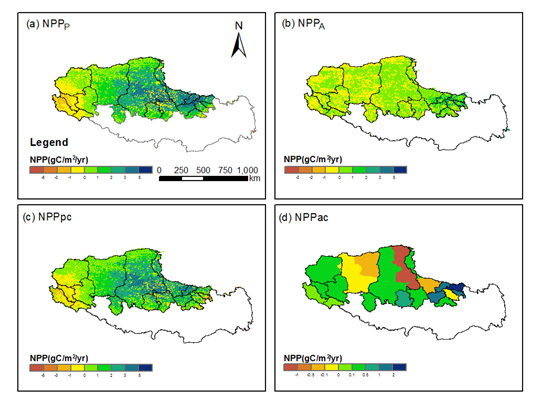
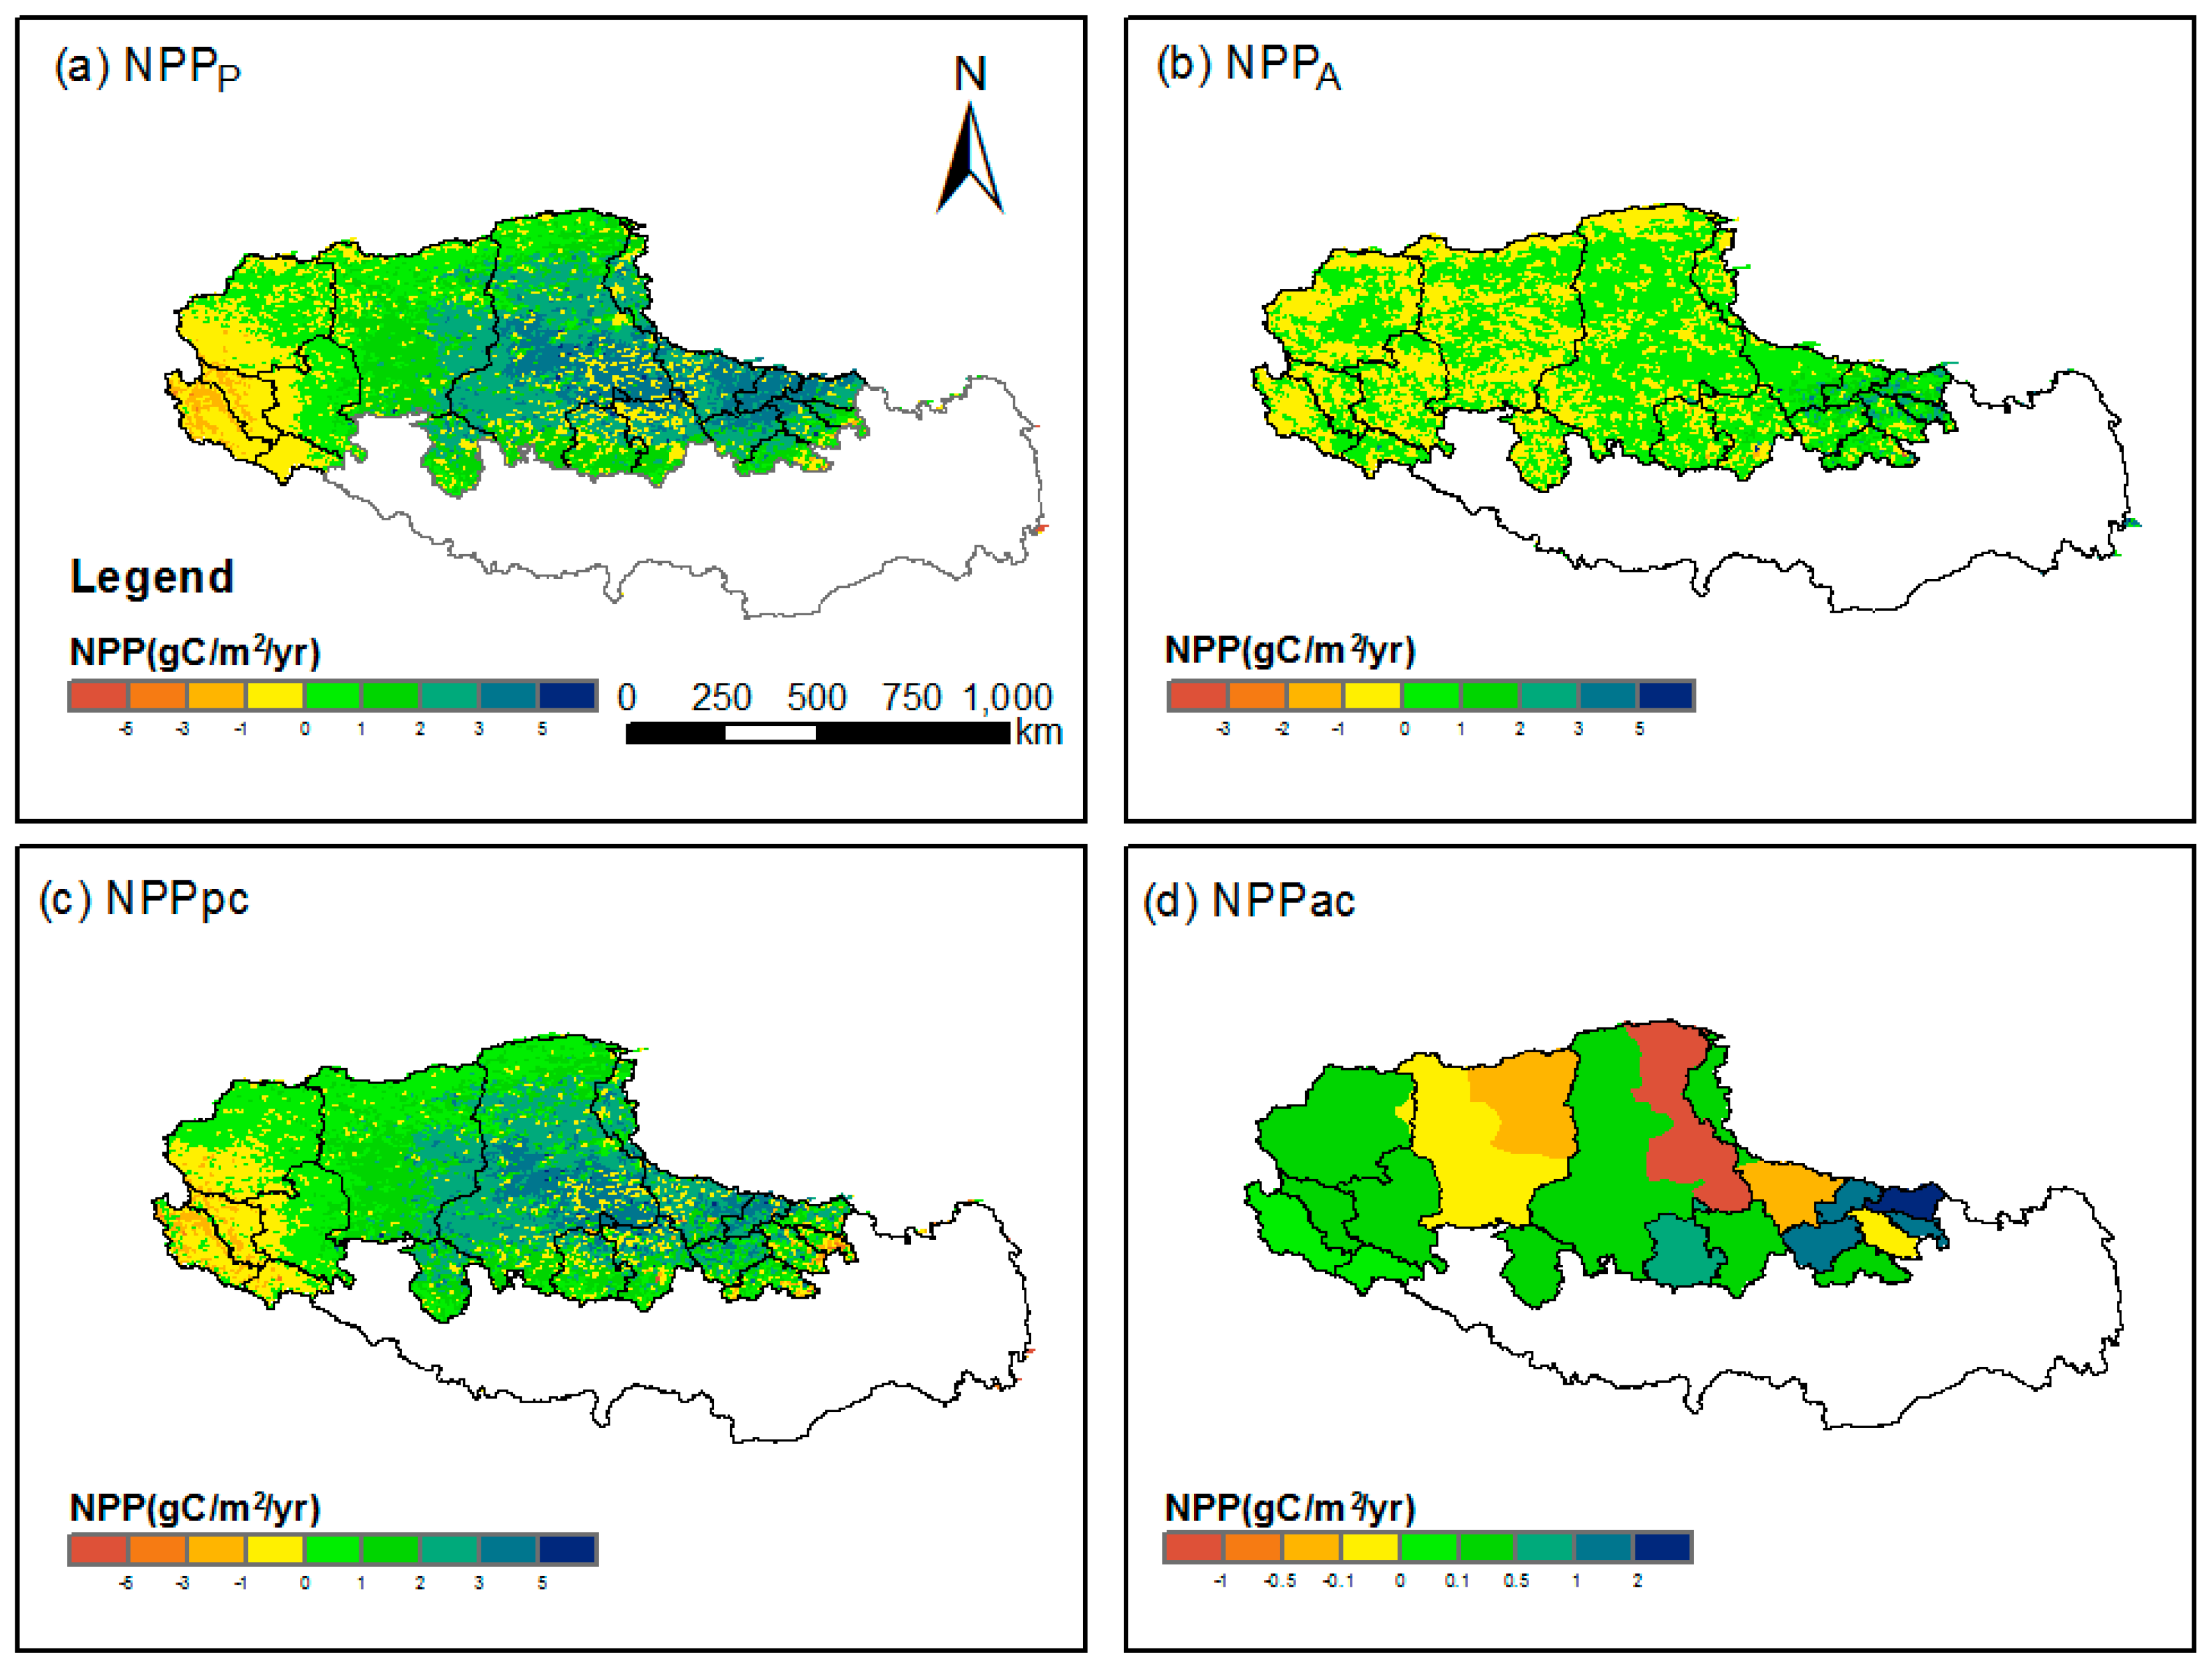
3.2. Trends of Simulated and Consumed Productivity from 1993 to 2011
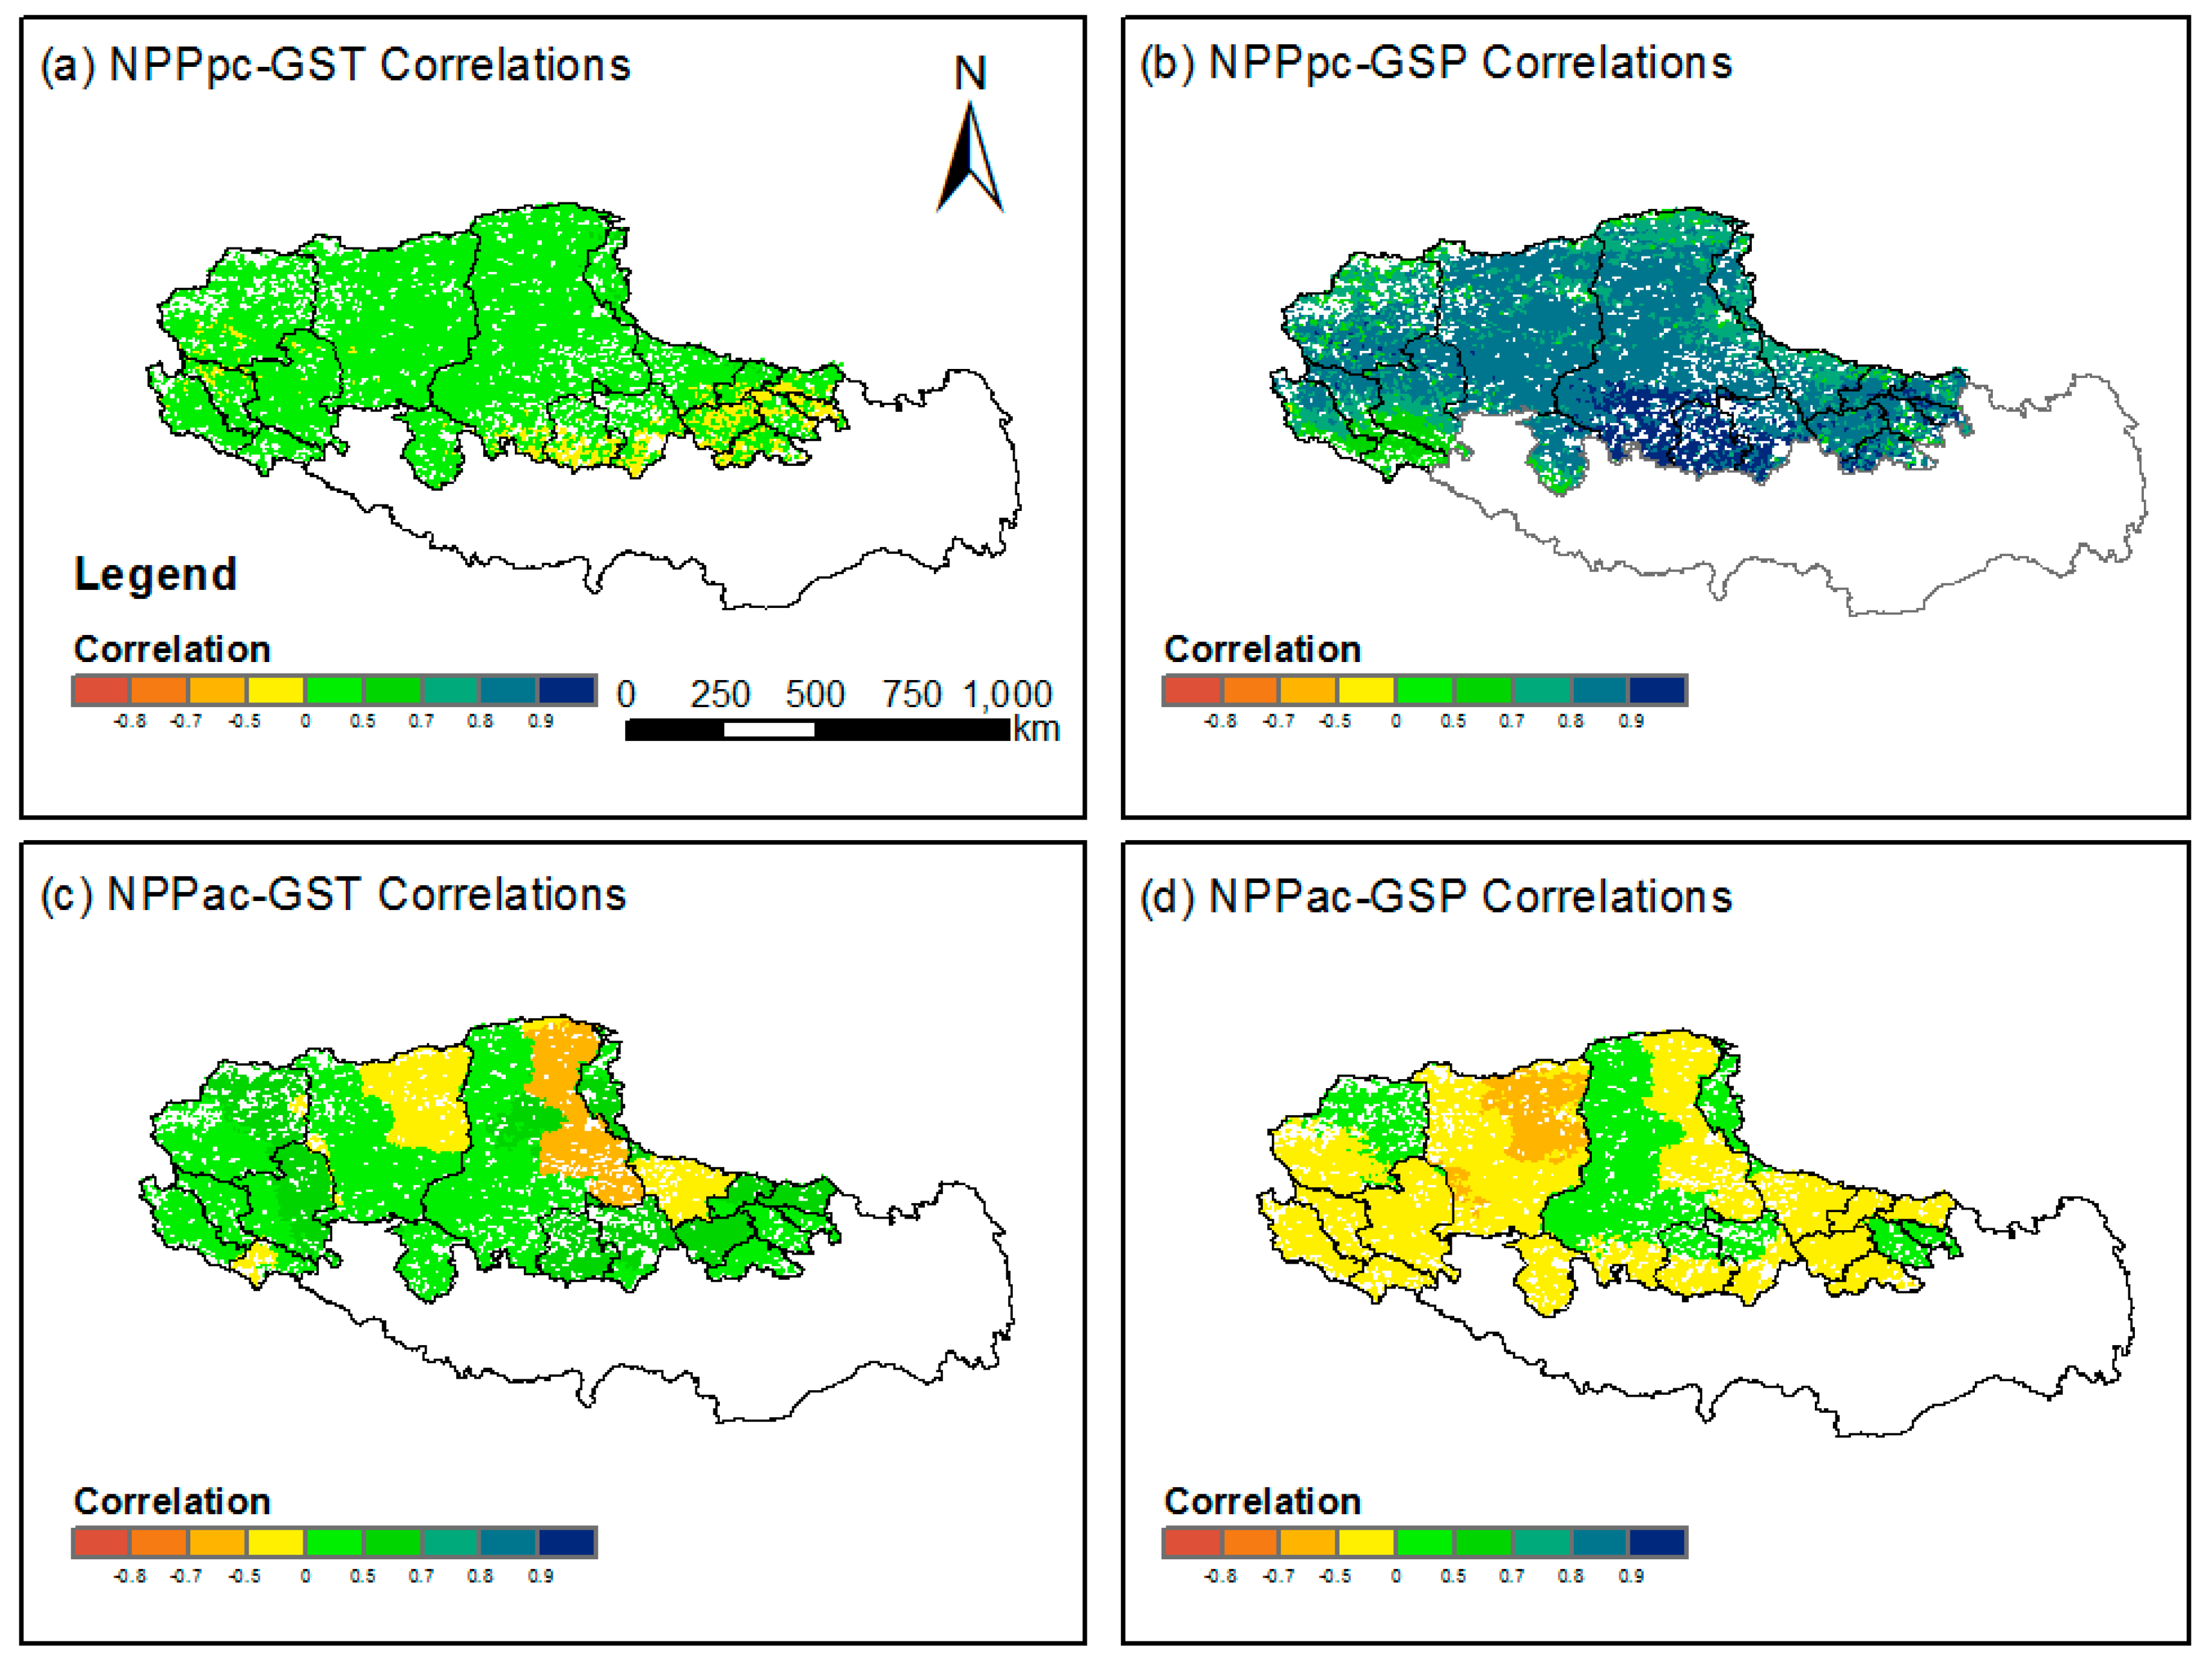
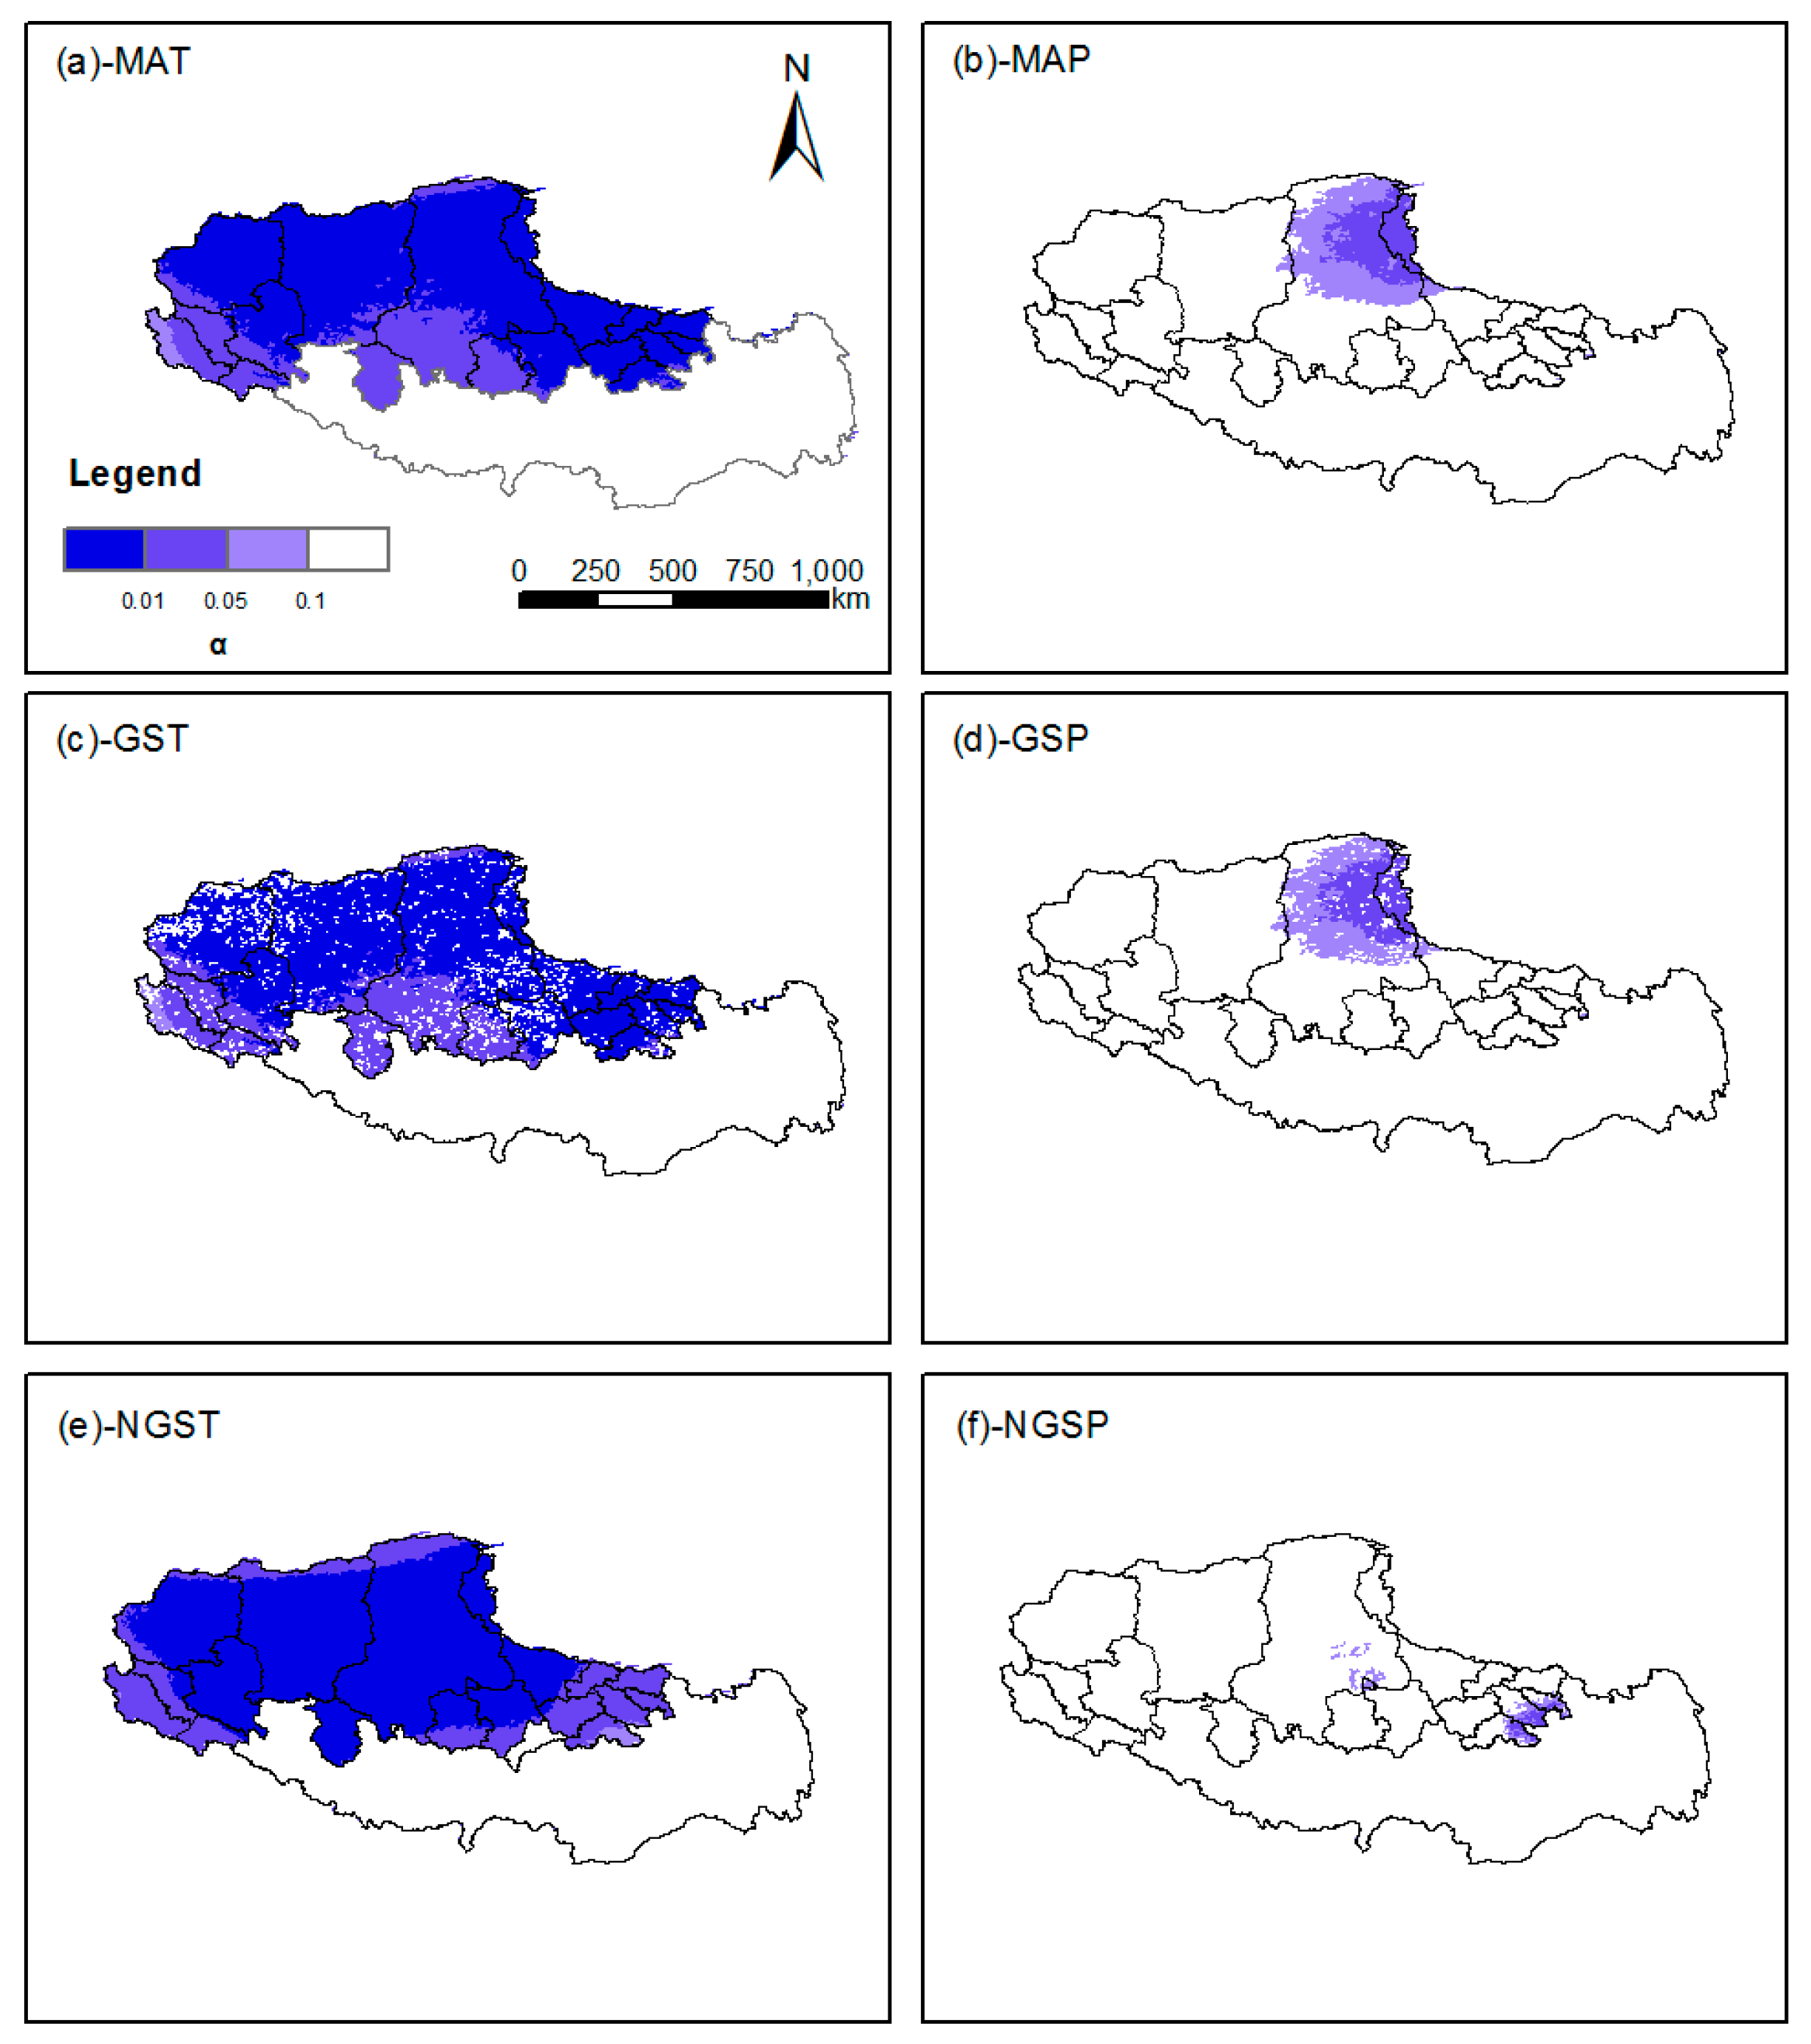
3.3. Correlations of Actual and Potential Productivity with Climate from 1993 to 2011
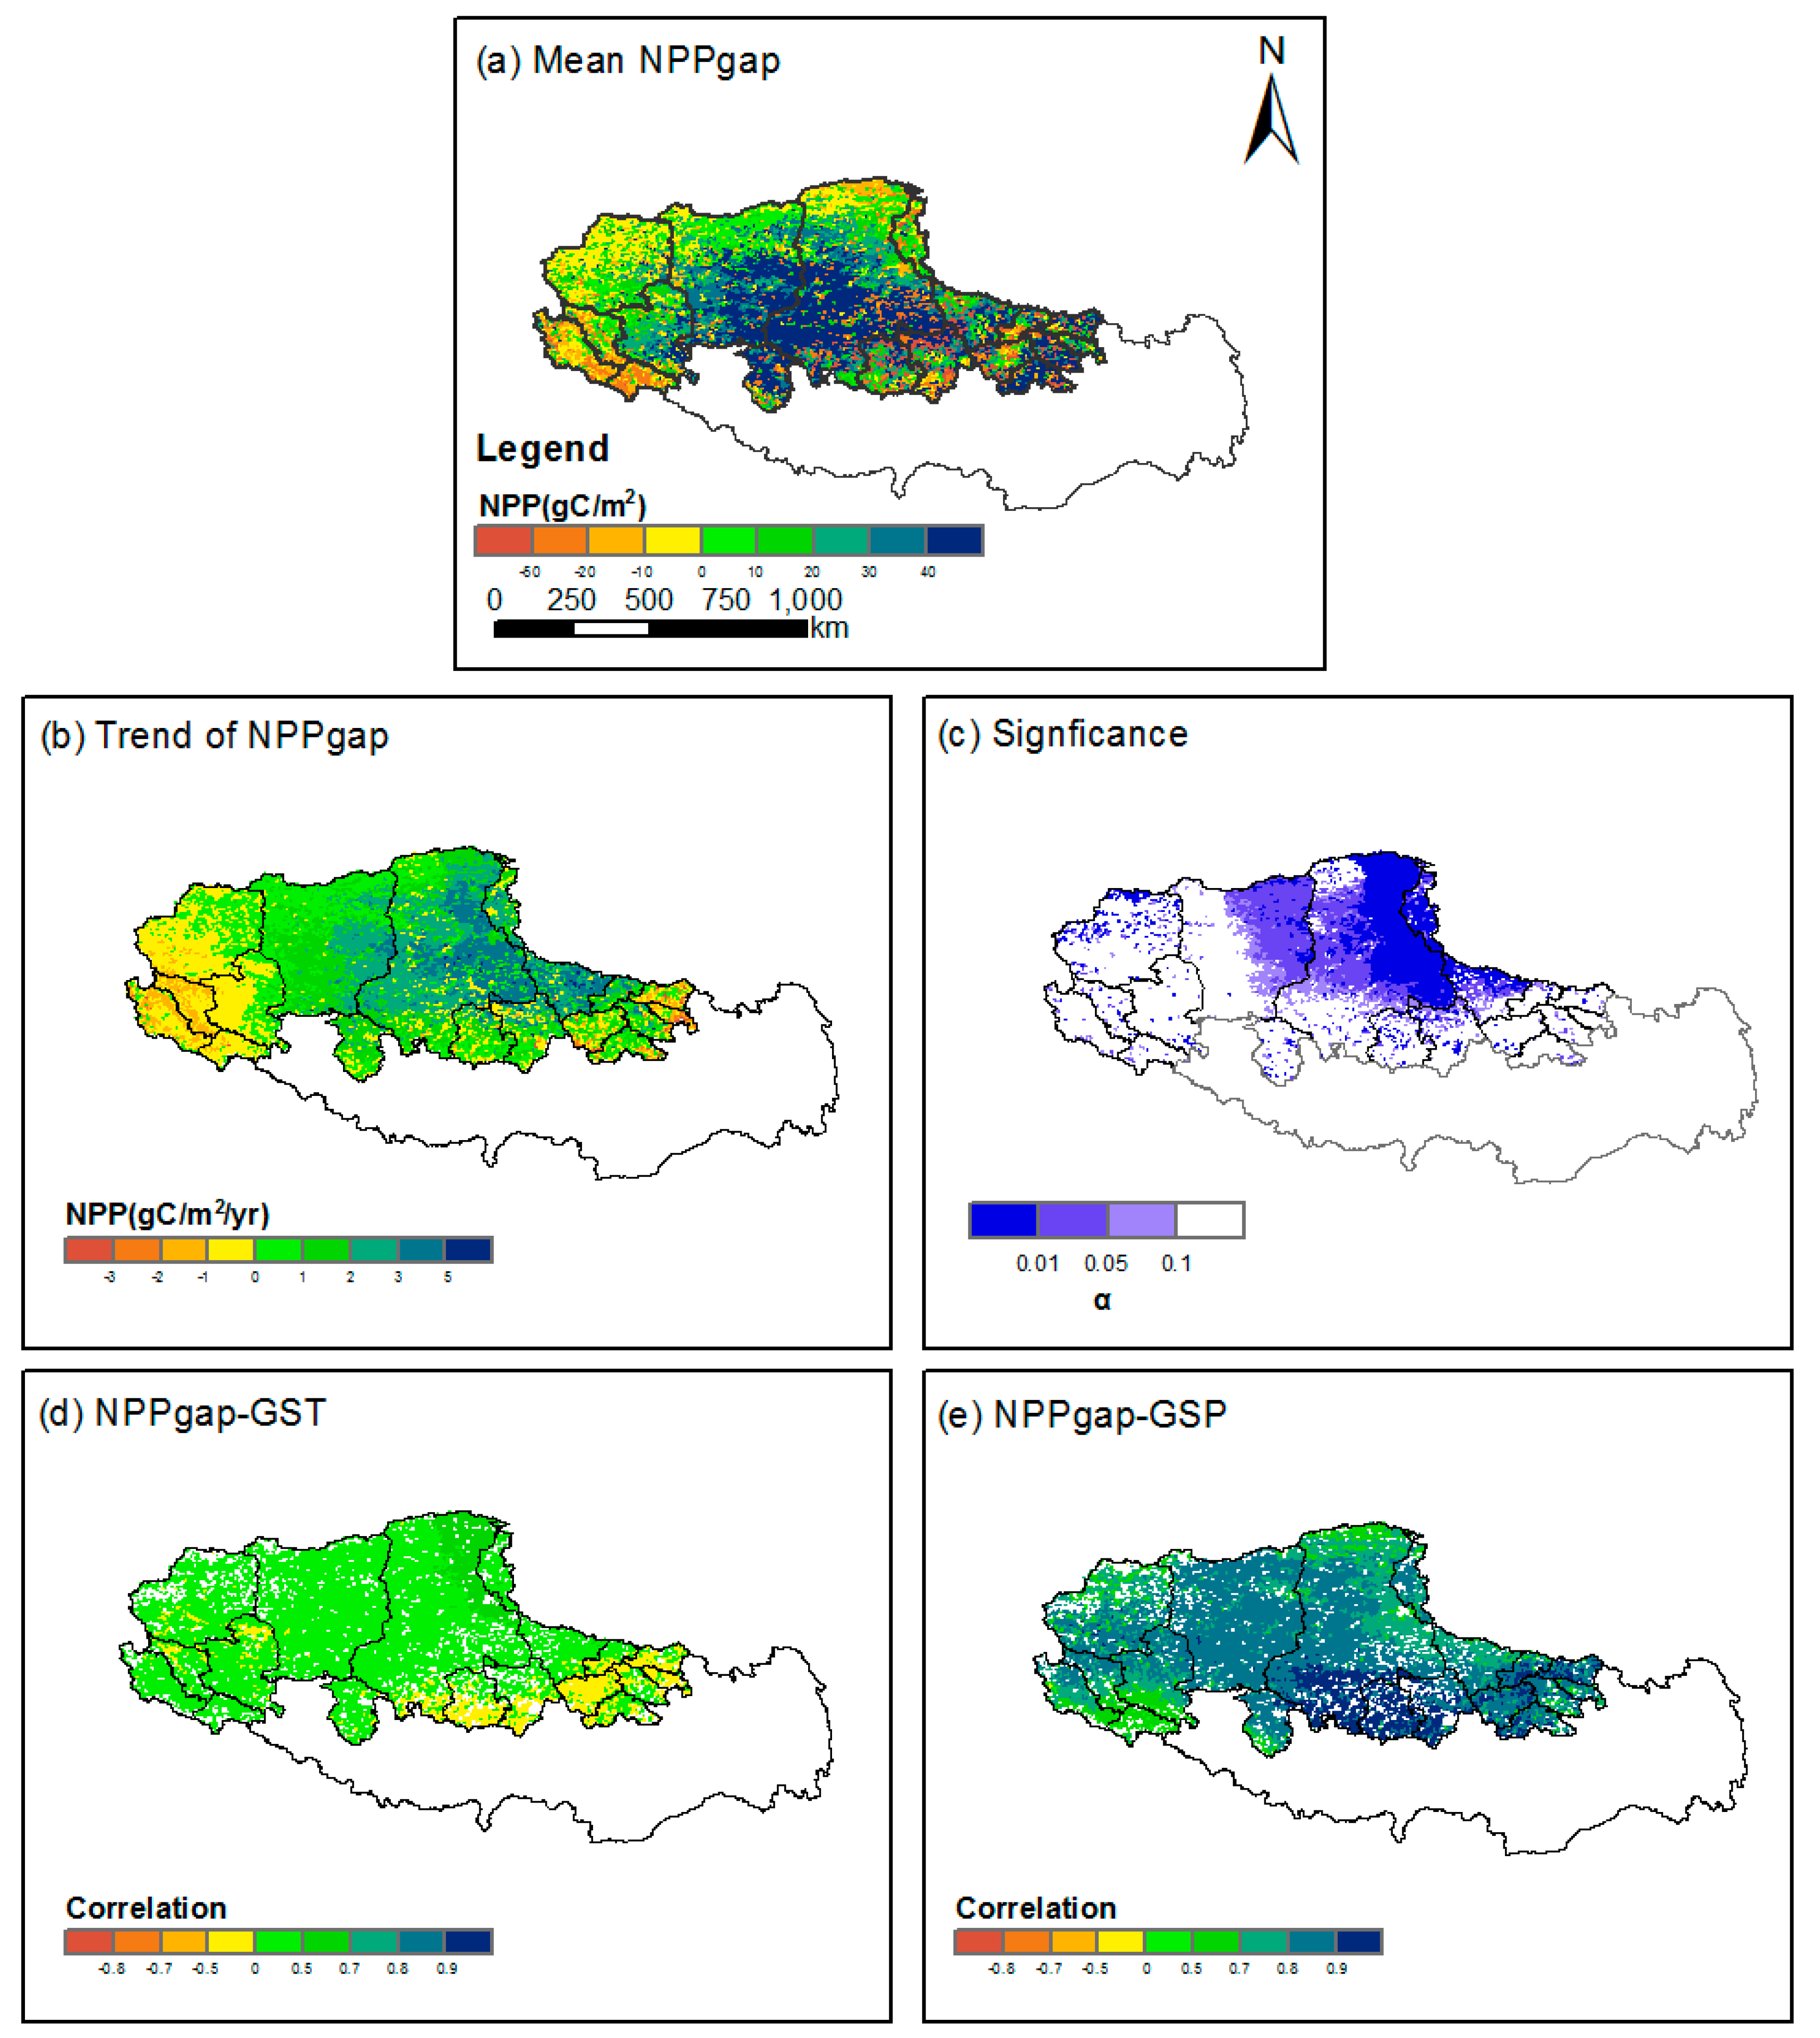
3.4. Trend, Significance and Climatic Dependency of NPPgap from 1993 to 2011
4. Discussion
5. Conclusions
Supplementary Materials
Acknowledgments
Author Contributions
Conflicts of Interest
Appendix A
References
- Wang, X.X.; Dong, S.K.; Yang, B.; Li, Y.Y.; Su, X.K. The effects of grassland degradation on plant diversity, primary productivity, and soil fertility in the alpine region of Asia’s headwaters. Environ. Monit. Assess. 2014, 186, 6903–6917. [Google Scholar] [CrossRef] [PubMed]
- Cai, X.B.; Peng, Y.L.; Yang, M.N.; Zhang, T.; Zhang, Q. Grassland degradation decrease the diversity of Arbuscular mycorrhizal fungi species in Tibet plateau. Not. Bot. Horti Agrobot. 2014, 42, 333–339. [Google Scholar] [CrossRef]
- Wen, L.; Dong, S.K.; Li, Y.Y.; Li, X.Y.; Shi, J.J.; Wang, Y.L.; Liu, D.M.; Ma, Y.S. Effect of degradation intensity on grassland ecosystem services in the alpine region of Qinghai-Tibetan plateau, China. PLoS ONE 2013, 8, e58432. [Google Scholar] [CrossRef] [PubMed]
- Harris, R.B. Rangeland degradation on the Qinghai-Tibetan plateau: A review of the evidence of its magnitude and causes. J. Arid Environ. 2010, 74, 1–12. [Google Scholar] [CrossRef]
- Yao, T.; Thompson, L.G.; Mosbrugger, V.; Zhang, F.; Ma, Y.; Luo, T.; Xu, B.; Yang, X.; Joswiak, D.R.; Wang, W.; et al. Third pole environment (TPE). Environ. Dev. 2012, 3, 52–64. [Google Scholar] [CrossRef]
- Yu, C.Q.; Zhang, Y.J.; Claus, H.; Zeng, R.; Zhang, X.Z.; Wang, J.S. Ecological and environmental issues faced by a developing Tibet. Environ. Sci. Technol. 2012, 46, 1979–1980. [Google Scholar] [CrossRef] [PubMed]
- Xu, X.D.; Lu, C.G.; Shi, X.H.; Gao, S.T. World water tower: An atmospheric perspective. Geophys. Res. Lett. 2008, 35, L20815. [Google Scholar] [CrossRef]
- Chen, B.X.; Zhang, X.Z.; Tao, J.; Wu, J.S.; Wang, J.S.; Shi, P.L.; Zhang, Y.J.; Yu, C.Q. The impact of climate change and anthropogenic activities on alpine grassland over the Qinghai-Tibet plateau. Agric. For. Meteorol. 2014, 189, 11–18. [Google Scholar] [CrossRef]
- Shen, M.; Piao, S.; Cong, N.; Zhang, G.; Jassens, I.A. Precipitation impacts on vegetation spring phenology on the Tibetan plateau. Glob. Chang. Biol. 2015, 21, 3647–3656. [Google Scholar] [CrossRef] [PubMed]
- Lehnert, L.W.; Wesche, K.; Trachte, K.; Reudenbach, C.; Bendix, J. Climate variability rather than overstocking causes recent large scale cover changes of Tibetan pastures. Sci. Rep. 2016, 6, 24367. [Google Scholar] [CrossRef] [PubMed]
- Shi, Y.; Wang, Y.; Ma, Y.; Ma, W.; Liang, C.; Flynn, D.F.B.; Schmid, B.; Fang, J.; He, J.S. Field-based observations of regional-scale, temporal variation in net primary production in Tibetan alpine grasslands. Biogeosciences 2014, 11, 2003–2016. [Google Scholar] [CrossRef] [Green Version]
- Harris, R.B.; Wenying, W.; Badinqiuying; Smith, A.T.; Bedunah, D.J. Herbivory and competition of Tibetan steppe vegetation in winter pasture: Effects of livestock exclosure and plateau Pika reduction. PLoS ONE 2015, 10, e0132897. [Google Scholar]
- Wu, J.S.; Zhang, X.Z.; Shen, Z.X.; Shi, P.L.; Yu, C.Q.; Chen, B.X. Effects of livestock exclusion and climate change on aboveground biomass accumulation in alpine pastures across the northern Tibetan plateau. Chin. Sci. Bull. 2014, 59, 4332–4340. [Google Scholar] [CrossRef]
- Connell, J.H. Diversity in tropical rain forests and coral reefs. High diversity of trees and corals is maintained only in a nonequilibrium state. Science 1978, 199, 1302–1310. [Google Scholar] [CrossRef] [PubMed]
- Wilkinson, D.M. The disturbing history of intermediate disturbance. OIKOS 1999, 84, 145–147. [Google Scholar] [CrossRef]
- Wessels, K.J.; Prince, S.D.; Reshef, I. Mapping land degradation by comparison of vegetation production to spatially derived estimates of potential production. J. Arid Environ. 2008, 72, 1940–1949. [Google Scholar] [CrossRef]
- Banegas, N.; Albanesi, A.; Pedraza, R.; Dos Santos, D. Non-linear dynamics of litter decomposition under different grazing management regimes. Plant Soil 2015, 393, 47–56. [Google Scholar] [CrossRef]
- Tian, D.; Niu, S.; Pan, Q.; Ren, T.; Chen, S.; Bai, Y.; Han, X. Nonlinear responses of ecosystem carbon fluxes and water-use efficiency to nitrogen addition in Inner Mongolia grassland. Funct. Ecol. 2016, 30, 490–499. [Google Scholar] [CrossRef]
- Wu, J.; Yang, P.; Zhang, X.; Shen, Z.; Yu, C. Spatial and climatic patterns of the relative abundance of poisonous vs. Non-poisonous plants across the northern Tibetan plateau. Environ. Monit. Assess. 2015, 187, 491. [Google Scholar] [CrossRef] [PubMed]
- Wang, Z.; Zhang, Y.; Yang, Y.; Zhou, W.; Gang, C.; Zhang, Y.; Li, J.; An, R.; Wang, K.; Odeh, I.; et al. Quantitative assess the driving forces on the grassland degradation in the Qinghai–Tibet plateau, in China. Ecol. Inf. 2016, 33, 32–44. [Google Scholar] [CrossRef]
- Pan, Y.; Yu, C.; Zhang, X.; Chen, B.; Wu, J.; Tu, Y.; Miao, Y.; Luo, L. A modified framework for the regional assessment of climate and human impacts on net primary productivity. Ecol. Indic. 2016, 60, 184–191. [Google Scholar] [CrossRef]
- Tibet Autonomous Region Bureau of Statistics. Tibet Statistical Yearbook; China Statistics Press: Beijing, China, 1993–2011.
- Li, X.J.; Zhang, X.Z.; Wu, J.S.; Shen, Z.X.; Zhang, Y.J.; Xu, X.L.; Fan, Y.Z.; Zhao, Y.P.; Yan, W. Root biomass distribution in alpine ecosystems of the northern Tibetan plateau. Environ. Earth Sci. 2011, 64, 1911–1919. [Google Scholar] [CrossRef]
- Wu, J.S.; Zhang, X.Z.; Shen, Z.X.; Shi, P.L.; Xu, X.L.; Li, X.J. Grazing-exclusion effects on aboveground biomass and water-use efficiency of alpine grasslands on the northern Tibetan plateau. Rangel. Ecol. Manag. 2013, 66, 454–461. [Google Scholar] [CrossRef]
- Zeng, C.; Wu, J.; Zhang, X. Effects of grazing on above- vs. Below-ground biomass allocation of alpine grasslands on the northern Tibetan plateau. PLoS ONE 2015, 10, e0135173. [Google Scholar] [CrossRef] [PubMed]
- Kattge, J.; Diaz, S.; Lavorel, S.; Prentice, C.; Leadley, P.; Bonisch, G.; Garnier, E.; Westoby, M.; Reich, P.B.; Wright, I.J.; et al. Try - a global database of plant traits. Glob. Chang. Biol. 2011, 17, 2905–2935. [Google Scholar] [CrossRef] [Green Version]
- Ministry of Agriculture of the People’s Republic of China. Calculation of Proper Carrying Capacity of Rangelands; Ny/t 635–2002; China Zhijian Publishing House: Beijing, China, 2002.
- Pan, Y.; Wu, J.; Xu, Z. Analysis of the tradeoffs between provisioning and regulating services from the perspective of varied share of net primary production in an alpine grassland ecosystem. Ecol. Complex. 2014, 17, 79–86. [Google Scholar] [CrossRef]
- Hutchinson, M. Anusplin Version 4.3; Centre for Resource and Environment Studies, The Australian National University: Canberra, Australia, 2004. [Google Scholar]
- Tao, J.; Zhang, Y.J.; Dong, J.W.; Fu, Y.; Zhu, J.T.; Zhang, G.L.; Jiang, Y.B.; Tian, L.; Zhang, X.Z.; Zhang, T.; et al. Elevation-dependent relationships between climate change and grassland vegetation variation across the Qinghai-Xizang plateau. Int. J. Climatol. 2015, 35, 1638–1647. [Google Scholar] [CrossRef]
- Zhang, X.; Lu, X.; Wang, X. Spatial-temporal ndvi variation of different alpine grassland classes and groups in northern Tibet from 2000 to 2013. Mt. Res. Dev. 2015, 35, 254–263. [Google Scholar] [CrossRef]
- Zhang, Y.; Hu, Z.; Qi, W.; Wu, X.; Bai, W.; Li, L.; Ding, M.; Liu, L.; Wang, Z.; Zheng, D. Assessment of effectiveness of nature reserves on the Tibetan plateau based on net primary production and the large sample comparison method. J. Geogr. Sci. 2016, 26, 27–44. [Google Scholar] [CrossRef]
- Yu, C.; Zhang, X.; Zhang, J.; Li, S.; Song, C.; Fang, Y.; Wurst, S.; Wu, J. Grazing exclusion to recover degraded alpine pastures needs scientific assessments across the northern Tibetan plateau. Sustainability 2016, 8, 1162. [Google Scholar] [CrossRef]
- Wessels, K.J.; Prince, S.D.; Frost, P.E.; van Zyl, D. Assessing the effects of human-induced land degradation in the former homelands of northern South Africa with a 1 km AVHRR NDVI time-series. Remote Sens. Environ. 2004, 91, 47–67. [Google Scholar] [CrossRef]
- Li, A.; Wu, J.; Huang, J. Distinguishing between human-induced and climate-driven vegetation changes: A critical application of restrend in Inner Mongolia. Landsc. Ecol. 2012, 27, 969–982. [Google Scholar] [CrossRef]
- Wu, J.S.; Shen, Z.X.; Zhang, X.Z. Precipitation and species composition primarily determine the diversity-productivity relationship of alpine grasslands on the northern Tibetan plateau. Alp. Bot. 2014, 124, 13–25. [Google Scholar] [CrossRef]
- Wu, J.; Wurst, S.; Zhang, X. Plant functional trait diversity regulates the nonlinear response of productivity to regional climate change in Tibetan alpine grasslands. Sci. Rep. 2016, 6, 35649. [Google Scholar] [CrossRef] [PubMed]
- Piao, S.; Cui, M.; Chen, A.; Wang, X.; Ciais, P.; Liu, J.; Tang, Y. Altitude and temperature dependence of change in the spring vegetation green-up date from 1982 to 2006 in the Qinghai-Xizang plateau. Agric. For. Meteorol. 2011, 151, 1599–1608. [Google Scholar] [CrossRef]
- Qiu, J. The third pole. Nature 2008, 454, 393–396. [Google Scholar] [CrossRef] [PubMed]
- Li, S.; Wu, J. Community assembly and functional leaf traits mediate precipitation use efficiency of alpine grasslands along environmental gradients on the Tibetan plateau. PeerJ 2016, 4, e2680. [Google Scholar] [CrossRef] [PubMed]
- Liang, T.; Yang, S.; Feng, Q.; Liu, B.; Zhang, R.; Huang, X.; Xie, H. Multi-factor modeling of above-ground biomass in alpine grassland: A case study in the Three-River Headwaters region, China. Remote Sens. Environ. 2016, 186, 164–172. [Google Scholar] [CrossRef]


| Acronym | Definition |
|---|---|
| NPP | net primary productivity |
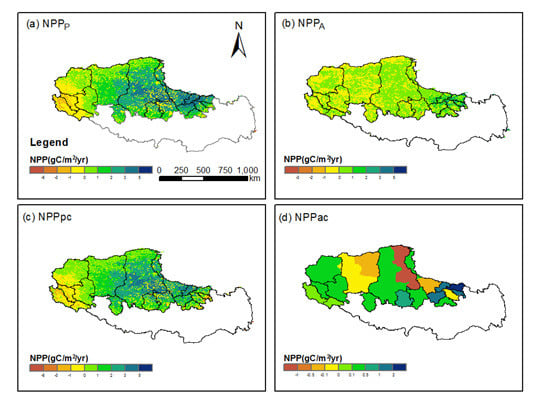
| NPPP | potential net primary productivity, only driven by climatic factors in each grassland type |
| NPPA | actual net primary productivity, driven by climatic factors and vegetation index livestock grazing in each grassland type |
| NPPpc | defined as NPPP-NPPA, the proportion of grassland productivity that can be potentially consumed by livestock |
| NPPac | the proportion of grassland productivity that has been consumed by livestock. It can be estimated from forage consumed by livestock for body growth and meat output |
| NPPgap | defined as NPPpc-NPPac. Nine scenarios of the mean and the trend of NPPgap were summarized in Table 2 |
| Mean | Trend | Vegetation Status | Current stocking rate | Future stocking rate |
|---|---|---|---|---|
| =0 | >0 | Healthy | Reasonable | Can be increased |
| =0 | Healthy & stable | Reasonable | No regulation | |
| <0 | Healthy | Reasonable | Need to be reduced | |
| >0 | >0 | Restored | Low | Should be increased |
| =0 | Restored & stable | Low | No regulation | |
| <0 | Restored | Low | Must not be increased | |
| <0 | >0 | Degraded | Overgrazed | Should be reduced |
| =0 | Degraded &stable | Overgrazed | Must be reduced |
| Mean | Trend | The Target Area (km2) | The Percentage (%) |
|---|---|---|---|
| =0 | >0 | 0 | 0 |
| =0 | 0 | 0 | |
| <0 | 0 | 0 | |
| >0 | >0 | 405,349 | 58.74 |
| =0 | 0 | 0 | |
| <0 | 71,162 | 10.31 | |
| <0 | >0 | 91,648 | 13.28 |
| =0 | 0 | 0 | |
| <0 | 112,974 | 16.37 |
© 2017 by the authors. Licensee MDPI, Basel, Switzerland. This article is an open access article distributed under the terms and conditions of the Creative Commons Attribution (CC BY) license ( http://creativecommons.org/licenses/by/4.0/).
Share and Cite
Feng, Y.; Wu, J.; Zhang, J.; Zhang, X.; Song, C. Identifying the Relative Contributions of Climate and Grazing to Both Direction and Magnitude of Alpine Grassland Productivity Dynamics from 1993 to 2011 on the Northern Tibetan Plateau. Remote Sens. 2017, 9, 136. https://doi.org/10.3390/rs9020136
Feng Y, Wu J, Zhang J, Zhang X, Song C. Identifying the Relative Contributions of Climate and Grazing to Both Direction and Magnitude of Alpine Grassland Productivity Dynamics from 1993 to 2011 on the Northern Tibetan Plateau. Remote Sensing. 2017; 9(2):136. https://doi.org/10.3390/rs9020136
Chicago/Turabian StyleFeng, Yunfei, Jianshuang Wu, Jing Zhang, Xianzhou Zhang, and Chunqiao Song. 2017. "Identifying the Relative Contributions of Climate and Grazing to Both Direction and Magnitude of Alpine Grassland Productivity Dynamics from 1993 to 2011 on the Northern Tibetan Plateau" Remote Sensing 9, no. 2: 136. https://doi.org/10.3390/rs9020136