Article

Comparison of Two Simulation Methods of the Temperature Vegetation Dryness Index (TVDI) for Drought Monitoring in Semi-Arid Regions of China

Breeding Base for State Key Laboratory of Land Degradation and Ecological Restoration in Northwest China, Key Laboratory for Restoration and Reconstruction of Degraded Ecosystem in Northwest China of Ministry of Education, Ningxia University, Yinchuan 750021, China
*
Author to whom correspondence should be addressed.
Remote Sens. 2017, 9(2), 177; https://doi.org/10.3390/rs9020177
Submission received: 9 December 2016 / Revised: 20 January 2017 / Accepted: 16 February 2017 / Published: 20 February 2017

Abstract

:
The Temperature Vegetation Dryness Index (TVDI), a drought monitoring index based on an empirical parameterization of the Land Surface Temperature (LST)–Normalized Difference Vegetation Index (NDVI) space, has been widely implemented in a variety of ecosystems worldwide because it does not depend on ancillary data. However, the simulation of dry/wet edges in the TVDI model can be problematic because remote sensing images do not have sufficient pixels to identify the wetness and dryness extremes of different vegetation coverages. In this study, an improvement in dry/wet edge simulation was proposed, and a comparison of the original TVDI and the modified Temperature Vegetation Dryness Index (TVDIm) was performed for drought monitoring in Ningxia Province, which is a typical semi-arid region in China. First, the difference between the land surface temperatures in day and night (∆LST) was used as an alternative to LST when building the TVDIm model. In addition, the wet edges were improved by removing outliers using a statistical method, and the dry edges were optimized by removing the “tail down” points in the NDVI range of 0.0–0.1. Here, the modeling process of TVDIm in 2005, one of recent extreme drought year is illustrated. The results show that both the TVDI and TVDIm can be used to monitor the temporal and spatial variations of drought, and the onset, duration, extent, and severity of drought can be reflected by TVDI and TVDIm maps. However, the magnitude of TVDI is higher than that of TVDIm, which could cause the TVDI-simulated drought condition to be elevated in normal years and underestimated in dry years. The TVDIm has higher coefficients of correlation with in situ meteorological drought index and agricultural drought statistical data than does the original TVDI, and it exhibits better performance in drought monitoring compared to that of the original TVDI in semi-arid regions of China.

Graphical Abstract

1. Introduction

Drought is a weather-related natural phenomenon that can cause serious environmental, social, and economic consequences worldwide [1]. It is also considered an insidious natural hazard and ranks first among all natural hazards in terms of the number of people affected [2]. The typical definition of drought is a period with a precipitation deficit that influences agriculture, water resources, and natural ecosystems [3]. However, precisely defining a drought is difficult because of the differences in hydrometeorological variables and socioeconomic factors, as well as the stochastic nature of water demands in different regions around the world [4]. However, according to the variables used to describe drought, it is classified into four categories (meteorological, agricultural, hydrological, and socioeconomic droughts) by the American Meteorological Society [4,5]. Because its definition is context-dependent, drought monitoring has always been a challenge worldwide, and scientists have made considerable efforts to develop drought indices from different perspectives [1,4,6]. As there is no uniquely accepted definition of a drought, there is also no universal drought index. A number of different drought indices were developed during the 20th century in the domains of meteorology, hydrology, agriculture, remote sensing, and water resources management [7]. They include the Palmer Drought Severity Index (PDSI) [8], the Standardized Precipitation Index (SPI) [9,10], the Standardized Precipitation Evapotranspiration Index (SPEI) [3,11], etc., calculated by in situ meteorological data from weather stations, the Vegetation Condition Index (VCI) [12,13], the Temperature Condition Index (TCI) [14], vegetation health indices (VHIs) [15], etc. derived from the optical and thermal channels of remote sensing sensors. Although in situ drought indices can be interpolated into spatial data using techniques such as Inverse Distance Weighting (IDW) or Ordinary Kriging, their accuracy and level of spatial detail are functions of the density and distribution of the station network [16], limiting their application on a regional scale. However, advances in earth observation technology, particularly over the past two decades, have demonstrated that remote sensing-based drought indices are more appropriate for large-scale drought monitoring in terms of the moisture content in the top few centimeters of the soil [17]. A variety of techniques, including optical and thermal infrared remote sensing, active and passive microwave domains, and assimilation or synergistic approaches, have been employed to retrieve soil moisture content in a range of global ecosystems [17]. As a simple remote sensing method that was first proposed by Sandholt et al. [18], the Temperature Vegetation Dryness Index (TVDI) has been widely employed to monitor drought in a number of studies [19,20,21,22,23,24].
The TVDI is a contextual method based on an empirical parameterization of the land surface temperature–vegetation index space [23,24]. In higher vegetation coverage areas, the Land Surface Temperature (LST) is sensitive to water stress due to the relationship between canopy temperature and transpiration [22]. Plants close parts of their stomata to reduce transpiration and avoid excessive water loss when the soil moisture decreases and the water supply is insufficient, causing an increase in the canopy temperature [17]. In lower vegetation coverage areas or bare soil, the soil moisture variation determines the LST through evaporative control and thermal inertia [19,25,26]. However, the relationship between LST and soil moisture content is severely affected by the fractional vegetation cover [22]. Thus, the Normalized Difference Vegetation Index (NDVI), which is strongly correlated with the amount of vegetation, was integrated with LST, and the combination can provide more complete information on soil moisture from bare soil to fully vegetated surfaces [19]. The TVDI does not depend on ancillary atmospheric or surface data or any special land surface model, and it is relatively insensitive to atmospheric correction or the choice of ambient atmospheric and surface parameters in the chosen land surface model [27]. Therefore, the data collected by optical and thermal sensors, such as the Moderate Resolution Imaging Spectroradiometer (MODIS) and Advanced High Resolution Radiometer (AVHRR), which have moderate resolutions and frequent repeat intervals [18,22,28], and Landsat TM/ETM+, which has a moderately high resolution and long repeat intervals [29], are optimal for calculating TVDI. The TVDI has been implemented over a variety of ecosystems worldwide, including in tropical monsoon climate regions [22], humid forest-dominated regions [30], and semi-arid regions [31]. It has also been calculated at a variety of temporal resolutions, including daily, eight-day, 16-day, and monthly scales [19,22,29,30,31,32,33,34]. Although the triangle method can be used to monitor land surface moisture and estimate surface evapotranspiration from large image datasets [26,27], the performance of the TVDI is impacted by variations in the spatial domain size [35] and the determination method of dry and wet edges [36]. Therefore, scientists have recently proposed some improved methods. These methods include correcting the effect of topography, incorporating air temperature, enhancing dry/wet edge determination, combining with thermal inertia, etc. [23,24,31,35,36]. The factors that most affect the accuracy of the TVDI were determined and evaluated when the TVDI was used to estimate water deficits [37]. Because the TVDI model is based on the land surface temperature–vegetation index space, correct simulation of dry/wet edges is critical for the performance of the TVDI when used to monitor and assess regional drought situations. However, there is some subjectivity when dry/wet edges are identified because the TVDI model requires that images have sufficient numbers of pixels; thus, the wetness and dryness extremes can be found for different vegetation coverages, spanning from bare soil to dense vegetation [27]. Here, two simulation methods using TVDI are compared for drought monitoring in Ningxia Province, a typical semi-arid region in China, where monitoring drought characteristics is crucial for local agricultural production and ecological construction. In order to limit the length of the paper, the modeling process of TVDIm in 2005, one of the recent extreme drought years, is illustrated in detail.

2. Description of the Study Area and Data
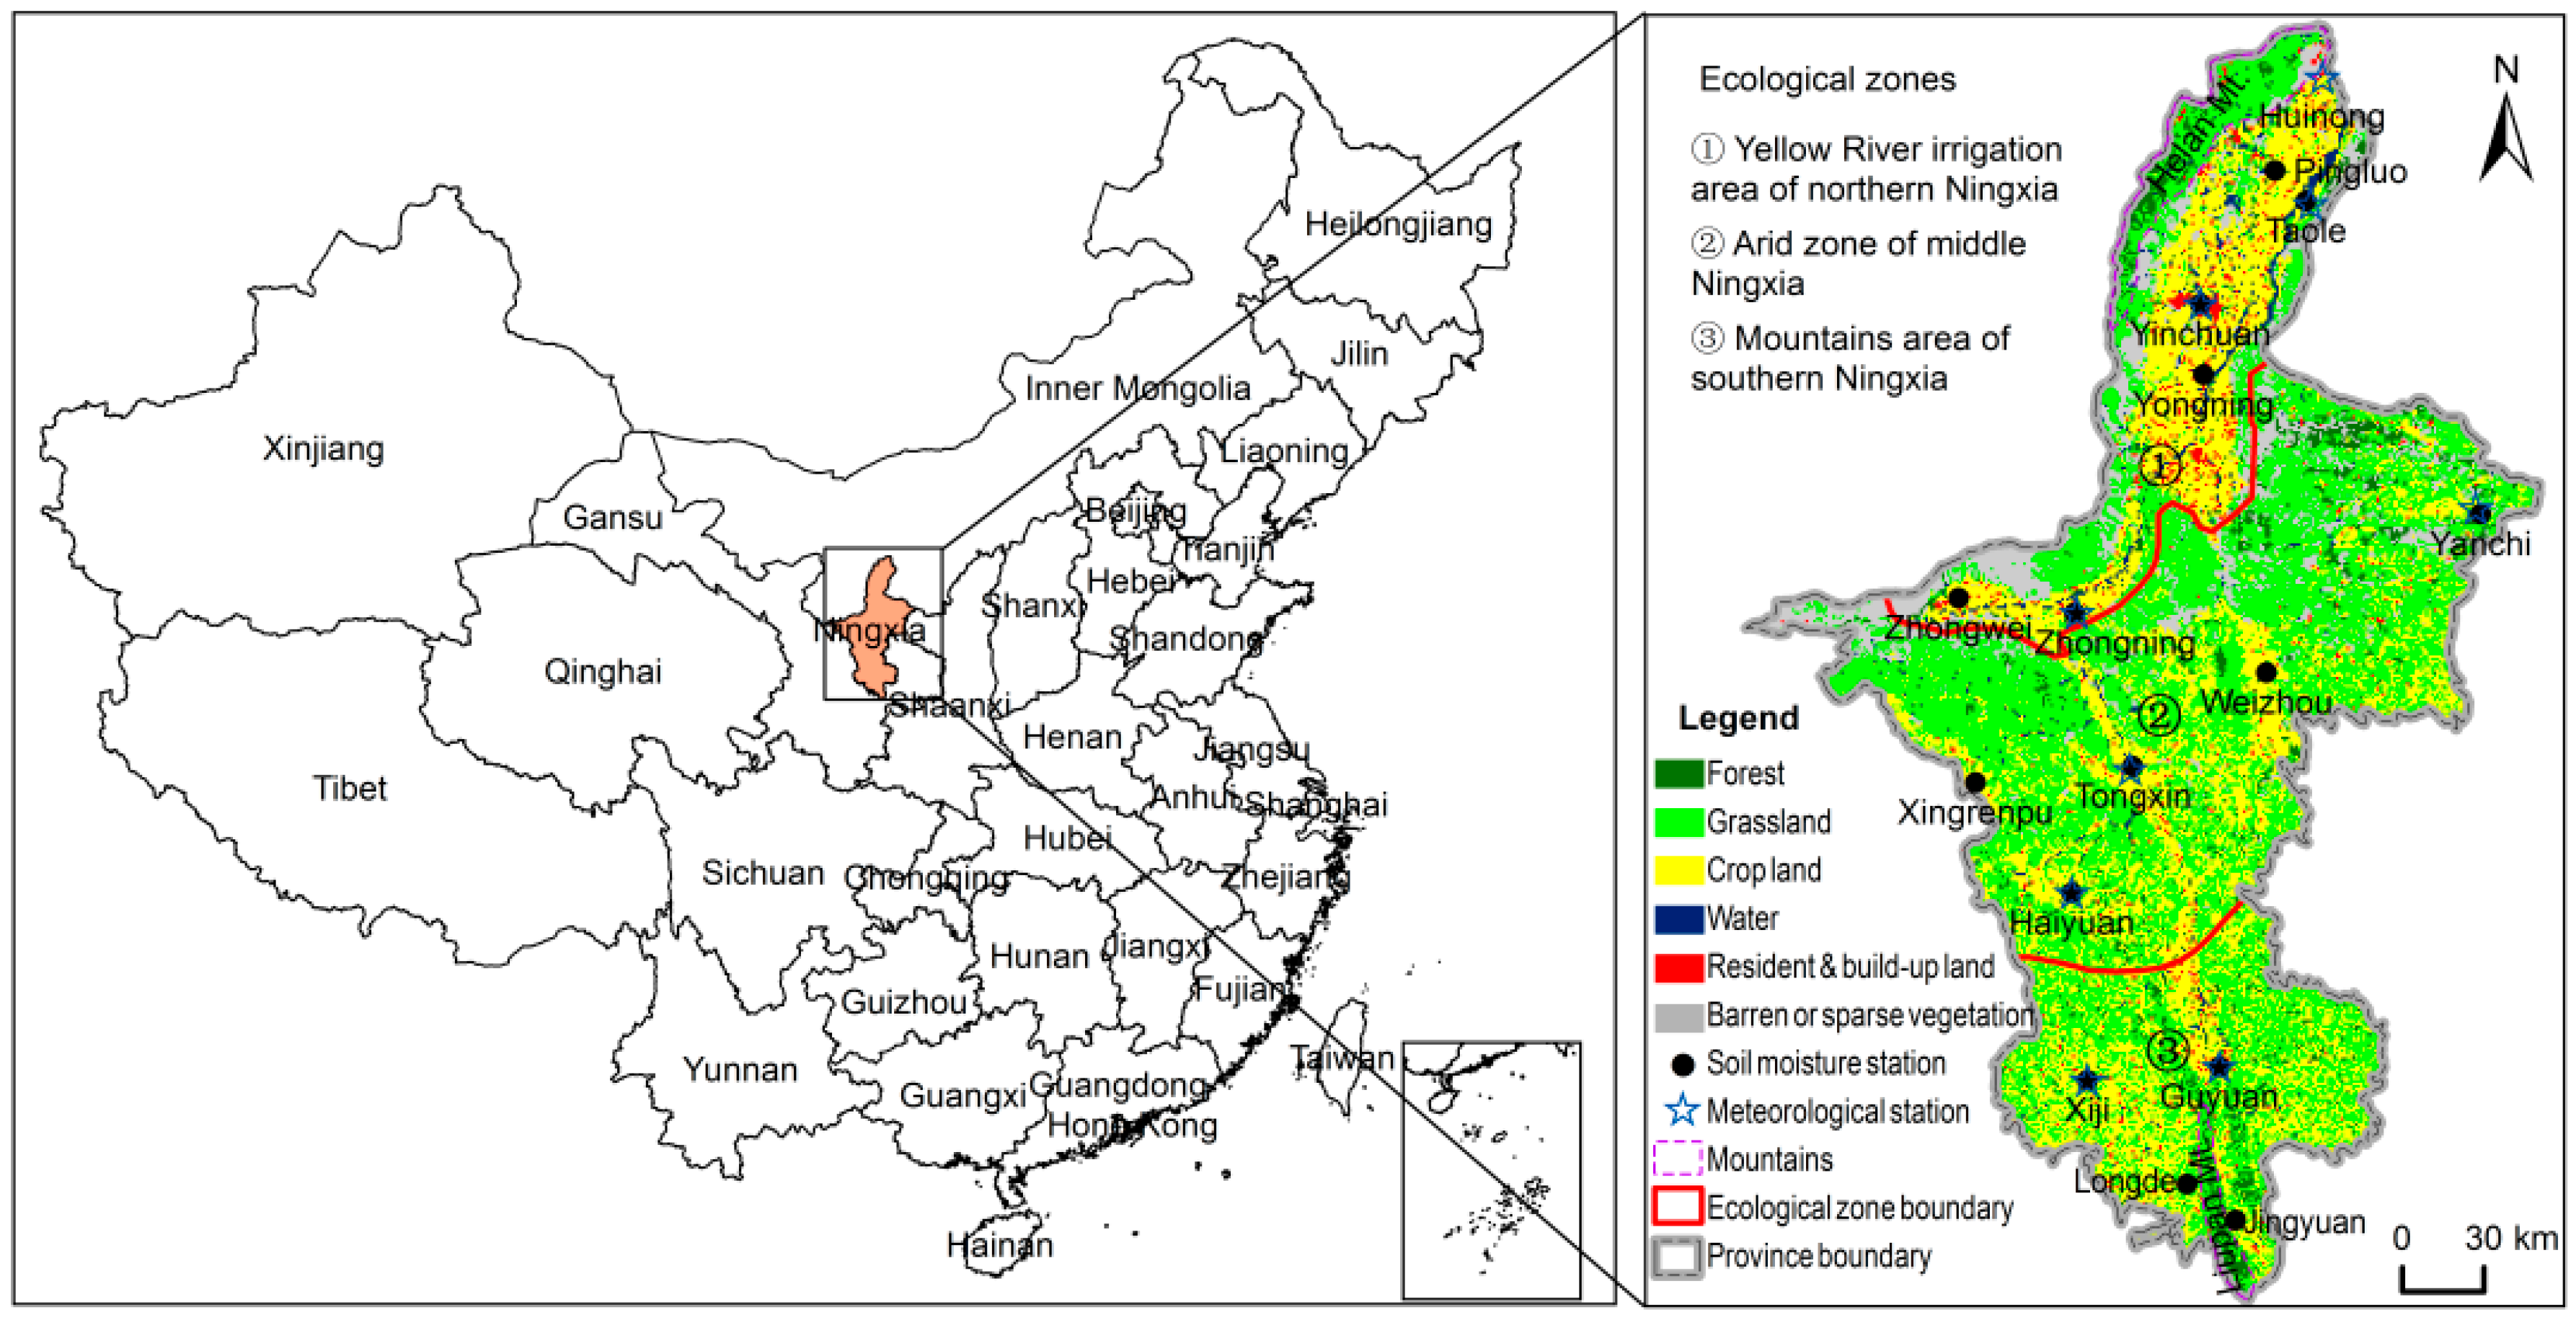
2.1. Study Area

Ningxia Hui Autonomous Region (Ningxia Province) is located in the northwest part of China, with latitude ranging from N 35°14′ to N 39°23′and longitude ranging from E 104°17′ to E 107°39′. Ningxia is one of the smallest provinces in China, and its total area is 5.18 × 10⁴ km2. The province has five prefecture cities (from north to south): Shizuishan, Yinchuan, Wuzhong, Zhongwei, and Guyuan. Stretching from the Helen Mountains in the north to the Liupan Mountains on the Loess Plateau in the south, the province can be divided into three ecological zones (Figure 1). The northern part is the fertile plain of the Yellow River, where the Qin and Han dynasty irrigation channels have been built on a 400-km stretch of the river. The arid zone of the middle Ningxia is a farming-pastoral zone dominated by vast desert steppe and partial rain-fed agriculture. Southern Ningxia is part of the Chinese Loess Plateau, which is famous for its intensive soil erosion due to the specific geographic landscape, soil and climatic conditions, and long history of human activity. The climate of Ningxia Province is typical semi-arid. The annual average temperature is 5–9 °C, and the annual precipitation varies from 200–700 mm between the northern plain and the southern mountainous region. The annual evapotranspiration is approximately 2000 mm, which is much higher than precipitation [38]. Ningxia Province is sensitive to climatic changes as it is a fragile ecosystem suffering from a severe water shortage. Crops are often exposed to water stress during the growing season, which is caused by severe droughts in rain-fed agricultural areas. Frequent drought events have serious negative effects on economic development in this area and have been a major concern of local governments in Ningxia Province [39].

2.2. Remote Sensing Data

2.2.1. Normalized Difference Vegetation Index

Optical satellites use radiometers that measure the reflectance of plants in the visible and near-infrared (NIR) bands. The pigment in plant leaves, chlorophyll, strongly absorbs visible sunlight (from 0.4 to 0.7 µm) for use in photosynthesis, and the cell structures of the leaves strongly reflect near-infrared sunlight (from 0.7 to 1.1 µm). The more leaves a plant has, the more these wavelengths of sunlight are affected. This reflective feature of plants has been used to develop vegetation indices in the remote sensing field. One of the most widely used vegetation indices is the NDVI, which is defined as the ratio of corrected reflectance from the NIR and red channels [40,41]:
N D V I = ( N I R R E D ) / ( N I R + R E D ) .
The NDVI derived from the AVHRR on the National Oceanic and Atmospheric Administration (NOAA)’s polar-orbiting satellite has been used to monitor and evaluate terrestrial vegetation since the early 1980s [42]. Researchers also found that NDVI corresponded to climatic factors, such as precipitation and temperature, and could be used to monitor climatic drought [43,44]. A successor of AVHRR, the MODIS instrument on the Terra satellite was launched in December 1999. MODIS has 36 spectral bands between 0.405 and 14.385 µm. This product is more sensitive than AVHRR data and can be used to produce NDVI imagery at 250, 500, and 1000 m resolutions [1,45]. The MODIS NDVI is referred to as the “continuity index” of the existing NOAA-AVHRR derived NDVI. At the time MODIS was launched, there was a nearly 20-year NDVI global dataset from the NOAA-AVHRR series, which could be extended by MODIS data to provide a long-term data record for use in operational monitoring studies. In this study, the Terra MODIS monthly composite NDVI in China (MODND1M) at 1 km spatial resolution from 2000 to 2010 was downloaded from the Geospatial Data Cloud, Computer Network Information Center, Chinese Academy of Sciences (http://www.gscloud.cn).

2.2.2. Land Surface Temperature

The MODIS LST is created as a sequence of land products, beginning with a swath (scene) and progressing through spatial and temporal transformations to daily, eight-day, and monthly global gridded products using an algorithm developed by Wan et al. [46]. Recently, Terra MODIS daily LST products at a spatial resolution of 1 km (MOD11A1) were reprocessed to monthly composite LST in China (MODLT1M) by the Geospatial Data Cloud, Computer Network Information Center, Chinese Academy of Sciences. The monthly composite LST implements atmospheric corrections for gases, aerosol scattering, and thin cirrus and removes cloud noise effectively. It overcomes the major constraint that daily MODIS land surface temperature data are only available in clear-sky conditions. Here, the monthly composite LST in China (MODLT1M) from 2000 to 2010 was downloaded from the same website as NDVI and masked using the vector data from the study area.

2.2.3. In Situ Data and Agricultural Statistical Data

Monthly precipitation and temperature from 1961 to 2010 were obtained from the China Meteorological Data Sharing Service System of the China Meteorological Administration (http://cdc.cma.gov.cn/index.jsp). In this study area, nine stations were selected, and there are approximately 1.74 stations per 104 km2 in the study area (Figure 1). The in situ meteorological data from 1961–2010 were used to calculate the SPI and SPEI time series for higher statistical precision, and only the data sets from 2000–2010 were used to validate the TVDI. The monthly soil moisture in 2005, which was collected at 15 agricultural meteorological stations, was extracted from a dataset distributed by the China Meteorological Administration (Figure 1). Moreover, the drought-affected crop area data from all of Ningxia Province from 2000 to 2010 were obtained from the China Ministry of Agriculture and used to validate the performance of the TVDI in agricultural drought monitoring.

3. Methodology

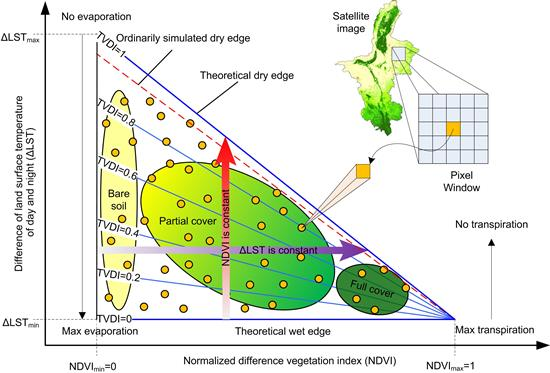
3.1. Theory of the Temperature Vegetation Dryness Index

LST is sensitive to the surface soil water content due to its impact on surface heating processes (heat capacity and thermal conductivity) under bare soil or sparse vegetation conditions. With increasing vegetation coverage, which can be indicated by the NDVI, the LST responds slowly to changes in the surface soil water content. The scatterplots of remote sensing pixel values of LST versus NDVI are typically triangular [18,27] or trapezoidal [47]. The typical relationship between LST and NDVI was used to construct the TVDI (Figure 2). Theoretically, in the triangular domain, the base edge of the triangle parallel to the NDVI-axis corresponds to the pixels with maximum evapotranspiration pixels, and the top edge of the triangle (the hypotenuse) corresponds to the zero evapotranspiration pixels in the study region (Figure 2). Between the triangle top and its base, the majority of the triangle corresponds to evapotranspiration with varying drought condition. As the NDVI increases along the x-axis, the maximum LST decreases and can be fitted to a negative slope using the least square method, which is defined as the dry edge. The wet edge consists of a group of points that form a horizontal or sloping line for different surface vegetation covers. In the vertical direction, from the bottom to the top of the triangular domain where the NDVI value is constant, LST increases progressively as a result of water stress in the surface soil, from the minimum value at the wet edge to the maximum value at the dry edge, whereas the surface soil water content decreases from maximum to minimum values correspondingly [24], and the TVDI increases from zero to one, indicating a land surface change from extreme wetness to extreme drought (Figure 2). The TVDI is estimated using the following equation:
T V D I = ( L S T L S T min ) / ( L S T max L S T min ) ,
where LST is the observed land surface temperature and LSTmin and LSTmax are the minimum and maximum land surface temperatures of pixels, respectively, which have the same NDVI values in a study region and are defined as the wet and dry edges. LSTmin and LSTmax are calculated by groups of points at the lower and upper limits of the scatterplots. Their equations are as follows:
L S T min = ( a + b × N D V I )
L S T max = ( c + d × N D V I ) ,
where a, b, c, and d are wet and dry edge parameters estimated in the whole study region, including the entire range of surface moisture contents [18,48].

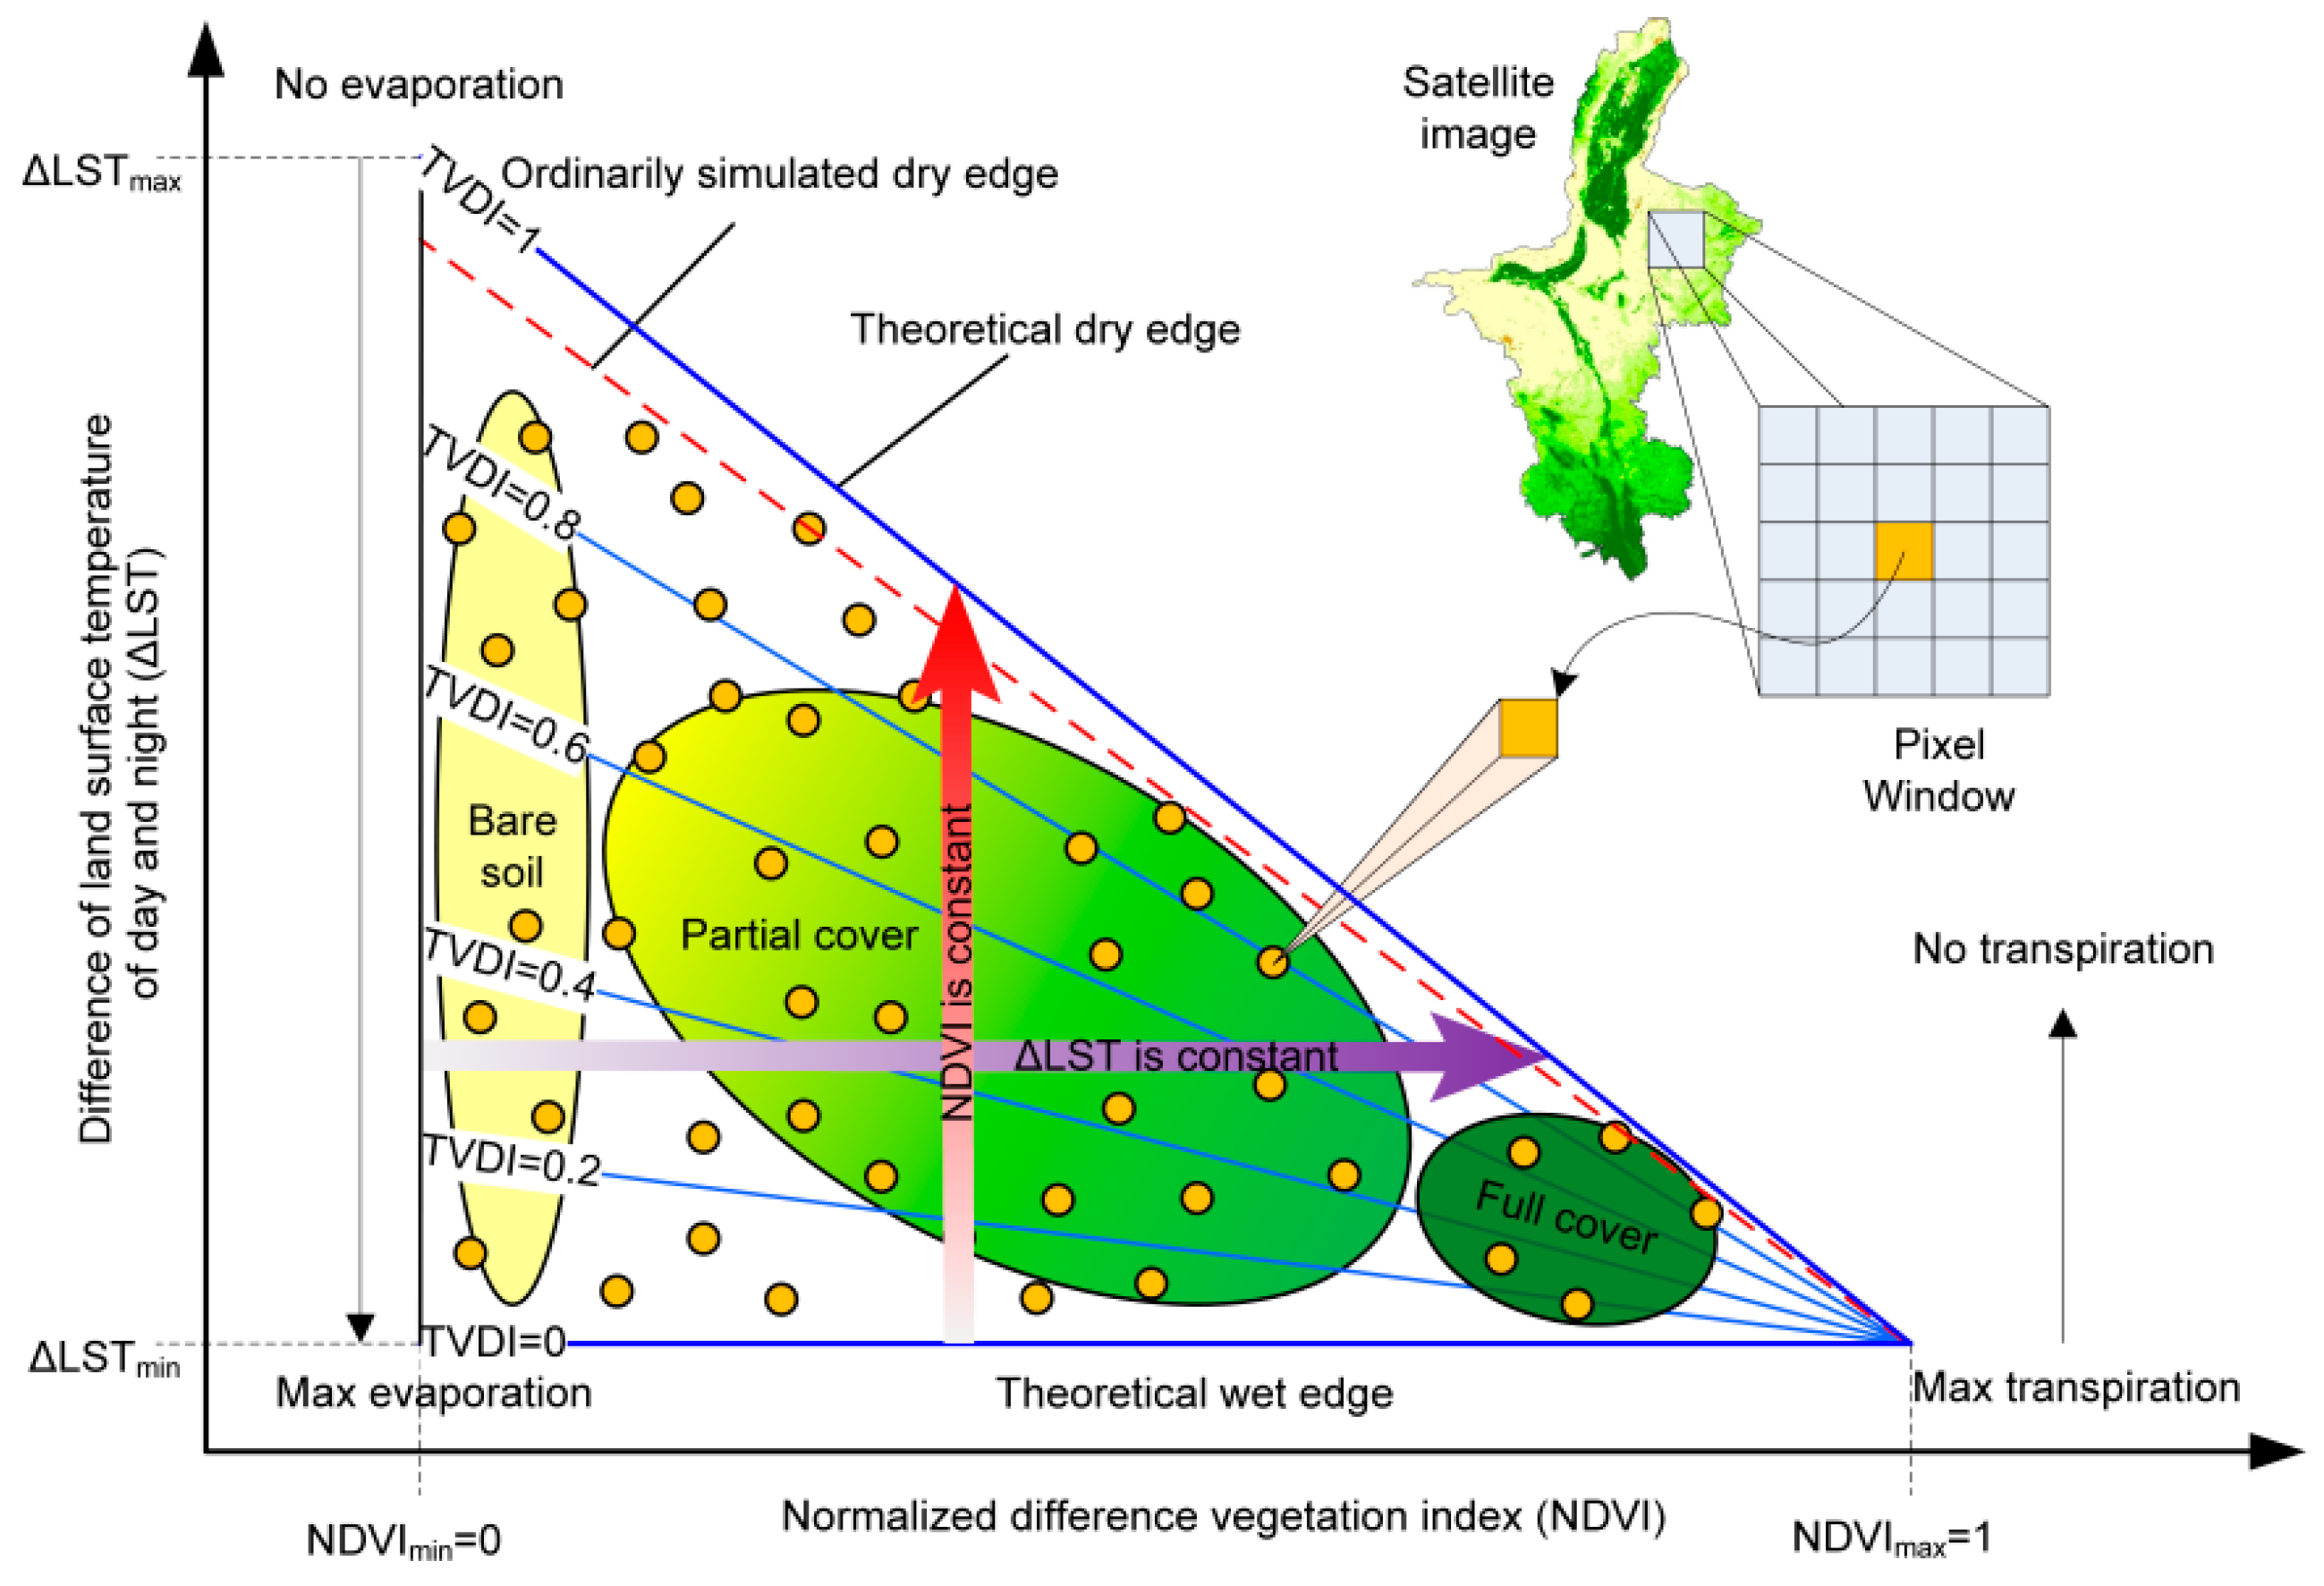
3.2. Improvement of the Temperature Vegetation Dryness Index
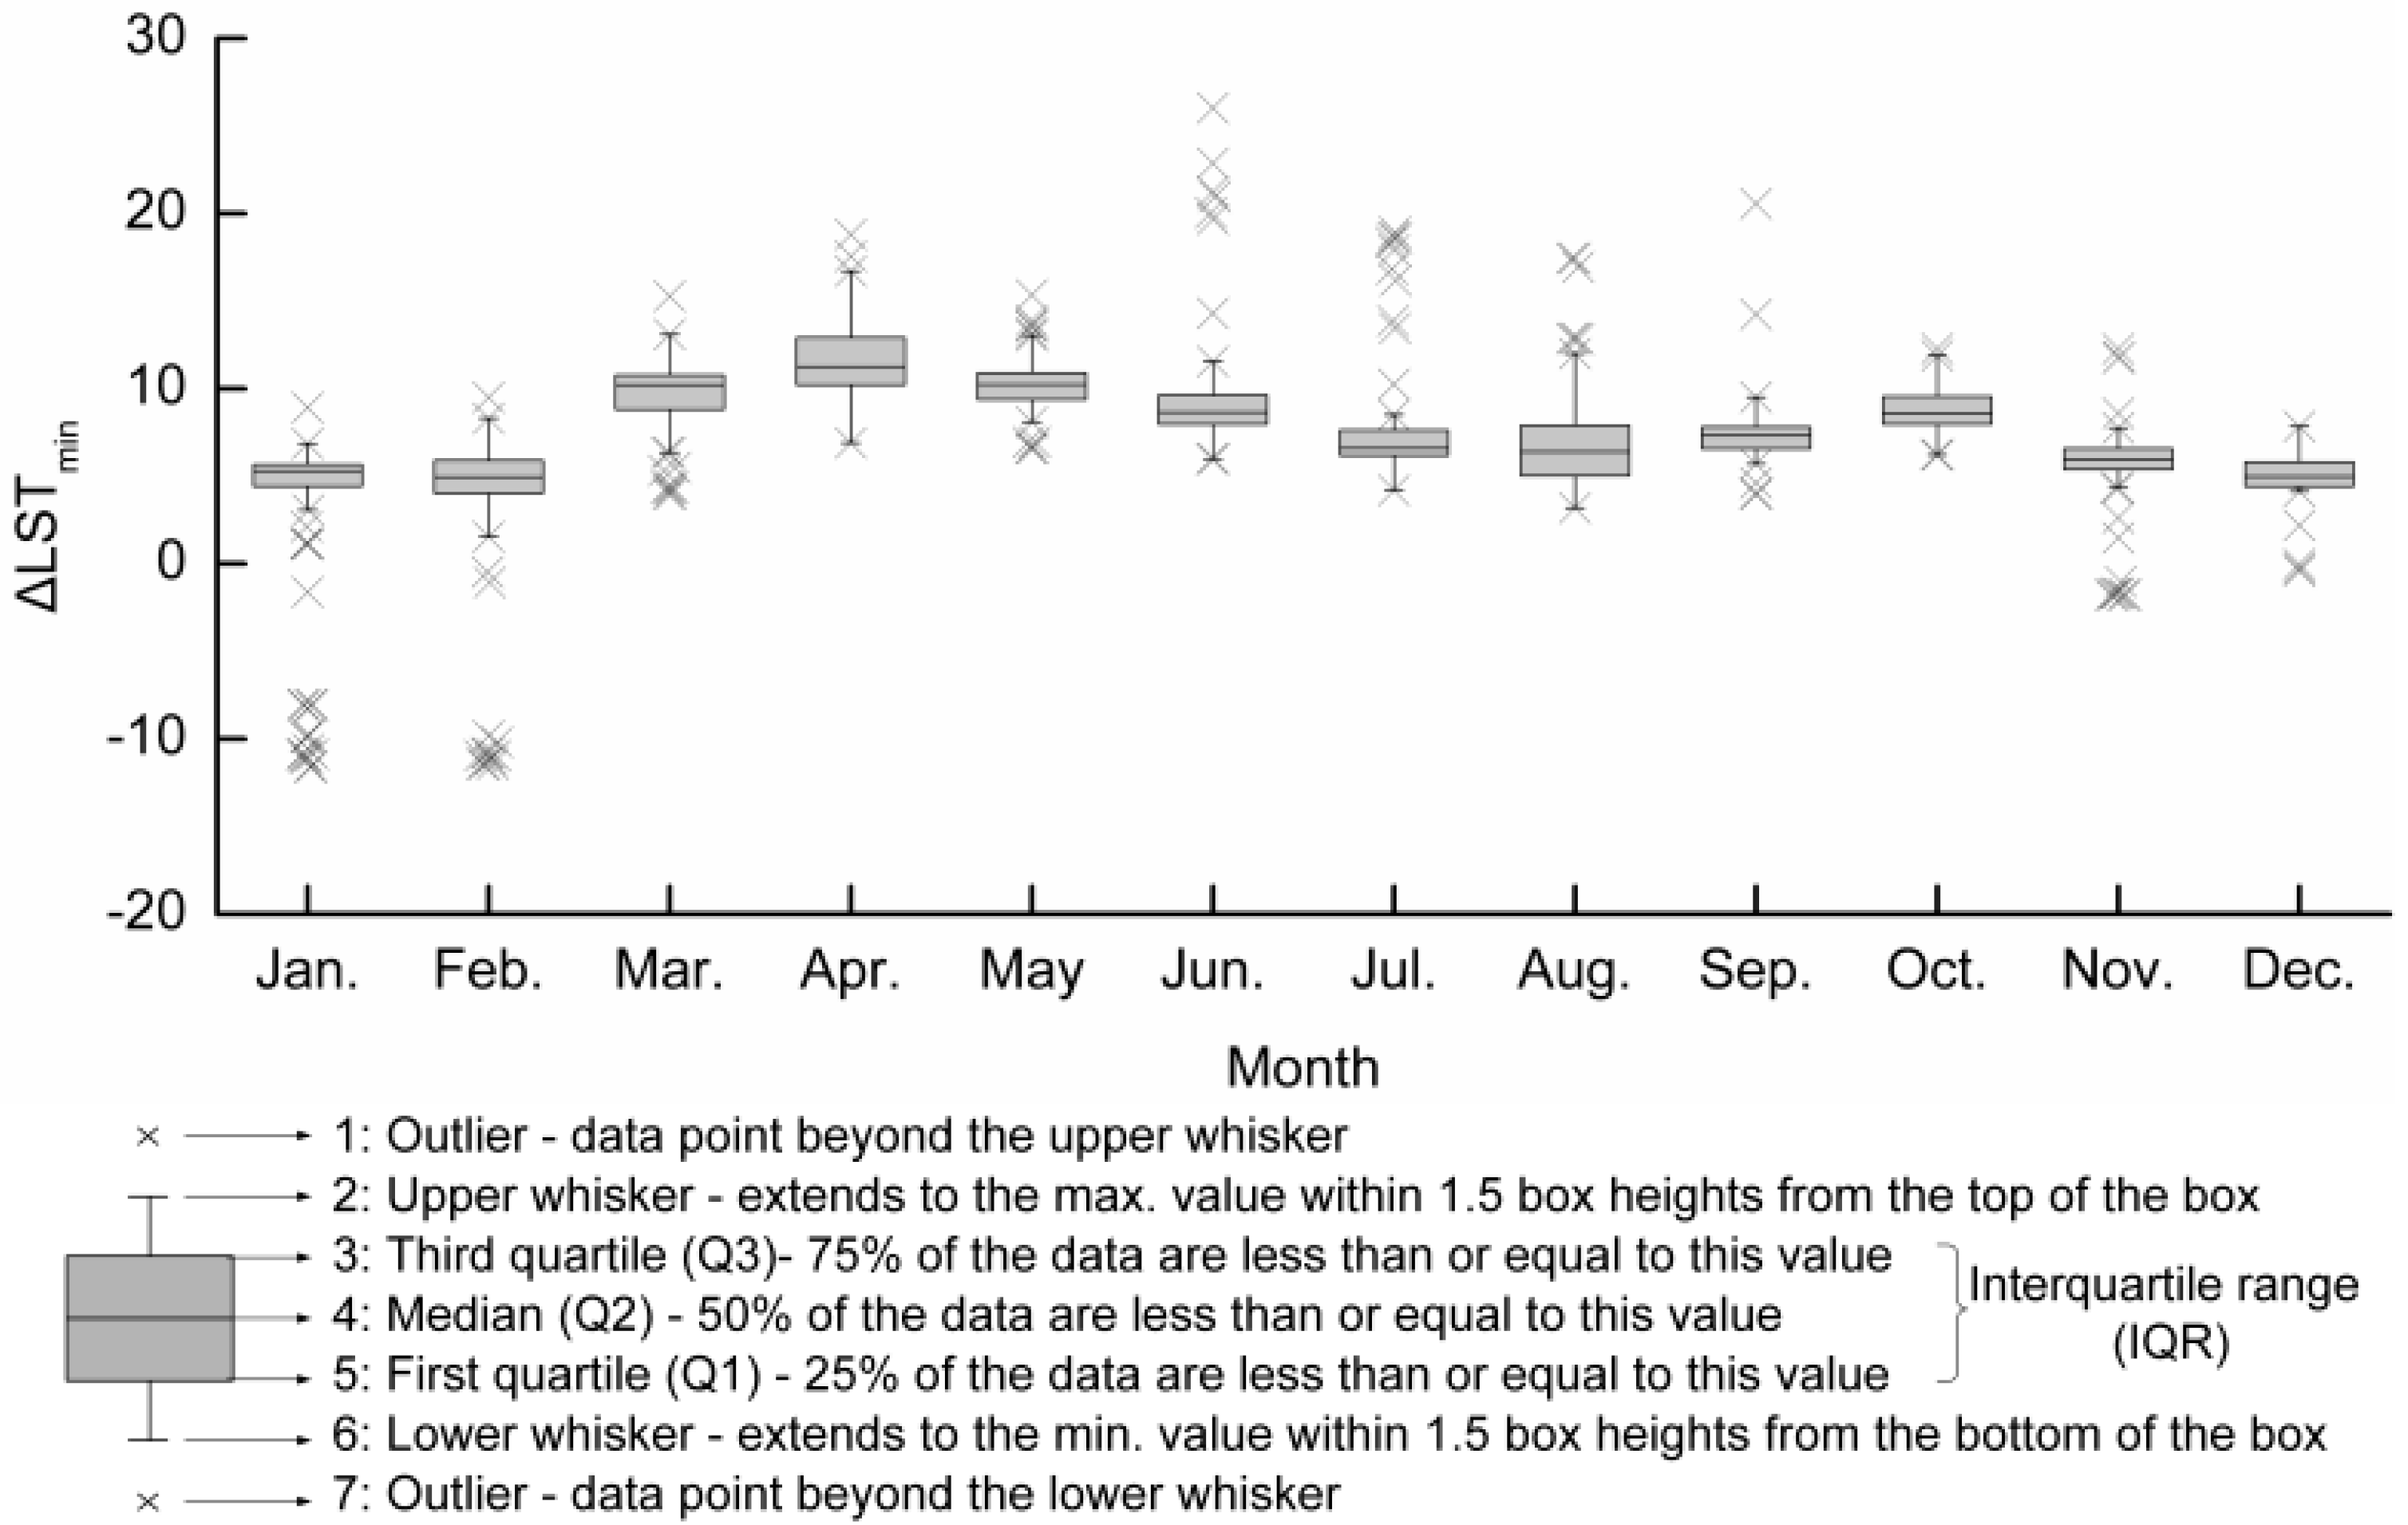
Because it is assumed that the main source of variation in the TVDI is land surface temperature based on soil moisture changes, air temperature is not considered in the model, which may increase the uncertainty of the TVDI for larger areas and higher NDVI values [31]. Air temperature decreases as altitude increases, a phenomenon known as the environmental lapse rate [31], and decreases as latitude increases [48]. To improve the performance of the TVDI, a digital elevation model (DEM) was used to calculate the environmental lapse rate, and air temperature was used to correct the land surface temperature [30,31,48]. In addition, the difference between the day and night land surface temperatures (∆LST) and the difference between the surface temperature and air temperature (Ts − Ta) have been used to estimate global or regional evapotranspiration (ET) and the evaporative fraction (EF) [23,49,50]. The results show that the diurnal changes in surface temperature are more sensitive to soil moisture than to Ts or Ta. With advances in Earth observation technology, high frequency thermal infrared observations have become available for land monitoring. The MODIS instrument on the Terra satellite can obtain day and night land surface temperatures in the same region of the Earth, and they can be used to calculate the difference between the land surface temperature in the day and night. Here, the average LST and ∆LST of Ningxia Province, China, from 2000 to 2010 were calculated, and the pixel values of LST and ∆LST at the 15 soil moisture stations were collected. The correlation analysis between LST, ∆LST, elevation, and latitude showed that ∆LST is less influenced by variations in terrain and latitude (Figure 3). Therefore, one improvement of the TVDI in this study is the use of ∆LST as an alternative to LST in the model (Figure 2). Thus, the TVDI equation is modified as follows:
T V D I m = ( Δ L S T Δ L S T min ) / ( Δ L S T max Δ L S T min ) ,
where ∆LST is the difference between the land surface temperature in the day and night. The calculations of ∆LSTmin and ∆LSTmax are the same as those for LSTmin and LSTmax.
The second improvement of the TVDI in this study was made in the simulation of dry/wet edges. Theoretically, a negative correlation exists between the NDVI and maximum ∆LST in pixels with zero evapotranspiration (driest condition) at different spatial scales [51]. However, there is normally no correlation when the NDVI is less than 0.10 in reality, and the maximum ∆LST points in this field would affect the simulation of the dry edge, resulting in a dry edge that is lower than the theoretical dry edge (Figure 2). Here, based on the monthly NDVI and ∆LST data from 2000 to 2010, the dry edges were extracted from each ∆LST/NDVI feature space, and they all exhibit a “tail down” phenomenon in the lower vegetation cover space. This “tail down” phenomenon caused the maximum ∆LST points of each dry edge to first increase and then decrease, rather than gradually decrease with the increase in NDVI (Figure 4). To determine the NDVI ranges of the “tail down” trend, the NDVI was collected when the peak value (turning point) of the maximum ∆LST points appeared at each dry edge, and there are 130 NDVI data points from March 2000 to December 2010. A descriptive statistical method was applied to analyze the statistical characteristics of the collected NDVI. The most peak values of ∆LST appeared when the NDVI was 0.10, representing the turning point of dry edge trends. Therefore, the improvement in the simulation of dry edges in this study is that the “tail down” points in the NDVI range of 0.0–0.1 were removed, and only the NDVI from 0.1 to 1.0 and the corresponding maximum ∆LST were used to build the model, rather than whole NDVI and maximum ∆LST. Theoretically, the minimum ∆LST in the scatterplots of the NDVI and ∆LST should be constant. However, it fluctuates with changing land cover, and some outliers of minimum ∆LST exist in different NDVI ranges. Therefore, a statistical method and a box plot were used to calculate the outliers of the moistest points, and they were discarded to remove their influence on the simulation of wet edges. Finally, based on the ∆LST images calculated from the MODIS day/night LST and the corresponding NDVI images, the monthly TVDI in Ningxia Province from 2000 to 2010 was produced. To compare the performances of the two simulation methods for drought monitoring in semi-arid regions of China, the original TVDI and the modified Temperature Vegetation Dryness Index (TVDIm) in 2005, the year with the most droughts during the past decade, was analyzed and discussed thoroughly in this paper. The TVDI and TVDIm were computed by establishing the NDVI–∆LST space with an NDVI interval of 0.01 in the Interactive Data Language/Environment for Visualizing Images (IDL/ENVI) software environment.

3.3. Box Plots

A box plot is a non-parametric method that has been widely used to separate outliers and other normal data in analyses [52]. As a descriptive statistical method, box plots can depict groups of numerical data through their quartiles in a convenient graphical way. Generally, the difference between the upper quartile (Q3) and lower quartile (Q1), which is the box height and is defined as interquartile range (IQR), is used to build box plots and find outliers in observations. Outliers are data that fall below Q1 − 1.5 × (IQR) or above Q3 + 1.5 × (IQR), which are named the lower whisker and upper whisker, respectively. Here, a box plot was used to detect the outliers of the moistest points (wet edges), which create uncertainty that affects the TVDI model result.

3.4. Standardized Precipitation Index (SPI)

The SPI, which was developed by McKee et al. [9], is calculated by fitting historical precipitation data to a Gamma probability distribution function for a specific period and location. The Gamma distribution is then transformed to a normal distribution with a mean of zero and standard deviation of one [53]. It is a normalized index representing the probability of occurrence of an observed rainfall amount compared with the rainfall climatology of a certain geographical location over a long-term reference period. Ideally, it requires at least 20–30 years of monthly precipitation data, with 50–60 years (or more) being optimal and preferred to calculate SPI. The index is negative for drought and positive for wet conditions. As the dry or wet conditions become more severe, the index becomes more negative or positive. The SPI has been widely used for drought monitoring, forecasting, frequency analysis, spatiotemporal analysis, and climate impact studies [4].

3.5. Standardized Precipitation Evapotranspiration Index (SPEI)

The SPEI, which was developed by Vicente-Serrano et al., is based on a monthly climatic water balance that combines precipitation and temperature data, and is expressed as a standardized Gaussian variate with a mean of zero and a standard deviation of one [11]. The calculation of the SPEI is based on the original SPI calculation procedure. The monthly difference between precipitation and potential evapotranspiration (PET) was used as the input data to calculate the SPEI at different time scales. PET was calculated using the Thornthwaite equation, which is the simplest approach as it only requires monthly mean temperature data. Similar to the SPI, it also needs more than 50 years of monthly precipitation and temperature data to calculate the SPEI for higher statistical precision. The main advantage of the SPEI is that it includes the effect of the evaporative demand on the calculation; hence, it is suited to exploring the effects of global warming on the occurrence of droughts [3].

4. Results

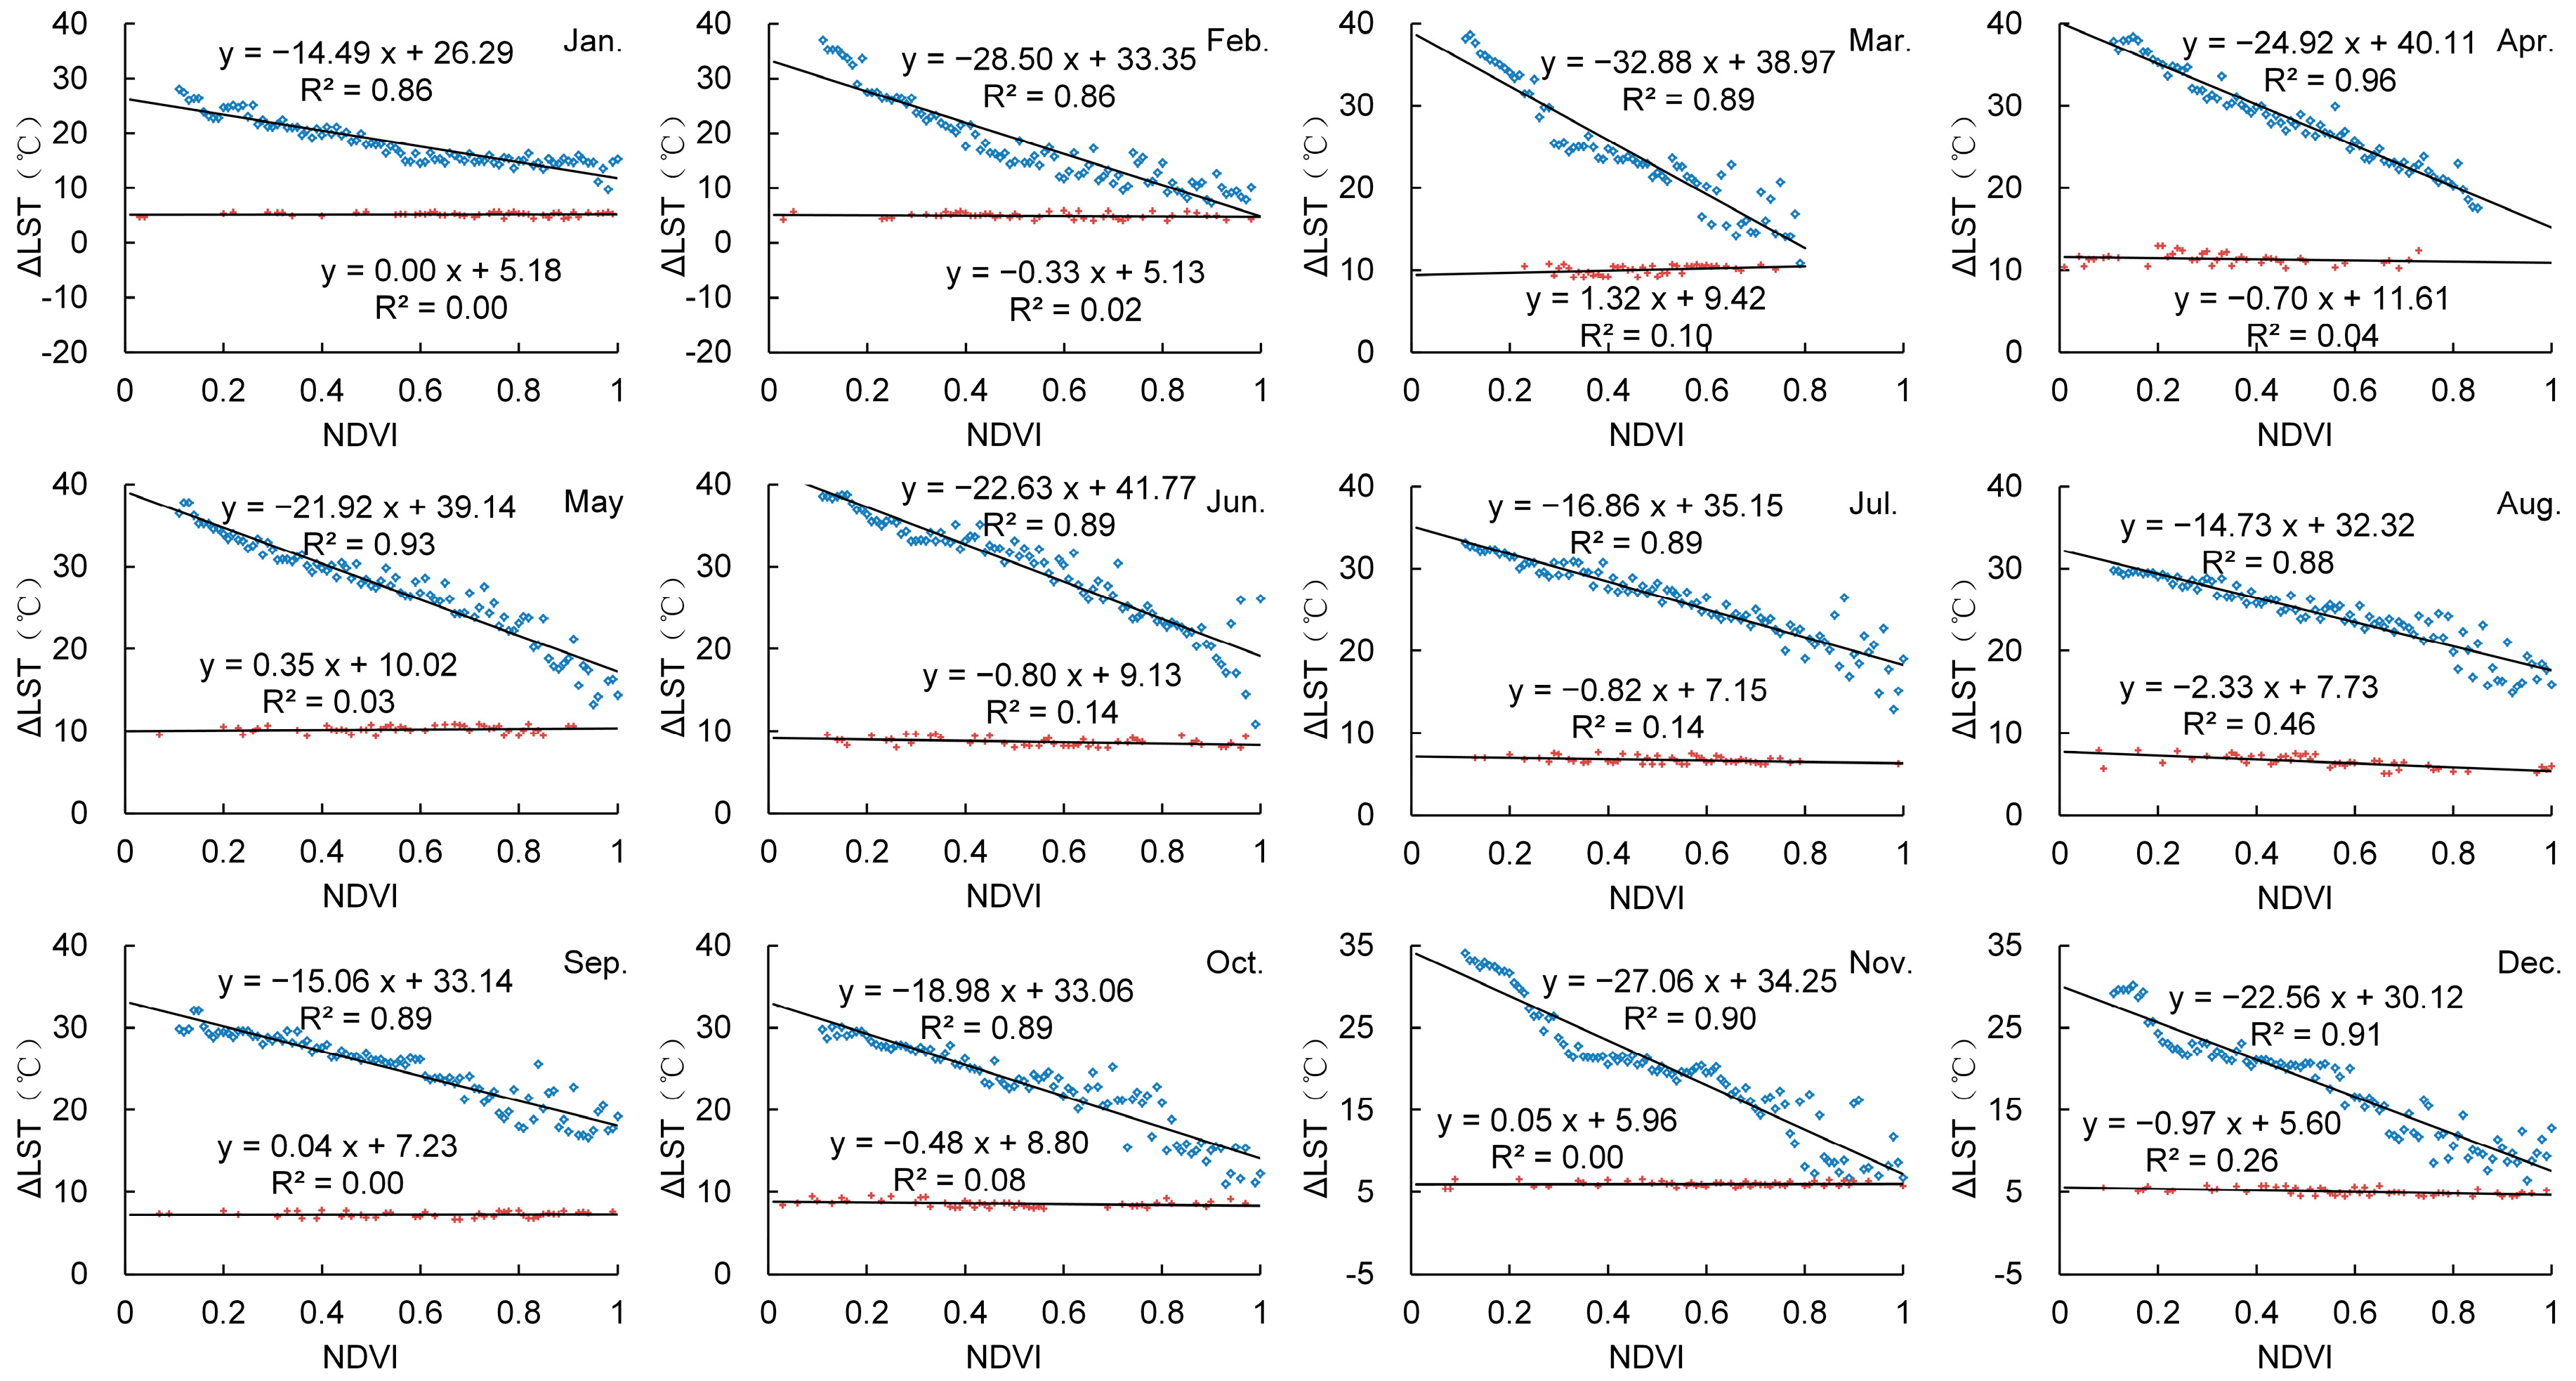
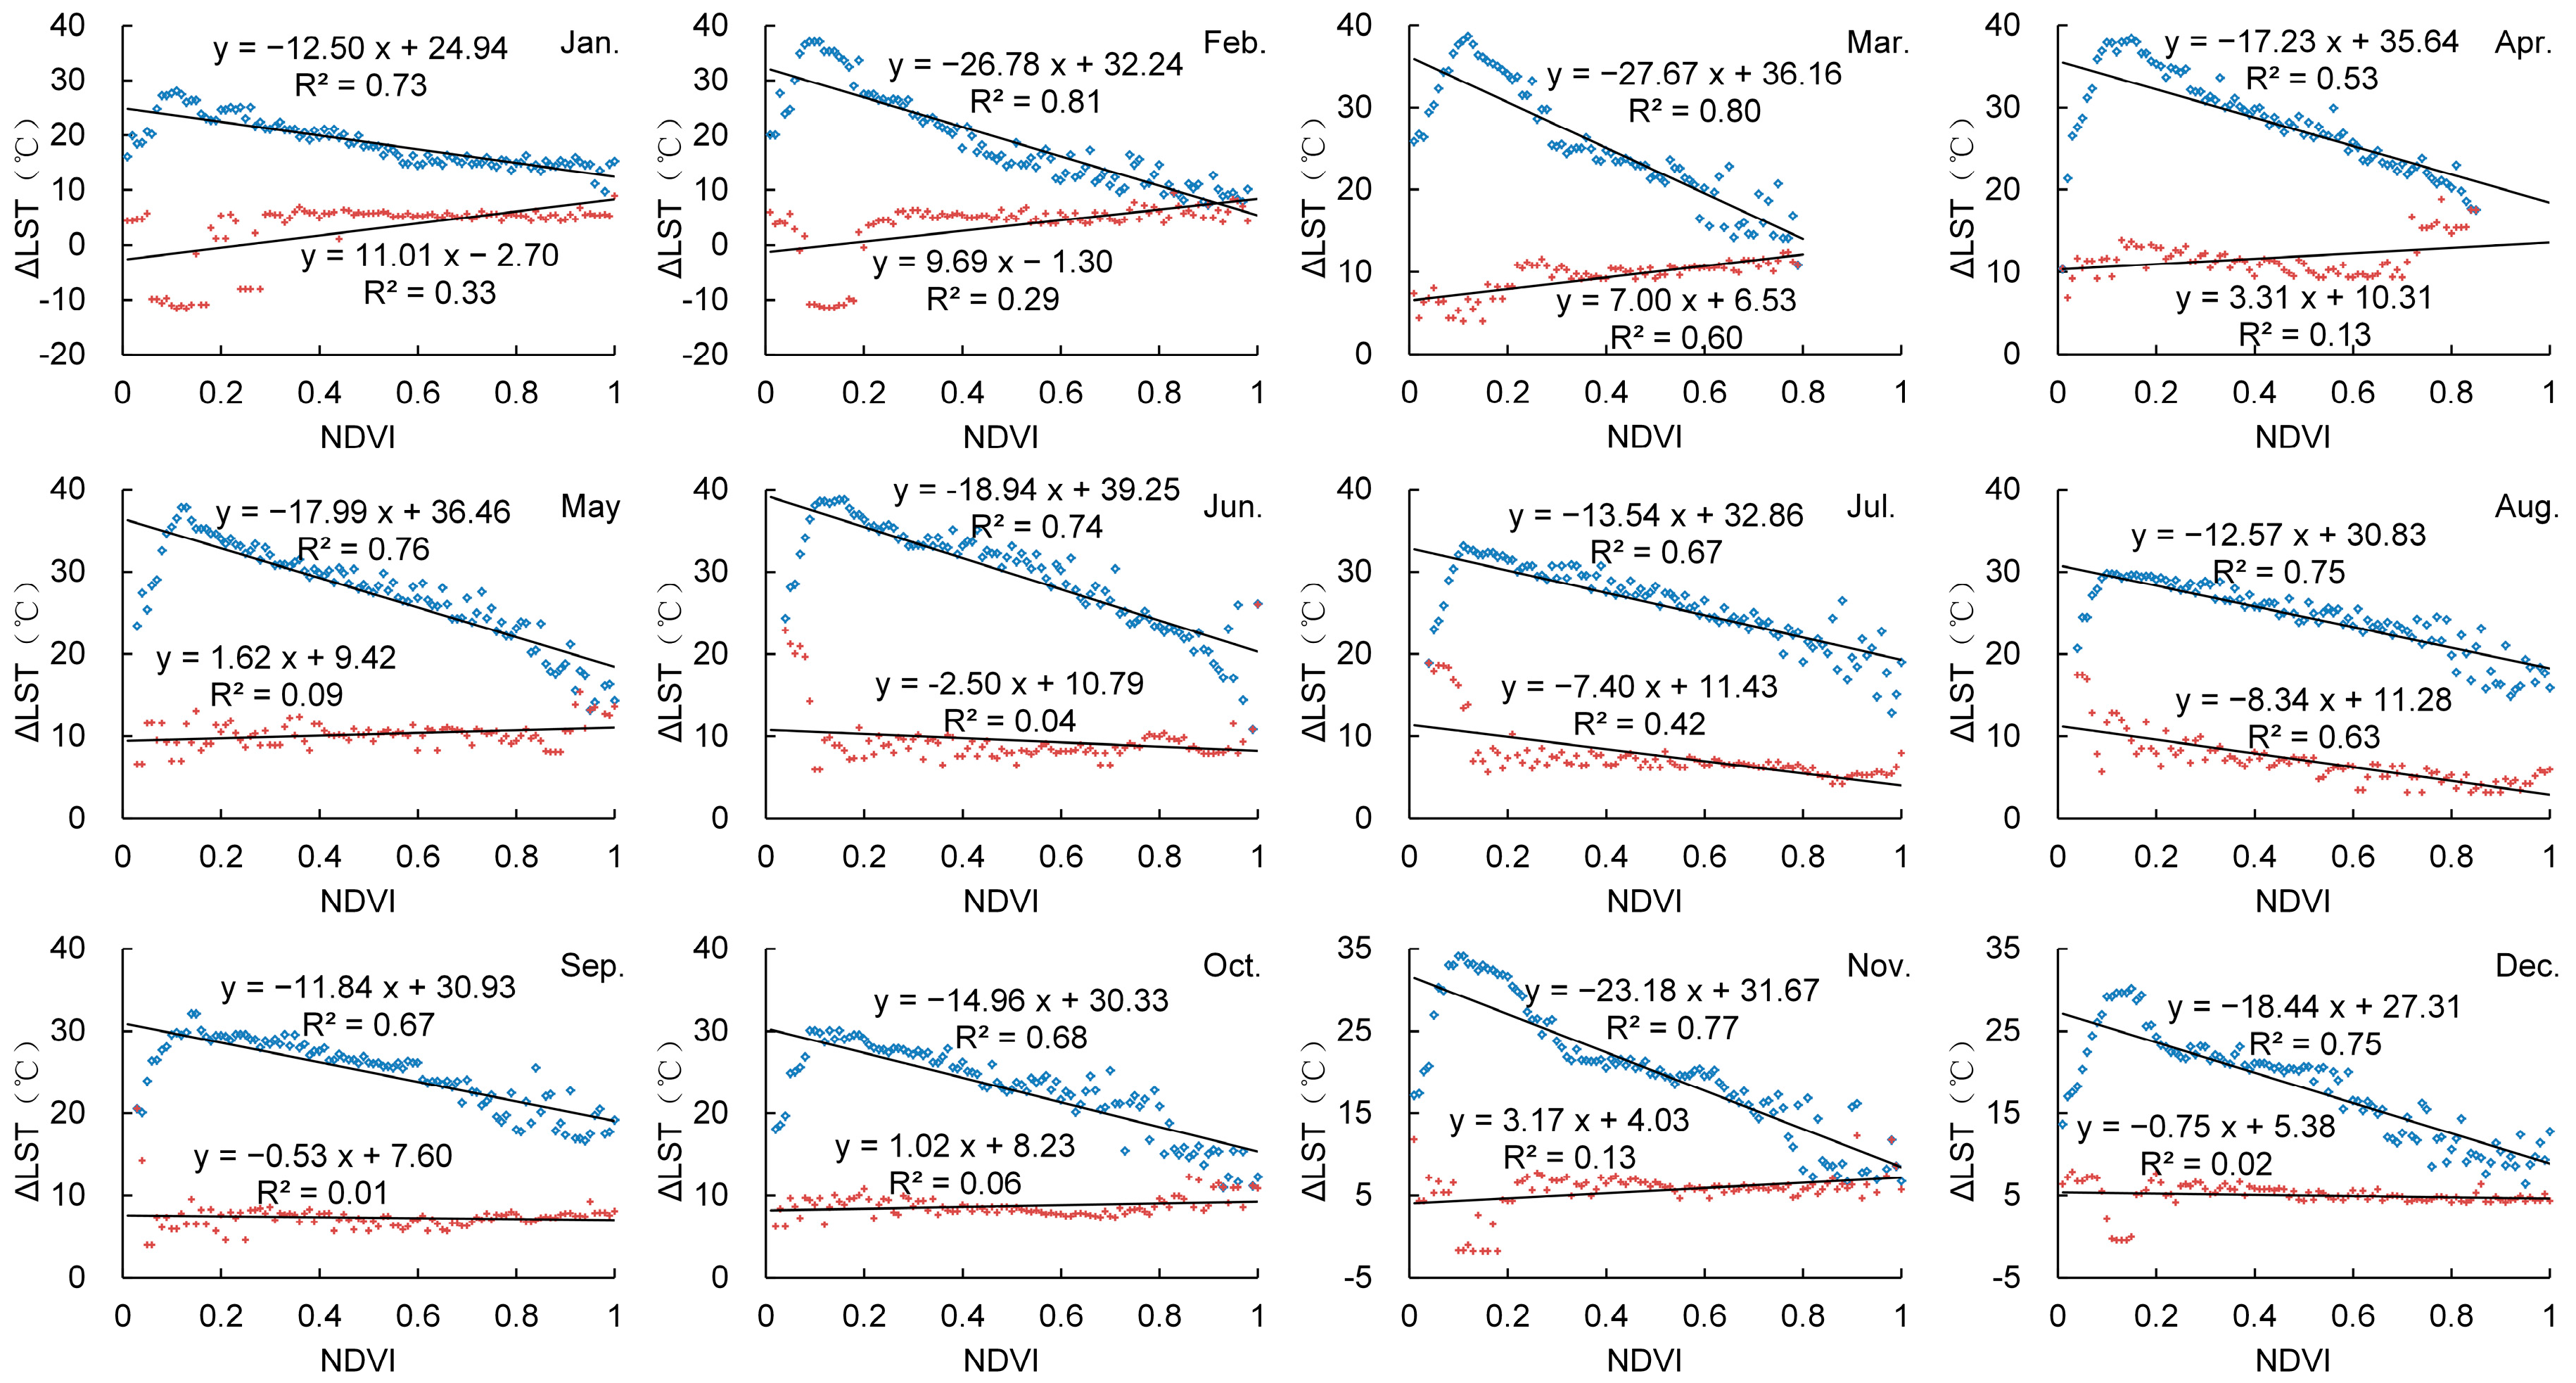
4.1. The NDVI–∆LST Space and Dry/Wet Edges for TVDI

The scatterplots of NDVI pixels against corresponding ∆LST from January to December in 2005 are shown in Figure 4. A least-squares regression method was applied to obtain isolines representing the dry edges (∆LSTmax) and wet edges (∆LSTmin) based on the feature space NDVI–∆LST data. The results show that the ∆LSTmax has a significant correlation with NDVI, and these driest points can be used to build the dry edge model. All dry edges have negative slopes, and the coefficients of determination (R2) of the least squares regression equation in each month are in the range of 0.53–0.81. However, these driest points have a “tail down” structure, with the NDVI in the range of 0–0.1, which is mainly caused by the low vegetation coverage and bare soil pixels in remote sensing images (Figure 4). The phenomenon of “tail down” will cause the simulated dry edges to deviate from the theoretical isoline, and the simulated ∆LSTmax value will be less than the actual value. The ∆LSTmin points extracted from remote sensing images show that the wet edges have relatively moderate slopes, and their values are in the range of −8.34–11.01. The biggest problem with the wet edge model is that there are many outliers, which can cause the simulated wet edges to deviate from the theoretical condition (Figure 4).

4.2. Dry/Wet Edge Adjustment for TVDIm

The theoretical hypothesis of TVDI is that enough pixels are distributed from lower to higher vegetation covers in the remote sensing data and that evapotranspiration extremes (zero and maximum) can be observed in different vegetation coverage. However, zero evapotranspiration rarely occurs for dense vegetation covers in reality, even in semi-arid environments, primarily because of the soil water uptake from the root zone [23,24]. Meanwhile, maximum evapotranspiration rarely occurs for bare soil and sparse vegetation covers, especially in semi-arid environments, primarily because there is not enough water at the soil surface in the dry season. Consequently, some of the driest points calculated from remote sensing data are lower than the theoretical values, especially in lower vegetation coverage conditions. By contrast, some of the moistest points are higher than the theoretical values. At the same time, the outliers of the moistest points introduce uncertainty that affects the TVDI model results. Therefore, the observed dry/wet edges modeled by scatterplots of remote sensing data do not perfectly correspond to the theoretical dry/wet edges. Hence, an improvement of dry/wet edge simulation is proposed in this study. A non-parametric box plot method was used to separate the outliers and other normal data [52]. The monthly box plots of ∆LSTmin are shown in Figure 5. At the same time, ∆LSTmax with NDVI values in the range of 0–0.1 were also discarded to remove the “tail down” in the dry edge.
As soon as the outliers were removed from ∆LSTmin, the monthly wet edges from 2000 to 2010 were rebuilt using the remaining data. As an example, the improved wet edges and their fitting equations in 2005 are shown in Figure 6. The isolines of wet edges from January to December in 2005 are almost all horizontal lines, and they change slowly with variations in the NDVI. Their slopes are in the range of −2.33–1.32, and the intercepts of the fitting equation in each month is close to the median of the corresponding ∆LSTmin, which is an optimal theoretical condition. Therefore, the improved wet edges are closer to the theoretical isolines than are the original simulated wet edges, as the theoretical isolines of wet edges are constant and do not vary with the NDVI. After removing the “tail down” points from the dry edges, the modified equations of least squares regression were obtained from the ∆LSTmax points, with the NDVI in the range of 0.1–1.0. This process optimized the goodness of fit of the regression equation, and the coefficients of determination (R2) in each month ranged from 0.86–0.96, which is higher than before (Figure 6).

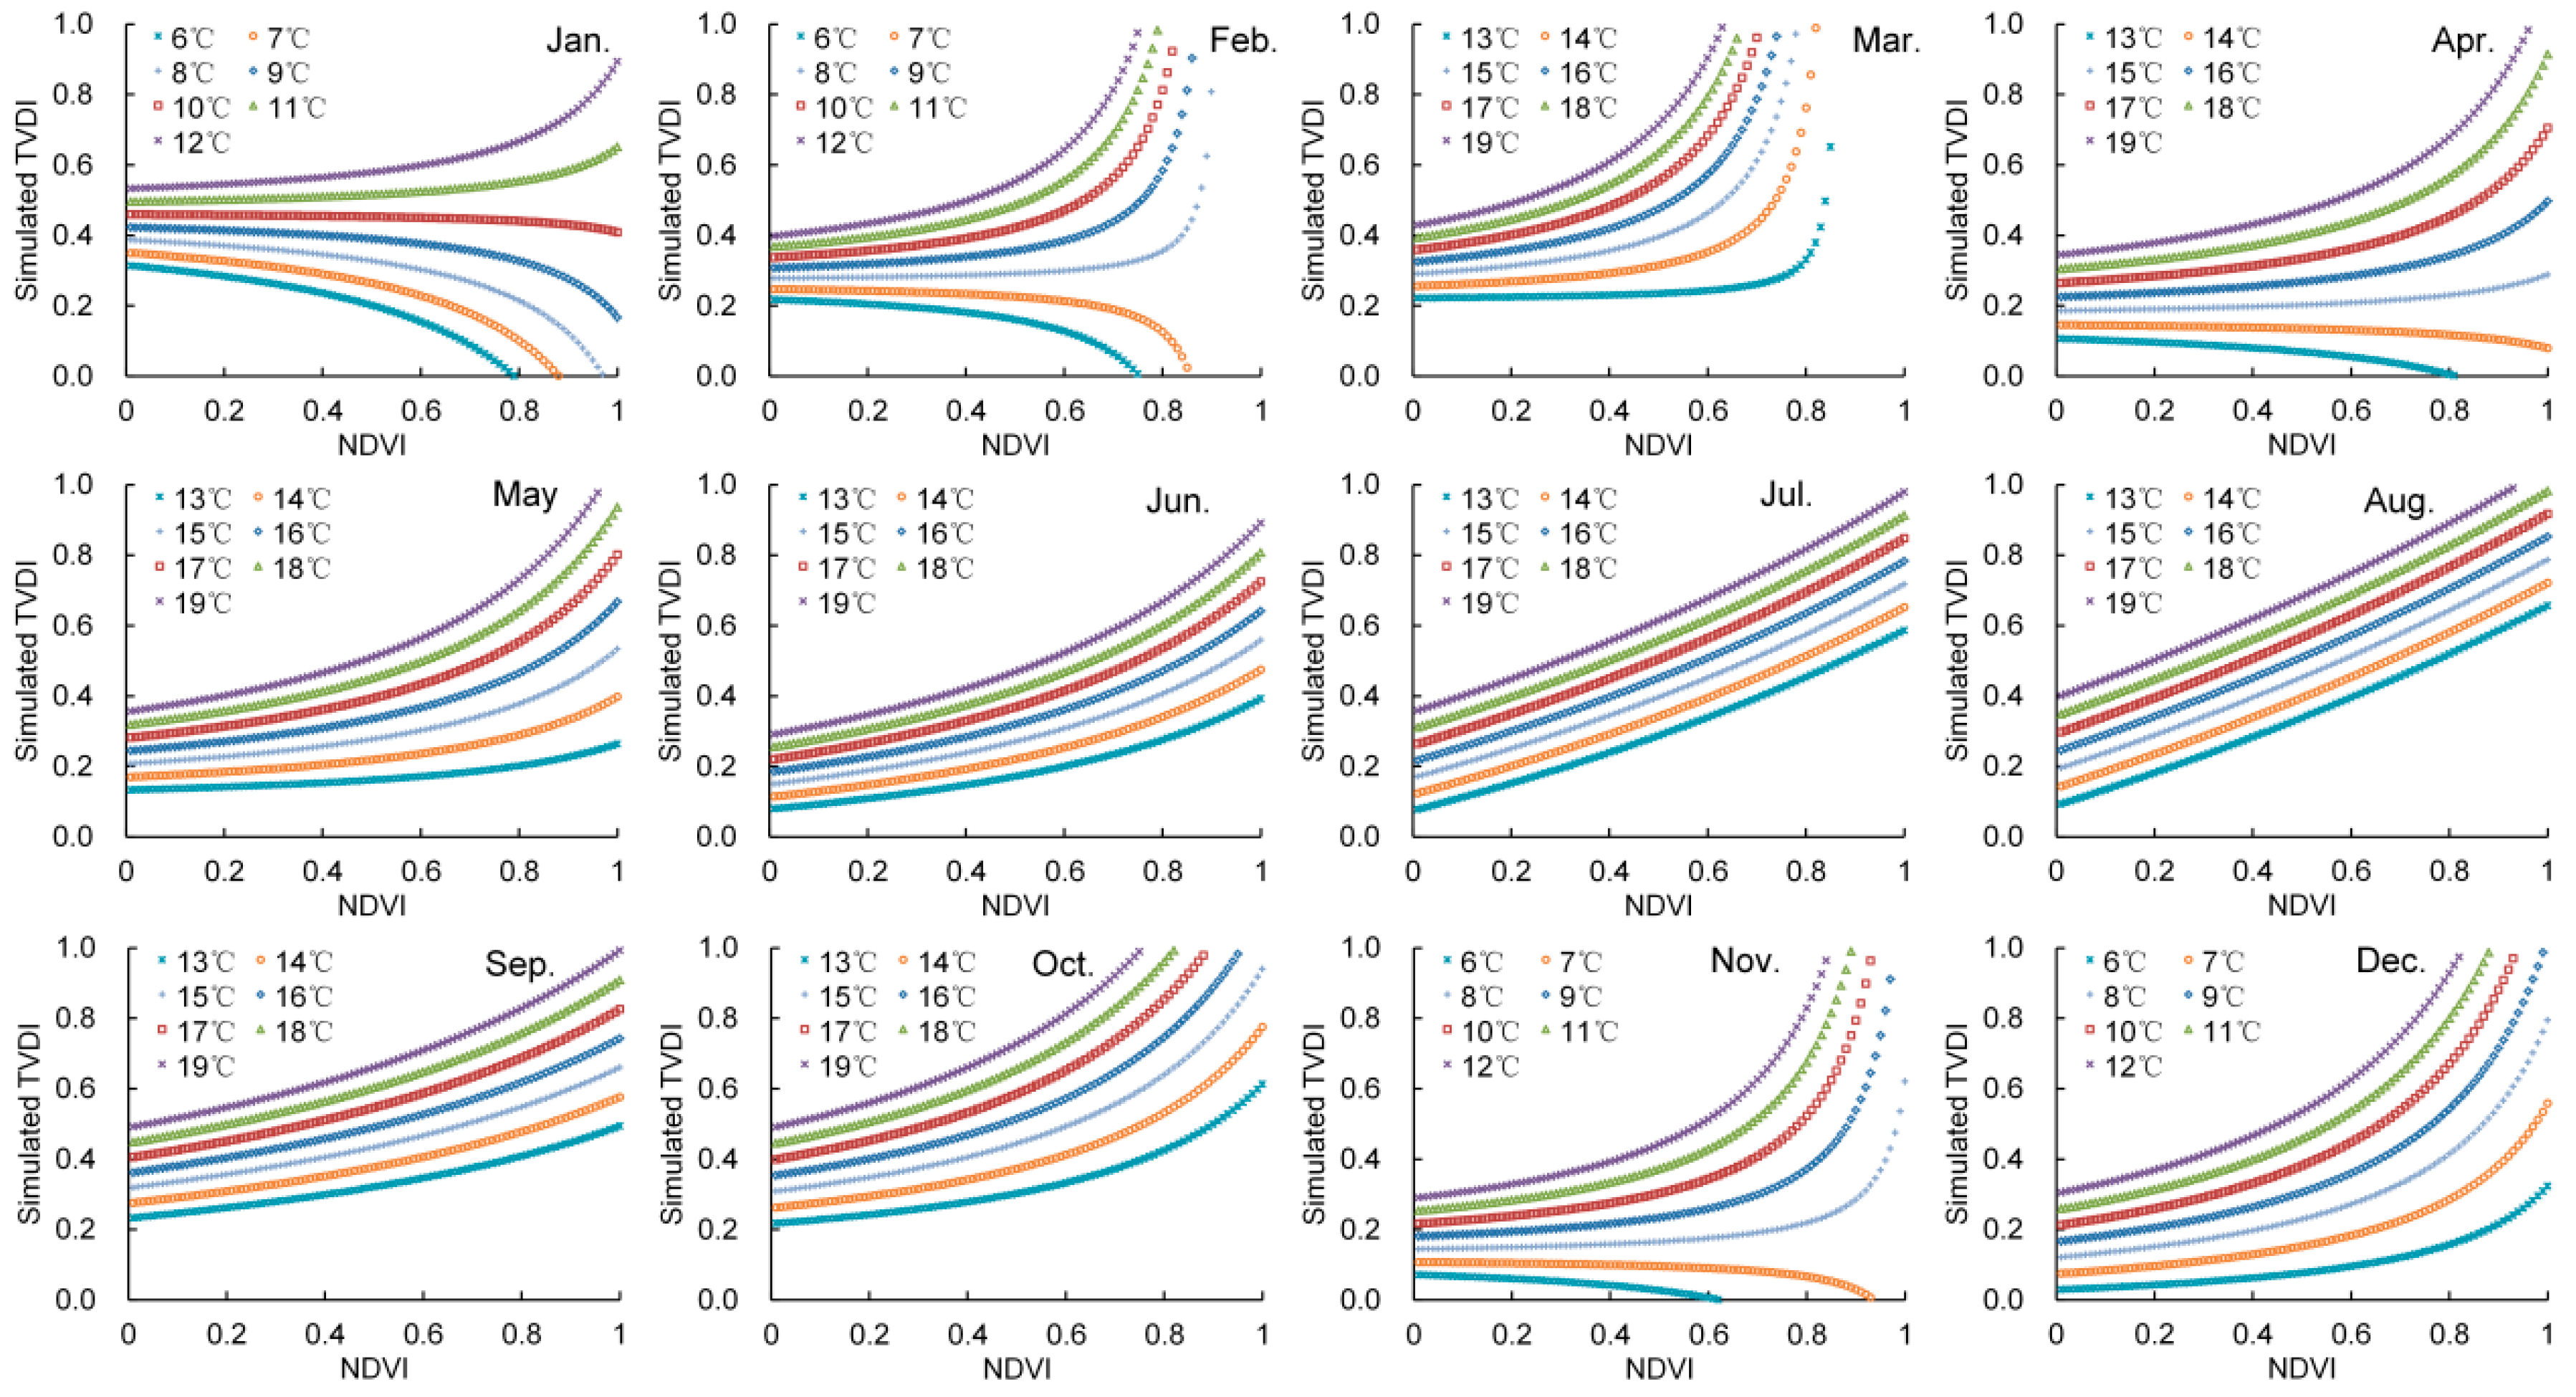
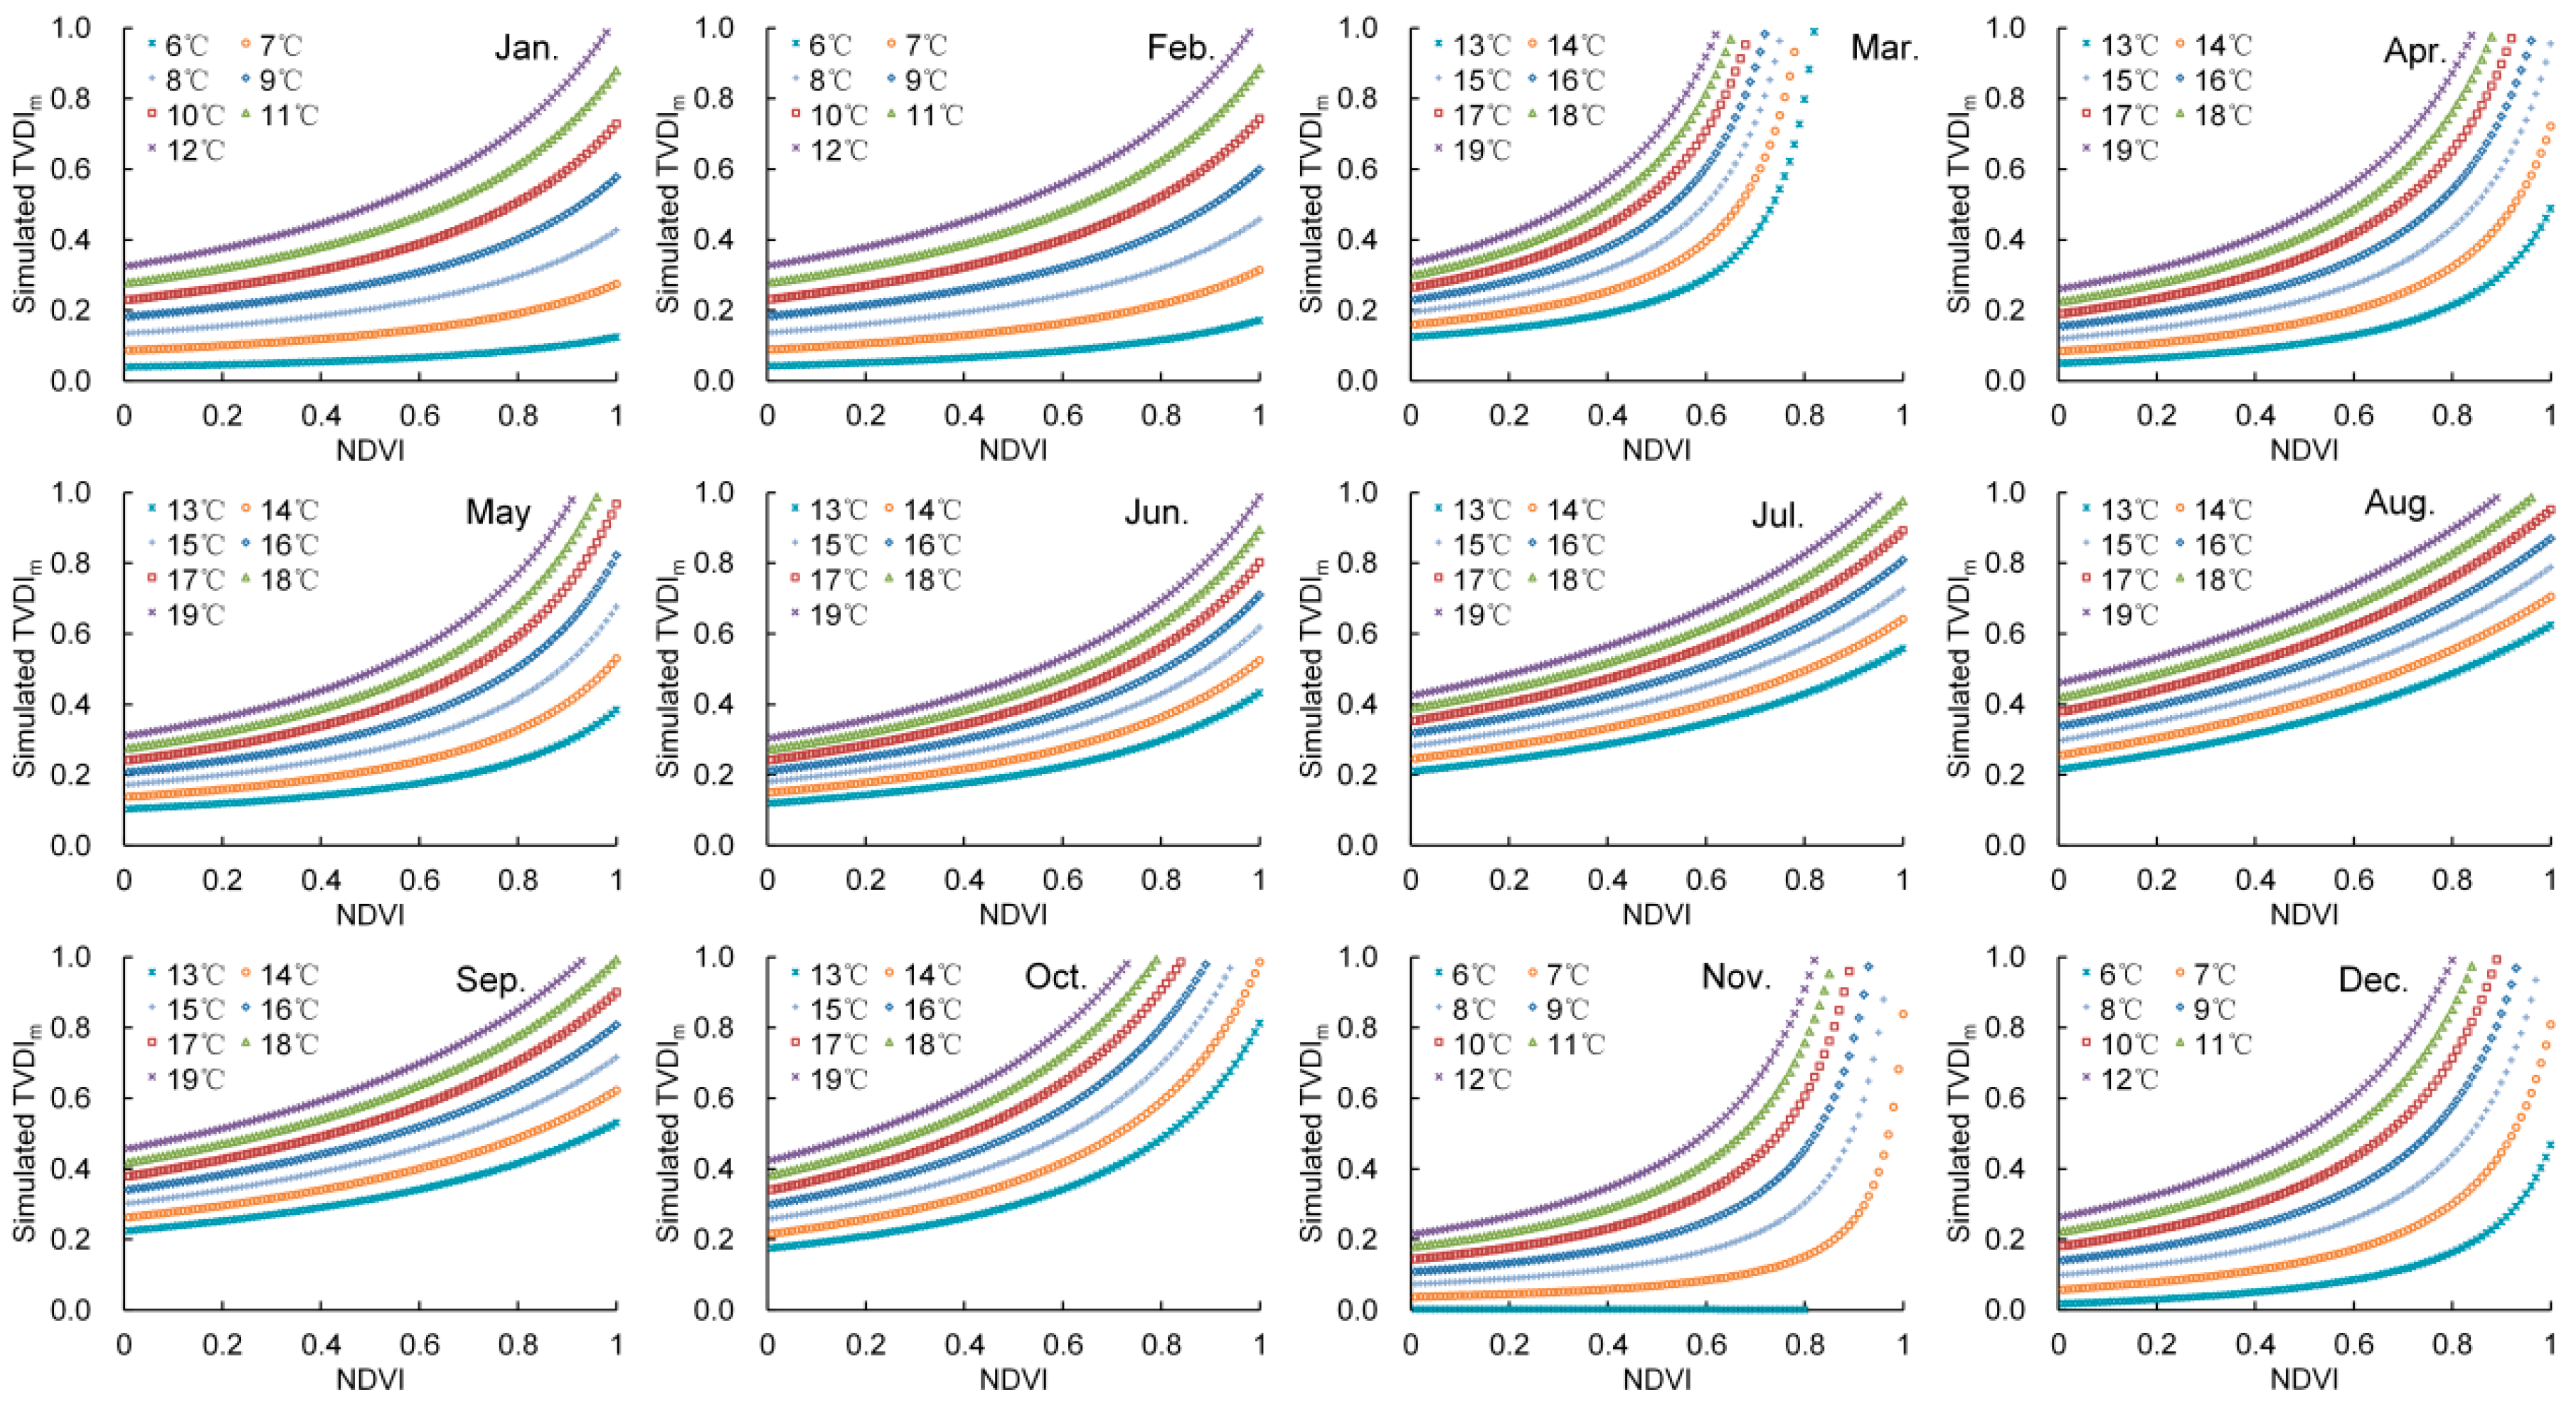
4.3. Simulation of TVDI and TVDIm under Different NDVI/∆LST Conditions

As an example, the magnitude of the TVDI was simulated for different NDVI and ∆LST conditions. Based on the original dry/wet edge fitting equations and the feature space of ∆LST/NDVI (Figure 4), the TVDI was simulated, with ∆LST in the range of 6–12 °C in the cold season (November to February) and 13–19 °C in the warm season (March to October) (Figure 7). The results show that the larger the difference in land surface temperature between day and night, the higher the TVDI for the same NDVI value. Thus, the lower the surface soil water content is, the dryer the drought monitoring results for the same vegetation coverage. Usually, the TVDI increases with increasing NDVI in pixels where ∆LST is constant (Figure 2). However, this rule was broken in some months (e.g., January, February, April, and November), as illustrated by TVDI values simulated by pixels whose low ∆LST values decreased with increasing NDVI, especially NDVI in the range of 0.4–1.0 (Figure 7). This result suggests that the TVDI images, which were calculated by the original dry/wet edge fitting equations, would be unreliable in pixels with lower ∆LST values.
Here, based on the improved dry/wet edge fitting equations (Figure 6), the magnitude of TVDIm was also simulated for different NDVI and ∆LST conditions. The simulated TVDIm result (Figure 8) looks more reasonable than the simulated TVDI result. The simulated TVDIm values are lower than the simulated TVDI values in each month for the same NDVI and ∆LST conditions, and the simulated TVDIm has no opposing trend with increasing NDVI in pixels with lower ∆LST values. Thus, the TVDIm model introduced in this study is better suited for drought monitoring of the complex land surface where vegetation coverage and the difference between the day and night land surface temperatures vary.

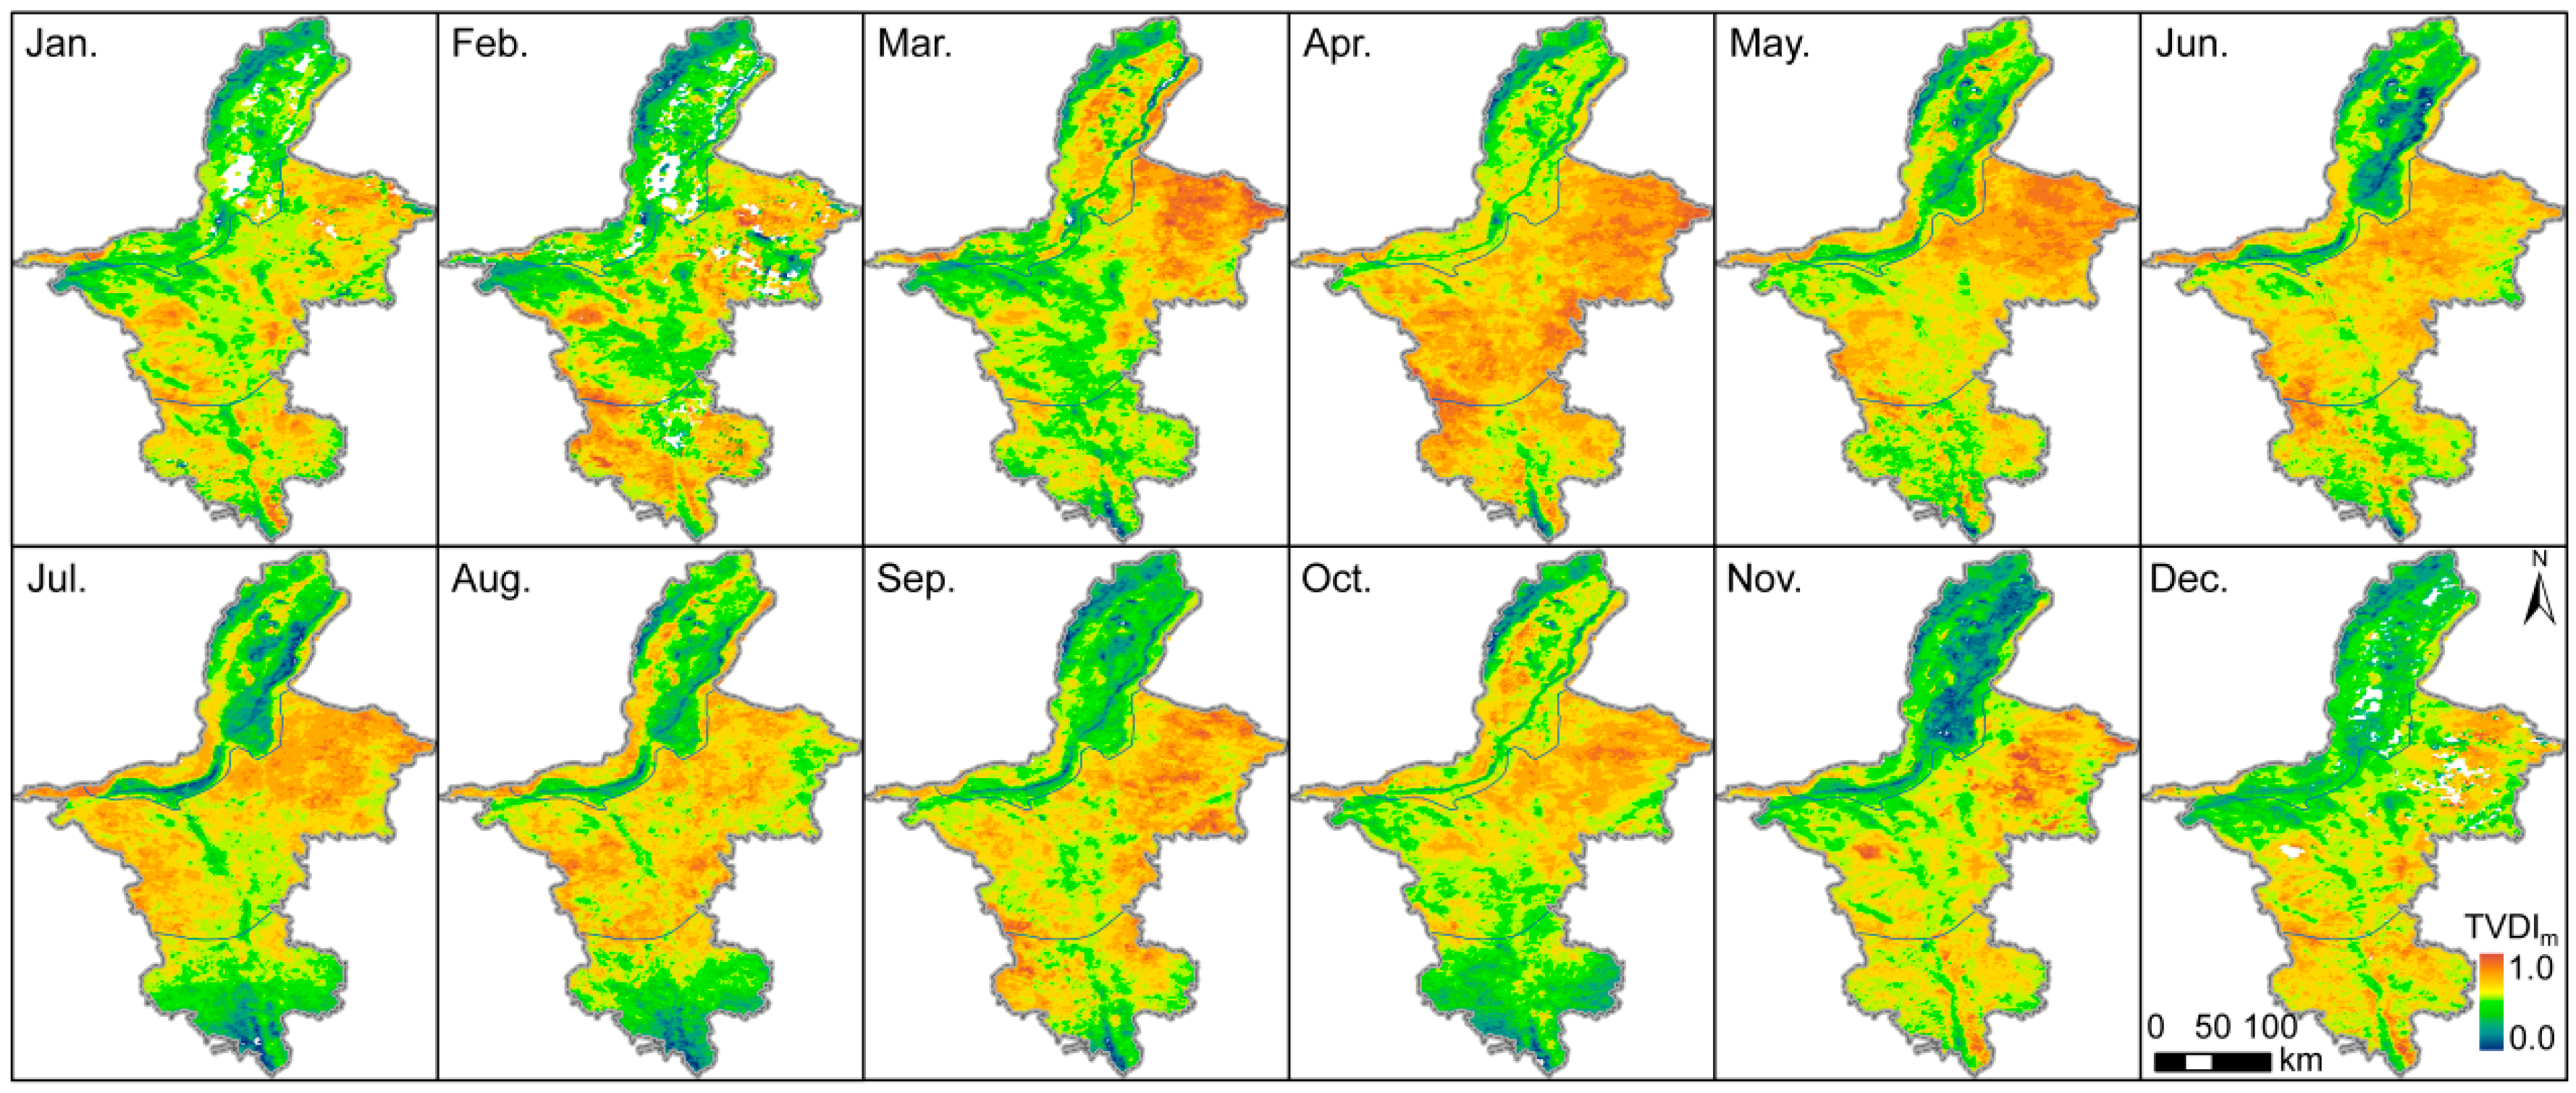
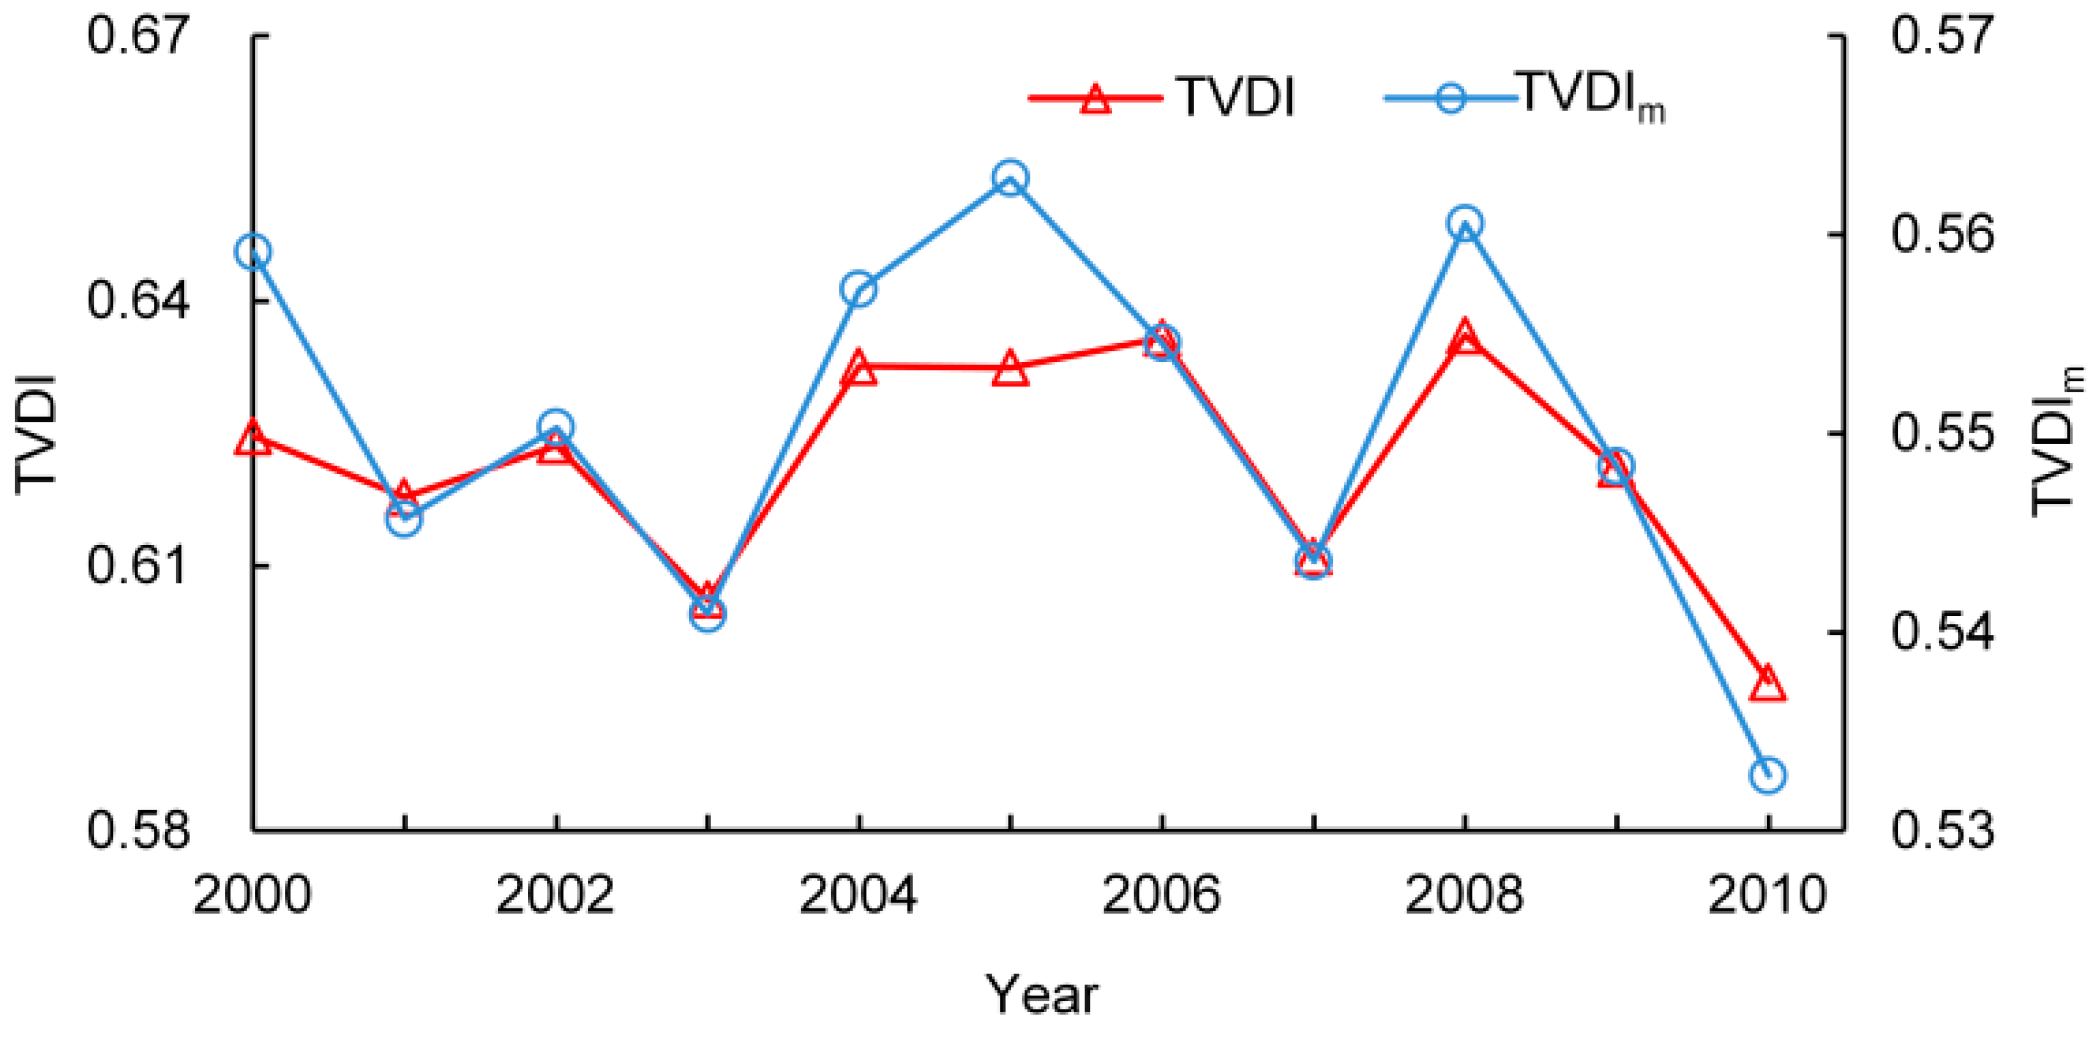
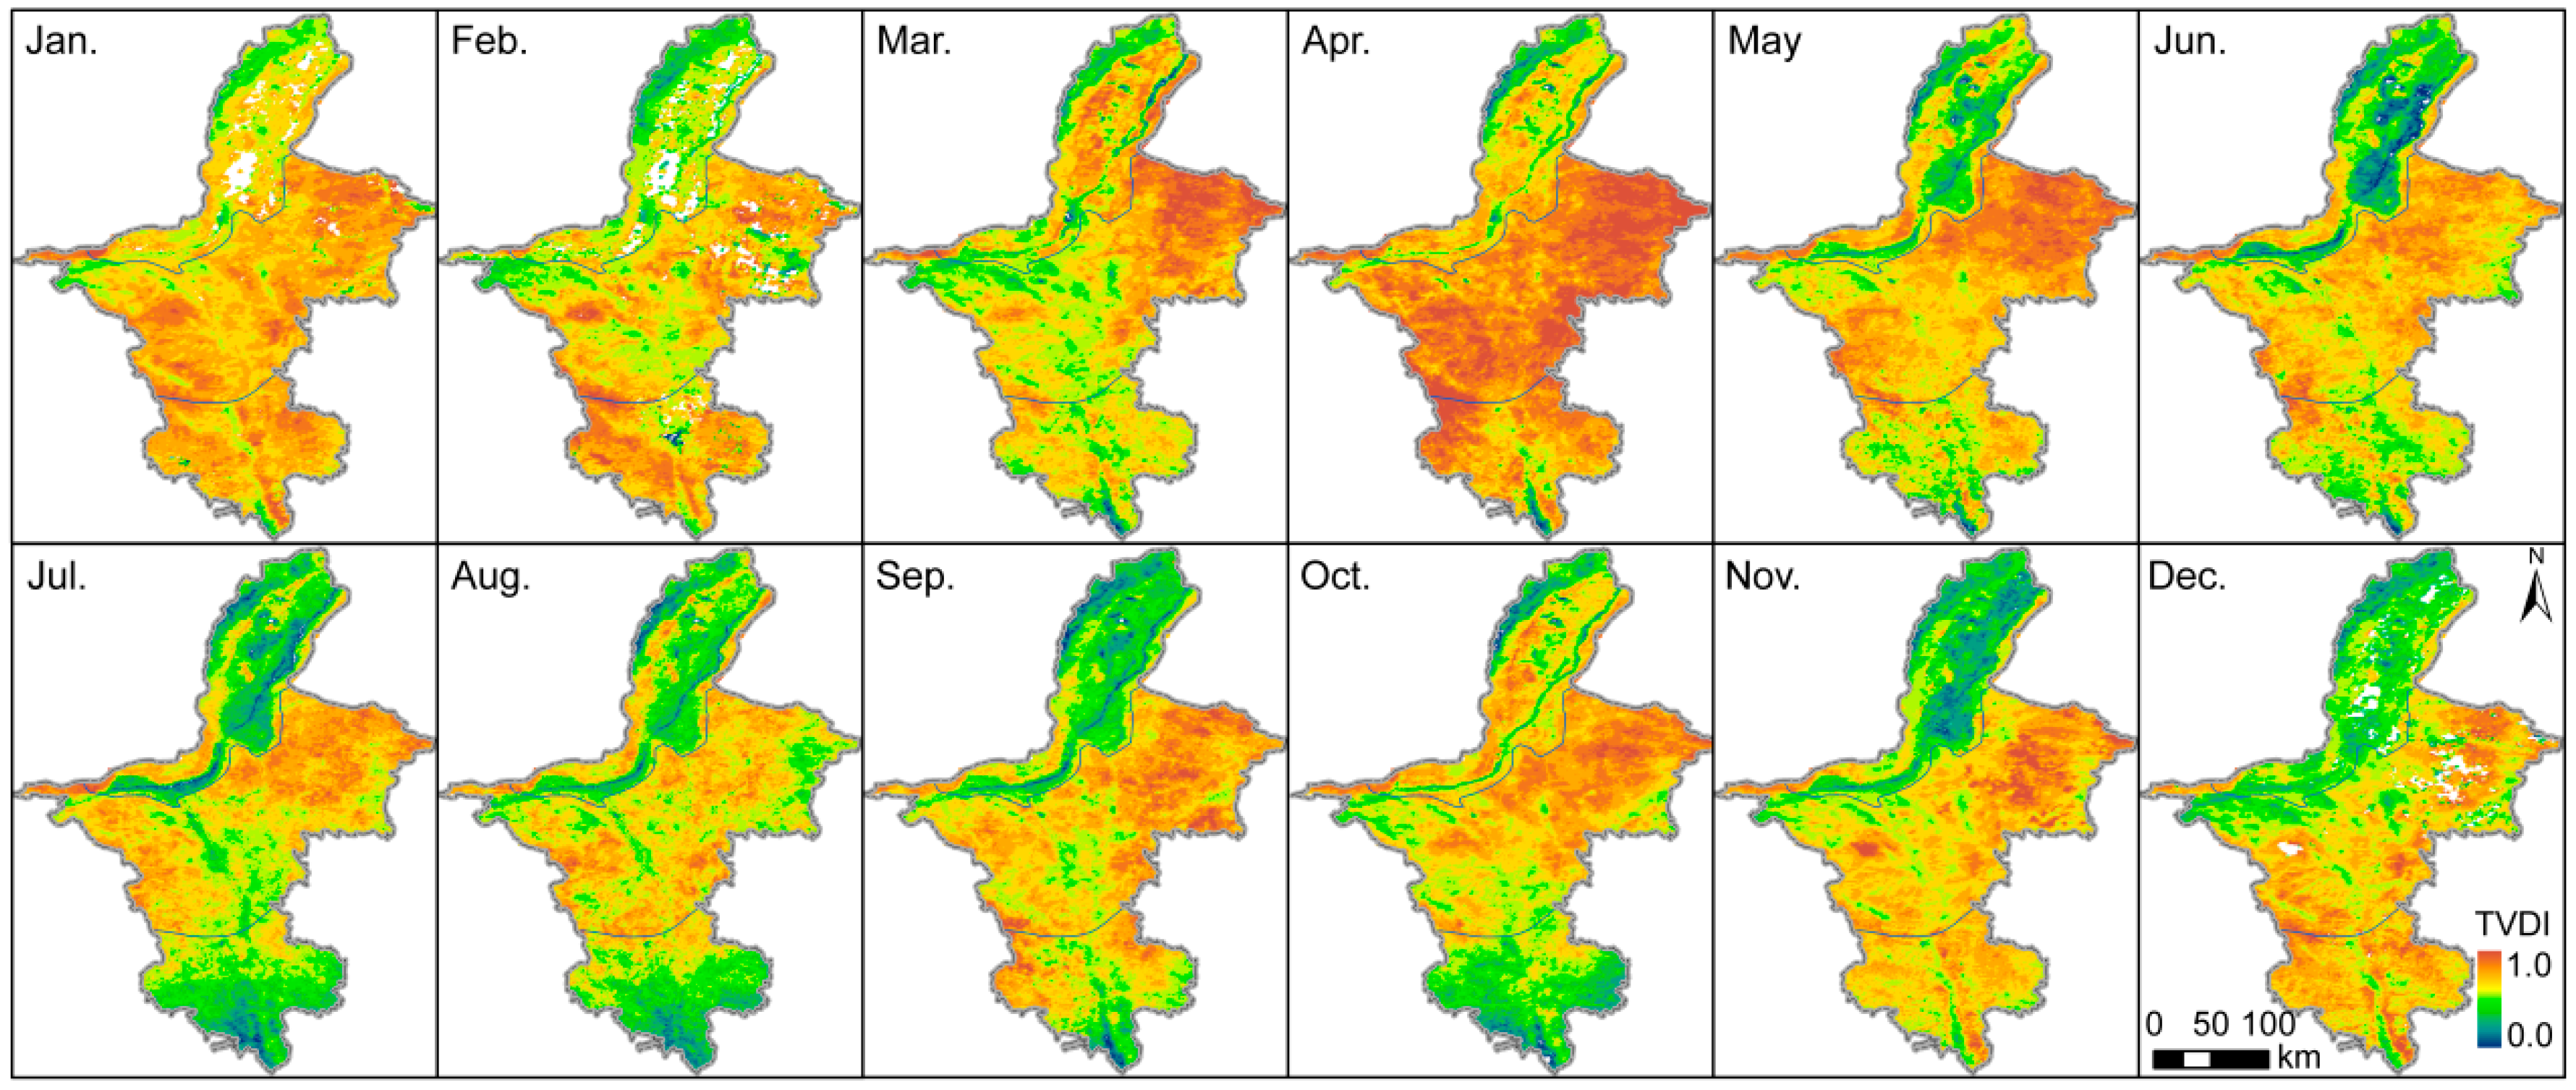
4.4. Spatial and Temporal Variation of TVDI and TVDIm
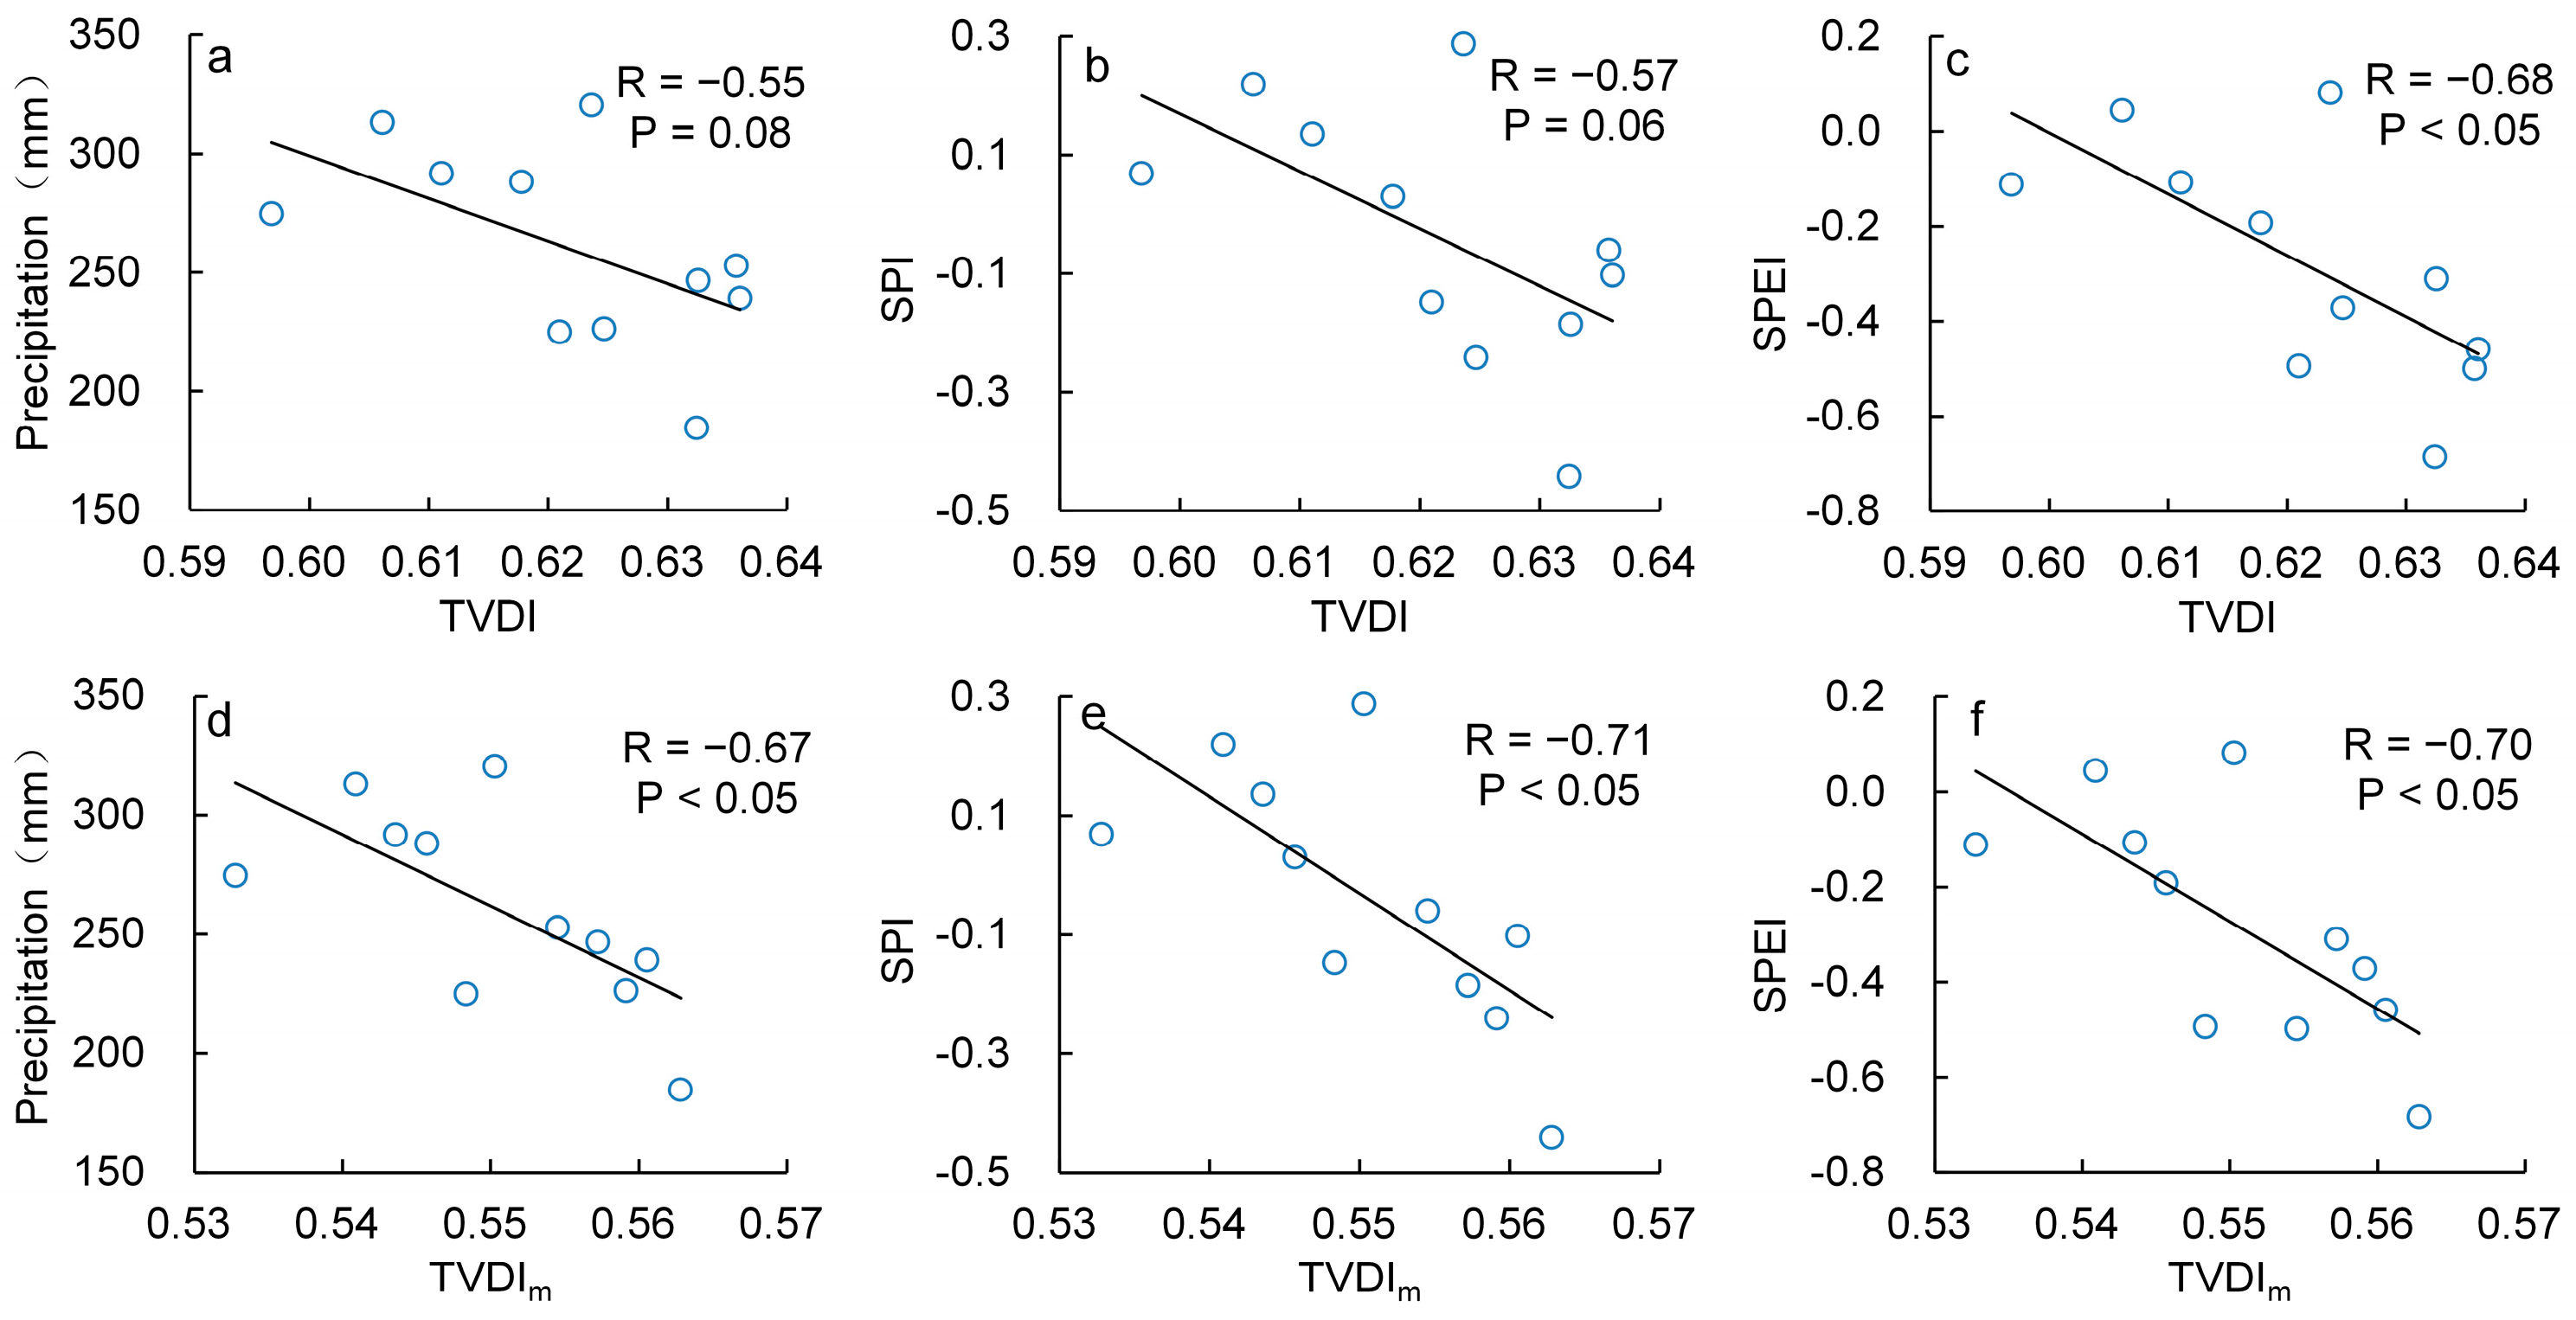
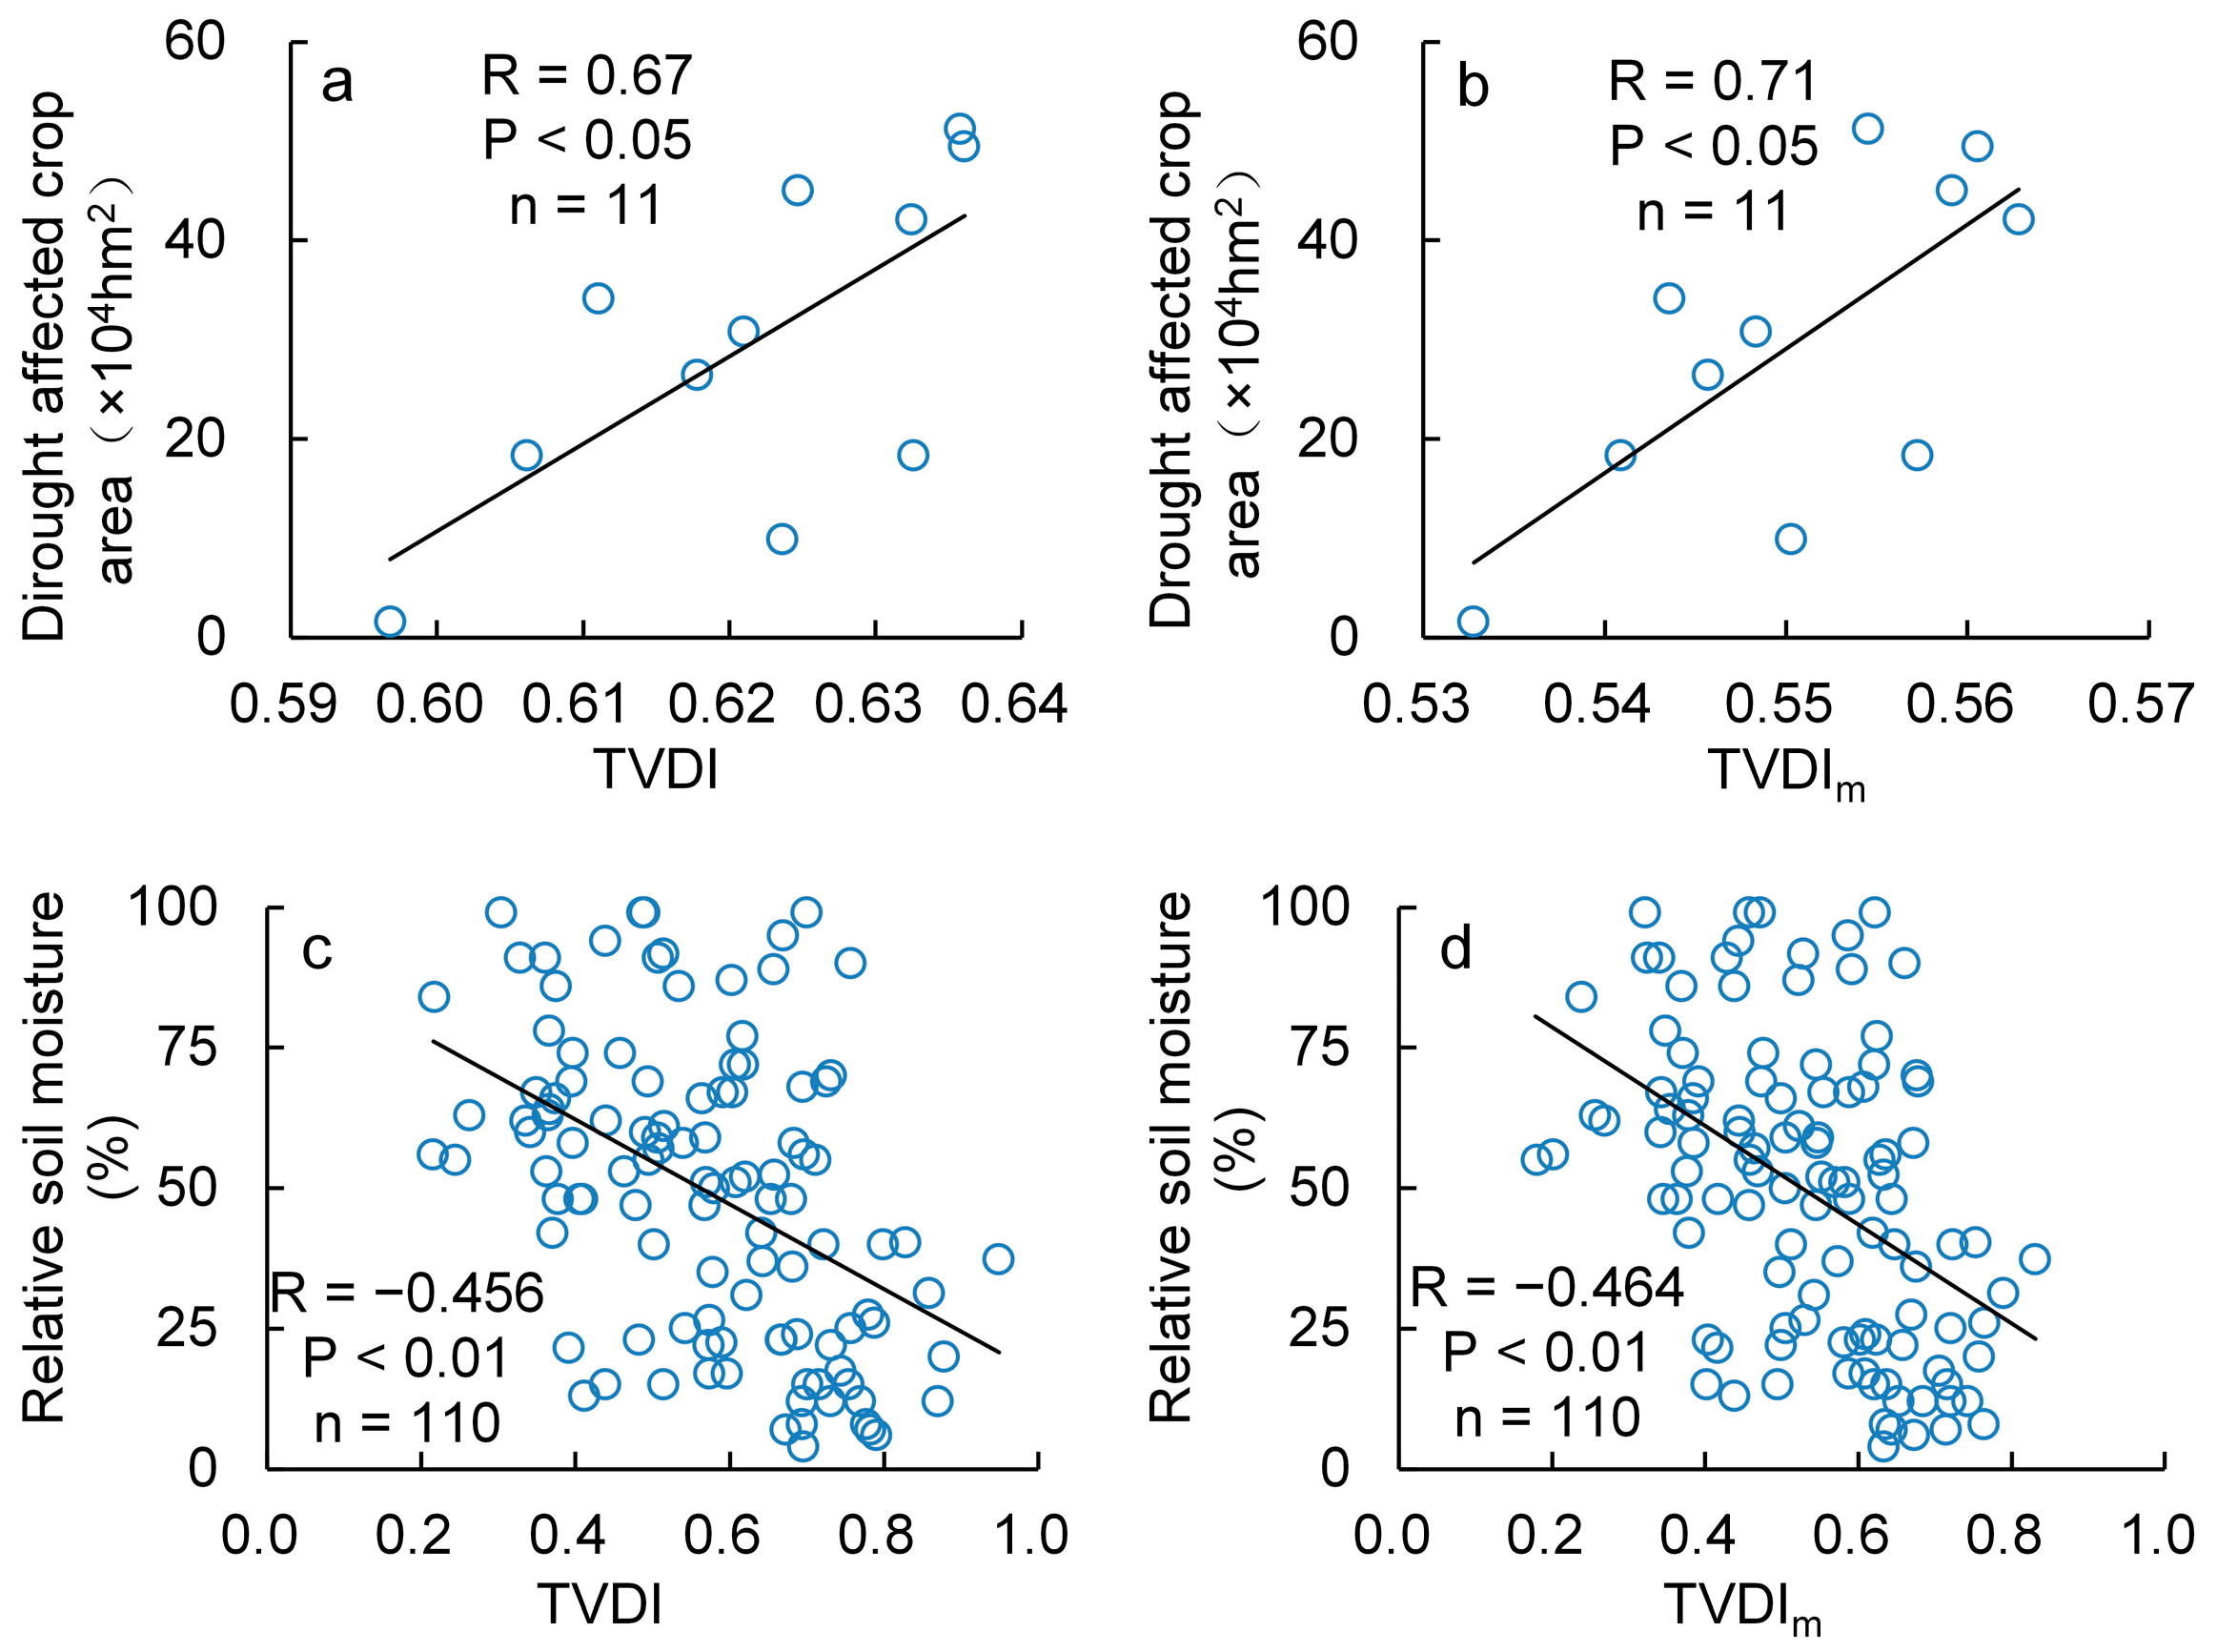
The monthly drought monitoring maps from 2000 to 2010 were produced by the TVDI and TVDIm models. The drought monitoring maps in 2005, one of the driest years of the past decade, is shown as an example in Figure 9 and Figure 10. The results indicate that a serious drought developed in 2005, and the regions that were affected by the drought are the middle, eastern, and southern parts of Ningxia Province. The onset, duration, and extent of the drought are reflected in the TVDI and TVDIm maps, and these results are in accordance with the historical record of drought in Ningxia Province, but the severity of the drought in each pixel is different in the two types of maps. The original TVDI maps (Figure 9) illustrate a more serious drought situation than do the TVDIm maps (Figure 10). This is because the original TVDI model estimates dry edges that are lower than the theoretical values of the driest points, resulting in a “tail down” phenomenon (Figure 2).
The TVDI and TVDIm time series suggest that the spatial drought characteristics are different in three typical ecosystem regions. Severe drought, with high frequency and intensity, usually occurred in the arid zone of middle Ningxia. The mountainous area of southern Ningxia was moderately affected by drought, as drought there occurred with lower frequency and intensity. By contrast, the Yellow River irrigation area of northern Ningxia was slightly affected by drought over the past 10 years, as it is a typical inland oasis and that is irrigated by the Yellow River. The forested regions of the Liupan Mountains in the south and the Helan Mountains in the north were also less affected by drought because these ecosystems can adjust their soil moisture and hydrological cycles. From the perspective of the entire Ningxia Province, three extreme drought events occurred in 2000, 2005, and 2008 that were detected by the TVDIm time series (Figure 11); this result is consistent with previous reports [54]. Nevertheless, the curve of the TVDI results from 2000 to 2010 shows that the extreme drought events in 2000, 2005, and 2008 cannot be detected clearly. This result could suggest that the drought situation is elevated to more serious levels in normal years and lesser levels in dry years by TVDI (Figure 11).

4.5. Validation

To assess the performances of TVDI and TVDIm in drought monitoring, a validation experiment was carried out using in situ observation data and a meteorological drought index. The yearly TVDI and TVDIm values calculated from pixel averages in the images were used to perform a correlation analysis with annual precipitation and two typical meteorological drought indices, including SPI and SPEI. In this study, the average values of monthly SPI and SPEI calculated using precipitation and temperature data from nine in situ stations were used to indicate the meteorological drought intensity of Ningxia Province, and the annual mean SPI and SPEI were calculated for the validation experiment. The results show that TVDI and TVDIm both have negative correlations with the precipitation, SPI, and SPEI (Figure 12). Thus, lower rainfall and more severe meteorological drought could cause TVDI and TVDIm to increase. The correlation coefficients of TVDI with precipitation, SPI, and SPEI (R values) are −0.55, −0.57, and −0.68, respectively, and only the R value of TVDI between SPEI passed the significance test (p-value < 0.05). However, the negative correlation coefficients of TVDIm with precipitation, SPI, and SPEI are −0.67, −0.71, and −0.70, respectively, and all of them passed the significance test (p-value < 0.05). This suggests that the improved temperature vegetation dryness index can effectively reflect the rainfall deficit in the context of meteorological drought and is more suitable for drought monitoring than the original TVDI in semi-arid regions of China.
Meanwhile, from the aspect of agricultural drought monitoring, a validation was carried out using the drought-affected crop area and relative soil moisture data. Because the conceptual definition of drought is an extended period of deficient precipitation resulting in extensive damage to crops and loss of yield, the drought-affected crop area proved to be a direct parameter that can measure agricultural drought intensity at the regional scale. Therefore, a correlation analysis between TVDI, TVDIm, and drought-affected crop area was performed. The results show that TVDI and TVDIm have statistically significant positive correlations (p-value < 0.05) with drought-affected crop area (Figure 13a,b). However, the correlation coefficient between TVDIm and drought-affected crop area is 0.71, which is higher than the corresponding correlation coefficient between TVDI and drought-affected crop area. This proves that the TVDIm performed better in agricultural drought monitoring than the previous TVDI model, and the variation in TVDIm reflects the drought influence on agriculture more appropriately.
A validation experiment was also performed using relative soil moisture data in 2005. There are 15 agricultural meteorological stations in Ningxia Province, but some stations do not observe soil moisture data in the winter season. Therefore, only 110 observed monthly relative soil moisture data points were used to perform the correlation analysis with TVDI and TVDIm (Figure 13c,d). The results show that both TVDI and TVDIm have statistically significant negative correlations (p-value < 0.01) with in situ relative soil moisture. The TVDIm exhibited a slightly higher correlation with in situ relative soil moisture, and the R value improved from −0.456 to −0.464. All these validation results indicate that the improved temperature vegetation dryness index exhibits better performance in drought monitoring compared to the original TVDI in semi-arid regions of China.

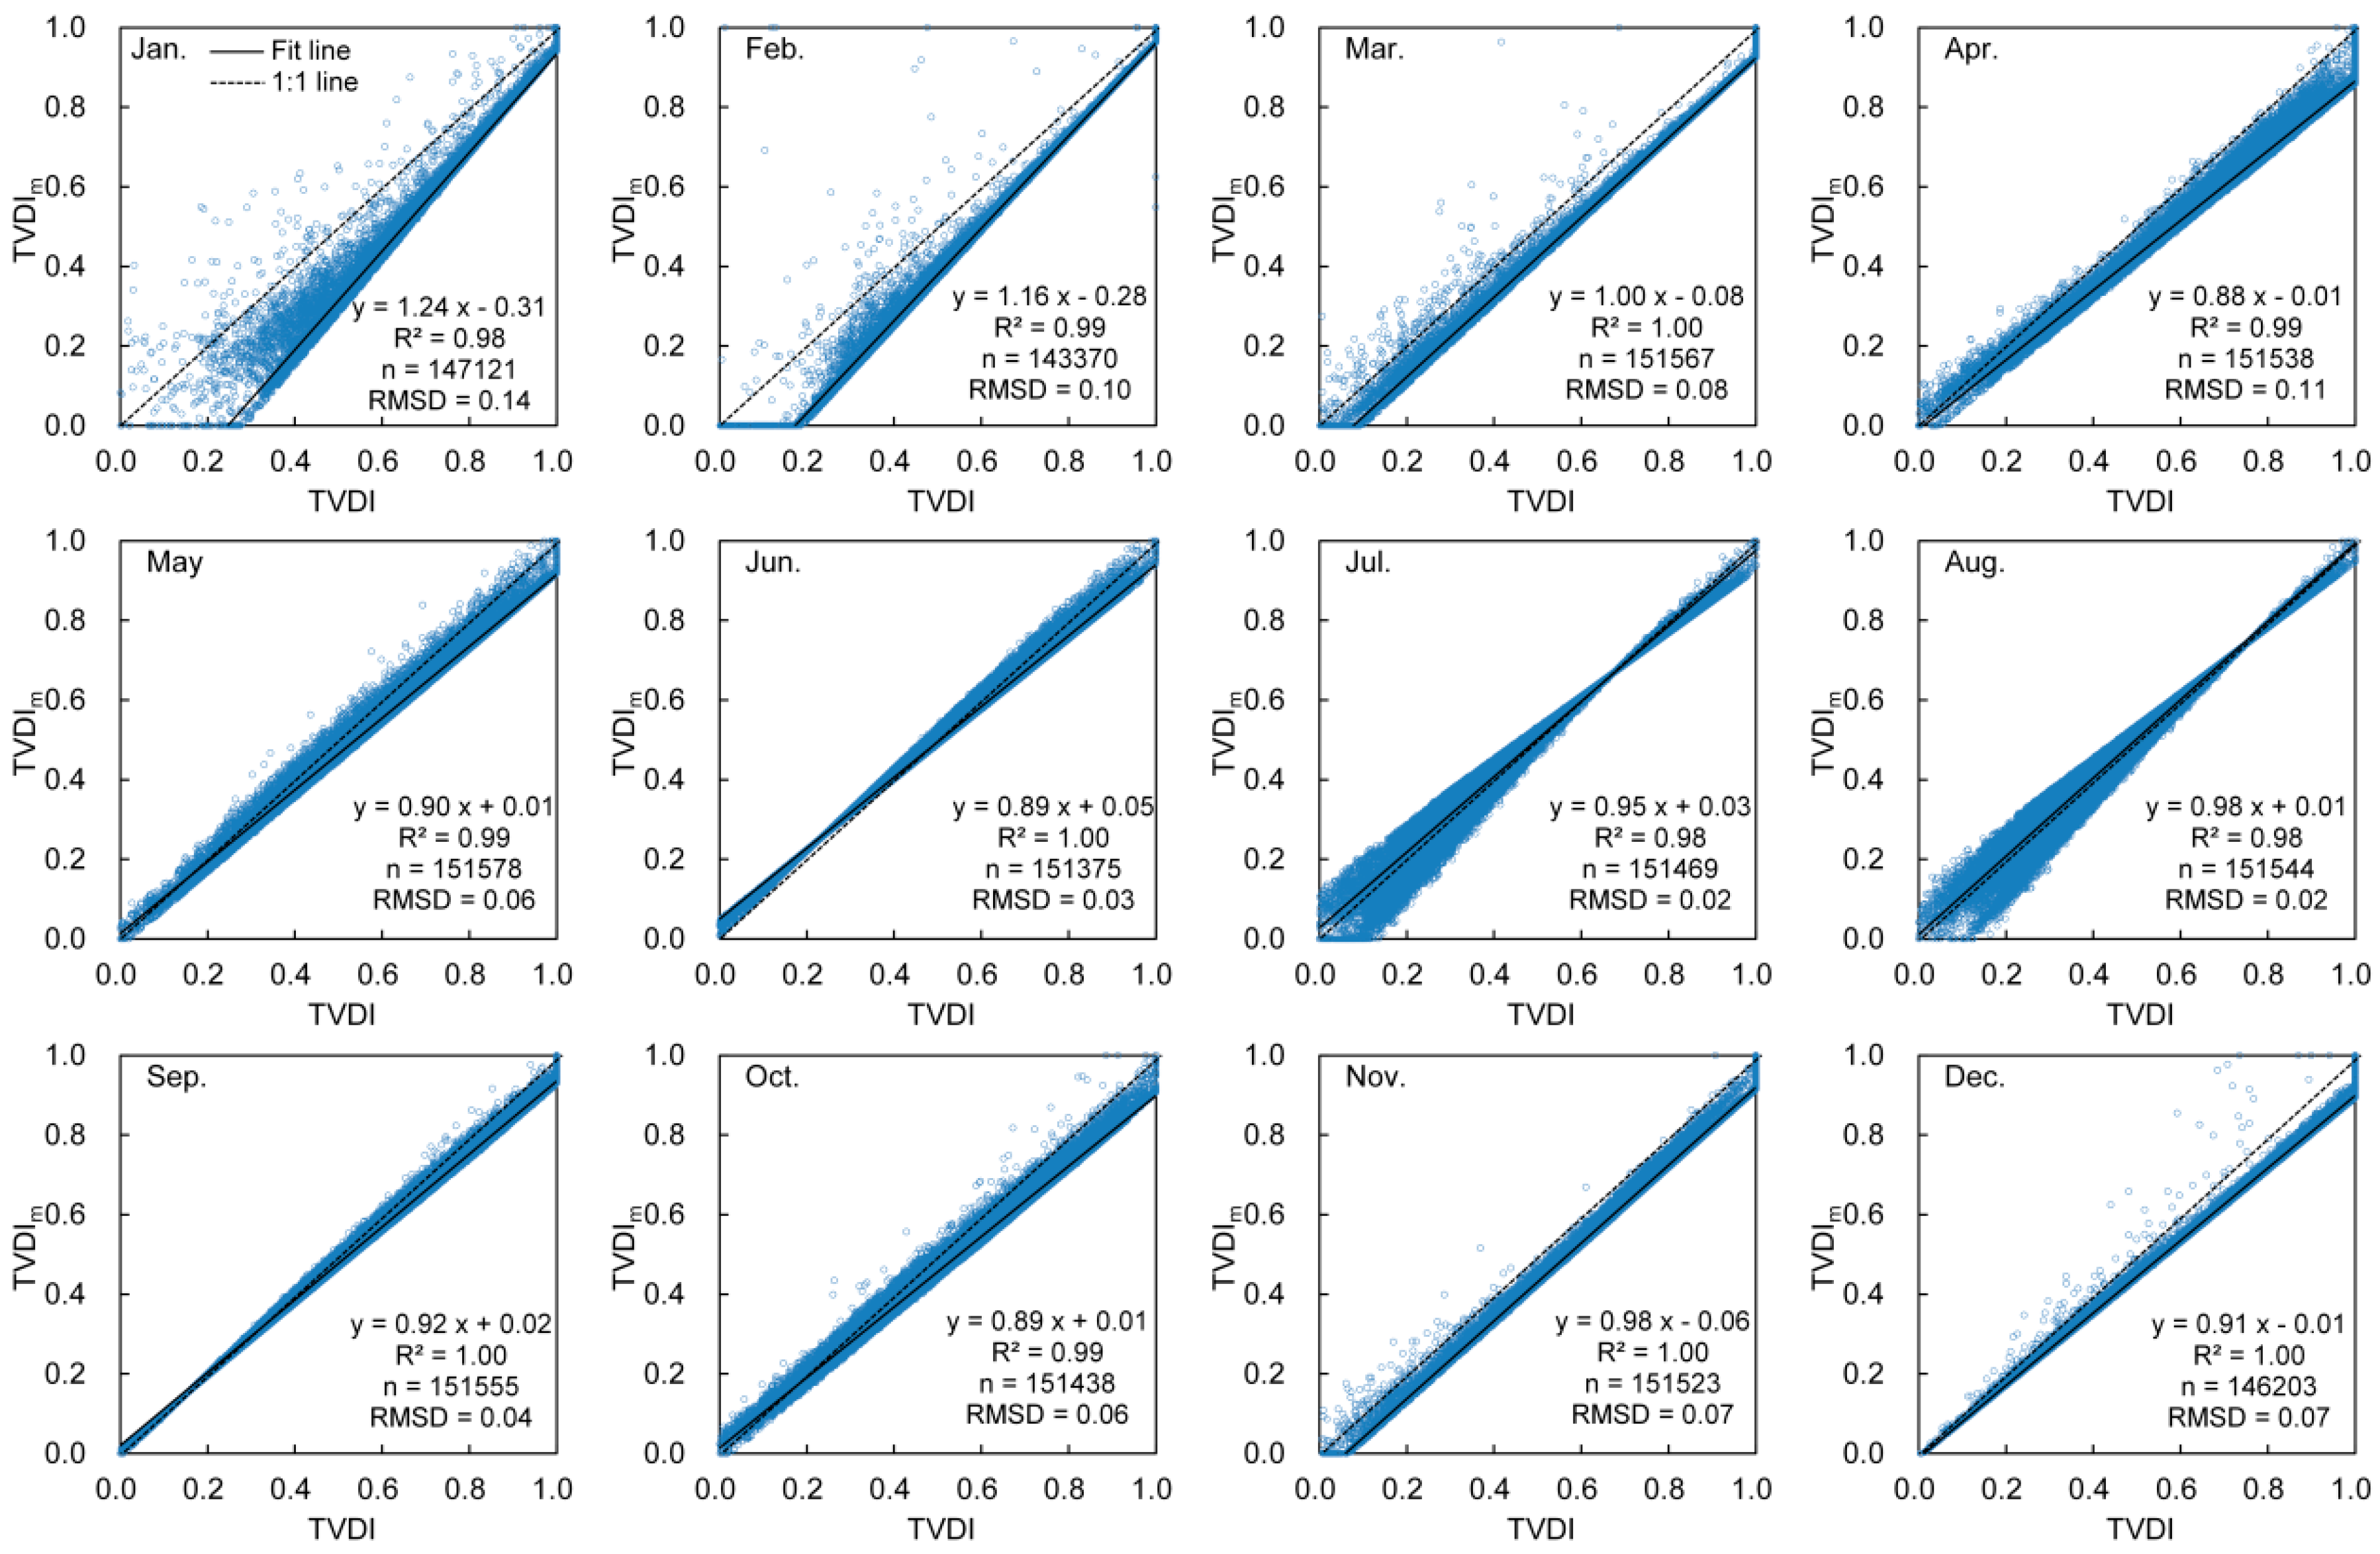
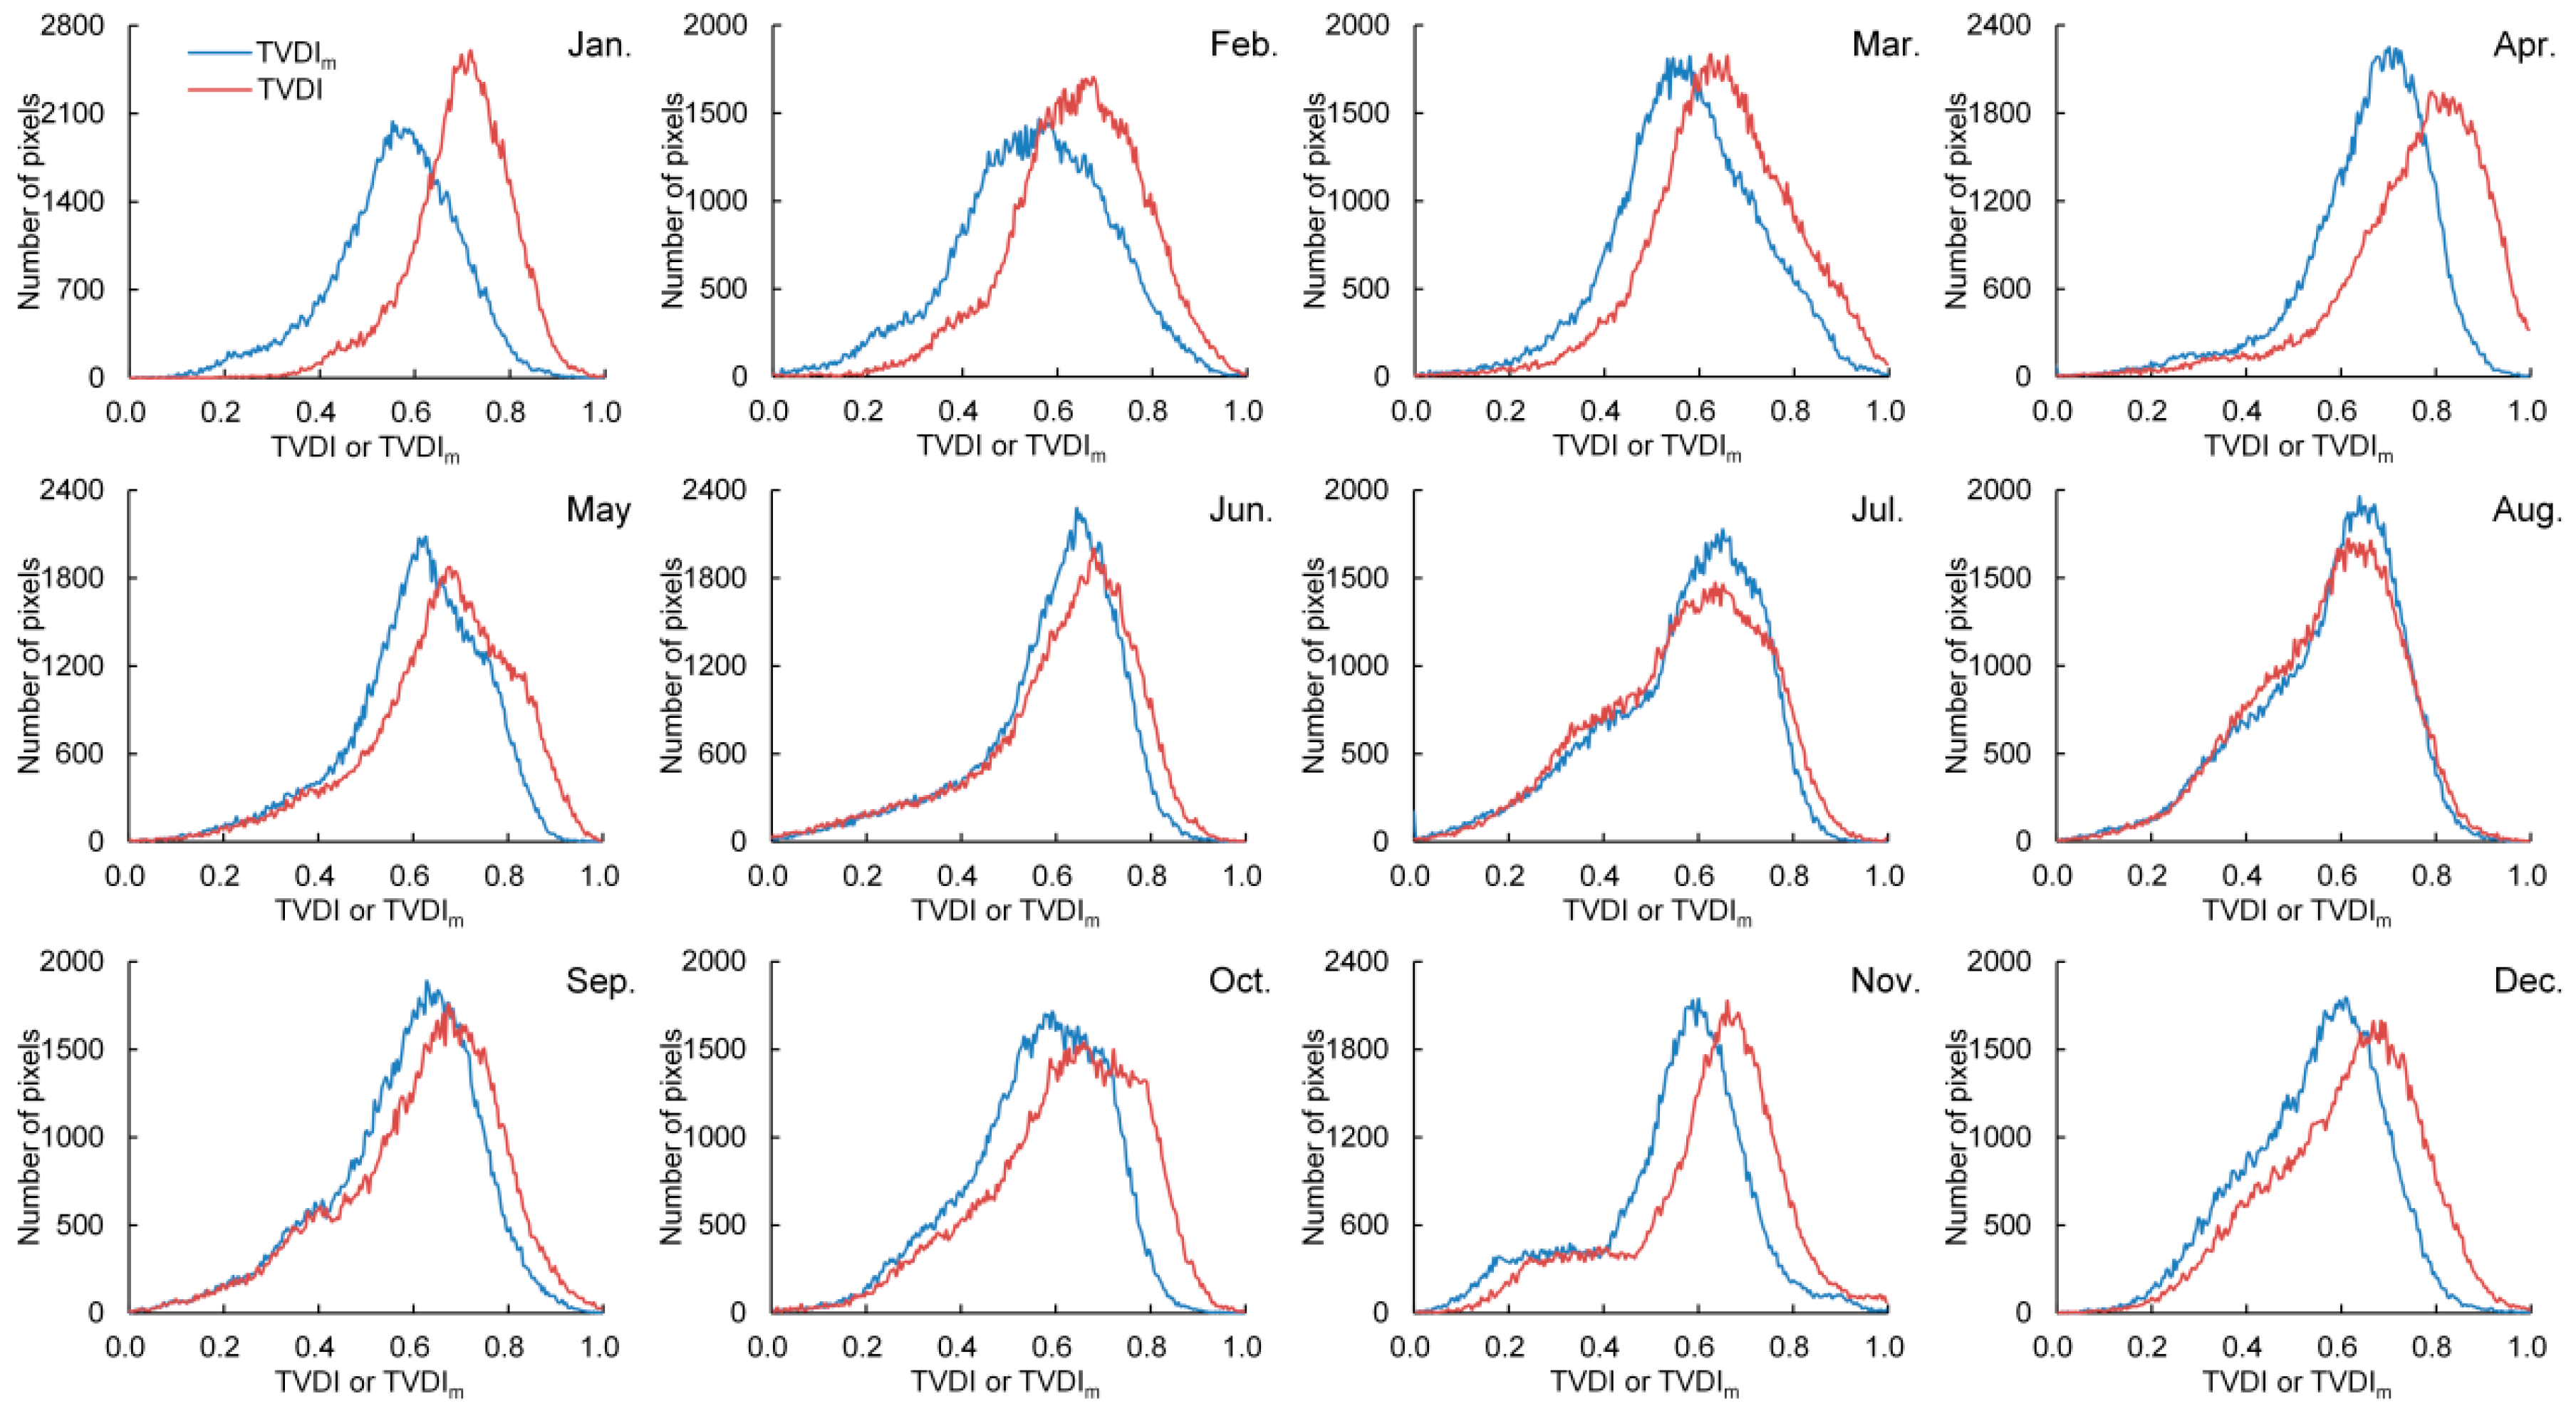
4.6. Comparison of TVDI and TVDIm in Pixels

The histograms of TVDI and TVDIm in 2005 were calculated (Figure 14). Compared with the histogram of TVDI, the statistical distribution of TVDIm shifts from high to low in most months, but the magnitude of the shift varies in each month. The most obvious shifting occurred in January, February, and April; moderate shifting occurred in March, May, October, November, and December; and the smallest shifts occurred in June, July, August, and September. This result was verified by the scatterplots of TVDI and TVDIm (Figure 15). TVDI and TVDIm were then compared at the pixel scale, and the Root Mean Square Deviation (RMSD) between TVDI and TVDIm was used to compare the differences between them. Excluding invalid pixels, there are approximately 143,370 to 151,578 pairs of pixels in TVDI and TVDIm images in each month. The RMSD between TVDI and TVDIm is in the range of 0.02–0.14. Nevertheless, the RMSD values in January, February, and April are equal or greater than 0.1; the RMSD values in March, May, October, November, and December are between 0.05 and 0.1; and the RMSD values in June, July, August, and September are less than 0.05.

5. Discussion

TVDI combines information from NDVI and LST and can provide more complete information on soil moisture at the land surface [18], so it is widely implemented over a variety of ecosystems worldwide to monitor drought because TVDI is based on satellite-derived information only [22,30,31]. The method assumed that variations in LST for a given vegetation index (NDVI) are primarily caused by different soil moisture availabilities rather than differences in air and canopy temperature [36]. However, the LST values derived from satellite data are mixed and contain information from the air and the canopy, which causes LST to vary with terrain and latitude in the middle–high latitude of the northern hemisphere. The difference in land surface temperature between day and night (∆LST) of MODIS was used as an alternative of LST to build TVDI model in this study, which proved that the improved method can eliminate the influence of terrain and latitude variation on LST. Although the ∆LST was adopted by Wang et al. (2006) [49] when the evaporative fraction (EF) was estimated under the concept of Ts/VI space and compared with Ts and Ts-Ta in the Senegal River basin [23] and the Canadian Prairies [51], the effectiveness of ∆LST in eliminating the influence of terrain and latitude variation had not been proved in practice until this study. Theoretically, ∆LST is a daily LST rising and is more sensible than Ts to heat flux, and the mean error in the thermal information of LST is reduced by the subtracting process, which lead to that ∆LST is more sensitive to soil moisture change [23]. Compared with other methods that correct LST with DEM and air temperature [30,31,48], using ∆LST as an alternative to LST is a simple and effective method when a local TVDI model is built in semi-arid regions.
Although the Ts/VI space, known as the triangle method [27], has a theoretical basis and biophysical properties [26], the dry and wet edge determination is still influenced by vegetation type and numbers of pixel of NDVI (or LST) in a certain study area [17] and generally involves a large degree of uncertainty [36]. Meanwhile, the original Ts/VI slopes obtained at local scales cannot be applied to TVDI models at large spatial scales [17]. In this work, for increasing the probability of finding the dryness extreme and wetness extreme pixels, a semi-arid region with about 143,000 to 151,700 NDVI/∆LST pixels was used to create triangle scatterplots. However, the dryness extreme and wetness extreme pixels in each vegetation coverage are still hard to find thoroughly, which could lead to a deviation in the simulated dry/wet edges from theoretical dry/wet edges (Figure 2). In this study, a statistical method was proposed to detect the noise pixels in observed ∆LSTmin and an empirical method was used to avoid the “tail down” phenomenon in observed ∆LSTmax. The basic assumption is that most of the real dryness extreme and wetness extreme pixels could decide the actual isolines of dry and wet edges. The simulation results of TVDIm under different NDVI/∆LST conditions also proved that the improved dry/wet edges promote the performance of the TVDI model, especially in areas of complex land cover.
TVDIm does not show a more favorable correlation with the in situ relative soil moisture than TVDI, although the R value showed a small improvement. On the one hand, the observed relative soil moisture is incompatible with the MODIS pixel value [24] because soil moisture is collected from the point while the MODIS pixel value represents an area in square kilometers. On the other hand, only the relative soil moisture data in 2005 were used to validate the TVDI and TVDIm model because there are not enough observed data in local stations. However, other validations show that TVDIm has a better performance in drought monitoring than the TVDI in semi-arid regions of China. In this study, the TVDI and TVDIm model were built and used to monitor drought only at the monthly scale. At the 16-day, eight-day or daily scale, this method is still needed for study and validation. Compared with the common TVDI model that was proposed by Sandholt et al. [18], one of the improvements to the TVDIm in this study is the simulation method of dry/wet edges. Nevertheless, the simulation method is based on the statistical characteristics of NDVI/∆LST data in a specific study area, which limits the universality of the TVDIm model. Meanwhile, the “tail down” phenomenon in observed ∆LSTmax was detected by a descriptive statistical method and the peak value of ∆LSTmax (the turning point of dry edges) is decided by the specific NDVI and ∆LST data. Maybe this phenomenon does not exist in other region. The performance of the TVDIm model for drought monitoring in other climate regimes with higher vegetation coverage needs to be evaluated in the future. As with many remote-sensing-based drought indexes, there is little consideration of the influence of human factors such as irrigation in the TVDIm model. Irrigation also can increase soil moisture and lessen the chances of agricultural drought, and this impact is difficult to distinguish from natural spheres when a remote-sensing-based drought index is used to monitor the drought process.

6. Conclusions

In this study, TVDI and TVDIm were applied for drought monitoring in semi-arid regions of China and compared. Additionally, their performances for meteorological and agricultural drought monitoring were validated. The relationships between TVDI and TVDIm were also analyzed.
First, the difference in land surface temperature between day and night (∆LST), which was derived by MODIS on the Terra satellite, was used to build the TVDI model. This is a favorable alternative to LST because it is less affected by variations in terrain and latitude, especially in semi-arid regions in China. The scatterplots of NDVI pixels against the corresponding ∆LST values are typically triangular, and the ∆LSTmax/∆LSTmin points were used to build the dry/wet edge model.
Second, an improvement was made in the simulation of dry/wet edges, improving the performance of the TVDI model. The improved wet edges, with outliers removed using a statistical method, are closer to the theoretical wet edge isolines, which are constant in different vegetation coverage. In addition, the improved dry edges optimized the goodness of fit of the linear regression equation, and the coefficients of determination increased.
Third, the original TVDI and TVDIm can both be used to monitor temporal and spatial variations of drought, including the onset, duration, extent, and severity of drought, using TVDI and TVDIm maps. Although the magnitude of TVDI is higher than that of TVDIm, the extreme drought events in 2000, 2005, and 2008 could not be detected clearly by TVDI in Ningxia Province, China.
Finally, although the TVDI is significantly correlated with all the in situ meteorological drought index and agricultural drought statistical data except precipitation and SPI, the TVDIm has higher coefficients of correlation with these data and passed all the significance tests (p-value < 0.05). The improved temperature vegetation dryness index, TVDIm, exhibits better performance in both meteorological and agricultural drought monitoring compared to the original TVDI in semi-arid regions of China.

Acknowledgments

This work was supported by the National Science Foundation of China (Grant Nos. 41201438 and 41661003), the Natural Science Foundation of Ningxia (Grant No. NX16010), and the Key Project of Scientific Research in Ningxia Colleges and Universities (Grant No. NGY2016074). We are also grateful to the anonymous reviewers for their valuable comments and recommendations, which greatly helped us in improving the original version of the manuscript.

Author Contributions

Lingtong Du and Naiping Song conceived the main idea and designed the model; Ke Liu, Jing Hou, Yue Hu, and Yuguo Zhu built the model and analyzed the data; Xinyun Wang, Lei Wang, and Yige Guo compiled and validated the model; and Lingtong Du wrote the paper, which was improved by the contributions of all of the co-authors.

Conflicts of Interest

The authors declare no conflict of interest.

References

  1. Du, L.; Tian, Q.; Yu, T.; Meng, Q.; Jancso, T.; Udvardy, P.; Huang, Y. A comprehensive drought monitoring method integrating modis and trmm data. Int. J. Appl. Earth Obs. 2013, 23, 245–253. [Google Scholar] [CrossRef]
  2. Obasi, G.P. WMO’s role in the international decade for natural disaster reduction. Bull. Am. Meteorol. Soc. 1994, 75, 1655–1661. [Google Scholar] [CrossRef]
  3. Begueria, S.; Vicente-Serrano, S.M.; Martinez, A. A multiscalar global drought dataset: The speibase: A new gridded product for the analysis of drought variability and impacts. Bull. Am. Meteorol. Soc. 2010, 91, 1351–1356. [Google Scholar] [CrossRef]
  4. Mishra, A.K.; Singh, V.P. A review of drought concepts. J. Hydrol. 2010, 391, 202–216. [Google Scholar] [CrossRef]
  5. Heim, R.R. A review of twentieth-century drought indices used in the united states. Bull. Am. Meteorol. Soc. 2002, 83, 1149–1166. [Google Scholar]
  6. Mu, Q.; Zhao, M.; Kimball, J.S.; McDowell, N.G.; Running, S.W. A remotely sensed global terrestrial drought severity index. Bull. Am. Meteorol. Soc. 2013, 94, 83–98. [Google Scholar] [CrossRef]
  7. Niemeyer, S. New drought indices. Options Méditerr. Sér. A 2008, 80, 267–274. [Google Scholar]
  8. Palmer, W.C. Meteorological Drought; US Department of Commerce, Weather Bureau: Washington, DC, USA, 1965.
  9. McKee, T.B.; Doesken, N.J.; Kleist, J. The Relationship of Drought Frequency and Duration to Time Scales. In Proceedings of the 8th Conference of Applied Climatology, Anaheim, CA, USA, 17–22 January 1993.
  10. McKee, T.B.; Doesken, N.J.; Kleist, J. Drought Monitoring with Multiple Time Scales. In Proceedings of the 9th AMS Conference of Applied Climatology, Dallas, TX, USA, 15–20 January 1995.
  11. Vicente-Serrano, S.M.; Beguería, S.; López-Moreno, J.I. A multiscalar drought index sensitive to global warming: The standardized precipitation evapotranspiration index. J. Clim. 2009, 23, 1696–1718. [Google Scholar] [CrossRef]
  12. Kogan, F.N. Droughts of the late 1980s in the United States as derived from NOAA polar-orbiting satellite data. Bull. Am. Meteorol. Soc. 1995, 76, 655–668. [Google Scholar] [CrossRef]
  13. Liu, W.T.; Kogan, F.N. Monitoring regional drought using the vegetation condition index. Int. J. Remote Sens. 1996, 17, 2761–2782. [Google Scholar] [CrossRef]
  14. Kogan, F. Application of vegetation index and brightness temperature for drought detection. Adv. Space Res. 1995, 15, 91–100. [Google Scholar] [CrossRef]
  15. Kogan, F. World droughts in the new millennium from AVHRR-based vegetation health indices. EOS Trans. Am. Geophys. Union 2002, 83, 557–572. [Google Scholar] [CrossRef]
  16. Rhee, J.; Im, J.; Carbone, G.J. Monitoring agricultural drought for arid and humid regions using multi-sensor remote sensing data. Remote Sens. Environ. 2010, 114, 2875–2887. [Google Scholar] [CrossRef]
  17. Petropoulos, G.P.; Ireland, G.; Barrett, B. Surface soil moisture retrievals from remote sensing: Current status, products & future trends. Phys. Chem. Earth 2015, 83–84, 36–56. [Google Scholar]
  18. Sandholt, I.; Rasmussen, K.; Andersen, J. A simple interpretation of the surface temperature/vegetation index space for assessment of surface moisture status. Remote Sens. Environ. 2002, 79, 213–224. [Google Scholar] [CrossRef]
  19. Holzman, M.E.; Rivas, R.; Piccolo, M.C. Estimating soil moisture and the relationship with crop yield using surface temperature and vegetation index. Int. J. Appl. Earth Obs. 2014, 28, 181–192. [Google Scholar] [CrossRef]
  20. Liang, L.; Zhao, S.; Qin, Z.; He, K.; Chen, C.; Luo, Y.; Zhou, X. Drought change trend using modis tvdi and its relationship with climate factors in china from 2001 to 2010. J. Integr. Agric. 2014, 13, 1501–1508. [Google Scholar] [CrossRef]
  21. Patel, N.R.; Anapashsha, R.; Kumar, S.; Saha, S.K.; Dadhwal, V.K. Assessing potential of modis derived temperature/vegetation condition index (TVDI) to infer soil moisture status. Int. J. Remote Sens. 2009, 30, 23–39. [Google Scholar] [CrossRef]
  22. Son, N.T.; Chen, C.F.; Chen, C.R.; Chang, L.Y.; Minh, V.Q. Monitoring agricultural drought in the Lower Mekong Basin using MODIS NDVI and land surface temperature data. Int. J. Appl. Earth Obs. 2012, 18, 417–427. [Google Scholar] [CrossRef]
  23. Stisen, S.; Sandholt, I.; Nørgaard, A.; Fensholt, R.; Jensen, K.H. Combining the triangle method with thermal inertia to estimate regional evapotranspiration—Applied to MSG-SEVIRI data in the Senegal river basin. Remote Sens. Environ. 2008, 112, 1242–1255. [Google Scholar] [CrossRef]
  24. Sun, L.; Sun, R.; Li, X.; Liang, S.; Zhang, R. Monitoring surface soil moisture status based on remotely sensed surface temperature and vegetation index information. Agric. For. Meteorol. 2012, 166–167, 175–187. [Google Scholar] [CrossRef]
  25. Mallick, K.; Bhattacharya, B.K.; Patel, N.K. Estimating volumetric surface moisture content for cropped soils using a soil wetness index based on surface temperature and NDVI. Agric. For. Meteorol. 2009, 149, 1327–1342. [Google Scholar] [CrossRef]
  26. Petropoulos, G.; Carlson, T.N.; Wooster, M.J.; Islam, S. A review of Ts/VI remote sensing based methods for the retrieval of land surface energy fluxes and soil surface moisture. Prog. Phys. Geogr. 2009, 33, 224–250. [Google Scholar] [CrossRef]
  27. Carlson, T. An overview of the “triangle method” for estimating surface evapotranspiration and soil moisture from satellite imagery. Sensors 2007, 7, 1612–1629. [Google Scholar] [CrossRef]
  28. Wan, Z.; Wang, P.; Li, X. Using MODIS Land Surface Temperature and Normalized Difference Vegetation Index products for monitoring drought in the southern Great Plains, USA. Int. J. Remote Sens. 2004, 25, 61–72. [Google Scholar] [CrossRef]
  29. Gao, Z.; Gao, W.; Chang, N.-B. Integrating temperature vegetation dryness index (TVDI) and regional water stress index (RWSI) for drought assessment with the aid of LANDSAT TM/ETM+ images. Int. J. Appl. Earth Obs. 2011, 13, 495–503. [Google Scholar] [CrossRef]
  30. Hassan, Q.; Bourque, C.; Meng, F.-R.; Cox, R. A wetness index using terrain-corrected surface temperature and normalized difference vegetation index derived from standard MODIS products: An evaluation of its use in a humid forest-dominated region of eastern Canada. Sensors 2007, 7, 2028–2048. [Google Scholar] [CrossRef]
  31. Rahimzadeh-Bajgiran, P.; Omasa, K.; Shimizu, Y. Comparative evaluation of the vegetation dryness index (VDI), the temperature vegetation dryness index (TVDI) and the improved TVDI (iTVDI) for water stress detection in semi-arid regions of Iran. ISPRS J. Photogramm. Remote Sens. 2012, 68, 1–12. [Google Scholar] [CrossRef]
  32. Chen, J.; Wang, C.; Jiang, H.; Mao, L.; Yu, Z. Estimating soil moisture using Temperature–Vegetation Dryness Index (TVDI) in the Huang-Huai-Hai (HHH) plain. Int. J. Remote Sens. 2011, 32, 1165–1177. [Google Scholar] [CrossRef]
  33. Huang, Y.; Tian, Q.; Du, L.; Sun, S. Analysis of spatial-temporal variation of agricultural drought and its response to ENSO over the past 30 years in the Huang-Huai-Hai region. Terr. Atmos. Ocean. Sci. 2013, 24, 745–759. [Google Scholar] [CrossRef]
  34. Zhang, F.; Zhang, L.; Shi, J.; Huang, J. Soil moisture monitoring based on Land Surface Temperature-Vegetation Index space derived from MODIS data. Pedosphere 2014, 24, 450–460. [Google Scholar] [CrossRef]
  35. Tian, J.; Su, H.; Sun, X.; Chen, S.; He, H.; Zhao, L. Impact of the spatial domain size on the performance of the Ts-Vi triangle method in terrestrial evapotranspiration estimation. Remote Sens. 2013, 5, 1998–2013. [Google Scholar] [CrossRef]
  36. Tang, R.; Li, Z.-L.; Tang, B. An application of the Ts–Vi triangle method with enhanced edges determination for evapotranspiration estimation from MODIS data in arid and semi-arid regions: Implementation and validation. Remote Sens. Environ. 2010, 114, 540–551. [Google Scholar] [CrossRef]
  37. Garcia, M.; Fernández, N.; Villagarcía, L.; Domingo, F.; Puigdefábregas, J.; Sandholt, I. Accuracy of the Temperature–Vegetation Dryness Index using MODIS under water-limited vs. energy-limited evapotranspiration conditions. Remote Sens. Environ. 2014, 149, 100–117. [Google Scholar] [CrossRef]
  38. Ghulam, A.; Qin, Q.; Teyip, T.; Li, Z.-L. Modified perpendicular drought index (MPDI): A real-time drought monitoring method. ISPRS J. Photogramm. Remote Sens. 2007, 62, 150–164. [Google Scholar] [CrossRef]
  39. Qin, Q.; Ghulam, A.; Zhu, L.; Wang, L.; Li, J.; Nan, P. Evaluation of MODIS derived Perpendicular Drought Index for estimation of surface dryness over northwestern China. Int. J. Remote Sens. 2008, 29, 1983–1995. [Google Scholar] [CrossRef]
  40. Tucker, C.J. Red and photographic infrared linear combinations for monitoring vegetation. Remote Sens. Environ. 1979, 8, 127–150. [Google Scholar] [CrossRef]
  41. Weiss, E.; Milich, L. Errors in a standard method for generating interannual NDVI coefficient of variation (COV) images. Int. J. Remote Sens. 1997, 18, 3743–3748. [Google Scholar] [CrossRef]
  42. Tucker, C.; D’Souza, D. History of the use of AVHRR data for land applications. In Advances in the Use of NOAA-AVHRR Data for Land Applications; Souza, G.D., Selward, A.S., Malingreau, J.P., Eds.; Kluwer Academic Publishers: Dordrecht, The Netherlands, 1996; pp. 1–19. [Google Scholar]
  43. Liu, W.T.; Juárez, R.I.N. ENSO drought onset prediction in northeast Brazil using NDVI. Int. J. Remote Sens. 2001, 22, 3483–3501. [Google Scholar] [CrossRef]
  44. Wang, J.; Price, K.P.; Rich, P.M. Spatial patterns of NDVI in response to precipitation and temperature in the Central Great Plains. Int. J. Remote Sens. 2001, 22, 3827–3844. [Google Scholar] [CrossRef]
  45. Gallo, K.; Ji, L.; Reed, B.; Dwyer, J.; Eidenshink, J. Comparison of MODIS and AVHRR 16-day Normalized Difference Vegetation Index composite data. Geophys. Res. Lett. 2004, 31. [Google Scholar] [CrossRef]
  46. Wan, Z.; Dozier, J. A generalized split-window algorithm for retrieving land-surface temperature from space. IEEE Trans. Geosci. Remote Sens. 1996, 34, 892–905. [Google Scholar]
  47. Moran, M.S.; Clarke, T.R.; Inoue, Y.; Vidal, A. Estimating crop water deficit using the relation between surface-air temperature and spectral vegetation index. Remote Sens. Environ. 1994, 49, 246–263. [Google Scholar] [CrossRef]
  48. Li, H.; Li, C.; Lin, Y.; Lei, Y. Surface temperature correction in TVDI to evaluate soil moisture over a large area. J. Food Agric. Environ. 2010, 8, 1141–1145. [Google Scholar]
  49. Wang, K.; Li, Z.; Cribb, M. Estimation of evaporative fraction from a combination of day and night land surface temperatures and NDVI: A new method to determine the Priestley–Taylor parameter. Remote Sens. Environ. 2006, 102, 293–305. [Google Scholar] [CrossRef]
  50. Shu, Y.; Stisen, S.; Jensen, K.H.; Sandholt, I. Estimation of regional evapotranspiration over the North China Plain using geostationary satellite data. Int. J. Appl. Earth Obs. 2011, 13, 192–206. [Google Scholar] [CrossRef]
  51. Rahimzadeh-Bajgiran, P.; Berg, A.A.; Champagne, C.; Omasa, K. Estimation of soil moisture using optical/thermal infrared remote sensing in the Canadian Prairies. ISPRS J. Photogramm. Remote Sens. 2013, 83, 94–103. [Google Scholar] [CrossRef]
  52. Spitzer, M.; Wildenhain, J.; Rappsilber, J.; Tyers, M. Boxplotr: A web tool for generation of box plots. Nat. Methods 2014, 11, 121–122. [Google Scholar] [CrossRef] [PubMed]
  53. Gebrehiwot, T.; van der Veen, A.; Maathuis, B. Spatial and temporal assessment of drought in the Northern Highlands of Ethiopia. Int. J. Appl. Earth Obs. 2011, 13, 309–321. [Google Scholar] [CrossRef]
  54. Du, L.; Jing, H.; Yue, H.; Wang, X.; Lei, W. Drought variation characteristics in Ningxia from 2000 to 2010 based on Temperature Vegetation Dryness Index by remote sensing. Trans. Chin. Soc. Agric. Eng. 2015, 31, 209–216. [Google Scholar]
Figure 1. The location of the study area and the Land use map in 2005 of Ningxia Province, China.
Remotesensing 09 00177 g001
Figure 2. Physical interpretation of the ∆LST/NDVI feature space and the definition of TVDI (adapted from [17,18]).
Remotesensing 09 00177 g002
Figure 3. Scatterplots and correlation coefficient R values between LST and elevation (a); LST and latitude (b); ∆LST and elevation (c); and ∆LST and latitude (d).
Remotesensing 09 00177 g003
Figure 4. The monthly dry (blue)/wet edges (red) and their fitting equations derived from scatterplots of NDVI and ∆LST in 2005.
Remotesensing 09 00177 g004
Figure 5. The monthly box plots of ∆LSTmin points and the separated outliers (cross dots) in 2005.
Remotesensing 09 00177 g005
Figure 6. The improved dry (blue)/wet edges (red) and their fitting equations in 2005.
Remotesensing 09 00177 g006
Figure 7. The simulated TVDI based on the original dry/wet edges in 2005.
Remotesensing 09 00177 g007
Figure 8. The simulated TVDIm based on the improved dry/wet edges in 2005.
Remotesensing 09 00177 g008
Figure 9. The drought map monitored by TVDI in Ningxia Province, China, in 2005 (white is invalid data).
Remotesensing 09 00177 g009
Figure 10. The drought map monitored by TVDIm in Ningxia Province, China, in 2005 (white is invalid data).
Remotesensing 09 00177 g010
Figure 11. TVDI (red line) and TVDIm (blue line) curves from 2000 to 2010 in Ningxia Province, China.
Remotesensing 09 00177 g011
Figure 12. The scatterplots and correlation coefficient R values between TVDI and precipitation (a); TVDI and SPI (b); TVDI and SPEI (c); TVDIm and precipitation (d); TVDIm and SPI (e); and TVDIm and SPEI (f).
Remotesensing 09 00177 g012
Figure 13. The scatterplots and correlation coefficient R values between TVDI (a); TVDIm (b); and drought affected crop area and TVDI (c); TVDIm (d), and relative soil moisture.
Remotesensing 09 00177 g013
Figure 14. Comparison of TVDI and TVDIm histograms in 2005.
Remotesensing 09 00177 g014
Figure 15. Scatterplots of TVDI and TVDIm and their relationship in 2005.
Remotesensing 09 00177 g015

