Article

Evaluation of Recently Released Open Global Digital Elevation Models of Hubei, China

1
School of Remote Sensing and Information Engineering, Wuhan University, Wuhan 430079, China
2
Lyles School of Civil Engineering, Purdue University, West Lafayette, IN 47907, USA
*
Author to whom correspondence should be addressed.
Remote Sens. 2017, 9(3), 262; https://doi.org/10.3390/rs9030262
Submission received: 8 September 2016 / Revised: 4 February 2017 / Accepted: 2 March 2017 / Published: 12 March 2017

Abstract

:
The recent release of worldwide SRTM 1 DEM and AW3D30 adds new members to the open global medium resolution (90–30 m ground spacing) digital elevation models. Together with the previously existing SRTM 3 and ASTER GDEM, their quality is of great interest to various scientific applications. This paper uses 1:50,000 DEM in Hubei Province of China as a reference to assess their vertical accuracy in terms of terrain types, slopes, and land cover. For ASTER GDEM and AW3D30, we further evaluate their accuracy in terms of the stack number, i.e., the number of scenes used to generate the DEM. It is found out that: (1) all of the DEMs have nearly the same horizontal offset due to the adoption of different datums; (2) the vertical accuracy varies in terms of terrain complexity, from ~5 m for plains, ~10 m for hills to ~20 m for mountains; (3) the vertical accuracy is negatively related to the tangent of terrain slope exponentially in forest areas and linearly in cultivated lands; (4) forest areas have the lowest vertical accuracy, comparing to built-up areas, wetland, and cultivate land areas while SRTM 1 and AW3D30 have the highest accuracy in all land cover classes; (5) the large elevation differences over forest areas are likely due to canopy coverage; and (6) for ASTER GDEM and AW3D30, their accuracy is in general positively related to the stack number. This study provides a practically useful quality specification and comprehensive understanding for these four global DEMs, especially the recently released worldwide SRTM 1 DEM and AW3D30.

Graphical Abstract

1. Introduction

The Digital Elevation Model (DEM) is a digital expression of actual terrain surface using regularly spaced elevation data. It is a crucial source for a wide range of applications, including but not limited to geographic information systems, civil engineering, earth science, resource planning and management, and topographic mapping. Such applications have raised increasing needs for inexpensive and accessible accurate DEMs of higher resolution, which ultimately led to the emergence of open (and free) DEMs, e.g., SRTM (Shuttle Radar Topography Mission) DEM, ASTER GDEM (Advanced Space Borne Thermal Emission and Reflection Radiometer Global Digital Elevation Model) and AW3D30 (ALOS World 3D—30 m). These open DEMs are becoming popular and making great contributions to both topographic (e.g., geomorphology and glaciation [1], topographic mapping [2], etc.) and non-topographic (e.g., traffic monitoring [3], hazard mapping [4], etc.) applications. Their explicit property, such as global coverage and medium resolution, provides immediate attraction for interested users, while their intrinsic property or quality, in general, is often overlooked by many data users, which, in fact, can be quite influential for the final outcome or any potential scientific findings.
In the past decade or so, the open global elevation modelling has made significant advances with the release of the SRTM DEM, ASTER GDEM and AW3D30. They cover most of the populated regions of the world and are publically available at a spatial resolution of 3” (SRTM 3) and 1” (SRTM 1, ASTER GDEM, AW3D30). Among these open data sources, SRTM 1 DEM for outside the US started being released in 2014, whereas AW3D30 has been available only since May 2016.
The SRTM elevation data was generated by using interferometric radar mapping technology with the US Space Shuttle Endeavour in February 2000. It was simultaneously measured by X-band (3 cm) and C-band (6 cm) and covers the earth from a north latitude of 60° to south latitude of 56°, about 80% of the global land area. Currently released SRTM DEMs were mainly created by NASA through the processing of the C-band data. Its nominal vertical accuracy is 16 m and horizontal accuracy is 20 m at the 90% confidence level [5]. The X-band data suffers from a severe data missing problem and was therefore not used in this study.
The first version of SRTM 3 was released by NASA-JPL (National Aeronautics and Space Administration-Jet Propulsion Laboratory) in 2003, though with many ‘No Data’ holes and outliers. To address this issue, NASA-JPL released the second version of SRTM 3 in 2005, which removes the noise in water areas and has great improvement in quality. However, this version was created through spatial interpolation to fill the ‘No Data’ holes of less than 16 consecutive points. It still has ‘cliffs’ in part of the tile boundaries. The CGIAR-CSI (Consultative Group of International Agricultural Research-Consortium for Spatial Information) released Version 3 of SRTM 3 in 2006. It used the SWBD (SRTM Water Body Dataset) to clip the coastlines and auxiliary DEMs including the GTOPO30, NED DEM and ASTER DEMs to fill the voids. In 2008, the CGIAR-CSI released Version 4 of SRTM 3. It used a new spatial interpolation method and more high-resolution auxiliary DEMs such as Canadian Digital Elevation Data Level 1 and the 30 s SRTM30 DEM [6,7]. This version is currently the highest quality open SRTM 3 dataset and is going to be assessed in this research.
Although SRTM 1 over the US was first released in 2003, data over areas outside the US were not released until 2014. To be specific, only since July 2015 has the SRTM 1 data become available over China, whereas SRTM 1 over Western Asia is still not publicly available at the time of writing. The actual quality of SRTM 1 outside the US is of a timely, great interest considering its superiority in resolution to SRTM 3. Moreover, it is scientifically meaningful since the auxiliary, domestic data and information of the US might not be available for SRTM DEM production or refinement outside the US.
The ASTER GDEM released by NASA and METI (Japan’s Ministry of Economy, Trade and Industry) covers the region from north latitude 83° to south latitude 83°, about 99% of the global land. It was generated through image matching for the optical images collected by the ASTER imaging sensors. Its nominal vertical accuracy is 20 m and horizontal accuracy is 30 m at the 95% confidence level [8]. Version 1 of ASTER GDEM was released in 2009. Though it uses all usable images, it is unreliable in most inland lakes and has apparent outliers in cloud obscured areas. Version 2 of ASTER GDEM, released in 2011, achieved more complete coverage and better morphologic details, through acquiring 260,000 additional scenes and using a smaller image correlation kernel [9]. This version of ASTER GDEM is the most complete and reliable open global DEM dataset and will be evaluated in this study.
The AW3D30 was released by the Japan Aerospace Exploration Agency (JAXA). In May and October 2015, they released the Beta Version including Japan and a part of individual continent, while, in May 2016, the global region was released [10]. It was actually a resampling of the 5-m mesh generated by optical stereo matching technique using the images acquired by the Panchromatic Remote-sensing Instrument for Stereo Mapping (PRISM) from 2006 to 2011. At the time of writing this paper, only the 1” version data are free of charge. Details about how this digital surface model was generated can be found in Tadono et al. [11] and Takasu et al. [12]. The data are provided in two formats: AVE (average) and MED (median), referring to the different methods used for resampling from the 5-m mesh to the final released version. We will evaluate the AVE data in this study.
Both ASTER GDEM and AW3D30 were generated through stereo matching. A stack number (SN) file is provided along with each DEM. Positive SN values represent the number of individual scenes that contributed to determining the final DEM for the corresponding pixel [8,10]. Only ASTER GDEM has negative SN values, representing that the elevation at the pixel was from other data sources, e.g., SRTM 3 V3, SRTM 3 V2 or Alaska DEM. In our study area, pixels with negative SN values are very few.
The specifications of the above DEMs are summarized in Table 1.
There have been a number of represented evaluations on the open DEMs. In addition to the official, data-producer reported accuracy, application-oriented or need-based assessments were also widely studied with reference to independent data sources. Sun et al. cross-validated SRTM 3 and SLA-02 (Shuttle Laser Altimeter II) and found that the accuracy of SRTM 3 at low vegetation area is better than the SRTM mission specifications (16 m) [13]. Zhan et al. calculated the root mean square error (RMSE) of SRTM 3 with reference to 1:50,000 DEM and showed that the vertical accuracy is negatively related to the average slope [14]. Wilson et al. evaluated the accuracy of SRTM 3 and ASTER GDEM version 2 with highly accurate topographic data of Light Detection and Ranging (LiDAR). The tests were over tropical mountainous areas, and it was found that the accuracy of SRTM 3 is ~10 m better than that of ASTER GDEM (~18 m) [15]. Mukherjee et al. evaluated the vertical accuracy of ASTER GDEM and SRTM 3 with reference to the Cartosat DEM. which is a product of image matching. They found that the overall vertical accuracy is 12.62 m and 17.76 m for ASTER and SRTM 3 DEM, respectively, when compared with the Cartosat DEM [16]. Athmania et al. assessed the vertical accuracy of ASTER GDEM, SRTM 3 version 4.1 and GMTED2010 (Global Multi-resolution Terrain Elevation Data 2010) using Global Navigation Satellite Systems (GNSS) validation points in southern Tunisia and northeastern Algeria. They found that the vertical accuracy of SRTM 3 is better than that of ASTER GDEM and GMTED2010 [17]. Chaieb et al. [18] happened to assess SRTM 3 and ASTER GDEM in the same region (Tunisia) with GPS data as Athmania et al. [17] did but obtained the opposite conclusions. Of note, Athmania et al. [17] used many more GPS points (hundreds of points) than Chaieb et al. [18] (23 points). There are still many validations of DEMs using various kinds of reference data [19,20,21,22,23,24,25,26], such as Li et al. [25], who investigated the vertical accuracy of ASTER GDEM version 2 of five study sites in China using ground control points. They demonstrated that the mean (−13 m) and RMSE (19 m) of ASTER GDEM version 2 are better than ASTER GDEM version 1 (26 m and −21 m). The validation work about AW3D30 is very limited. Santillan et al. [27] conducted a vertical accuracy assessment about AW3D30, ASTER GDEM and SRTM 1 in the Philippines with GPS points. It is found that the AW3D30 has the smallest RMSE of 5.68 m.
Since the release of SRTM 1 and AW3D30, lands outside the US are now for the first time being covered by four global open medium-resolution DEMs (SRTM 3, SRTM 1, ASTER GDEM, and AW3D30). There were also contradictory reports about the quality of SRTM 3 and ASTER GDEM, e.g., [15,17] and [16,18]. Moreover, the comparison of SRTM 1 and SRTM 3 in places outside the US is of great, timely interest. A comprehensive study of the four DEMs’ accuracy has not yet been reported for China, mainly due to the recent availability of SRTM 1 and AW3D30. Considering this situation, we intend to evaluate the quality of the four DEMs by carrying out a timely and thorough study. To this end, we choose Hubei Province, China, covering a region of 185,600 km2 with a variety of landforms for our study. The reference used is the 1:50,000 DEM from China’s basic geographic information products. In addition, we move one step forward to evaluate the DEM quality in terms of land cover. We make a use of the global land cover (30-m Global Land Cover Dataset, [28]) as independent open data. Through this effort, we explore the relation of DEM quality with respect to not only the terrain relief but land cover. Our study begins by describing the main characteristics (e.g., resolution, vertical and horizontal datums) of these four DEMs and the reference data. Then, the shifts between the vertical and horizontal datums of an assessed DEM (i.e., the DEM to be assessed) and the reference DEM are corrected. Finally, the vertical accuracy of the assessed DEMs is evaluated in terms of different types of terrain, slopes and land cover.
The rest of the paper is structured as below. Section 2 describes the properties and specifications of the study areas, reference data and 30-m Global Land Cover Dataset. Section 3 applies necessary transform between the coordinate systems of the assessed DEM and 1:50,000 DEM and removes their horizontal offset. Meanwhile, we introduce our assessment methods in Section 3. Section 4 presents and discusses the results. Section 5 concludes our work.

2. Study Areas and Reference Data
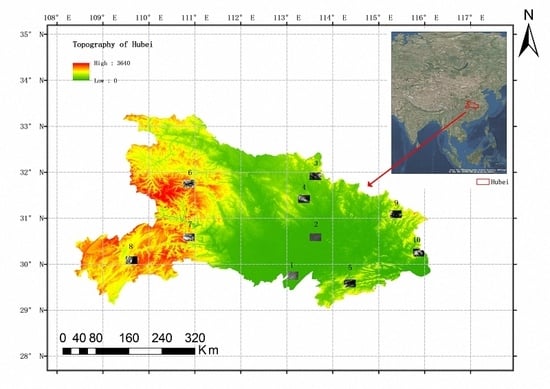
2.1. Study Areas

Hubei Province (Figure 1) is located in southern central China extending from 29°05′N to 33°20′N and 108°21′E to 116°07′E with the Yangtze River running through. The topography is characterized by an inclination overall going down from west to east with various landforms. The east-most Wu Mountains have an average altitude about 1000 m–1500 m. Lower mountains (500 m~800 m) generally spread over northeast regions which belong to the Tapieh Mountains. To their south, Jianghan Plain occupies the central Hubei Province. Further south regions are connected to the Dongting Lake Plain with many small hills. These diverse topographies, consisting of plains, hills and mountains, make this province quite suitable for a comprehensive evaluation of the DEM accuracy. The plain, hilly and mountainous terrains are defined by slopes, i.e., plain with a slope <2 degrees, hilly with a slope between 2 and 6 degrees, and mountainous with a slope >6 degrees [29].

2.2. Reference DEM

For this study, the 1:50,000 DEM of China’s basic geographic information products was chosen as reference data to assess SRTM 3, SRTM 1, ASTER GDEM and AW3D30. The reference DEM is under Gauss–Kruger projection at a resolution of 25 m. Its horizontal datum is the 1980 National Geodetic Coordinate System and vertical datum is the 1985 National Height Datum. According to the standards of topographic mapping in China, the vertical accuracy of the reference DEM, measured by root mean square error, is better than 4 m, 7 m and 11 m, respectively, for plain, hilly and mountainous areas.
To assess the open DEMs, we select a total of 10 sample areas for the three types of terrains, in which two of them are plain, three hilly and five mountainous. The distribution of the sample areas is shown in Figure 1, where each sample is nearly 462 (19,150 m × 24,175 m) km2. The reference DEM was produced through photogrammetry from digitalized photographs collected in the year 2000. It should be noted that such photography was for topographic mapping purposes and therefore was often carried out in the leaf-off season. Moreover, the tree heights were estimated based on field measurements and subtracted from the elevations determined by image matching. Considering the acquisition times of SRTM data (February, 2000) and ASTER GDEM (since 1999), they are close to the one for the reference DEM. However, the source data of AW3D30 was acquired from 2006 to 2011, which has a relatively long temporal span from the reference DEM.

2.3. 30-Meter Global Land Cover Dataset

The 30-m Global Land Cover Dataset was the result of the “Global Land Cover Mapper at Finer Resolution” project led by the National Geomatics Center of China (NGCC) [28]. The source data were Landsat images acquired from 2000 to 2010. The dataset has a total of 10 classes, including cultivated land, forest, grassland, shrub land, wetland, water bodies, tundra, built-up (artificial surfaces), bare land, permanent snow and ice, with an overall accuracy of 83.51% [30]. This dataset will be used as ancillary data to assist our assessment. In the study area, there are only six types of land cover: 55.83% for forest, 34.82% for cultivated land, 4.19% for water bodies, 3.45% for grassland, 1.52% for artificial surfaces, and 0.19% for wetland.

3. Methods

3.1. Data Co-Registration

Correct geo-referencing is a necessary step when dealing with several different elevation datasets. The SRTM DEM, ASTER GDEM and AW3D30 are all in WGS84 horizontal datum with a resolution of 3” or 1”. The vertical datum of SRTM DEM and ASTER GDEM is EGM96, whereas the elevations in AW3D30 are the “height above sea level” [18]. They are different from those used in the reference DEM. We used the built-in projection in ArcGIS to transform the assessed DEMs so that they are under the same horizontal coordinate system as the reference DEM. When carrying out the projection, we use the nearest neighbor method for resampling since, in general, it has less effect on the assessed DEM than other common resampling methods. It should be noted that the resampling step will inevitably introduce errors, especially for steep regions. The vertical shift between the 1985 National Height Datum of China and the quasi geoid defined by WGS84 is verified according to the calculation of Guo [31].
Although the above routine coordinate transform is implemented, there still exists visible systematic offset in the horizontal direction between the transformed assessed DEM and the reference DEM, due to the effect of sensor errors, topographic relief and especially the orientation bias of reference ellipsoids. A common method is to evaluate the overlap of the feature lines such as the profile lines, valley lines or ridge lines [32], but the reliability of such a method is limited by the precision of the extracted features. In this study, we resolve this geo-referencing problem through optimization, i.e., the correct horizontal offset is found when the elevation difference between the assessed DEM and the reference DEM is minimal. Similar to the iterative closest point (ICP) algorithm [33], we define a search space at a resolution of the reference DEM. The assessed DEM will then be shifted pixel by pixel within this search space and resampled to the same resolution of the reference DEM. At each shift step, the difference between the assessed DEM and the reference DEM is calculated. The optimal offset between the two datasets is the one that yields the minimum elevation difference. To be specific, we translate the assessed DEMs one by one at a step of one pixel both in the x and y directions, and calculate the RMSE according to Equation (1):
R M S E = ( i = 1 n ( Z i z i ) 2 ) / n
where Zi is the elevation of the assessed DEM, zi is the elevation of reference DEM and n is the number of pixels. This is repeated for all pixels in the search space. Finally, to obtain the sub-pixel offset estimation, we apply quadric surface fitting with the offset of minimum RMSE and its nearby region.
Considering the large size of the reference DEM raster, the number of test areas and the non-uniform distribution of the horizontal offset, we clipped each assessed DEM raster into 4 × 4 blocks while each contains 100 × 100 pixels to evaluate the global statistical properties of the horizontal offset. The optimal horizontal offset obtained through the above procedure is used to correct the systematic bias for evaluating other factors.
We found the optimal horizontal offset of SRTM 3, SRTM 1, ASTER GDEM and AW3D30, with respect to the reference DEM, to be close. After we apply this to eliminate the horizontal offset, the shift between the assessed DEM and reference DEM is then mostly corrected. To assess the quality of horizontal co-registration, we selected more than 6500 tie points between the assessed DEMs and the reference DEM. The registration errors are calculated as the mean and standard deviation of the coordinate differences of the tie points in south–north and west–east directions. Table 2 shows the registration errors of SRTM 3, SRTM 1, ASTER GDEM and AW3D30 with reference to the reference DEM. As we can see, the means and standard deviations are below 1 pixel (25 m), which proved that the significant shift between the assessed DEM and reference DEM is mostly eliminated. In our paper, the optimal horizontal offset is used to correct the systematic bias of the horizontal offset for evaluating the indicators in Section 4.

3.2. Validation Methods

This study assesses the four DEMs’ vertical accuracy in terms of terrain types, slopes and land cover. First, we evaluated the vertical accuracy in terms of terrain types. Once the assessed DEM and the reference DEM are co-registered, we subtract the assessed DEM with the reference DEM pixel by pixel at first, then calculate the mean, standard deviation (Equation (2)), 5% quantile and 95% quantile of the elevation differences:
S t d = i = 1 n ( V i V ¯ ) 2 / n ,
where Vi is the height difference, V ¯ is the mean of the differences and n is the number of DEM pixels.
To assess the vertical accuracy in terms of slopes, we first calculate the slope of every pixel in the test areas based on the reference DEM:
S l o p e = tan 1 ( [ d z / d x ] 2 + [ d z / d y ] 2 ) ,
where d z / d x and d z / d y are the elevation derivatives in the x- and y- direction, respectively. The elevation differences are then summarized according to the binned slopes. In this study, the slope bin is chosen as one (1) degree.
Height accuracy may also be correlated to land cover. One apparent reason is that the terrain relief is related to land cover. In addition, techniques used to generate DEM, e.g., photogrammetry and SAR, are also relief-dependent and land-cover dependent. Different land covers may lead to varying elevation differences, and some specific types of land cover class may also affect the quality of the measurements, e.g., ranging and image matching over forest or vegetation and water. It is necessary to consider land cover as an influencing factor when assessing the DEM.
In order to assess the accuracy of the four DEMs in different land cover, we calculate the mean, standard deviation, 5% quantile and 95% quantile of the errors, respectively, for the six land cover classes in the study area.
To explore the combined effect of land cover and terrain slope on DEM accuracy, we examine DEM accuracy in terms of terrain slope, respectively, for cultivated land and forest areas. The mean and standard deviation of elevation differences are then summarized separately for these two land covers.
For ASTER GDEM and AW3D30, we further evaluate the effect of the stack number on their accuracy.

4. Results and Discussion

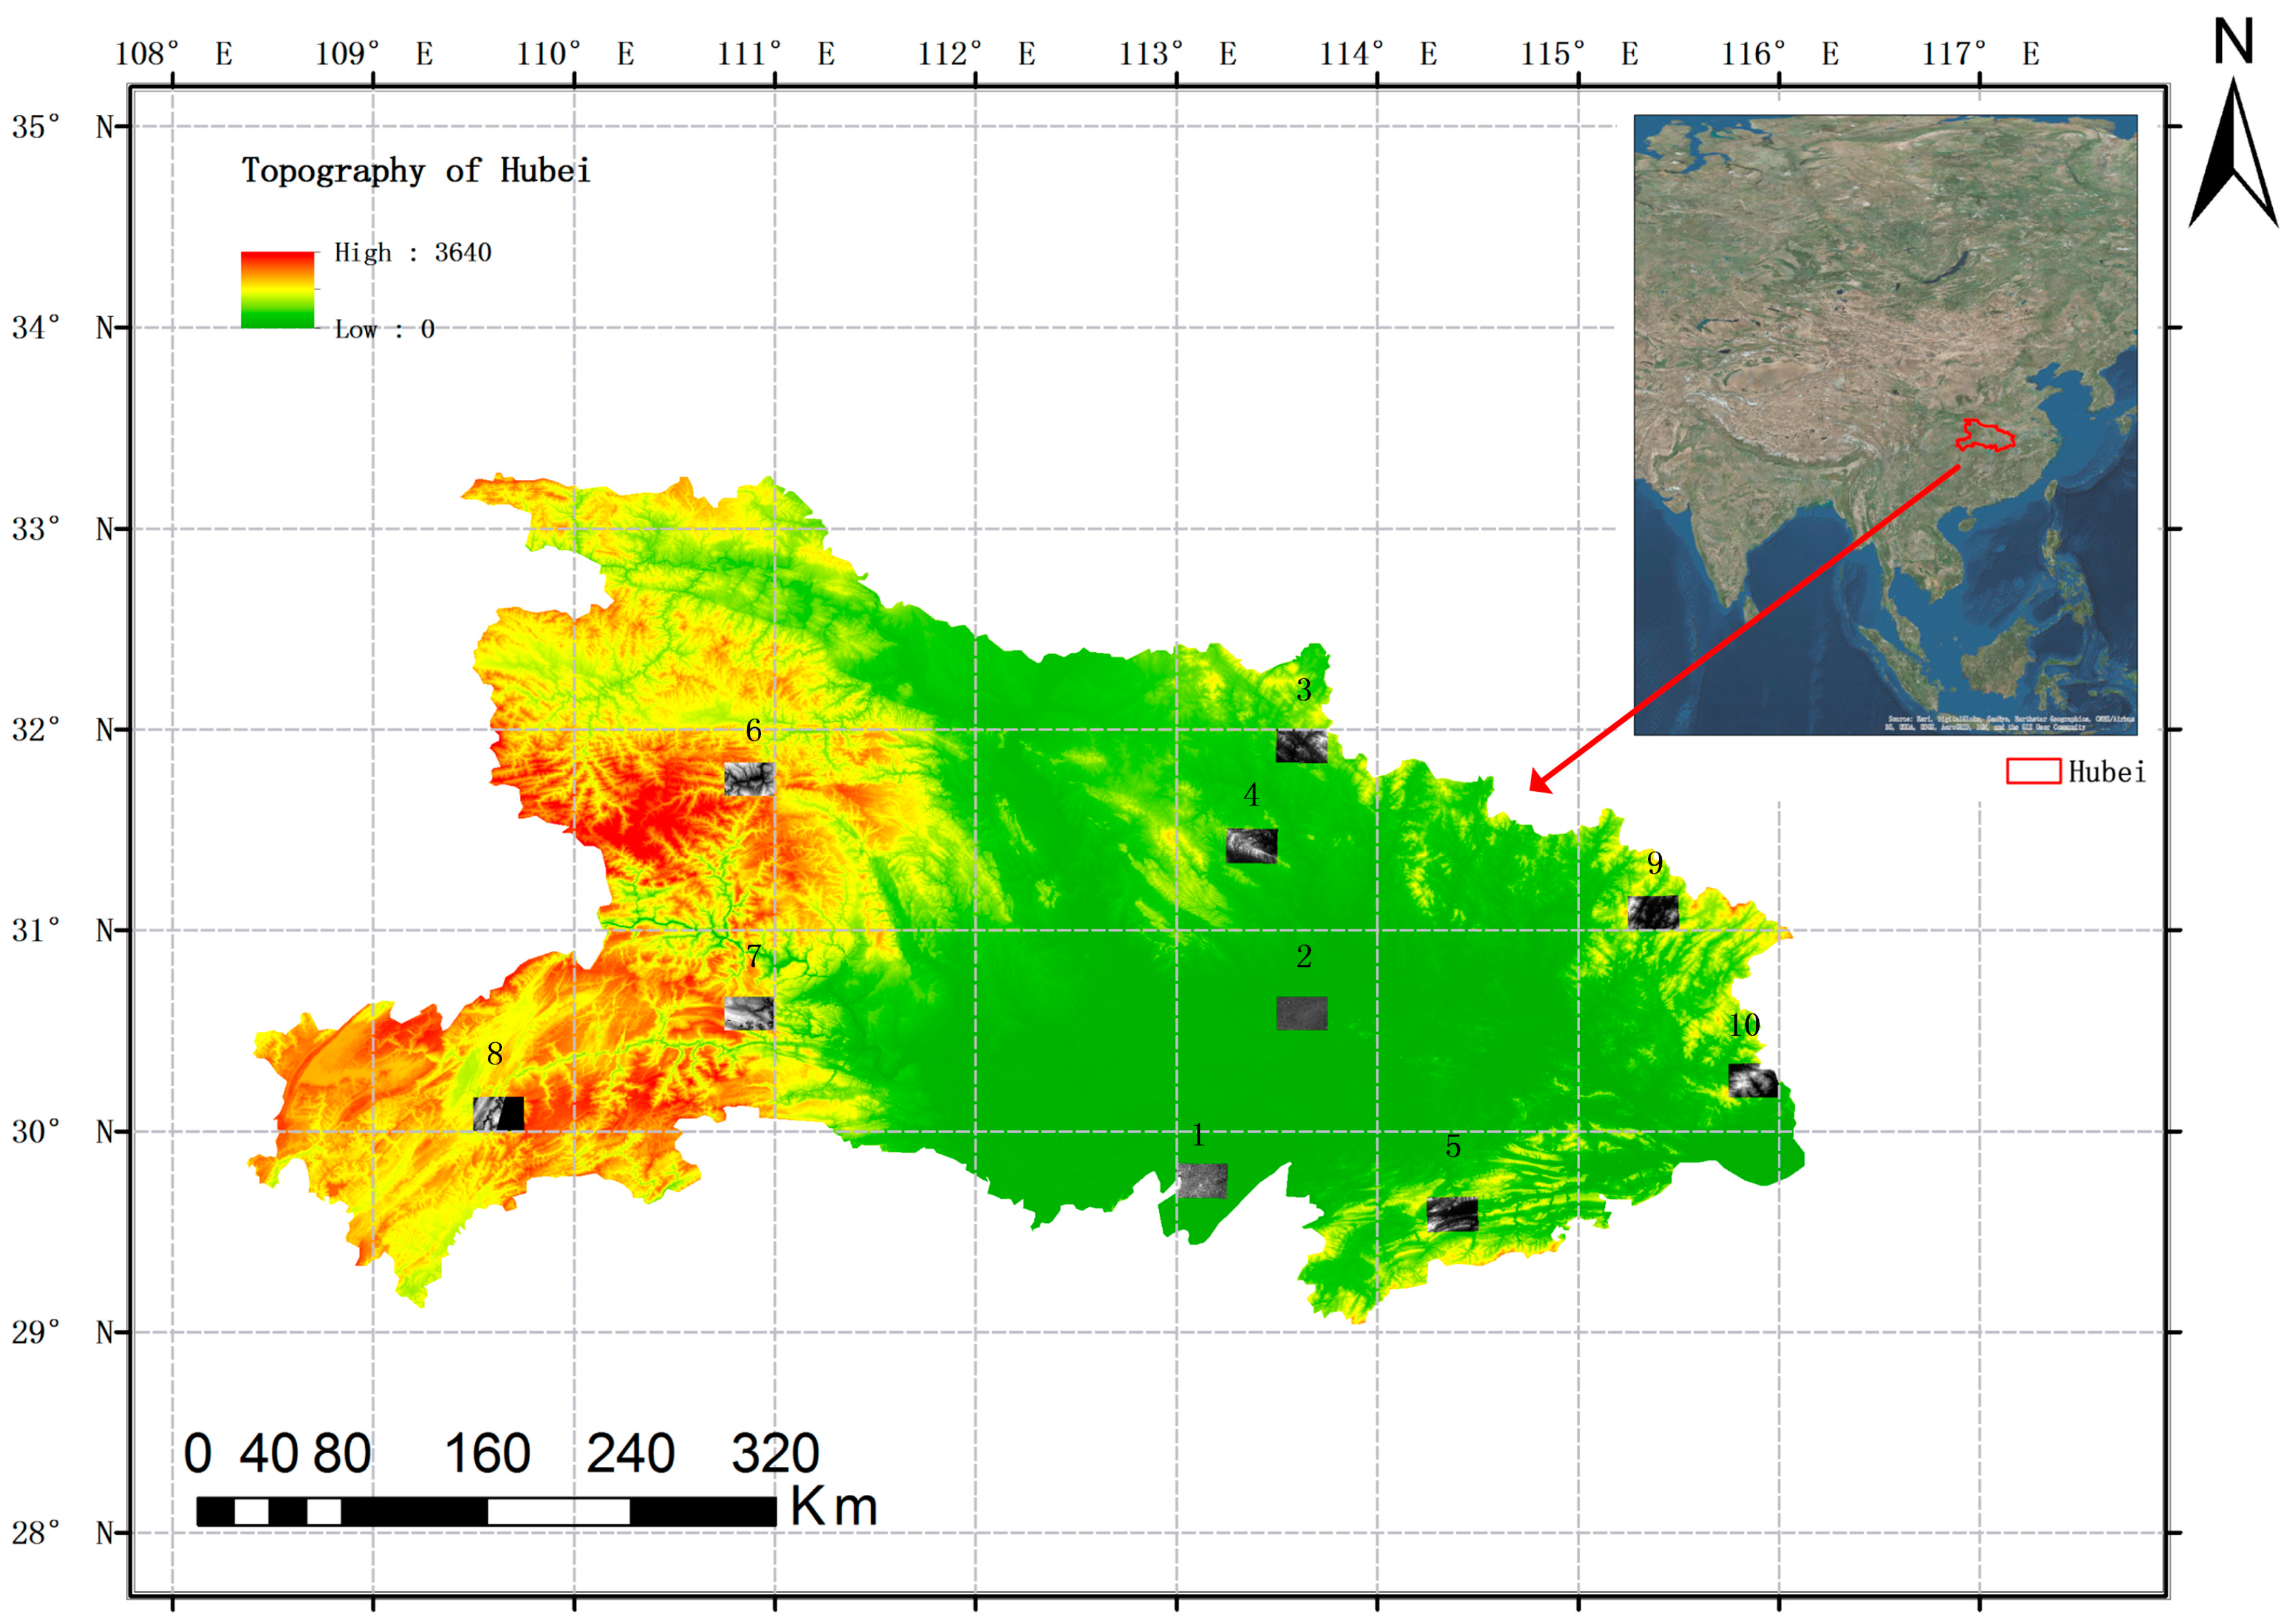
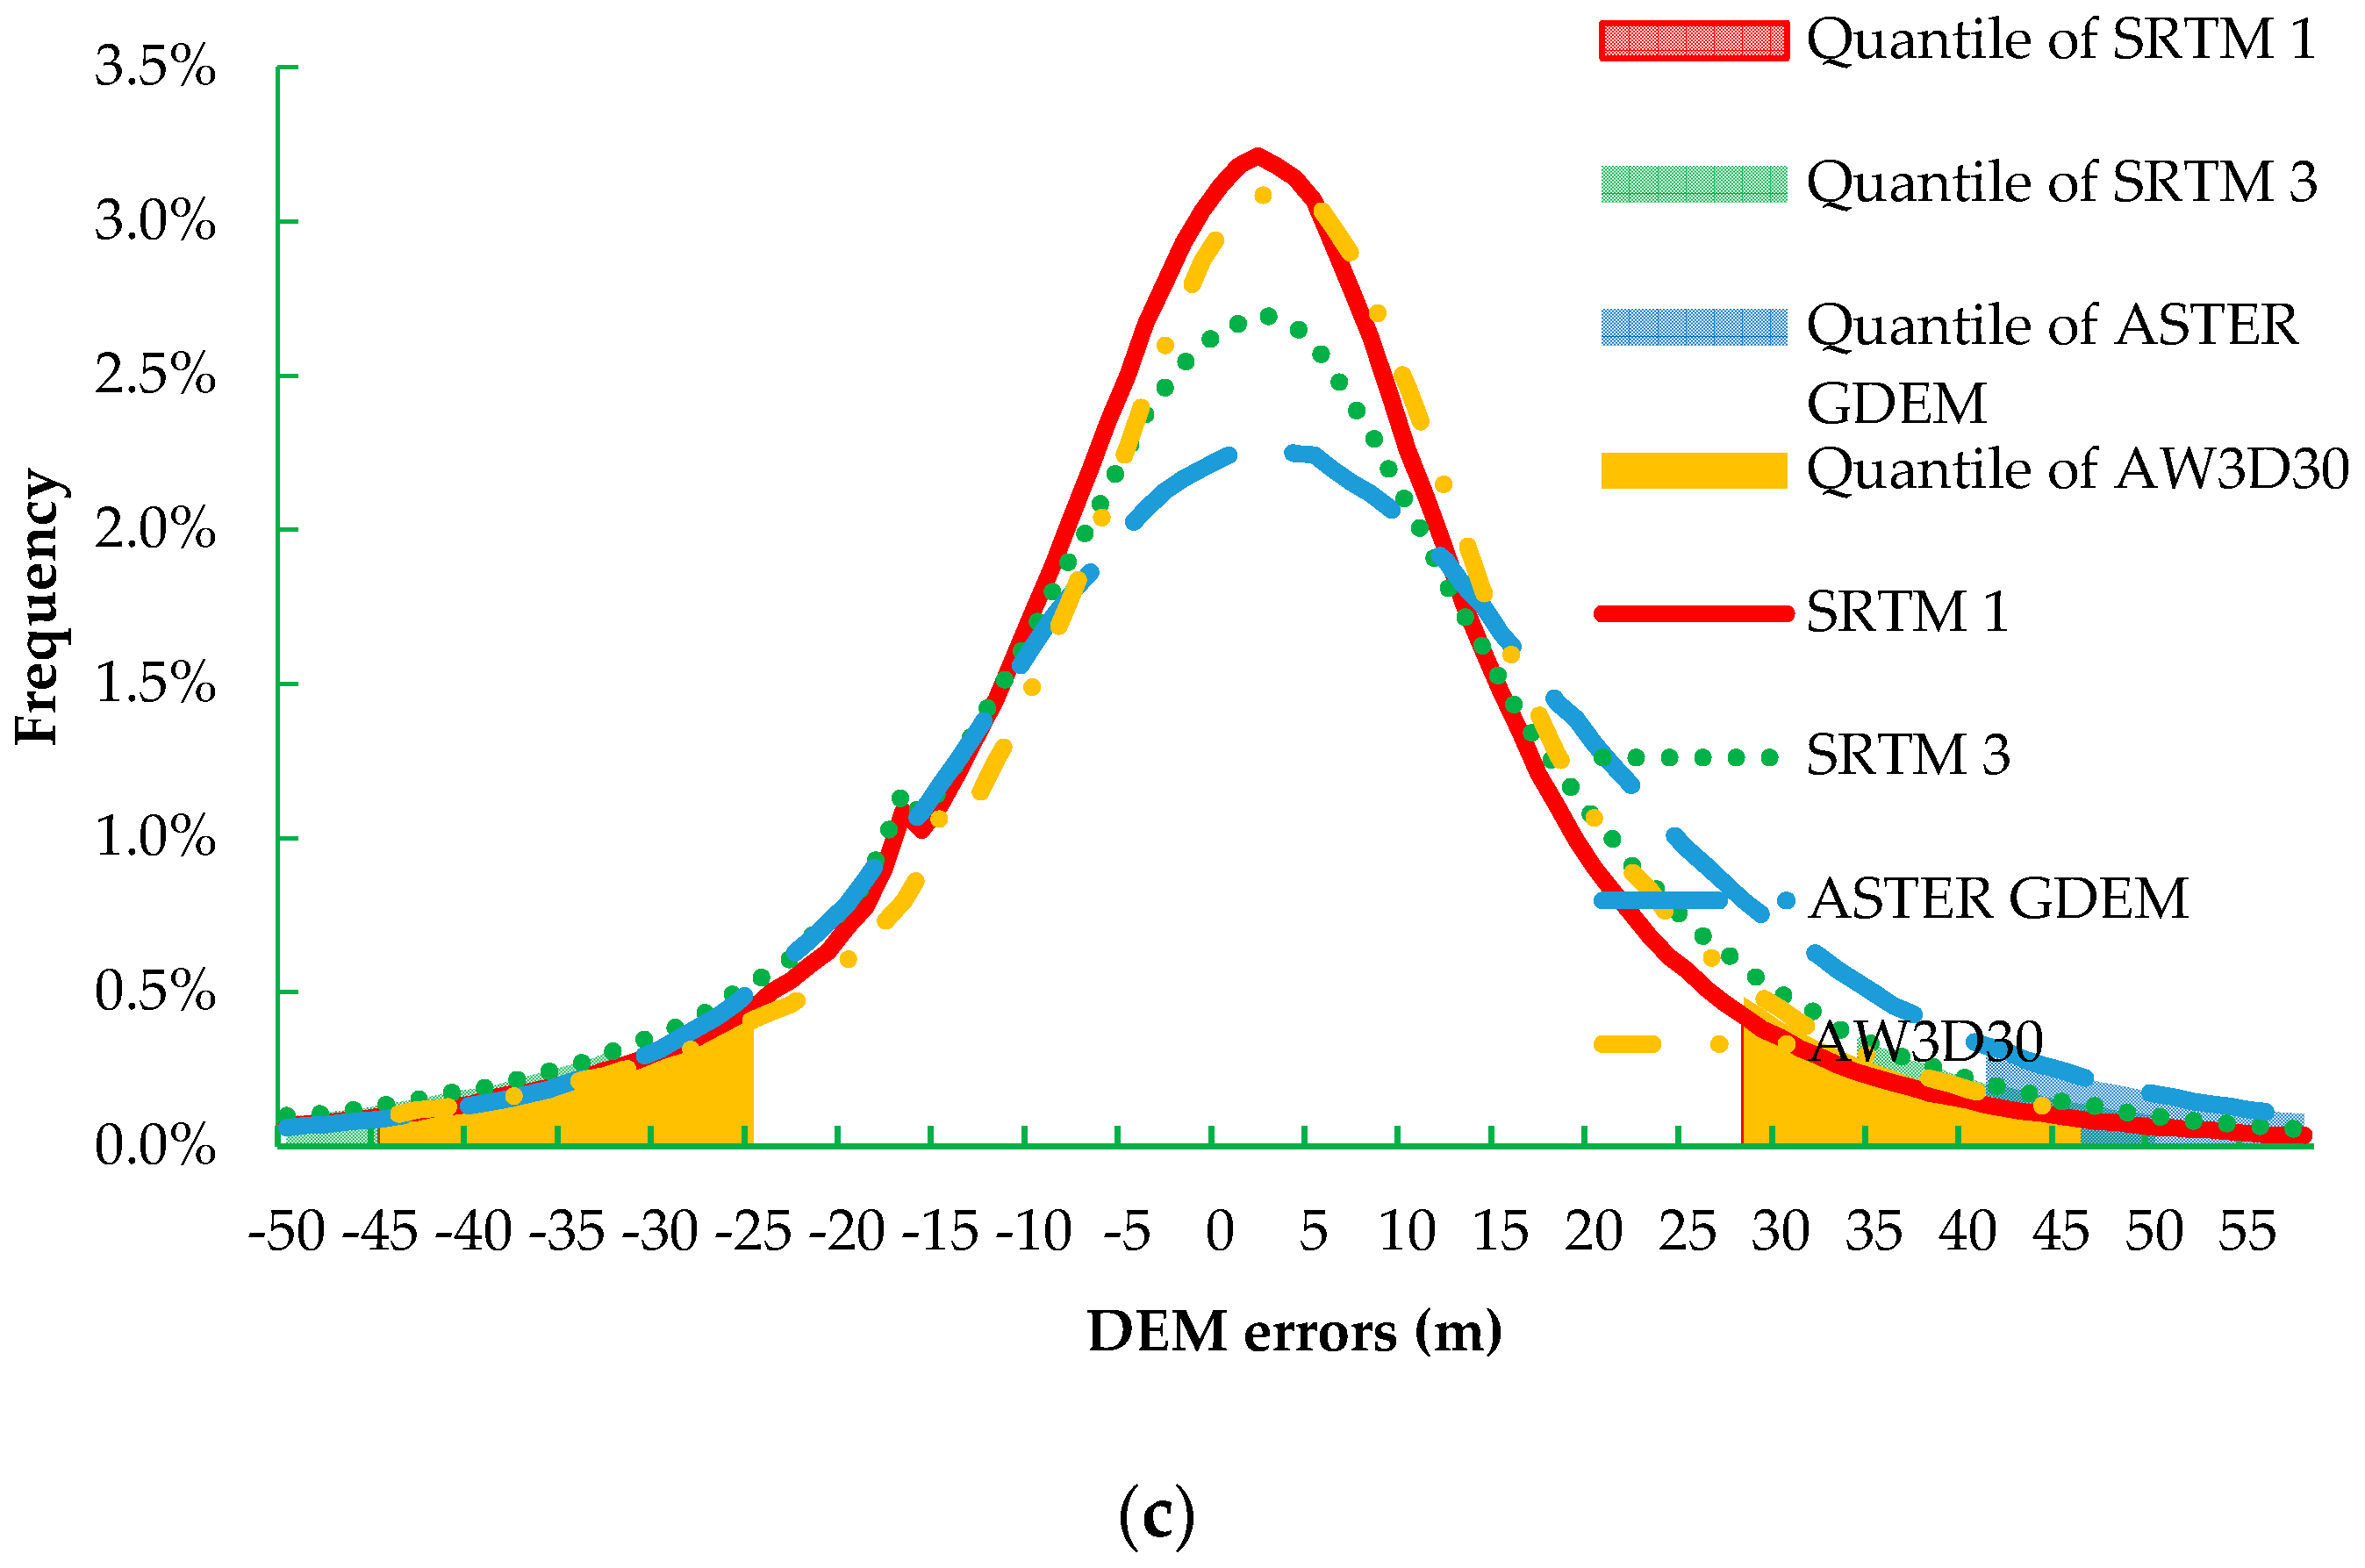
4.1. Overall Accuracy

Figure 2 shows the error distributions of the four assessed DEMs in terms of three types of reliefs. The standard deviation, 5% quantile and 95% quantile of the errors are also shown in Figure 2. Table 3 shows the accuracy of the four assessed DEM grouped by three terrain reliefs. There are a number of observations we can make based on Figure 2 and the corresponding summary statistics in Table 3. First, the error distributions of the four assessed DEMs are very close to a normal distribution. This fact is also observed in many previous studies [17,18] but is contradictory to a recently published report by Mukul et al. [24]. The mean errors of all four DEMs are negligible comparing to their standard deviations for hilly and mountainous areas, whereas the mean and standard deviation for plains areas are at a similar magnitude of several meters. We can therefore conclude that there is no significant overall offset between the accessing DEM and the reference DEM after co-registration. The implemented optimization strategy does achieve a satisfactory co-registration between the DEM datasets. Second, in light of the fact that SRTM 1 and SRTM 3 are from the same data source, i.e., SRTM 3 is generated by averaging every 3 × 3 pixels of SRTM 1 [34], their error distributions exhibit similar means and standard deviations in places of the same terrain, with the largest errors occurring in mountainous areas. For places where terrain fluctuation is obvious, SRTM 1 is better than SRTM 3. To be specific, the standard deviation of SRTM 1 is 9.1 m and 18.6 m, 19.5% and 12.7% smaller than that of SRTM 3 in hilly and mountainous areas, respectively. For plains areas, the quality of SRTM 3 (2.6 ± 1.7 m) and SRTM 1 (2.6 ± 1.9 m) is very similar without significant difference. We therefore conclude that the down-sampling operation of SRTM DEM does have effect on its quality, especially for hilly and mountainous areas where the terrain is rougher. The quality of SRTM 1 is at the lower (better) bound of the nominal accuracy (16 m) for high relief areas, whereas SRTM 3 over mountainous areas is slightly worse than the reported nominal accuracy (16 m). Our third observation is about the quality of the ASTER GDEM. Its error distribution is widespread and the percentages of large errors are more than the ones of the two SRTM DEMs. This suggests that the ASTER GDEM in general has larger variations than the two SRTM DEMs do, i.e., having a slightly higher uncertainly with respect to the reference DEM. Finally, it is seen that AW3D30 is the one closest to SRTM 1 among the other three assessed DEMs. In fact, AW3D30 and SRTM 1 have practically the same quality, as shown by Figure 2 and Table 3.
It should be noted that the quality of the DEM is varying with terrain relief. In hilly and mountainous areas, the accuracy of ASTER GDEM and AW3D30 is close to that of the two SRTM DEMs, with SRTM 1 and AW3D30 being the best. Considering the 5% quantile and 95% quantile of the errors, SRTM 1 is more reliable than the others. The range of the middle 90% being smaller means that the number of very small and very large outliers is smaller. These results are consistent with many previous studies that the accuracy of SRTM is higher than ASTER GDEM [16,18], which is also consistent with their formal nominal quality specifications, i.e., 16 m for SRTM DEM and 20 m for ASTER GDEM (see Table 1). As pointed earlier, one can actually expect a quality for plains and hilly areas better than the nominal accuracy listed in Table 1.
The unexpected high differences of AW3D30 with respect to the reference DEM is likely due to one or more of the three possible reasons. First, our reference DEM is largely elevations of bare ground due to the leaf-off acquisition of the source data and the subtraction of tree heights during production, whereas AW3D30 is the surface or canopy heights without subtracting the tree heights from image matching. Second, the source data for the reference DEM was acquired in 2000 while AW3D30 was produced by using images from 2006 to 2011. The growth of trees and possible terrain change over that time period may contribute to this large difference. Finally, the AW3D30 was resampled from a resolution of 5 m mesh to a 30 m grid. It is possible that the down-sampling method (window averaging) adopted by the data producers in this process has severe influence on the quality of resultant DEM, especially in mountainous areas. This inference is supported by the fact that larger variations in Table 3 are observed with increasing terrain complexity.
Finally, it is noted that all four assessed DEMs show positive mean values in all three types of terrain relief except a small, insignificant (−0.4 m) mean for ASTER GDEM in hilly areas. This means that over all these four open DEMs overestimate the terrain elevation. This overestimation was noted in previous studies [16,17]. This is likely due to the canopy and its growth over the temporal span of the datasets. Nevertheless, it is necessary to note again that this overestimation is insignificantly small comparing to the large variations as represented by the large standard deviation. Therefore, it is unlikely this overestimation will be observed as a systematic phenomenon, unless it is in plains areas.

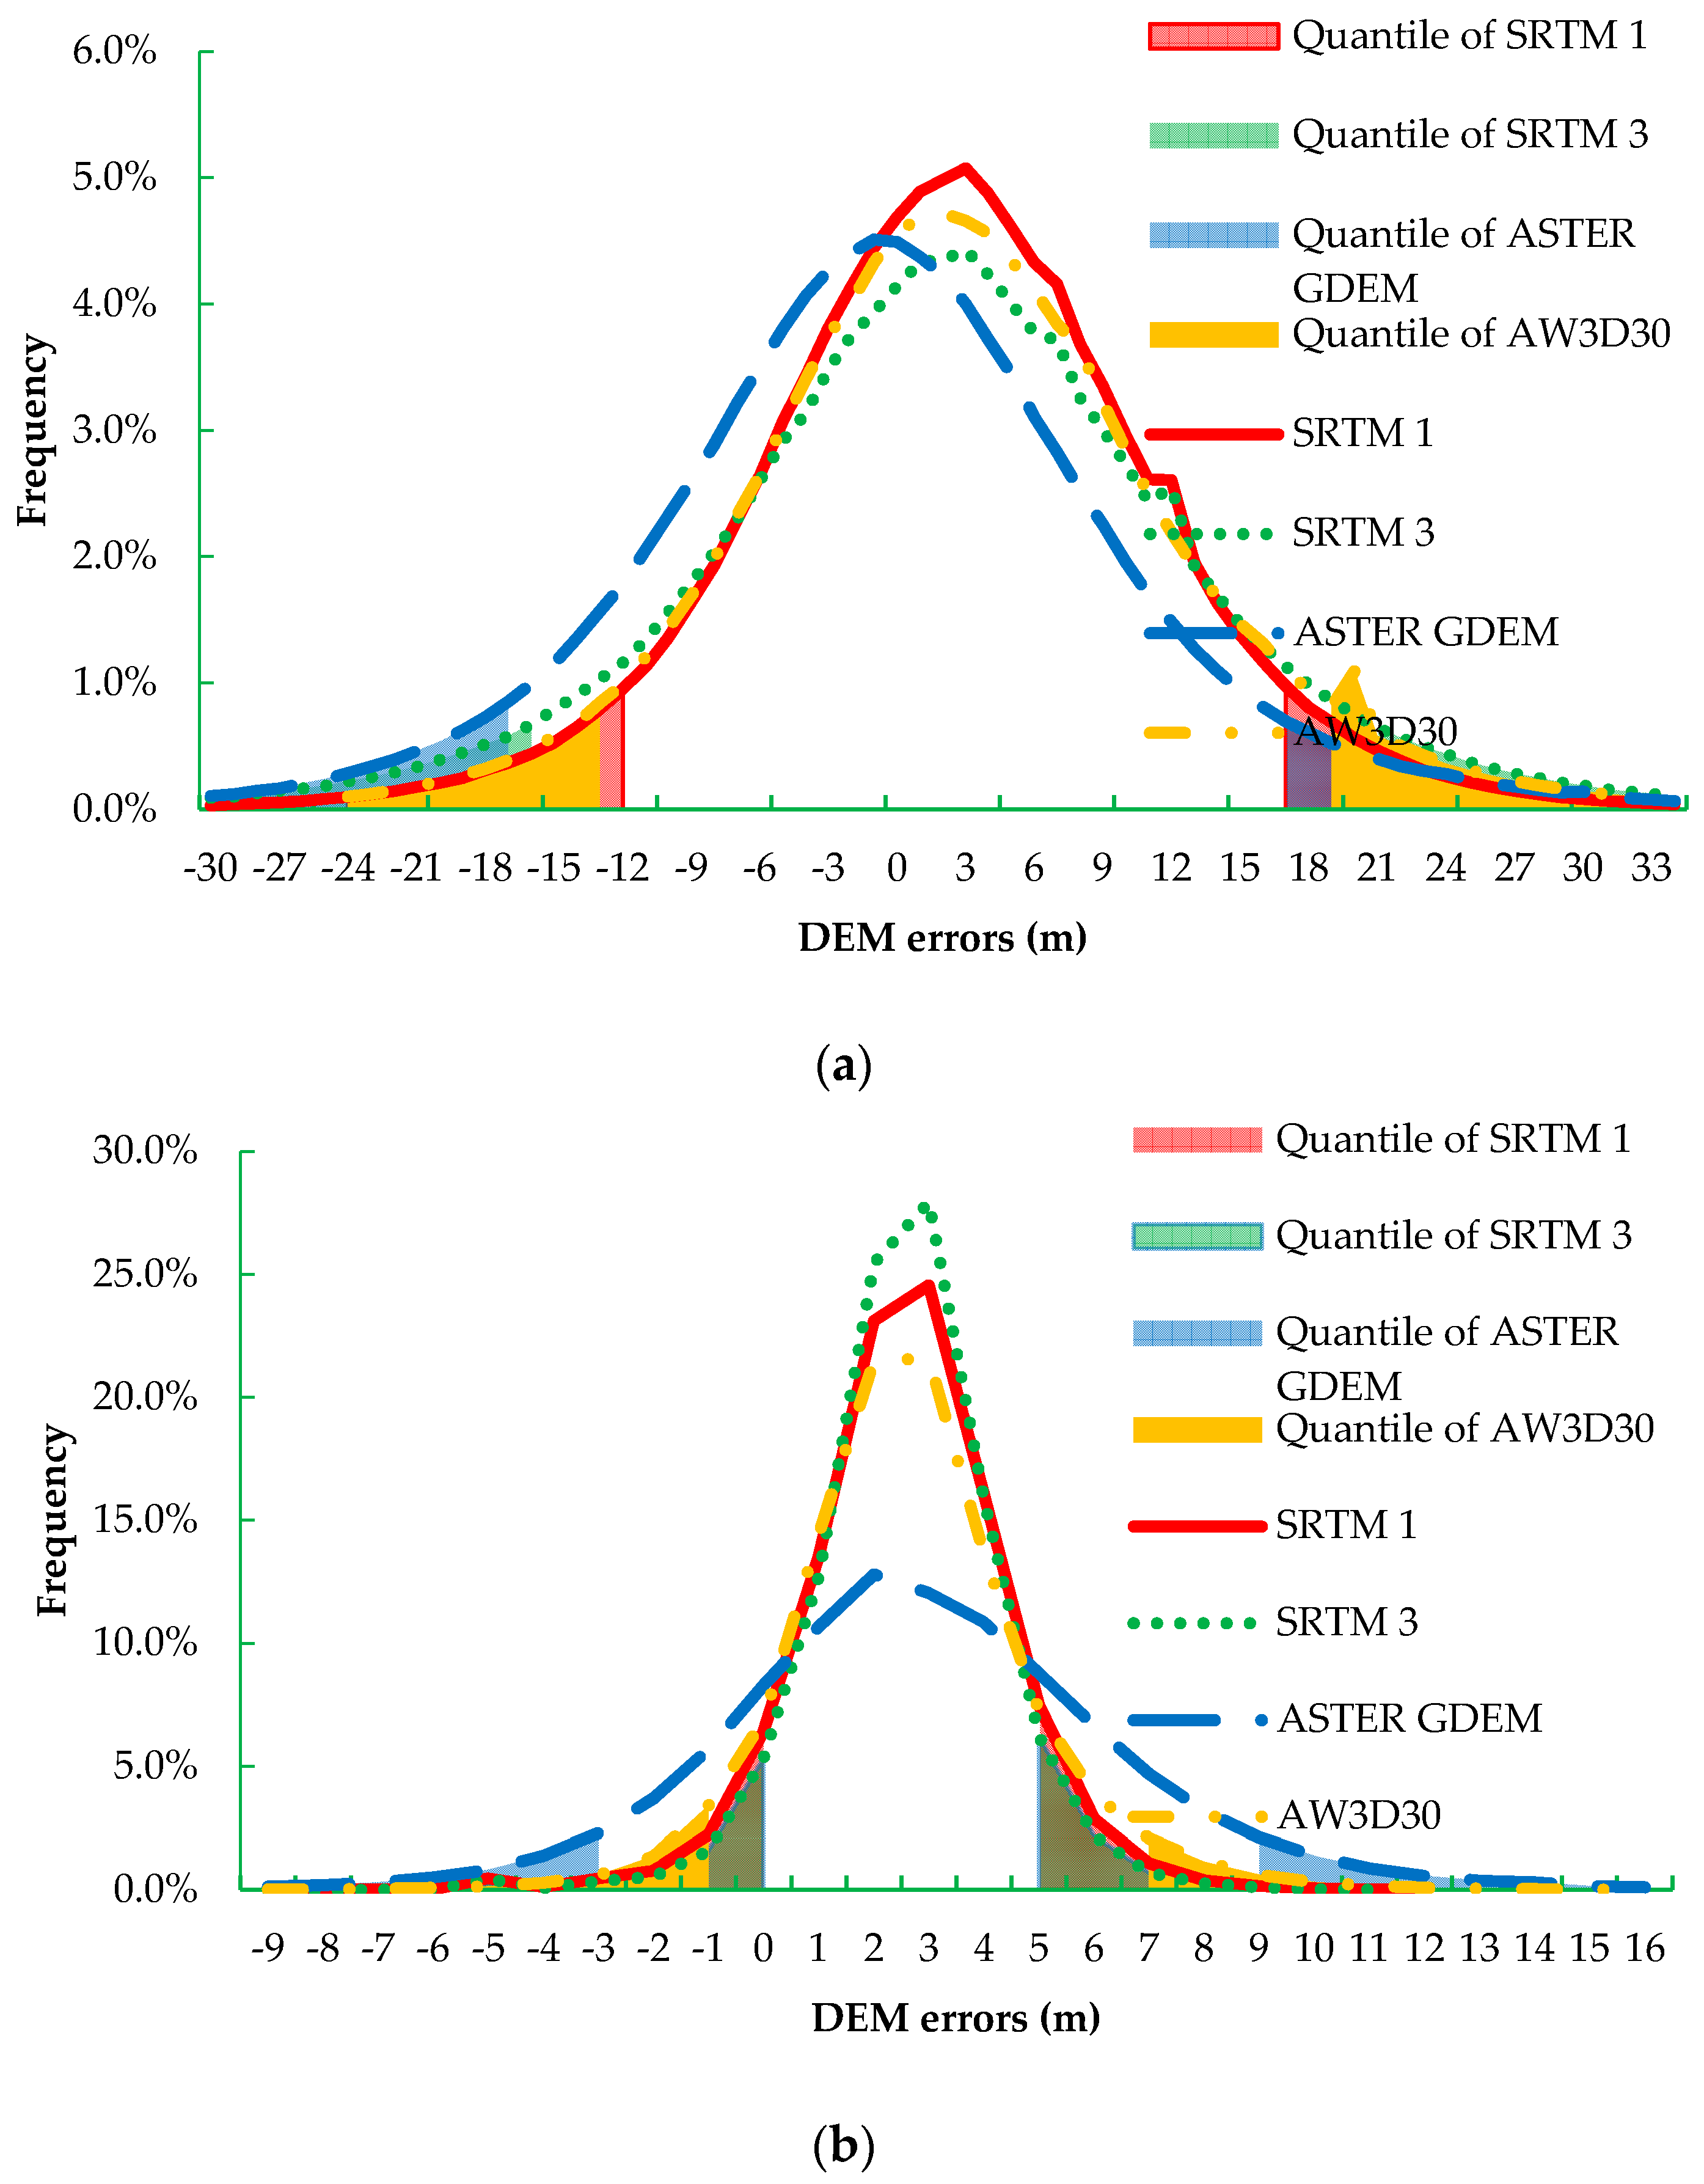
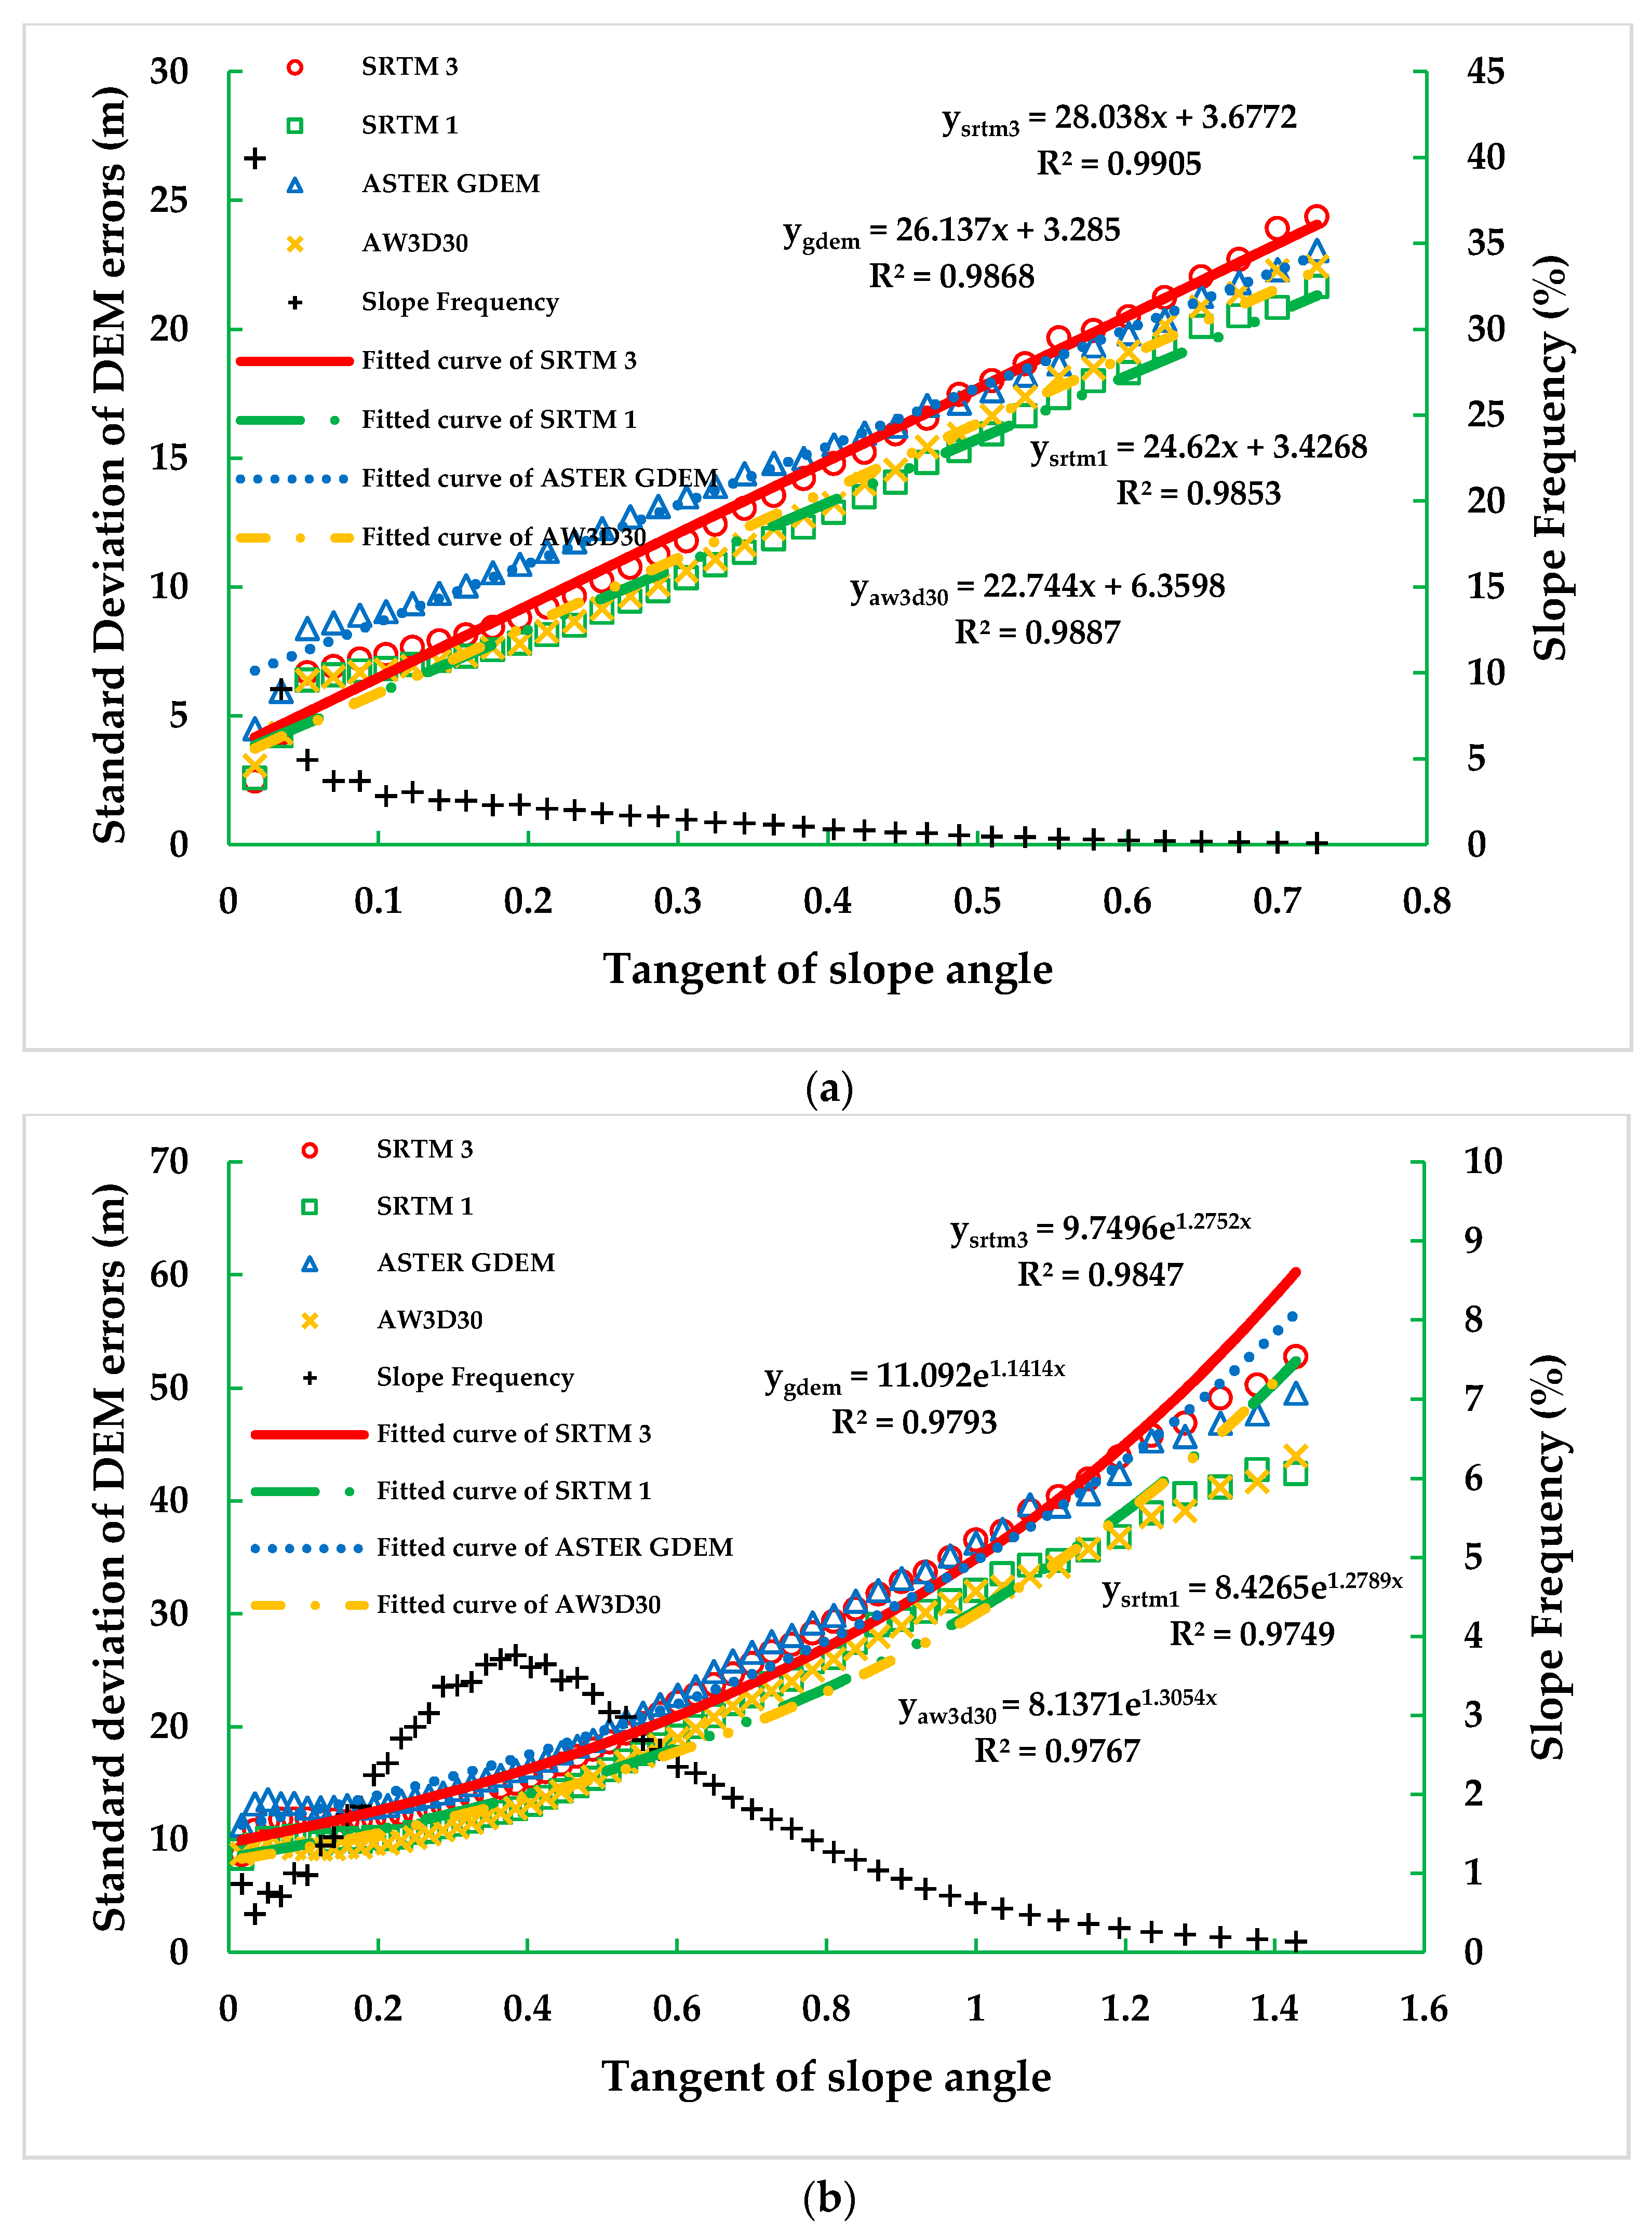
4.2. Accuracy versus Terrain Slope

Figure 3 shows the standard deviations of elevation errors with respect to slopes (each bin is 1 deg.) for the four assessed DEMs. It depicts an exponential correlation between the standard deviation of errors and the tangent of terrain slopes. This stays true for all four assessed DEMs. A regression of the relations yields the following relationships:
S t d S R T M 3 = 32 . 176 tan ( s l o p e ) + 3 . 7309
S t d S R T M 1 =   7 . 871 tan ( s l o p e ) + 3 . 3309
S t d A S T E R = 29 . 737 tan ( s l o p e ) + 5 . 8699
S t d A W 3 D 30 = 27 . 457 tan ( s l o p e ) + 3 . 5417
where tan ( s l o p e ) is the tangent of slope angle for the test area, S t d S R T M 3 , S t d S R T M 1 , S t d A S T E R and S t d A W 3 D 30 are, respectively, the standard deviation of SRTM 3, SRTM 1, ASTER GDEM and AW3D30 with reference to the reference DEM. The values of R2 (squared correlation coefficient) are, respectively, 0.9886, 0.988, 0.9889 and 0.9899 in the fitting functions. We conclude that the standard deviation of the four assessed DEMs increases with rising slopes of the test area, despite being at different rates for different DEMs. The conclusion about the relationship between the DEM accuracy and the slope is consistent with the previously reported work [14,16]. Moreover, the fitting lines in Figure 3 and Equations (4)–(7) show that the standard deviations of SRTM 3 and ASTER GDEM increase at a higher rate than SRTM 1 and AW3D30, which indicates that the quality of the former two DEMs is more sensitive to terrain slope. Furthermore, for terrain with a slope less than 20 degrees (0.36 for tangent), ASTER GDEM has slightly poorer quality than SRTM 3, SRTM 1 and AW3D30. This is consistent with our results in the last subsection that the accuracy of ASTER GDEM is the lowest in plains areas. When the slope is greater than 20 degrees, the errors of all the four DEMs increases rapidly. Similar findings were also reported in previous studies [16,35].

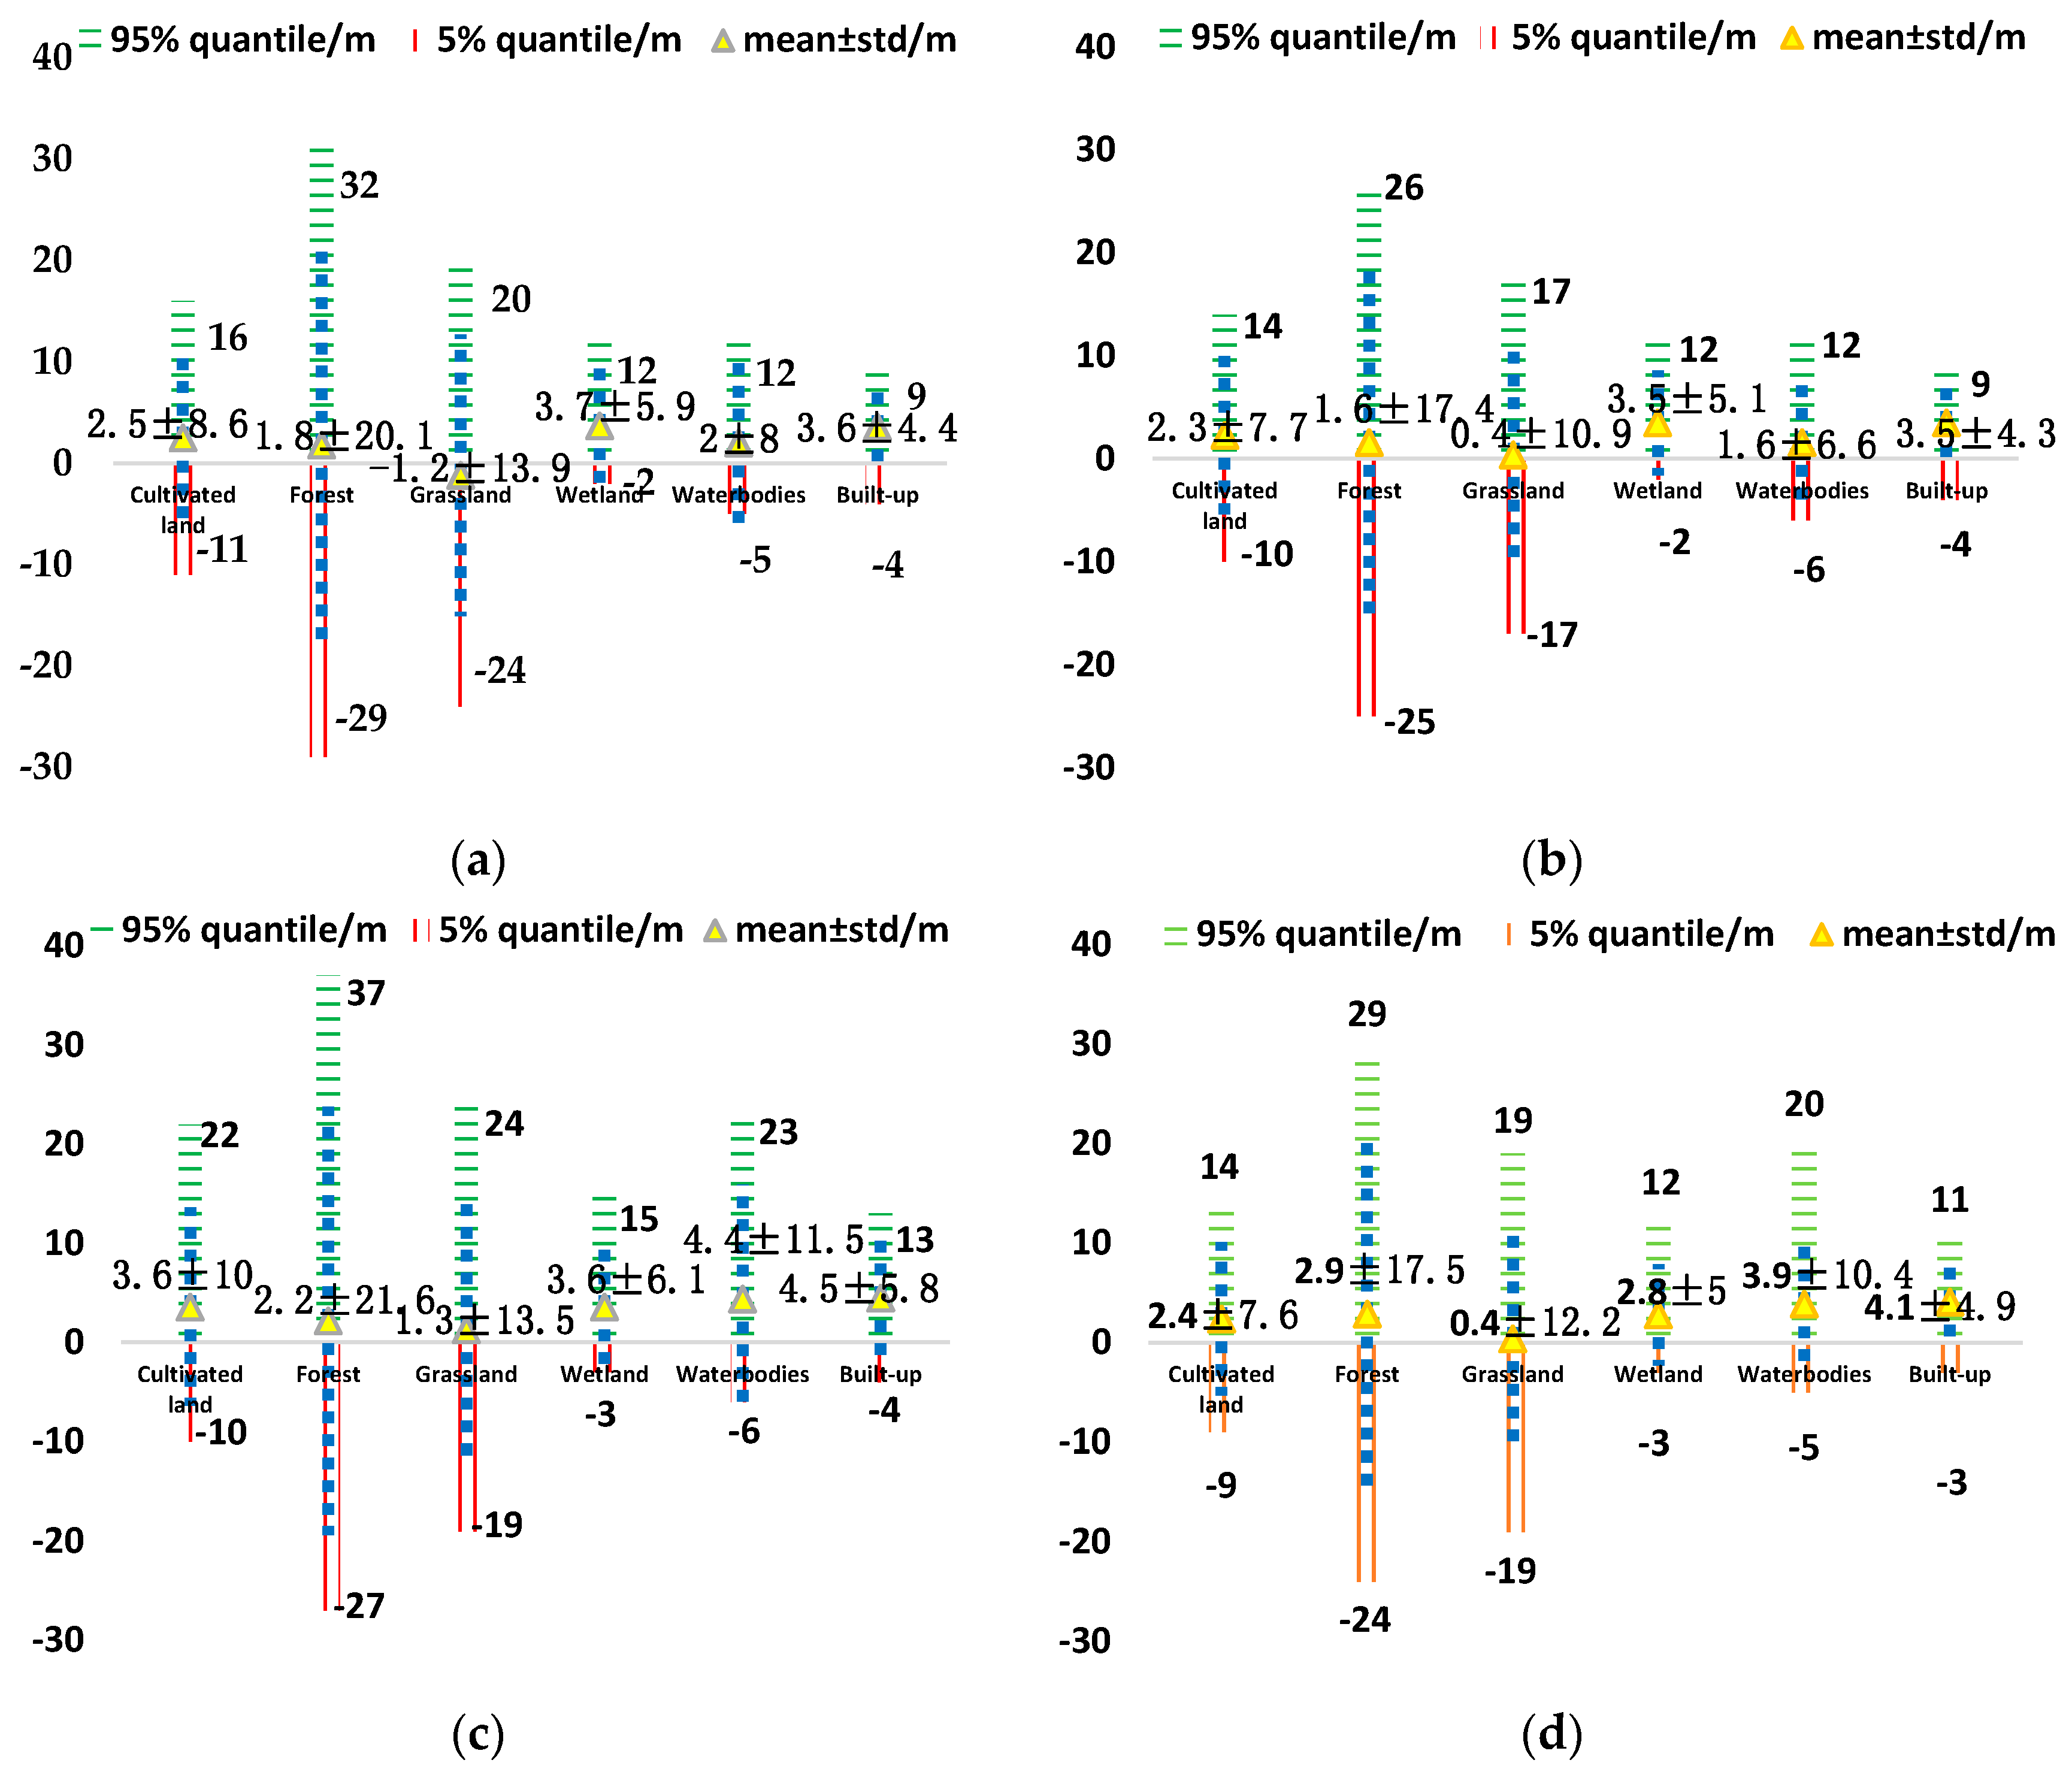
4.3. Accuracy versus Land Cover

Figure 4 shows the quantitative assessment of the four assessed DEMs in six different land cover classes based on the 30-m Global Land Cover Dataset. The DEM accuracy over forest is the lowest (standard deviation at ~20 m) in all the four assessed DEMs. The DEM accuracy over grass land and arable land is relatively better (standard deviation at ~10 m), while the DEM accuracy over artificial surface and wetland is the best (standard deviation at ~5 m). All these suggest that the canopy, either forest or vegetation, influences elevation accuracy in all of the four assessed DEMs. The higher the canopy is, the less accurate the assessed DEM appears to be. These observations are very similar to the report by Sun et al. [13] that the error of SRTM DEM for bare surface could be ~5 m while the total error of SRTM in forests could reach as high as 24.79 m, including the effect of unknown tree heights. Similarly, Li et al. [25] reported that the error of ASTER GDEM in forests is 30.2 m.
ASTER GDEM and AW3D30 are basically the “first return”, i.e., the canopy, whereas SRTM can also reach the vegetation in the middle of the canopy due to its penetration capability. As a result, ASTER GDEM and AW3D30 only record the canopy, whereas SRTM could slightly penetrate into the canopy [13,25,36]. SRTM 1 and SRTM 3 have very similar quality in cultivated land and artificial surfaces, while SRTM 1 and AW3D30 are the best in all types of land among the four assessed DEMs.
Also noted is that the accuracy of SRTM 3 and SRTM 1 is better than ASTER GDEM and AW3D30 in water areas. This is likely due to the production methods of SRTM DEM since extra steps were undertaken for water areas as reported in [6,7], while the heights in inland-water masks of AW3D30 are interpolated with surrounding valid heights [11]. Considering that the artificial surfaces and water areas are much affected by human activities, the DEM accuracy of those areas should be carefully considered when utilizing the DEM to real applications.

4.4. Accuracy versus Land Cover and Slope

Figure 5 shows the standard deviations of DEM errors with respect to slopes, respectively, for cultivated land and forest areas. The trends of the fitted curves are different in cultivated land and forest areas. In cultivated land where the tangent of slope is largely from 0 to 0.6, i.e., the slope is between 0 and 30 degrees, the standard deviations are less than 20 m. In forest areas where the tangent of slope can be higher than 1.5, corresponding to a slope of 60 degrees, the standard deviations are much higher than that in the cultivated land. In our experiment areas, most of the cultivated lands are in the plains areas, leading to smaller DEM errors. On the other hand, most forest areas are in mountainous or hilly areas, yielding larger DEM errors.
The results are consistent with the findings in Section 4.1 that the standard deviation of hilly and mountain areas are higher than that of plains areas. We find that the fitted curves of all the four assessed DEMs are closer to straight lines in cultivated land, while, in forest areas, they are exponential. Similar to the findings in Section 4.2, the vertical accuracy is negatively related to the slope.

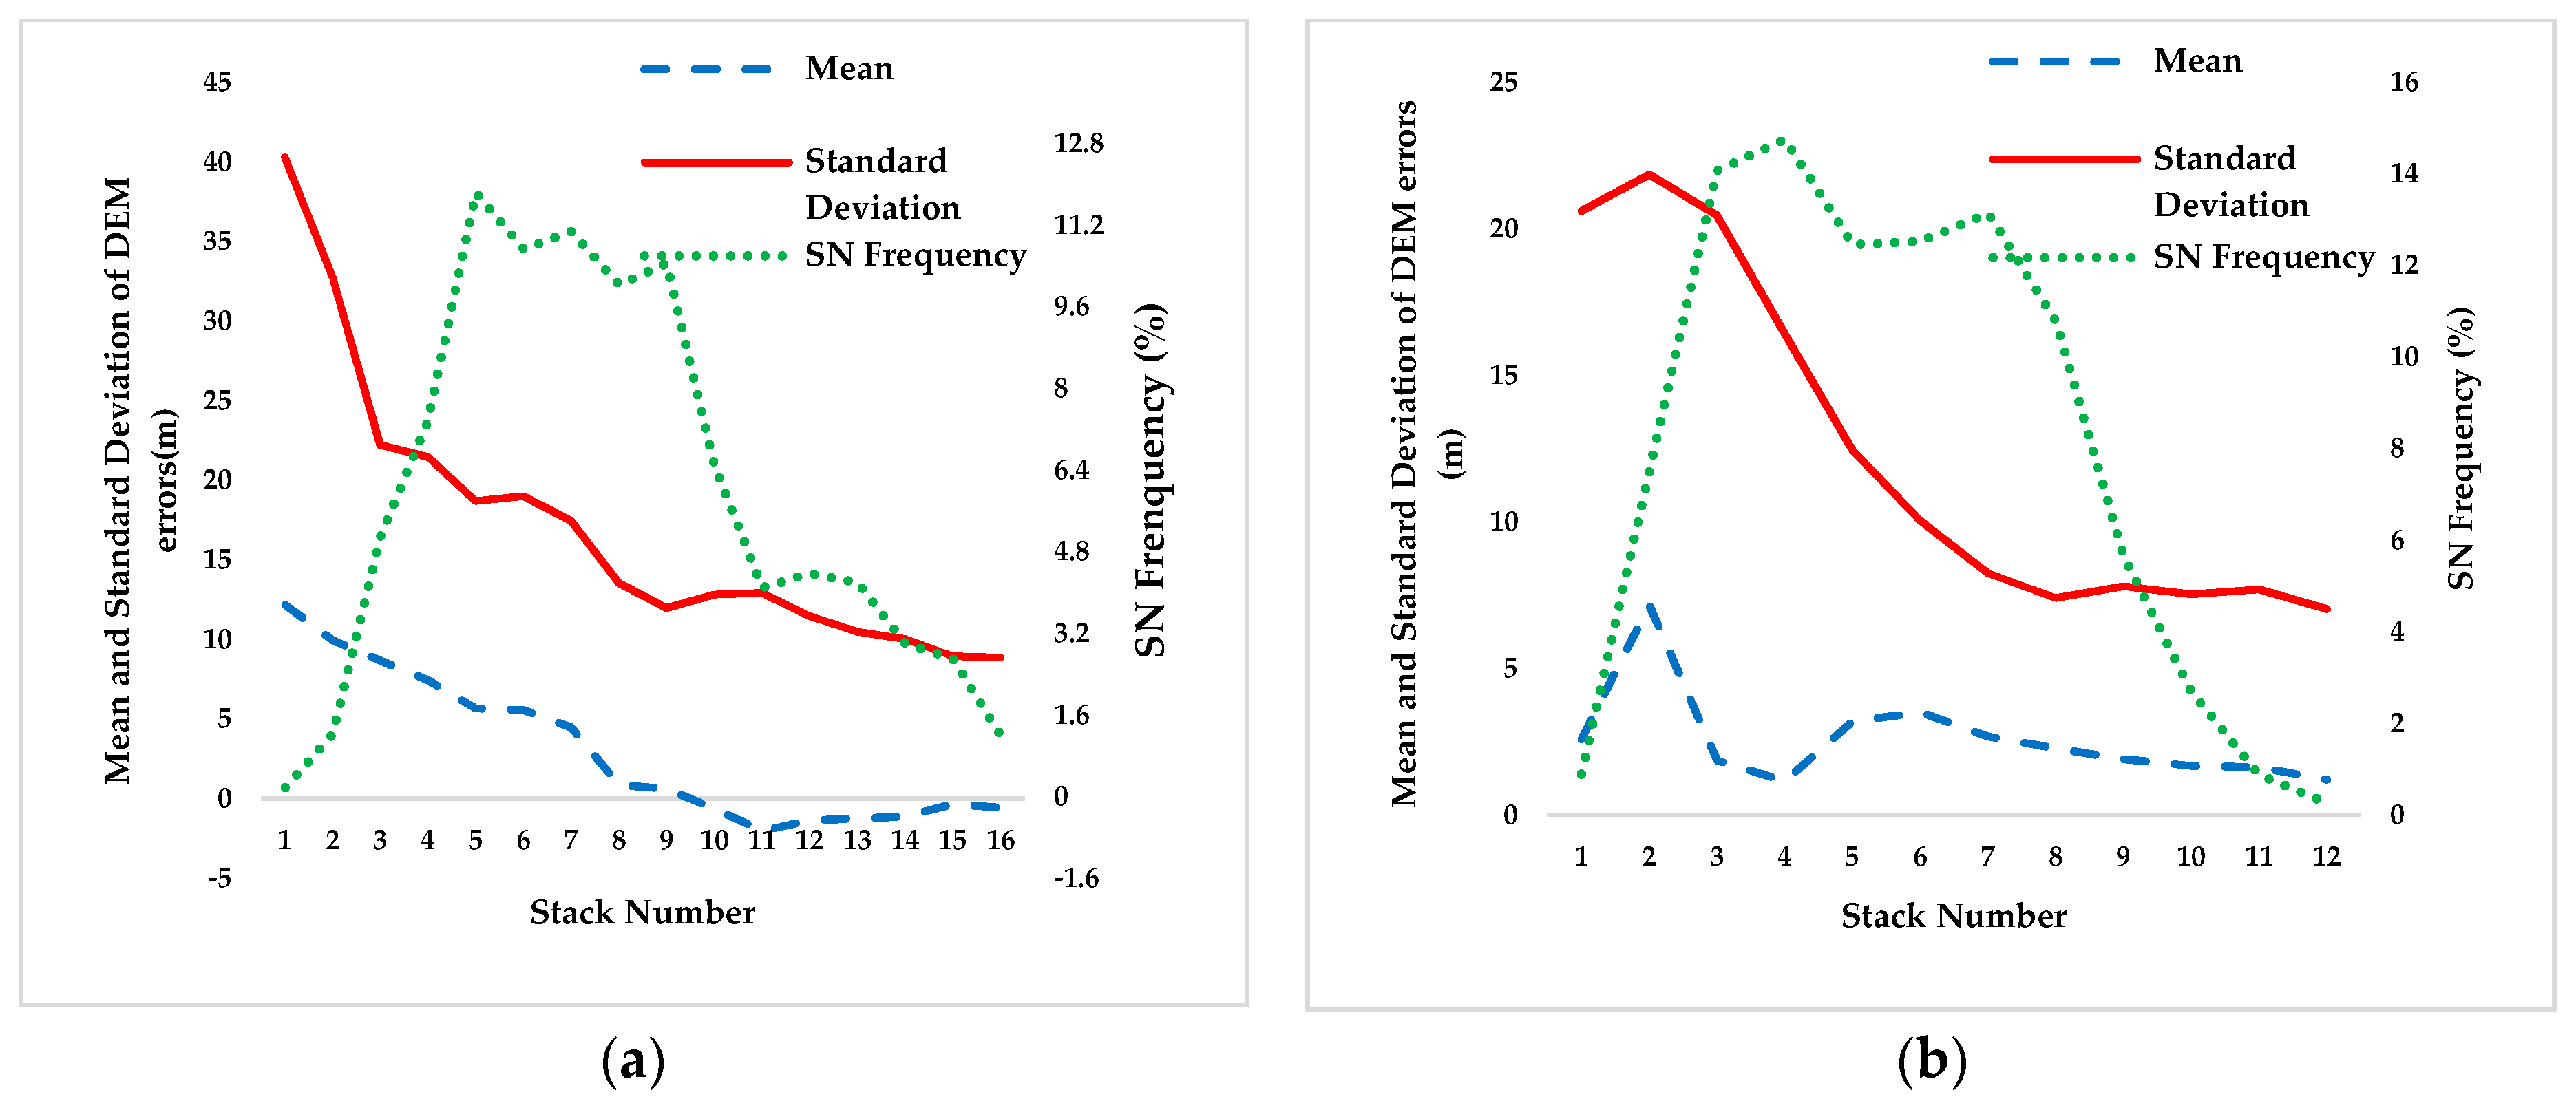
4.5. Accuracy versus Stack Number

Figure 6 shows the mean and standard deviation of the DEM errors in terms of the SN value for ASTER GDEM and AW3D30. For evaluation, we also plot the frequency of SN values as a separate line. Generally, the standard deviation of the DEM errors is getting lower with increasing SN value. For ASTER GDEM, the plains area has the highest mean SN value (9.7) while the mountainous area has the lowest (7.2). For AW3D30, the plains area and hilly area have nearly the same SN value (4.9–5.1), while that of the mountainous area is the lowest (4.0). It is shown in Figure 6 that the higher the SN value, the lower standard deviation of the DEM errors. This could partially explain why the plains area has a better accuracy than the mountainous one, as shown in Section 4.1.

5. Conclusions

Even though the source data are more than 10 years old, SRTM and ASTER GDEM are still widely used in research and practical applications since their medium resolutions meet most science requirements. More importantly, they provide completely free downloads. Recently, the SRTM 1 for outside the US (since 2015) and the global AW3D30 (since 2016) were released, but limited public work has been reported on their quality.
Our work provides the first evaluation on the most recent (one since 2015 and one since 2016) open DEMs over China. It is therefore timely and significant. We chose 10 tiles (each being 462 km2) of 1:50,000 reference DEM in Hubei Province as the reference to assess the quality of these DEMs with respect to terrain types, slopes, and land cover. Through this effort, we have the following findings: (1) all four of the DEMs have nearly the same horizontal offset with a variation of about 5 m. Such datum related transform can be completed through existing commercial tools; however, additional co-registration may still be needed for a finer outcome. (2) The DEM accuracy varies with respect to the roughness of the terrain. The more complex the terrain, the more varying the qualities among different DEMs. To be specific, all four of the DEMs have an accuracy better than 5 m (3 ± 4 m) for the plains areas, and 11.7 m (~3 ± 11.3 m) for hilly areas, whereas the DEM quality over mountainous areas varies from 18 m to 24 m, showing the effect of trees and high uncertainties existing in the measuring and processing procedures for complex terrain. (3) Among the four DEMs being evaluated, SRTM 1 has a better approximation to the terrain than SRTM 3 in hilly and mountainous areas, whereas SRTM 1 and AW3D30 have very similar qualities across all types of terrain. ASTER GDEM is often less accurate than others and depicts more sensitivities for terrain relief. It is noted that the accuracy of AW3D30 in the plains areas is consistent with its nominal accuracy of 5 m for its original 5-m mesh. (4) Without considering the tree height, the accuracy of the open DEMs is negatively related to the tangent of slope exponentially in forest areas and linear in cultivated lands. Forest areas have the lowest accuracy, comparing to artificial surfaces, wetland and cultivate land areas. SRTM 1 and AW3D30 have the higher accuracy in all land cover classes compared to SRTM 3 and ASTER GDEM. (5) The large elevation differences over forest areas are likely due to canopy coverage. Since the data sources of the open DEMs only recorded the top or middle of the canopy, there were simply no returns or measurements from the bare ground. As such, one should not expect that the conventional filtering operation applied to the open DEMs would be able to produce a meaningful bare ground DEM. This study shows that when the open DEMs are used or treated as bare ground, it may cause significant errors. Tree heights, whenever possible, should be deducted from the open DEMs when used for topographic and hydrologic applications. (6) As imagery-derived products, ASTER GDEM and AW3D30, respectively, have an average stack number of 7.2–9.7 and 4.0–5.1, all positively contributing to the DEM quality.
The release of SRTM 1 is a timely and necessary endeavor since the resolution of SRTM 3 is limited. The quality of SRTM 3 and SRTM 1 is similar and better than ASTER GDEM in the plains areas. The ASTER GDEM has the widest coverage. In practice, one can adopt SRTM 3, SRTM 1 or AW3D30 for the plains areas and use the ASTER GDEM as supplement at the same time. In hilly or mountainous areas, SRTM 1 is certainly a better choice. It is shown that the accuracy of the SRTM 1 is 2.6 ± 1.9 m on plains, 2.6 ± 9.1 m on hills, and 1.1 ± 18.6 m on mountains, only the last of which is worse than the nominal accuracy (16 m). It should be noted that these statistics include the effect of tree heights, which can be significant in hilly and mountainous areas. This property is similar to the study on the SRTM data within the US as previously reported [37]. It is unexpected that AW3D30 shows practically the same quality as SRTM 1 for all types of terrain. Considering the production workflow of AW3D30, it is likely that the resampling of the original AW3D30 5 m mesh may have considerably affected its quality. However, our work is restricted by the quality of the 1:50,000 reference DEM, which is the best we could utilize at this time for a statewide analysis. As a result, this may affect our findings for the quality differences between SRTM and AW3D30 on flat areas. Further evaluation is certainly necessary once finer and better reference DEM becomes available. Similarly, if tree heights at the time of data acquisition are available, they should be considered for such similar studies. For built-up and bare land regions, sophisticated filtering techniques may also help us to understand the intrinsic quality of the open DEMs.

Acknowledgments

The authors express their sincere gratitude to NASA, METI, USGS, CGIAR-CSI and JAXA for distributing the open DEM data to the scientific community. This work was partially supported by the National Basic Research Development Program of China (No. 2012CB719904). The authors are also grateful to the Surveying and Mapping Bureau of Hubei Province that allowed the use of the reference DEM for this study. We owe great appreciation to the anonymous reviewers for their critical, helpful and constructive comments and suggestions.

Author Contributions

Z.H., J.S. and J.P. conceived and designed the experiments; Z.H. performed the experiments and analyzed the data; Y.H. contributed analysis tools; and Z.H. and J.S. wrote the paper.

Conflicts of Interest

The authors declare no conflict of interest.

References

  1. Bolch, T.; Kamp, U.; Olsenholler, J. Using ASTER and SRTM DEMs for Studying Geomorphology and Glaciation in High Mountain Areas; New strategies for European Remote Sensing; Millpress: Rotterdam, The Netherlands, 2005. [Google Scholar]
  2. Nikolakopoulos, K.; Chrysoulakis, N. Updating the 1:50.000 topographic maps using ASTER and SRTM DEM: The case of Athens, Greece. Int. Soc. Opt. Photon. 2006, 6366, 636606–636611. [Google Scholar]
  3. Śleszyński, P. Expected traffic speed in Poland using Corine land cover, SRTM-3 and detailed population places data. J. Maps 2014, 11, 245–254. [Google Scholar] [CrossRef]
  4. Ho, L.; Umitsu, M.; Yamaguchi, Y. Flood hazard mapping by satellite images and SRTM DEM in THE VU GIA–Thu Bon Alluvial Plain, central Vietnam. Netw. World Remote Sens. 2010, 38, 275–280. [Google Scholar]
  5. Foni, A.; Seal, D. Shuttle Radar Topography Mission: An innovative approach to shuttle orbital control. Acta Astronaut. 2004, 54, 565–570. [Google Scholar] [CrossRef]
  6. SRTM 90m Digital Elevation Database v4.1. Available online: http://www.cgiar-csi.org/data/srtm-90m-digital-elevation-database-v4-1 (accessed on 5 May 2016).
  7. SRTM: NASA Shuttle Radar Topography Mission. Available online: http://vterrain.org/Elevation/SRTM (accessed on 5 May 2016).
  8. ASTER GDEM Validation Team. ASTER Global DEM Validation Summary Report. June 2009. Available online: https://lpdaac.usgs.gov/sites/default/files/public/aster/docs/ASTER_GDEM_Validation_Summary_Report.pdf (accessed on 5 May 2016).
  9. ASTER Global Digital Elevation Map Announcement. Available online: http://asterweb.jpl.nasa.gov/gdem.asp (accessed on 5 May 2016).
  10. ALOS Global Digital Surface Model “ALOS World 3D - 30m” (AW3D30). Available online: http://www.eorc.jaxa.jp/ALOS/en/aw3d30/index.htm (accessed on 29 September 2016).
  11. Takaku, J.; Tadono, T.; Tsutsui, K. Generation of High Resolution Global DSM from ALOS PRISM. In Proceedings of the International Archives of the Photogrammetry, Remote Sensing and Spatial Information Sciences, ISPRS TC IV Symposium, Suzhou, China, 14–16 May 2014; Volume XL-4, pp. 243–248.
  12. Tadono, T.; Ishida, H.; Oda, F.; Naito, S.; Minakawa, K.; Iwamoto, H. Precise Global DEM Generation by ALOS PRISM. In Proceedings of the ISPRS Annals of the Photogrammetry, Remote Sensing and Spatial Information Sciences, ISPRS TC IV Symposium, Suzhou, China, 14–16 May 2014; Volume II-4, pp. 71–76.
  13. Sun, G.; Ranson, K.; Kharuk, V.; Kovacs, K. Validation of surface height from Shuttle Radar Topography Mission using shuttle laser altimeter. Remote Sens. Environ. 2003, 4, 401–411. [Google Scholar] [CrossRef]
  14. Zhan, L.; Tang, G.; Yang, X. Evaluation of SRTM DEMs’ Elevation Accuracy: A Case Study in Shanxi Province. Geogr. Geo-Inf. Sci. 2010, 26, 34–36. (In Chinese) [Google Scholar]
  15. Wong, W.V.; Tsuyuki, S.; Loki, K.; Phua, M.H. Accuracy assessment of global topographic data (SRTM & ASTER GDEM) in comparison with LIDAR for tropical montane forest. In Proceedings of the 35th Asian Conference on Remote Sensing, Nay Pyi Taw, Myanmar, 27–31 October 2014; pp. 722–727.
  16. Mukherjee, S.; Joshi, P.; Mukherjee, S.; Ghosh, A.; Garg, R.; Mukhopadhyay, A. Evaluation of vertical accuracy of open source Digital Elevation Model (DEM). Int. J. Appl. Earth Obs. Geoinf. 2013, 21, 205–217. [Google Scholar] [CrossRef]
  17. Athmania, D.; Achour, H. External Validation of the ASTER GDEM2, GMTED2010 and CGIAR-CSI- SRTM v4.1 Free Access Digital Elevation Models (DEMs) in Tunisia and Algeria. Remote Sens. 2014, 6, 4600–4620. [Google Scholar] [CrossRef]
  18. Chaieb, A.; Rebai, N.; Bouaziz, S. Vertical Accuracy Assessment of SRTM Ver 4.1 and ASTER GDEM Ver 2 Using GPS Measurements in Central West of Tunisia. J. Geogr. Inf. Syst. 2016, 8, 57–64. [Google Scholar] [CrossRef]
  19. Miliaresis, G.C.; Paraschou, C.V.E. Vertical accuracy of the SRTM DTED level 1 of Crete. Int. J. Appl. Earth Obs. Geoinfor. 2005, 7, 49–59. [Google Scholar] [CrossRef]
  20. Abrams, M.; Bailey, B.; Tsu, H.; Hato, M. The ASTER global DEM. Photogramm. Eng. Remote Sens. 2010, 76, 344–348. [Google Scholar]
  21. Miliaresis, G.C.; Paraschou, C.V.E. An evaluation of the accuracy of the ASTER GDEM and the role of stack number: A case study of Nisiros Island, Greece. Remote Sens. Lett. 2011, 2, 127–135. [Google Scholar] [CrossRef]
  22. Suwandana, E.; Kawamura, K.; Sakuno, Y.; Kustiyanto, E.; Raharjo, B. Evaluation of ASTER GDEM2 in comparison with GDEM1, SRTM DEM and topographic-map-derived DEM using inundation area analysis and RTK-dGPS data. Remote Sens. 2012, 4, 2419–2431. [Google Scholar] [CrossRef]
  23. Rexer, M.; Hirt, C. Comparison of free high resolution digital elevation data sets (ASTER GDEM2, SRTM v2.1/v4.1) and validation against accurate heights from the Australian National Gravity Database. Aust. J. Earth Sci. 2014, 61, 213–226. [Google Scholar] [CrossRef]
  24. Mukul, M.; Srivastava, V.; Mukul, M. Accuracy analysis of the 2014–2015 Global Shuttle Radar Topography Mission (SRTM) 1 arc-sec C-Band height model using International Global Navigation Satellite System Service (IGS) Network. J. Earth Syst. Sci. 2016, 125, 909–917. [Google Scholar] [CrossRef]
  25. Li, P.; Shi, C.; Li, Z.; Muller, J.; Drummond, J.; Li, X.; Li, T.; Li, Y.; Liu, J. Evaluation of ASTER GDEM VER2 using GPS measurements and SRTM VER4.1 in China. ISPRS Ann. Photogramm. Remote Sens. Spat. Inf. Sci. 2012, i-4, 181–186. [Google Scholar] [CrossRef]
  26. Purinton, B.; Bookhagen, B. Processing, validating, and comparing DEMs for geomorphic application on the Puna de Atacama Plateau, northwest Argentina. In Proceedings of the EGU General Assembly Conference, Vienna, Austria, 17–22 April 2016; p. 2806.
  27. Santillan, J.; Makinano, M. Vertical Accuracy Assessment of 30-M Resolution Alos, Aster, and Srtm Global Dems over Northeastern Mindanao, Philippines. ISPRS Int. Arch. Photogramm. Remote Sens. Spat. Inf. Sci. 2016, XLI-B4, 149–156. [Google Scholar] [CrossRef]
  28. Chen, J.; Liao, A.; Cao, X.; Chen, L.; Chen, X.; Peng, S.; Han, G.; Zhang, H.; He, C.; et al. Concepts and Key Techniques for 30m Global Land Cover Mapping. Acta Geod. Cartogr. Sin. 2014, 43, 551–557. (In Chinese) [Google Scholar]
  29. General Administration of Quality Supervision, Inspection and Quarantine of the People's Republic of China, Standardization Administration of the People's Republic of China. In GB/T 17157–2012, Specifications for Aerial Photogrammetric Digital Mapping of 1:25,000, 1:50,000 and 1:10,000 Topographic Maps; Standards Press of China: Beijing, China, 2012. (In Chinese)
  30. Brovelli, M.; Molinari, M.; Hussein, E.; Chen, J.; Li, R. The First Comprehensive Accuracy Assessment of GlobeLand30 at a National Level: Methodology and Results. Remote Sens. 2015, 7, 4191–4212. [Google Scholar] [CrossRef] [Green Version]
  31. Guo, H.; Jiao, W.; Yang, Y. The systematic Difference and Its Distribution between the 1985 National Height Datum and the Global Quasigeoid. Acta Geod. Cartogr. Sin. 2004, 33, 100–104. (In Chinese) [Google Scholar]
  32. Guo, X.; Zhang, H.; Zhang, Z.; Hou, G.; Zhao, J. Comparative Analysis of the Quality and Accuracy between ASTER-GDEM and SRTM 3. Remote Sens. Technol. Appl. 2011, 26, 334–339. (In Chinese) [Google Scholar]
  33. Besl, P.; Mckay, N. A method of registration of 3-D shapes. IEEE Trans. Pattern Anal. Mach. Intell. 1992, 14, 239–256. [Google Scholar] [CrossRef]
  34. SRTM_Topo. Available online: https://dds.cr.usgs.gov/srtm/version1/Documentation/SRTM_Topo.txt (accessed on 23 December 2016).
  35. Gorokhovich, Y.; Voustianiouk, A. Accuracy assessment of the processed SRTM-based elevation data by CGIAR using field data from USA and Thailand and its relation to the terrain characteristic. Remote Sens. Environ. 2006, 104, 409–415. [Google Scholar] [CrossRef]
  36. Kenyi, L.; Dubayah, R.; Hofton, M.; Blair, J.; Schardt, M. Comparison of SRTM-NED data to LIDAR derived canopy metrics. In Proceedings of the IEEE International Geoscience and Remote Sensing Symposium, Barcelona, Spain, 23–28 July 2007; pp. 2825–2829.
  37. Rodriguez, E.; Morris, C.; Belz, J. A global assessment of the SRTM performance. Photogramm. Eng. Remote Sens. 2006, 72, 249–260. [Google Scholar] [CrossRef]
Figure 1. Distribution of the 10 sample areas in Hubei for the study. Samples 1–2 are plains, 3–5 hilly and 6–10 mountainous, with each being about 462 km2. The topography is from SRTM 3 in meters.
Remotesensing 09 00262 g001
Figure 2. Frequency distribution of the DEM height errors for (a) plains, (b) hilly, and (c) mountainous areas. The 5% and 95% quantiles are represented by the shaded areas. The means and standard deviations are listed in Table 3.
Remotesensing 09 00262 g002aRemotesensing 09 00262 g002b
Figure 3. The relationship between DEM standard deviation and tangent of slope angle.
Remotesensing 09 00262 g003
Figure 4. The DEM accuracy in different land covers for (a) SRTM 3; (b) SRTM 1; (c) ASTER GDEM; and (d) AW3D30.
Remotesensing 09 00262 g004
Figure 5. The relationship of standard deviation and slope in (a) cultivated land and (b) forest areas.
Remotesensing 09 00262 g005
Figure 6. Mean and standard deviation of the DEM errors versus stack number (SN) for (a) ASTER GDEM and (b) AW3D30. The frequency of SN values is also shown as a separate curve.
Remotesensing 09 00262 g006
Table 1. Specifications of SRTM 3, SRTM 1, ASTER GDEM and AW3D30.
SRTM 3SRTM 1ASTER GDEMAW3D30
Acquisition Years20002000Since 19992006 to 2011
Released Years2003Since 2015 outside US20092016
AgencyNASANASANASA and METIJAXA
Coverage60°N to 56°S60°N to 56°S83°N to 83°S82°N to 82°S
Resolution3”1”1”1”
SensorShuttle RadarShuttle RadarASTERPRISM
MethodInSARInSARStereo matchingStereo matching
Nominal Vertical Accuracy16 m16 m20 mUnknown; however, 5 m for the 5-m mesh
Nominal Horizontal Accuracy20 m20 m30 m
Websitehttp://earthexplorer.usgs.gov/http://www.eorc.jaxa.jp/ALOS/en/aw3d30/data/index.htm
Table 2. Horizontal errors (in pixels, 1 pixel = 25 m) after co-registration between the assessed DEMs and the reference DEM
DEMSouth-NorthWest-East
SRTM 3−0.20 ± 0.570.39 ± 0.74
SRTM 10.04 ± 0.84−0.01 ± 0.67
ASTER-GDEM−0.44 ± 0.65−0.59 ± 0.71
AW3D300.08 ± 0.68−0.12 ± 0.69
Table 3. Elevation accuracy (mean and standard deviation, in m) of the four DEMs in terms of terrain relief.
DEMPlainHillMountain
MeanStd.MeanStd.MeanStd.
SRTM 32.61.72.411.31.521.3
SRTM 12.61.92.69.11.118.6
ASTER GDEM2.94.2−0.410.84.723.2
AW3D302.62.32.99.92.618.9

