Article

Evaluation of Satellite Retrievals of Chlorophyll-a in the Arabian Gulf

by
Noora Al-Naimi
1,2,*,
Dionysios E. Raitsos
3,4,
Radhouan Ben-Hamadou
2 and
Yousria Soliman
2
1
Environmental Science Center (ESC), Qatar University (QU), P.O. Box 2317, Doha, Qatar
2
Department of Biological and Environmental Science, Qatar University (QU), P.O. Box 2317, Doha, Qatar
3
Plymouth Marine Laboratory (PML), Prospect Place, The Hoe, Plymouth PL1 3DH, UK
4
National Centre for Earth Observation, PML, Plymouth PL1 3DH, UK
*
Author to whom correspondence should be addressed.
Remote Sens. 2017, 9(3), 301; https://doi.org/10.3390/rs9030301
Submission received: 12 December 2016 / Revised: 18 February 2017 / Accepted: 15 March 2017 / Published: 22 March 2017

Abstract

:
The Arabian Gulf is a highly turbid, shallow sedimentary basin whose coastal areas have been classified as optically complex Case II waters (where ocean colour sensors have been proved to be unreliable). Yet, there is no such study assessing the performance and quality of satellite ocean-colour datasets in relation to ground truth data in the Gulf. Here, using a unique set of in situ Chlorophyll-a measurements (Chl-a; an index of phytoplankton biomass), collected from 24 locations in four transects in the central Gulf over six recent research cruises (2015–2016), we evaluated the performance of VIIRS and other merged satellite datasets, for the first time in the region. A highly significant relationship was found (r = 0.795, p < 0.001), though a clear overestimation in satellite-derived Chl-a concentrations is evident. Regardless of this constant overestimation, the remotely sensed Chl-a observations illustrated adequately the seasonal cycles. Due to the optically complex environment, the first optical depth was calculated to be on average 6–10 m depth, and thus the satellite signal is not capturing the deep chlorophyll maximum (DCM at ~25 m). Overall, the ocean colour sensors’ performance was comparable to other Case II waters in other regions, supporting the use of satellite ocean colour in the Gulf. Yet, the development of a regional-tuned algorithm is needed to account for the unique environmental conditions of the Gulf, and ultimately provide a better estimation of surface Chl-a in the region.

Graphical Abstract

1. Introduction

The Arabian Gulf (alternatively referred to as the Persian Gulf in the literature and hereafter referred as the Gulf) is a marginal semi-enclosed basin that is located in a subtropical, hyper-arid region. The Gulf is characterized by extreme environmental conditions where sea surface temperature varies seasonally from 15–36 °C [1] and salinity can exceed 70 psu along the southwestern coast [2]. The extreme temperature and salinity in the Arabian Gulf is probably pushing many species near their physiological limits [3,4]. Despite such harsh environmental conditions, the Gulf hosts a wide range of marine ecosystems such as mangrove swamps, seagrass beds, and coral reefs, providing valuable ecosystem services to neighboring countries. These ecosystems host an assorted marine biodiversity as they form shelter, feeding, and nursery grounds for a variety of marine organisms [5,6]. Thus, they play a significant role in the overall productivity of marine resources in the Arabian Gulf [7]. However, they experience constant, growing pressure from multiple anthropogenic sources in the Arabian Gulf region [1].
The Arabian Gulf (Figure 1a) is the most active oil production and trade area in the world [8]; it is also considered among the highest anthropogenically impacted regions on Earth [9]. The Gulf is witnessing a continuous and unprecedented development and growth in human population in its coastal zone, which is accompanied by increasing exploitation of resources and demands of services from the marine environment. This introduces huge stressors from multiple sources such as discharges from coastal dredging operations, effluents from power and desalination plants, petrochemical industries, expansion of harbor and port facilities, increased shipping and associated ballast water discharge, and effluents from sewage treatment plants [2]. The cumulative effects from the aforementioned multiple stressors are mostly contributing to an evident decline in the Gulf’s marine life [10]. Thus, it is crucial to monitor and assess the health of the ecosystem and water quality at the Arabian Gulf. Globally, many studies used phytoplankton species or biomass (Chl-a) as an important indicator of water quality [11]. To monitor, assess, and ultimately step in sustainable management of marine resources [12], it is necessary to provide long-term information on phytoplankton dynamics. However, in situ measurements serving that purpose are scarce in the Gulf due to time and cost demands. Alternatively, satellite ocean colour sensors have been depicted as excellent tools for monitoring the marine environment. The colour of the ocean is a good indicator of Chl-a, the primary photosynthetic pigment found in phytoplankton [13]. Satellite sensors have provided, over the last two decades, unique near-real-time observations on surface marine productivity [14,15].
Despite the advantages of remote sensing measurements of ocean colour, the usage of such tools in the Gulf is limited, probably due to the lack of information on their performance and reliability in the region. Indeed, previous attempts have been limited to the spatio-temporal description of phytoplankton biomass [16,17], and detection of harmful algae blooms/red tide [18,19]. To acquire reliable information from the remotely sensed datasets, a comparison against in situ measurements in the Arabian Gulf is a prerequisite to effectively inferring marine primary productivity (or phytoplankton biomass) using remote-sensing information [16]. This is particularly important for regions such as the Gulf that embrace areas that are classified as optically complex Case II water regions [17]. The Gulf is a turbid, shallow sedimentary basin (with an average depth of 35 m [1]), and in such waters, suspended sediments—particulate matter and/or dissolved organic matter (CDOM)—do not co-vary in a predictable manner with Chl-a [20]. To our knowledge, satellite-derived ocean colour data have never been validated with in situ data in the Arabian Gulf.
Using a unique set of in situ fluorometric chlorophyll measurements—collected in six cruises from 24 locations down four transects over 18 months (2015–2016)—in the central Arabian Gulf, we aim to evaluate the performance of satellite sensors in their ability to retrieve reliable Chl-a concentrations that enable understanding regional temporal and spatial trends and variabilities. The first optical depth (signal penetration in the water column) in relation to the Deep Chlorophyll Maximum (DCM) is also investigated.

2. Methodology and Data
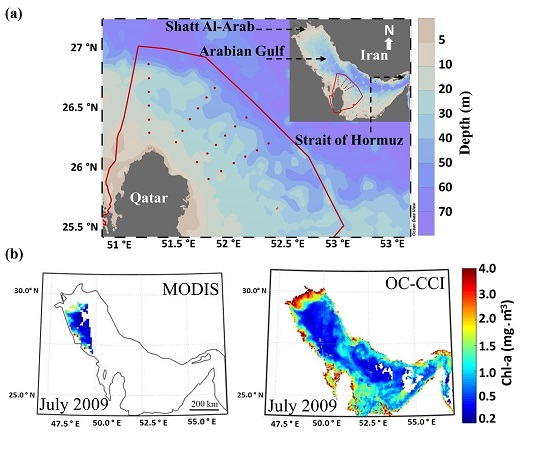
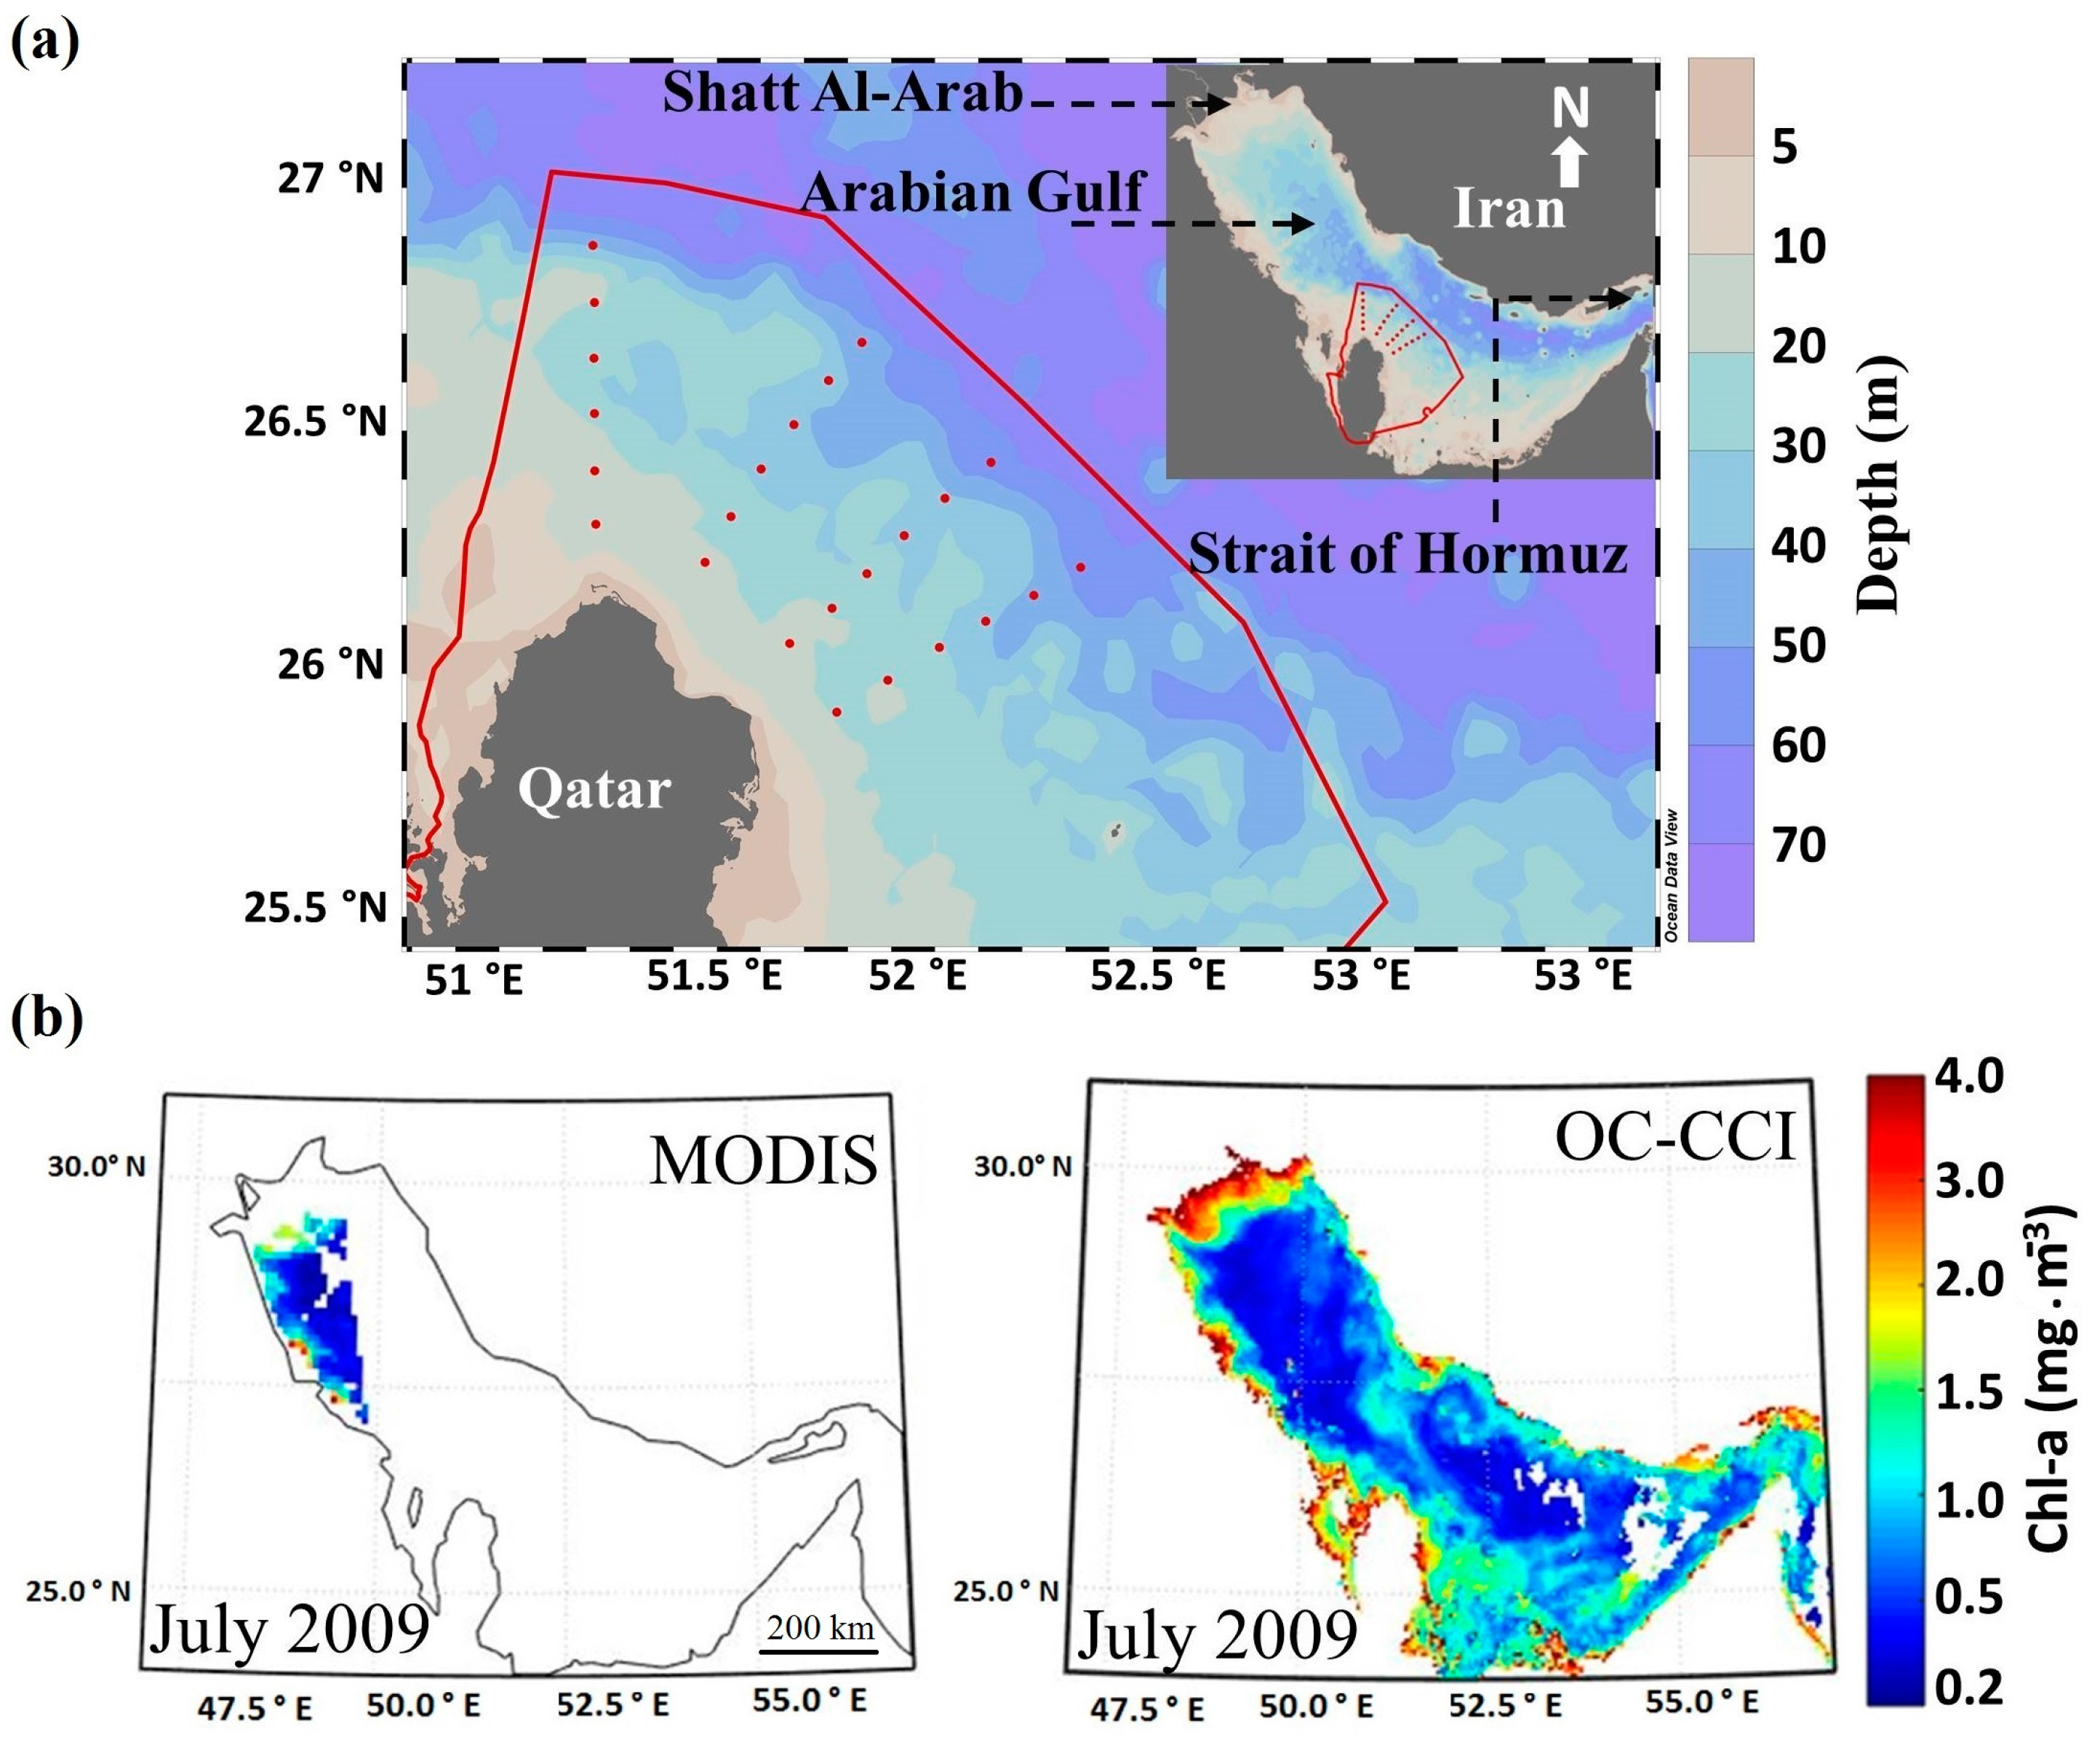
2.1. In Situ Data

Six consequent seasonal scientific cruises (April 2015, June 2015, November 2015, February 2016, April 2016, and September 2016) were carried out on the Qatar University Research Vessel (RV) Janan. In each cruise, a total of twenty-four stations were sampled for Chl-a concentrations. The study area is located at the northern and northeastern regions of Qatar’s Exclusive Economic Zone (EEZ) (Figure 1a). Four transects were covered with six equidistant stations at each transect. The first near shoreline station of each transect is located approximately 20 km away from the shoreline where the depth is greater than 10 m. The distance between the stations within a transect is about 10 km. Continuous fluorescence vertical profiles were collected down to the bottom of each of the 24 stations. The in situ measurements of fluorescence were obtained from the calibrated Sea-Bird Scientific WET Labs ECO-AFL/FL fluorometer attached to the CTD (for Chl-a descriptive statistics refer to Table S1).

2.2. Satellite Data

2.2.1. Chlorophyll Data

The Ocean Colour Climate Change Initiative (OC-CCI) project, one of fourteen European Space Agency (ESA) CCI projects, was launched to produce a long-term, consistent, error-characterized time series of ocean-colour data for use in climate-change studies [21]. To create a time-series of satellite data, the OC-CCI project implemented the use of three ocean-colour satellite platforms: the Medium Resolution Imaging Spectrometer (MERIS) of ESA (2002–2012), the Moderate Resolution Imaging Spectro-radiometer (MODIS) of NASA (2002–present), and the Sea-viewing Wide Field-of-view Sensor (SeaWiFS) of NASA (1997–December 2010) [15,22,23]. Thus, the OC-CCI dataset consists of a time-series of merged and bias-corrected MERIS, MODIS Aqua and SeaWiFS data at 4 km-by-4 km resolution [24]. The OC-CCI dataset is freely available and accessible on the project website [25]. Further information on OC-CCI processing and documentation can be found at [26].
In the present study, we used OC-CCI products to calculate the seasonal climatologies of Chl-a concentrations, due to its improved coverage in the Arabian Gulf region compared with individual sensors such as MODIS (Figure 1b). To demonstrate the improved data coverage between single sensors and the OC-CCI dataset, we compared OC-CCI data with MODIS Level 3 Chl-a data (downloaded from the NASA OceanColor archive website [27]) for July 2009. The MODIS sensor appeared to have severe issues in retrieving measurements of Chl-a during July, possibly due to the combined presence of clouds and haze during summer, which resulted in very few observations over the Arabian Gulf Region (Figure 1b). The OC-CCI dataset had the advantage of improving spatial and seasonal coverage in the Gulf (Figure 1b), which allows the investigation of summer Chl-a variability in the Arabian Gulf. Steinmetz et al. [28] reported a significantly higher number of observations in the Arabian Sea when using the atmospheric correction algorithm POLYMER for processing MERIS data. Similarly, Racault et al. [29] have shown a significant increase in OC-CCI data coverage in summer months in the Red Sea. To create the seasonal climatologies of chlorophyll in the Arabian Gulf, the v2, monthly composites of chlorophyll data were acquired from the OC-CCCI website covering the period September 1997 to December 2013 (16 years). The seasonal climatologies were plotted using Matlab 8.5 (R2015a) from Mathworks. As described by Grant et al. [30], the products of OC-CCI (v2) have some validity in case II waters, since the in situ data sets used in the round robin algorithm experiments, included data from case II waters [30]. A total of 12 monthly averaged maps of OC-CCI chlorophyll data were generated along with 16-year monthly time-series climatologies of Chl-a averaged over the Arabian Gulf. Based upon detailed examination on the Chl-a datasets (seasonal patterns in space and time), we aggregated the datasets into four main seasons, namely winter (December–February), spring (March–May), summer (June–August), and autumn (September–November). These seasons well represent the overall spatiotemporal variability of chlorophyll in the region.

2.2.2. Calculation of the First Optical Depth

To elucidate what the surface satellite-derived Chl-a actually represents, and to understand how deep the satellite signal penetrates in the water column of the Arabian Gulf, the diffuse attenuation coefficient (Kd(490)) was estimated. The attenuation coefficient is commonly used in optical oceanography to describe how the visible light in the blue-green region of the spectrum gets attenuated by the water column and thus is used as a measure for water clarity [31]. The OC-CCI Kd product is computed from the inherent optical properties (IOPs) at 490 nm and the sun zenith angle (θ), using the Lee et al. [32] algorithm [30].
The first optical depth was calculated Z90 = 1/Kd(490) and the seasonal climatologies of first optical depth in the Arabian Gulf were generated for the period of September 1997 to December 2013.

2.2.3. Comparison of Satellite-Derived Chlorophyll with In Situ Fluorescence

The OC-CCI data are not (yet) available for the year 2016. Thus, and since our in situ data were collected during 2015 and 2016, we opted to use an available up-to-date single satellite sensor to make use of all our in situ measurements in the comparison experiment. The in situ measurements were averaged over the first optical depth (10 m). We followed a similar protocol as in [24,33] with minor modifications. A 3 × 3 box centered around the location of the in situ measurement were extracted and the values within the box limits were averaged. The in situ Chl-a data were matched up in time (daily temporal matchup) and space (latitude and longitude) with the daily Chl-a data from the Visible Infrared Imaging Radiometer Suite (VIIRS), which was launched by NASA in 2011 and provides global coverage twice a day at 750 m resolution across its entire scan (downloaded from the NASA Ocean Color archive website (http://oceandata.sci.gsfc.nasa.gov)). Due to hazy and cloudy sky conditions during most of our sampling dates, we chose to select a 1-day interval for the matching up in time [34]. Out of a total of 144 in situ data points, 29 VIIRS match-ups were obtained, 11 for November 2015, 10 for February 2016 and 8 for April 2016. Approximately 80% of our in situ data points were not used, primarily due to issues in atmospheric conditions.
To estimate the errors between in situ and satellite-derived data, several methods are used in the literature ([34,35], Table 1). Here, a set of statistical indicators were used to assess the performance/quality of satellite sensor in estimating Chl-a concentrations in the Arabian Gulf. These include the Pearson correlation coefficient (r), the root mean square (RMS), and the mean difference (bias). Following Zhang et al. [35] and Marrari et al. [36], the root mean square (RMS; Equation (1)), and the mean difference (bias; Equation (2)) were used as measures to describe the similarity/difference between the two different data sets.
R M S   % = 1 n i = 1 n ( x i ) 2 × 100
b i a s   % = x ¯ = ( 1 n i = 1 n x i ) × 100
x = S I I
where stands for satellite data, I for in situ data, and n is the number of matching pairs. For a normally distributed dataset (i.e., x) RMS should equal to standard deviation. Furthermore, because the natural distribution of Chl-a is lognormal [37], error estimates were also made on the logarithmically transformed (base 10) data:
log _ R M S E   ( Δ ) = [ ( log ( S ) log ( I ) ) ] 2 n
log _ b i a s ( δ ) = [ log ( S ) log ( I ) ] n
Note that the later errors cannot be expressed as percentage after logarithmic transformation. These error estimates have been used in the literature to describe the performance of the ocean colour algorithms [38] and to validate SeaWiFS and MODIS global and regional estimates of Chl-a [35,36].

3. Results

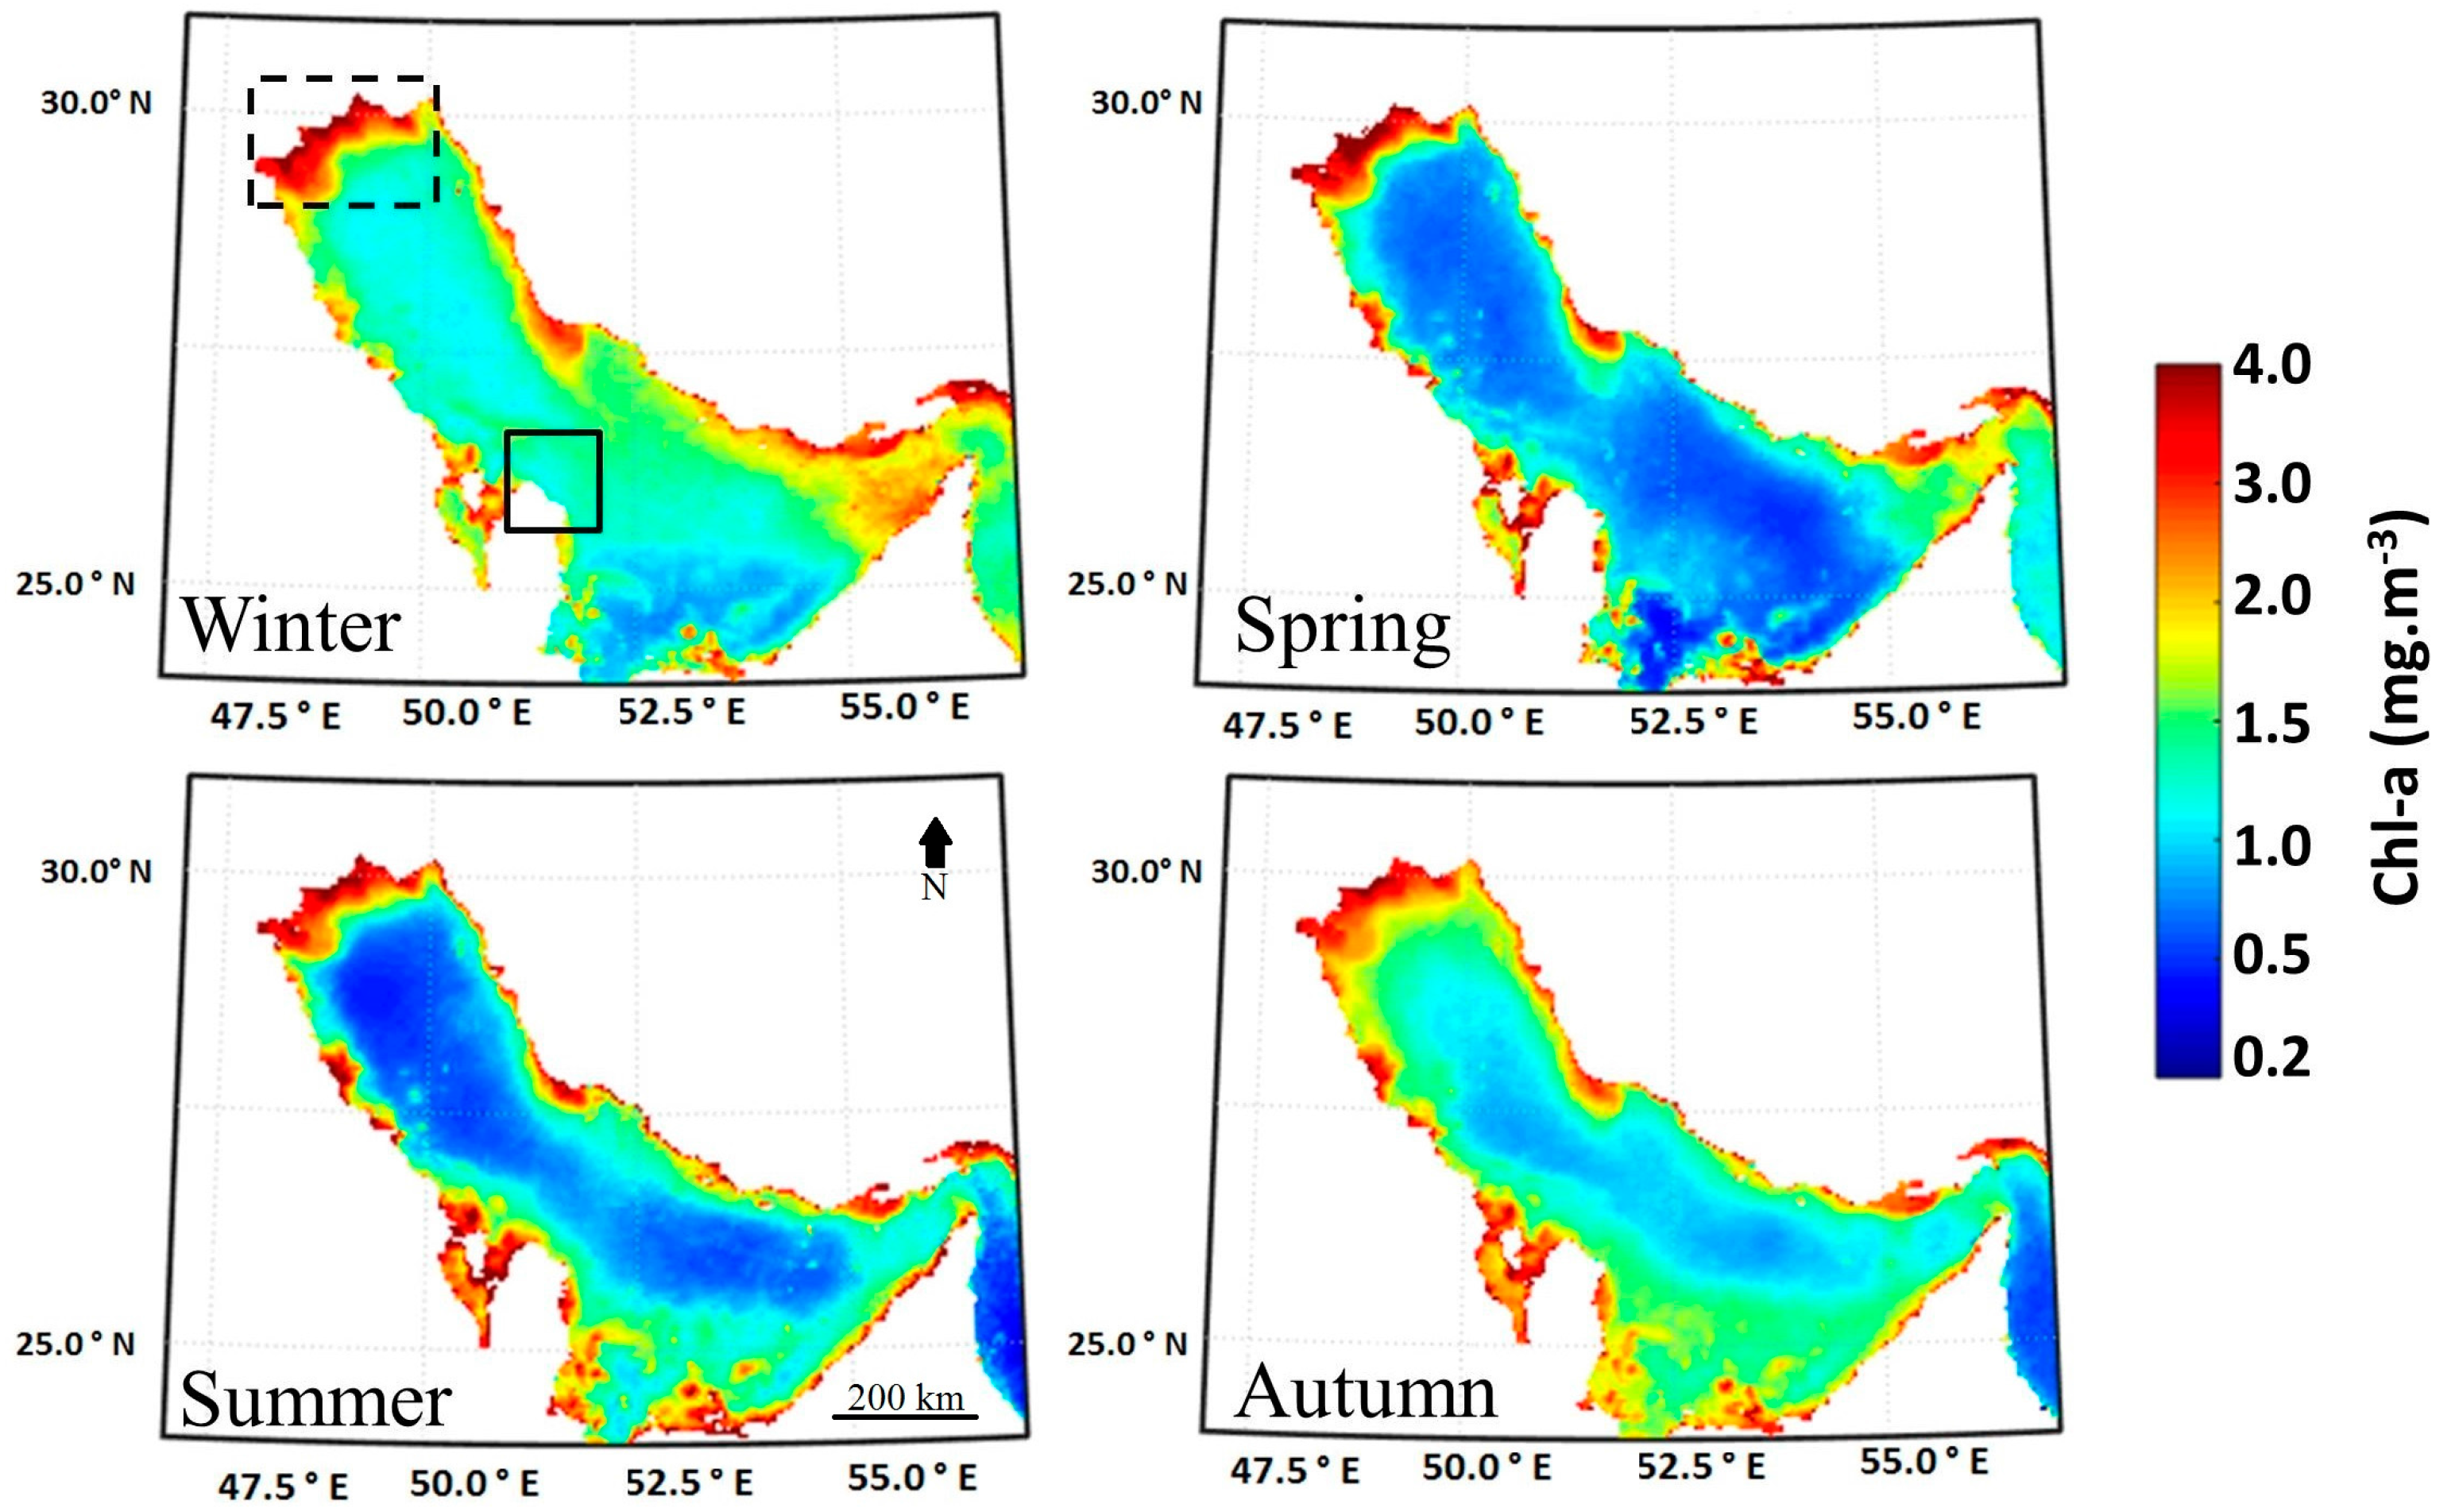
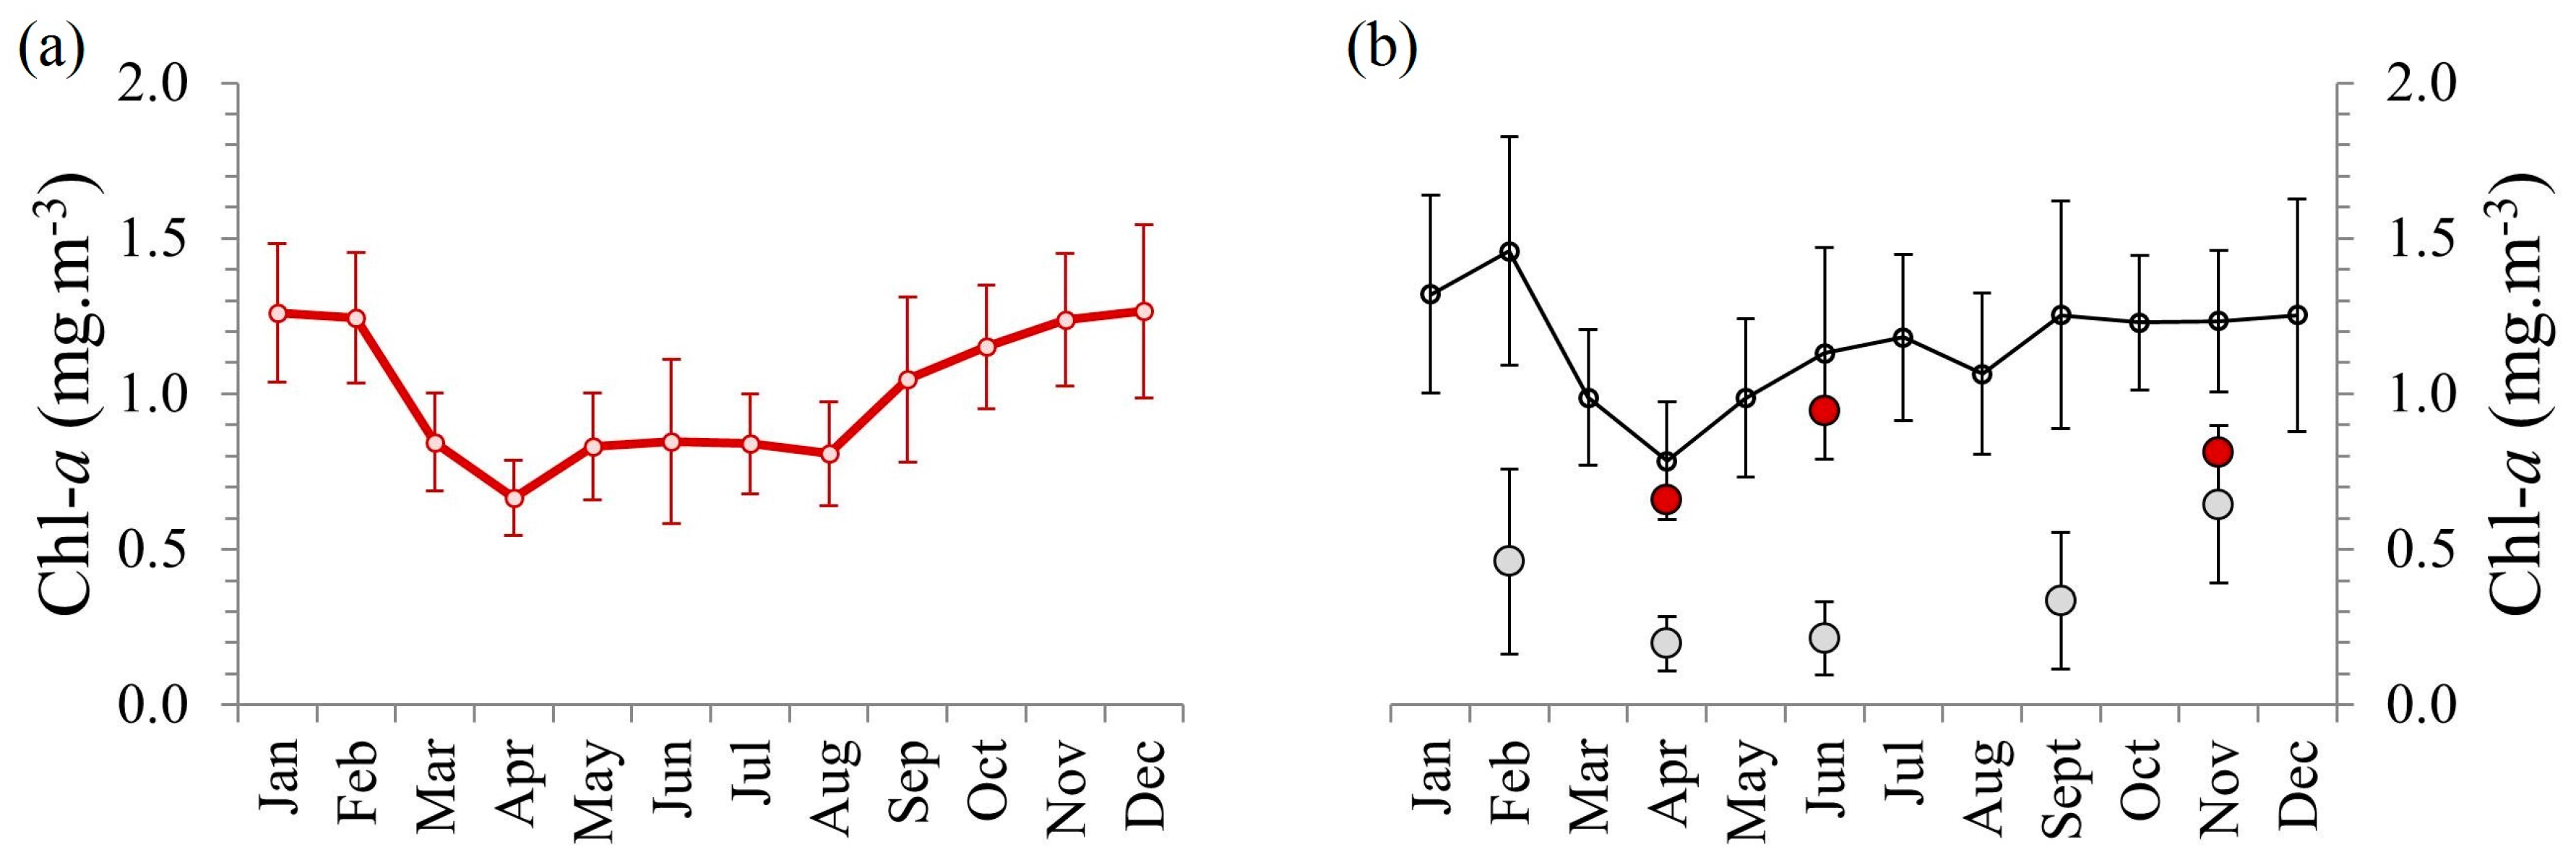
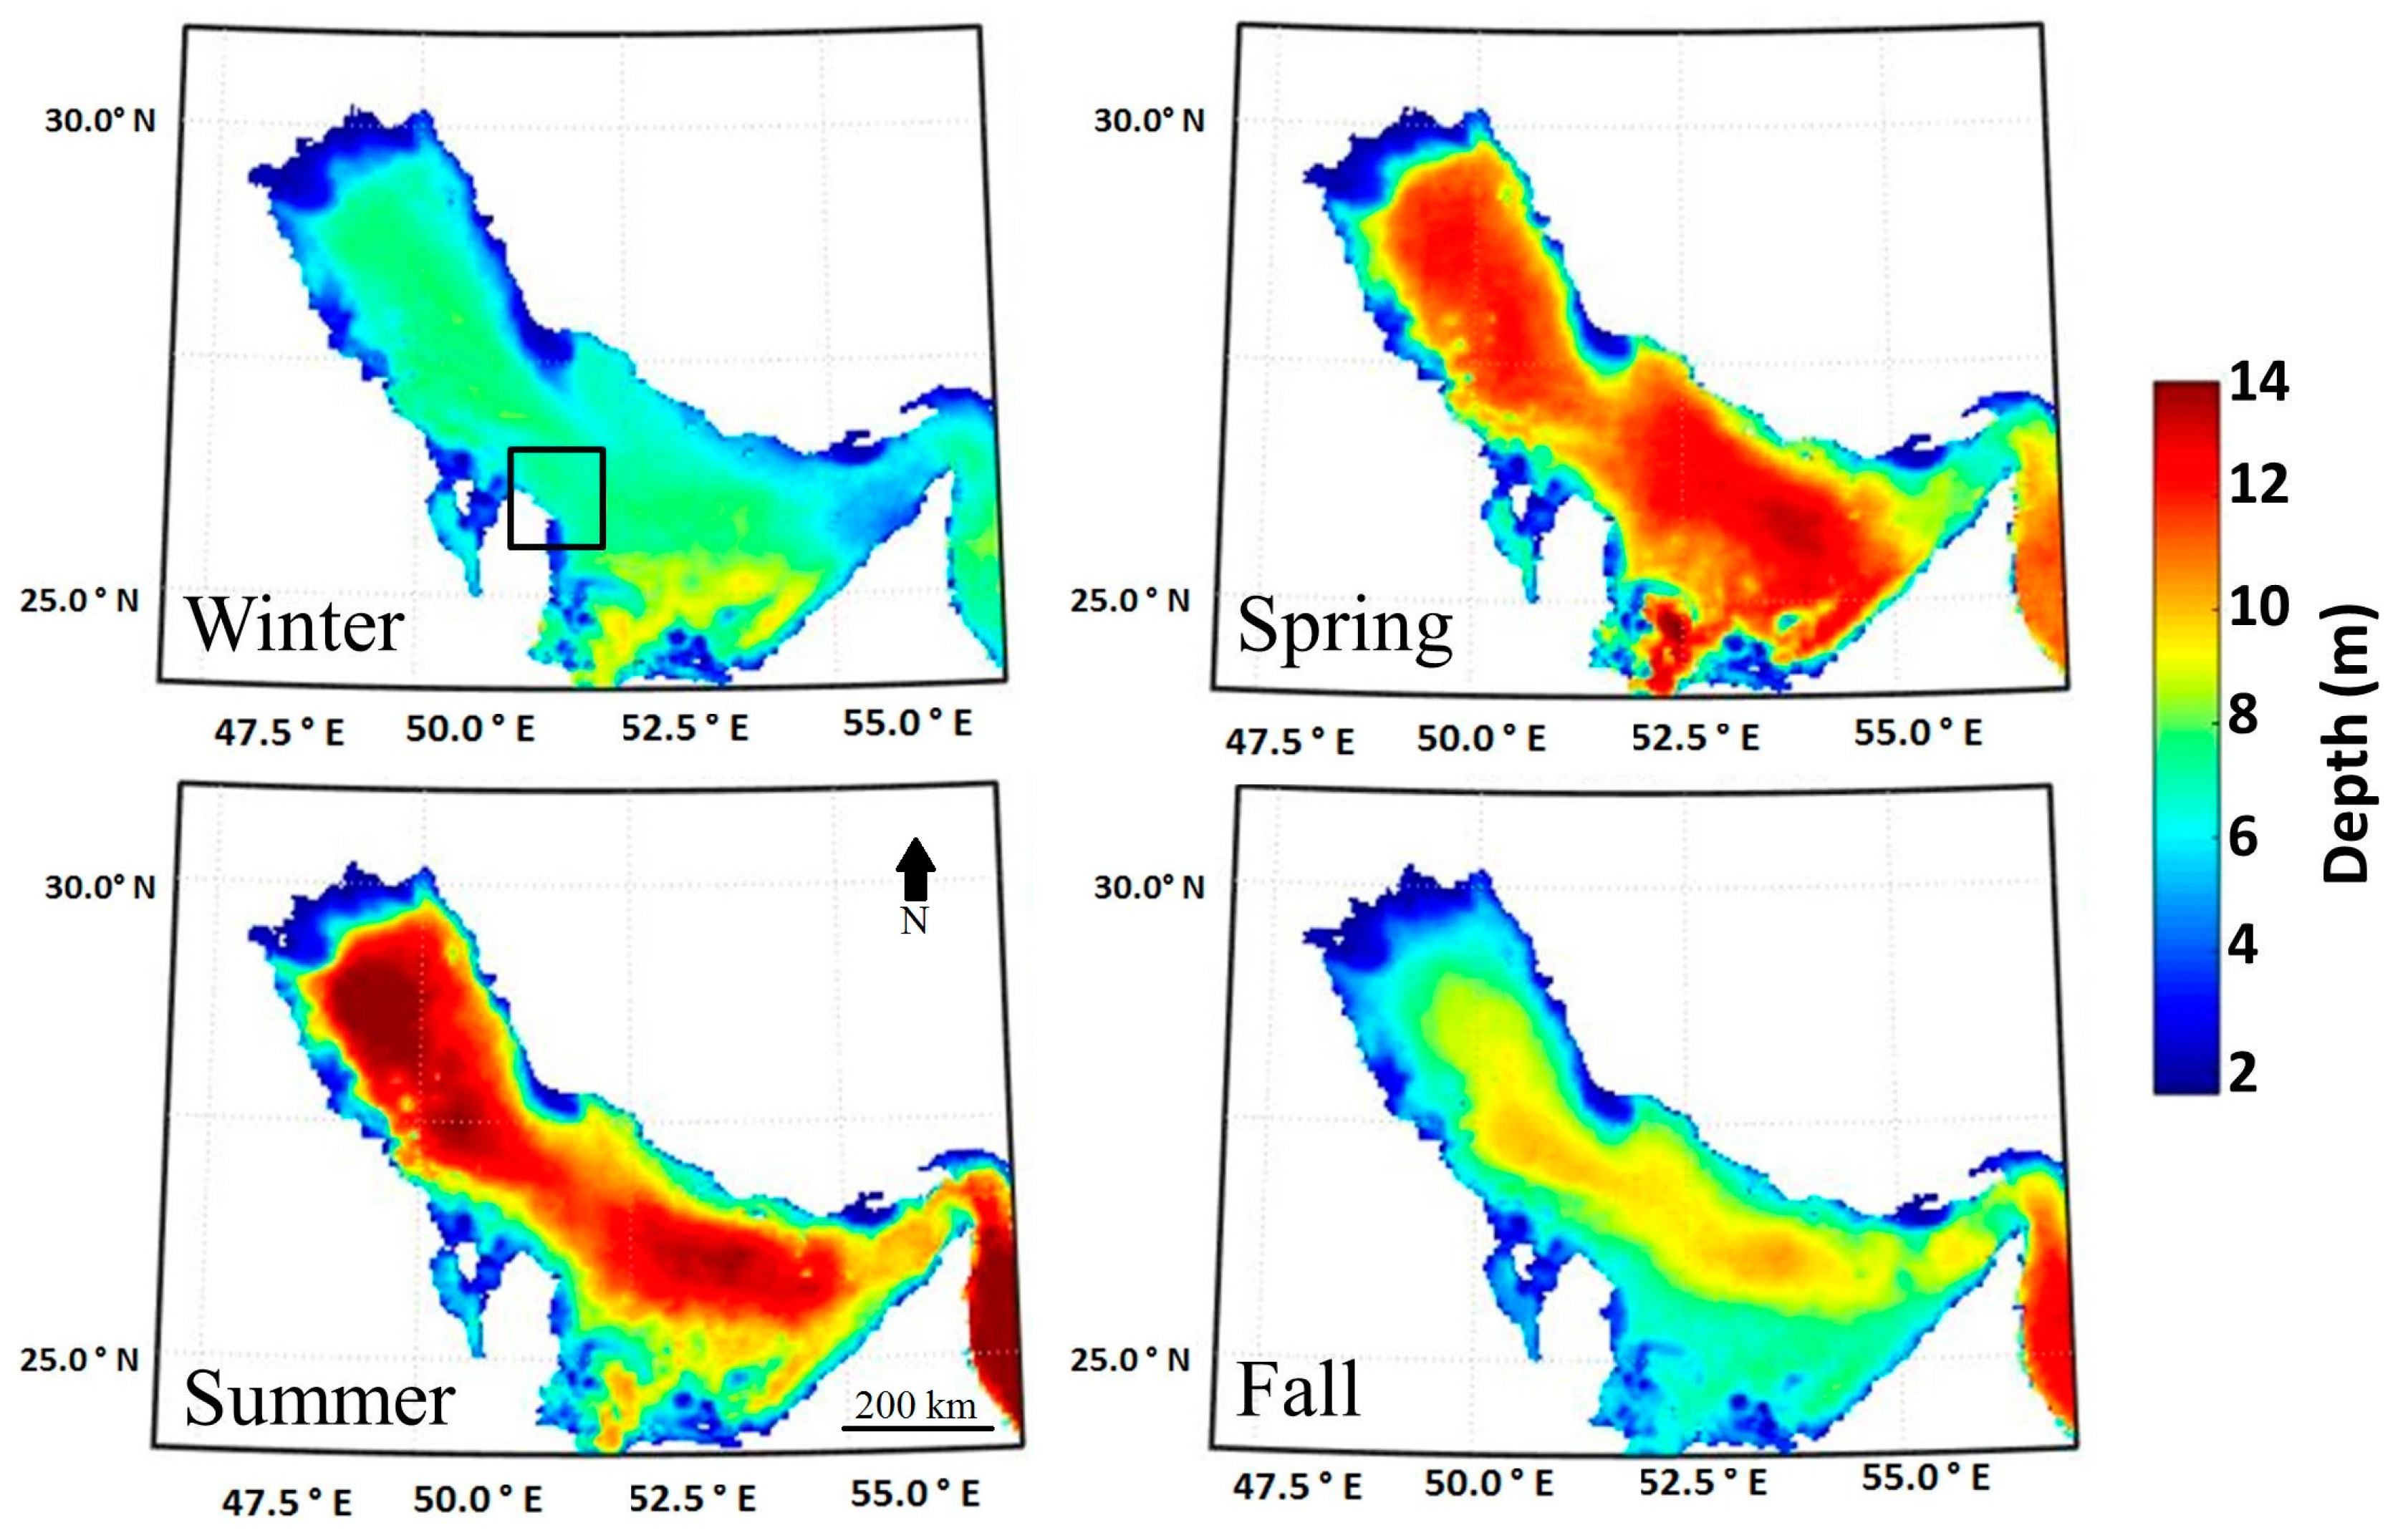
3.1. Seasonal Variablity of Satellite-Derived Chloropyll

The seasonal climatologies of Chl-a concentrations during the period 1997–2013 are depicted in Figure 2, illustrating distinct temporal and spatial patterns of surface Chl-a. Overall, the Chl-a concentrations in the Arabian Gulf were characterized by winter maximum and spring minimum. The highest Chl-a values (averaged over the whole Gulf, 1.65 ± 0.52 mg·m−3) were detected during the winter season, where the majority of the Gulf regions’ primary productivity reaches its maximum. However, the southern-most Gulf region, located at the southeastern coast of Qatar, appeared to show its highest Chl-a concentration earlier in the autumn in comparison to the open region of the Gulf. During Spring, Chl-a patterns depicted the lowest concentrations (averaged over the Gulf, 1.35 ± 0.68 mg·m−3) in the Gulf. The low concentrations continued during summer, whereas in autumn there was an apparent increase in Chl-a concentrations (Figure 2). In addition, Chl-a values appeared to be higher at the shallow coastal regions of the Gulf compared to the open-water regions. Except for the Shatt Al-Arab plume zone at the northern west part of the Gulf (Figure 2, dashed-line box), which is a nutrient-rich area due to the river discharge, the high Chl-a concentrations at the other very shallow coastal regions of the Gulf could be artifacts due to overestimation of the remotely sensed Chl-a as a result of bottom reflectance [17].
The 16-year monthly time-series climatologies of Chl-a, averaged over the open-water region of the Arabian Gulf, are reported in Figure 3a. The minimum concentrations were found in April with an average value of 0.67 ± 0.12 mg·m−3. After this minimum, Chl-a concentrations were gradually increasing through summer and autumn, where maximum concentrations observed in winter months, January and February (1.24 ± 0.21 and 1.27 ± 0.28 mg·m−3 respectively). A similar seasonal trend was identified in our study area, which lies in the middle of the open region of the central Gulf (Figure 2, solid-line box). The monthly averaged Chl-a time-series in our study area, over the period 1997–2013, showed a prominent maximum in February 1.46 ± 0.37 mg·m−3 and a minimum in April 0.78 ± 0.19 mg·m−3 (Figure 3b). Based on our in situ Chl-a time-series (Figure 3b, average of 24 stations per season) followed the seasonal Chl-a patterns retrieved from OC-CCI data, with maximum winter concentrations (February, 0.46 ± 0.30 mg·m−3) and minimum in spring (April, 0.20 ± 0.09 mg·m−3). Moreover, it is obviously noticed from Figure 3b that the satellite-derived Chl-a data is higher than in situ Chl-a, which indicates that the satellite sensors are systematically overestimating Chl-a. Overall, our study area (where the in situ data have been sampled) appeared to be a good representation of the open region of the Arabian Gulf. Despite the fact that the satellite sensors seem to represent adequately the seasonality of Chl-a at the Gulf, there is a clear overestimation of Chl-a values.

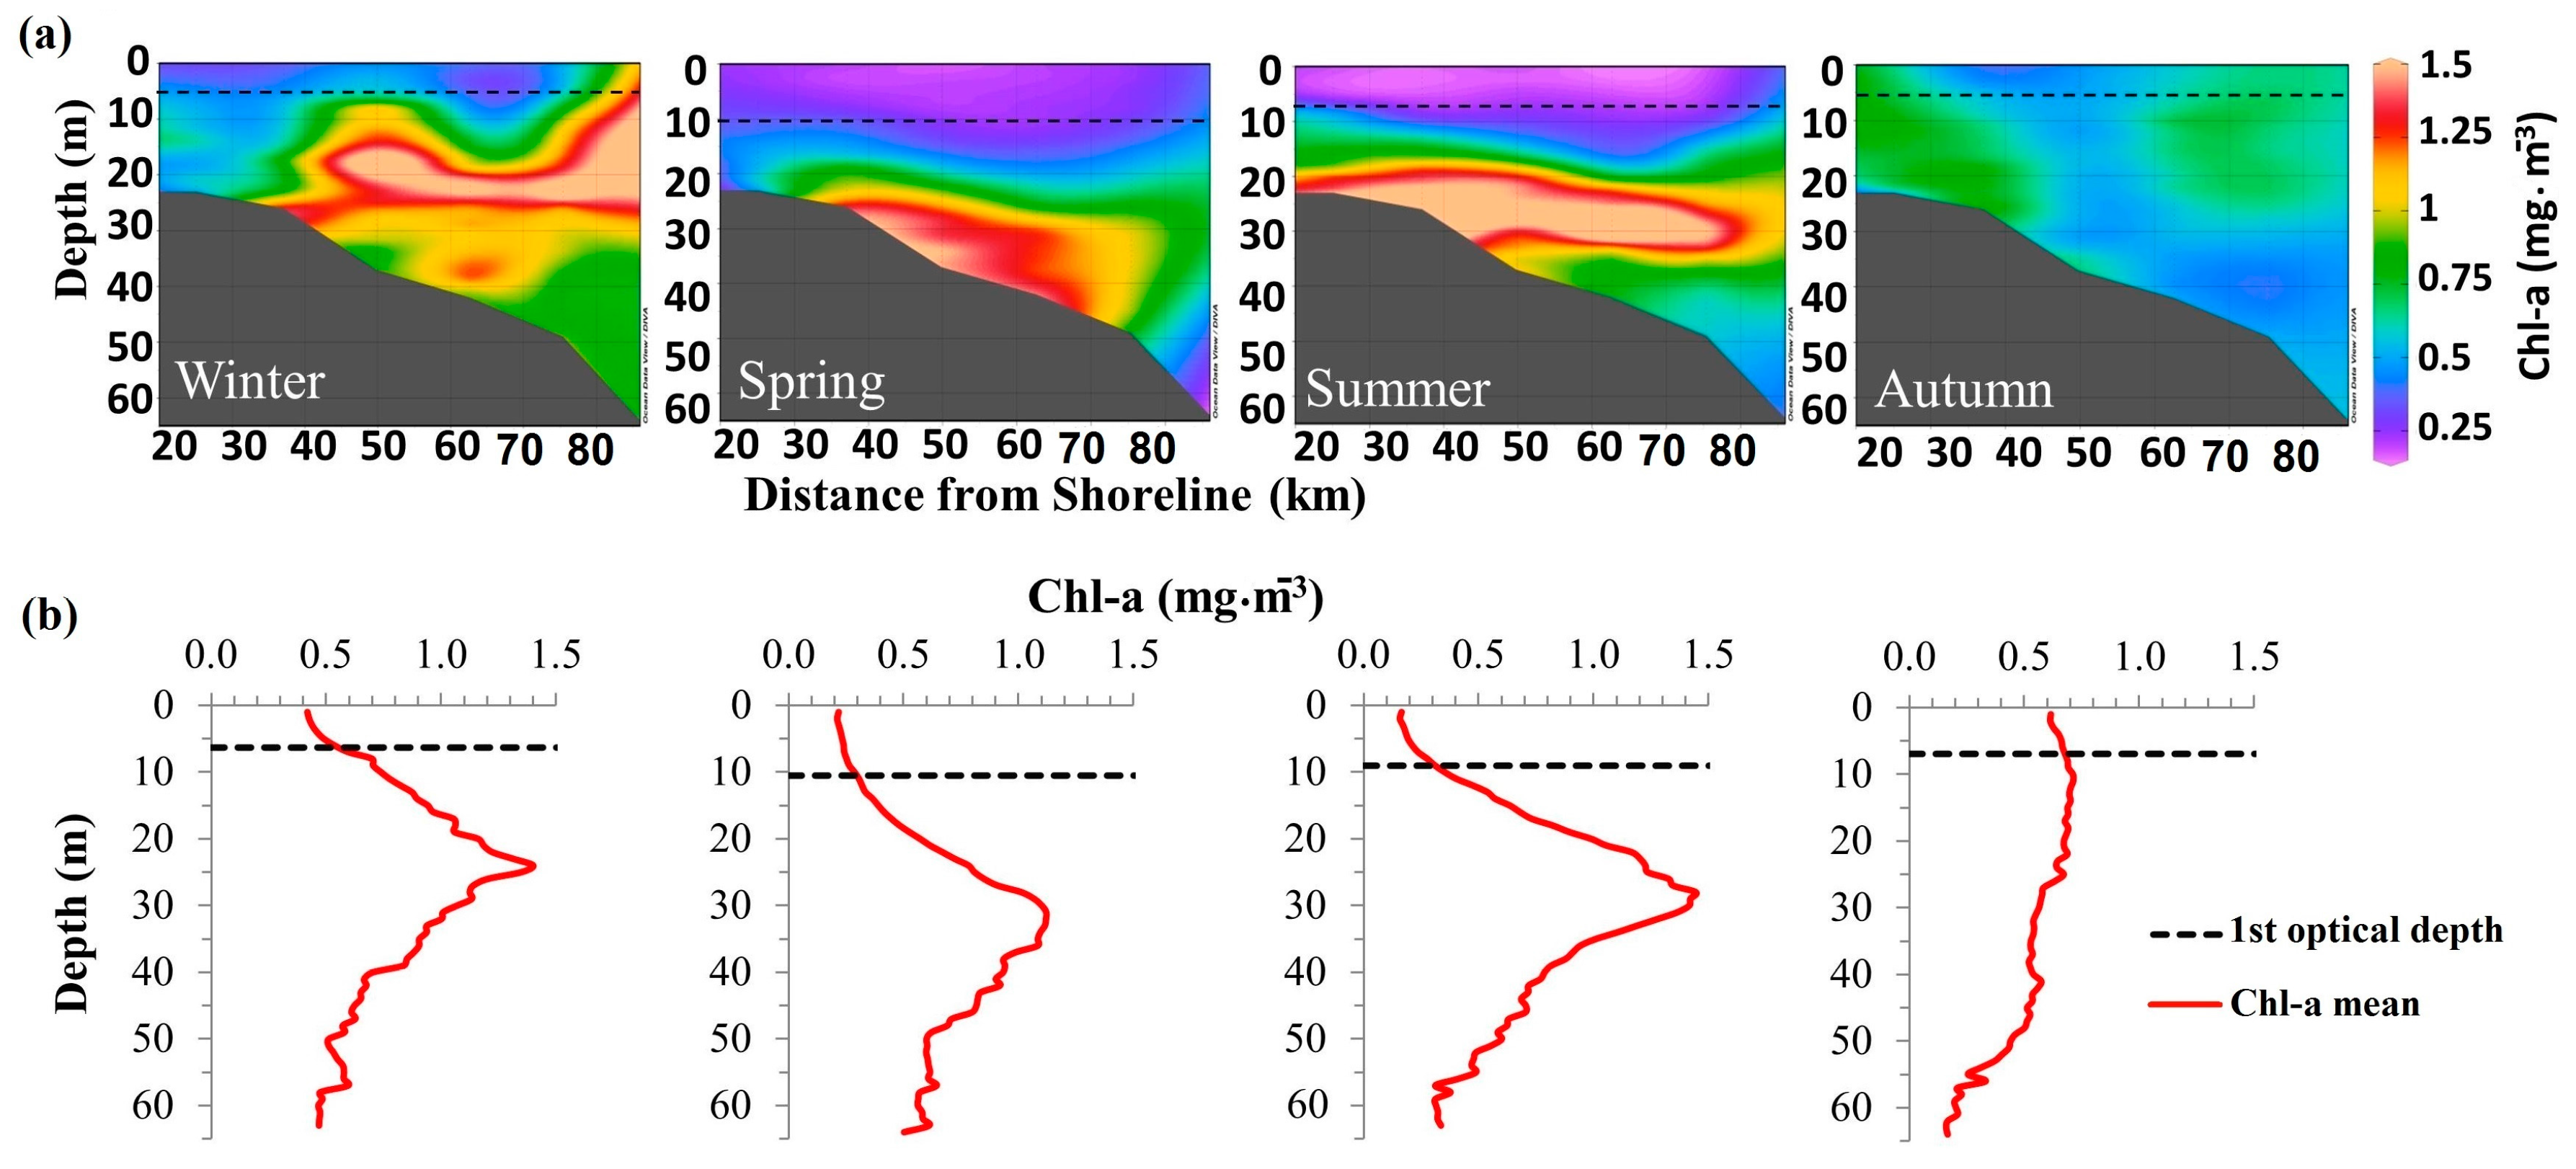
3.2. Seasonal In Situ Vertical Chl-a Profiles

To further clarify if the satellite-derived Chl-a data represent adequately the seasonality of Chl-a in the Arabian Gulf, the seasonality of a set of in situ data was considered. The seasonal in situ vertical Chl-a profiles, based on the overall average of twenty four stations (Figure 1) per season, are shown in Figure 4a,b. Initially we assessed every single continuous profile for each of the sampling transect, and observed that within a season the profiles were very similar across the study area. Thus, we decided to provide the area-averaged profiles for each season, to highlight the seasonal variability within the study area. The maximum in situ Chl-a was in winter (February 2016) with an overall average of 0.85 ± 0.57 mg·m−3 and the minimum was found in spring (April 2015, 2016) with an average of 0.57 ± 0.40 mg·m−3. A Deep Chlorophyll Maximum (DCM) is apparent in most seasons namely, winter (1.40 ± 0.76 mg·m−3) at 24 m deep, spring (1.12 ± 0.32 mg·m−3) at 32 m deep and summer (June 2015, 1.45 ± 0.49 mg·m−3) at 28 m deep, while no DCM was found in autumn (November 2015). The vertical distribution cross-section plots (Figure 4a) showed higher Chl-a concentrations during winter evenly distributed along the water column compared to spring and summer where an apparent stratification is suggested.

3.3. Seasonal Satellite-Derived Kd

To account for the depth of the satellite signal penetration in the water column, the first optical depth was computed based on the diffuse attenuation coefficient Kd(490) for each season. The seasonal climatologies of the first optical depth were mapped in Figure 5. Lower signal penetration in both winter and autumn seasons can be observed, where the average first optical depth is 6 ± 1.45 m, and 6.58 ± 1.85 m respectively. During spring and summer seasons, the satellite signal penetrates deeper reaching to an average depth of 8.77 ± 2.62 m in spring and 8.93 ± 2.94 m in summer. An apparent inverse relationship occurs between the seasonal climatology maps of Chl-a and first optical depth (Figure 2 and Figure 5). In winter, the lowest first optical depth along with higher concentration of surface Chl-a was observed, while the opposite was found in spring. Likewise, the 1st optical depth of the study area followed similar seasonal trend as in the Arabian Gulf (Figure 5). For instance, the calculated first optical depth of Qatar’s EEZ was found to be 6.32 ± 1.38 m in winter, 10.52 ± 1.42 m in spring, 9.05 ± 1.55 m in summer, and 6.94 ± 1.37 m in autumn (Figure 4). Generally, it is clear from Figure 4 that the satellite sensor did not accurately capture the DCM in most of the seasons as the first optical depth was shallower.

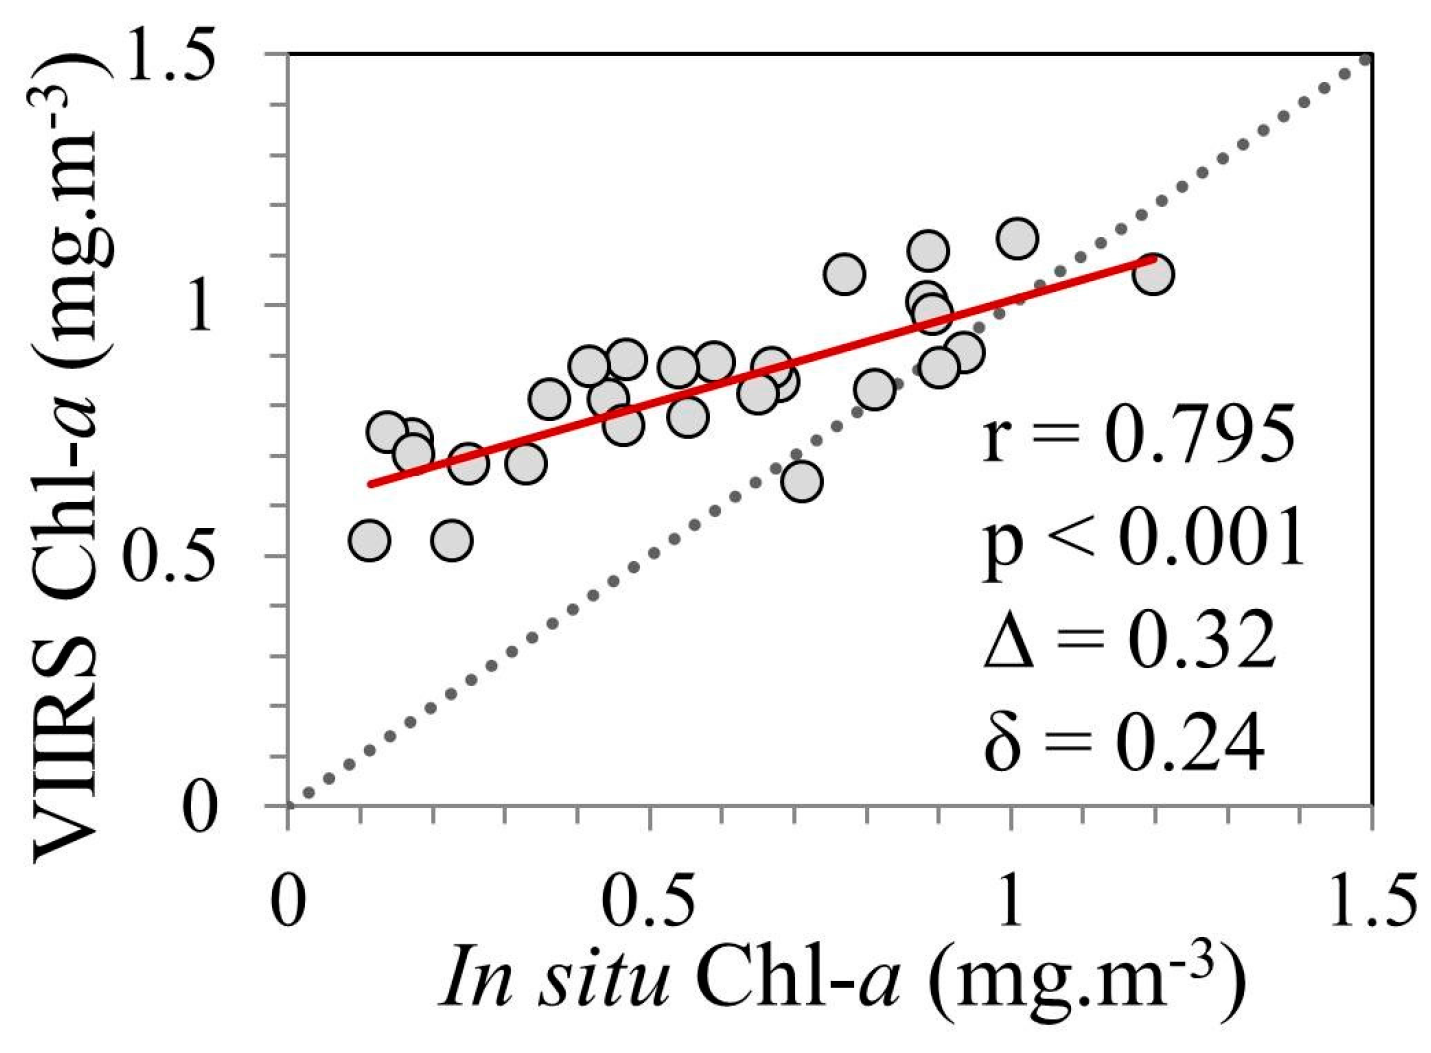
3.4. Comparison of Satellite-Derived Chlorophyll with In Situ Fluorescence

To further investigate how well the satellite sensor represents Chl-a in the Arabian Gulf, a comparison experiment was performed between in situ and satellite-derived Chl-a concentrations. During most of our sampling dates, the satellite-derived Chl-a data had several NaN values (Not A Value: these values represent data gaps primarily due to cloud coverage). However, to increase the matching pairs (to have an adequate number for statistical validation), we tried to increase the time window between satellite and in situ data sampling from two hours to one day, ultimately succeeding to find 29 match-up points. The deriving scatter plot between in situ and satellite-derived Chl-a is shown in Figure 6. It is quite encouraging (with the limited number of matchup pairs) to have a significant high correlation coefficient (r = 0.795, p < 0.001). Generally, most of our points are residing above the 1:1 line, which is an indication of an almost systematic overestimation. The overestimation seemed to be mostly on the lower Chl-a values ranging between 0.1–0.7 mg·m−3. On average, VIIRS overestimated Chl-a concentrations by 0.24 mg·m−3 in terms of log_bias, while log_RMS error was 0.32 mg·m−3. The relationship between satellite and in situ Chl-a data improved (from r = 0.722 to r = 0.795) by removing 1% of the outliers (1 data point) and log10-transformation of the data.

4. Discussion

In regions were in situ oceanographic data are limited, as in the Arabian Gulf, satellite remote sensing observations are the only means of tools for monitoring primary productivity of the marine environment at such large spatial and temporal scales. The contemporary satellite ocean colour products can provide up to 18 years of continuous datasets (like OC-CCI product) that can facilitate the deeper understanding of phytoplankton biomass variability in space and time. However, the satellite ocean colour datasets have known limitations, and thus the performance of such data should be examined prior to drawing any conclusions on patterns of ocean productivity. In the present study, and using a unique set of in situ seasonal acquired measurements, we evaluated the ocean colour satellite sensors performance in estimating Chl-a at the Arabian Gulf. Specifically, the following investigations were considered: (1) assessing the seasonality of Chl-a concentrations based on 16 years of continuous dataset, with improved coverage over the Gulf region (where single-sensor datasets have proved to be highly limited); (2) determining the first optical depth of satellite sensors’ signal (to investigate how deep the remotely-sensed signal penetrates in the water column); and (3) confidently comparing satellite-derived Chl-a with in situ fluorometric chlorophyll measurements collected during six seasonal research cruises.
The seasonal climatologies of Chl-a followed a pattern of highest concentrations during winter and lowest during spring. Both remote sensing and in situ Chl-a data showed that the central Gulf (study area) had similar pattern of chlorophyll concentration to the remaining of the Gulf region, with highest concentration in winter and the lowest in spring. However, this pattern slightly shifted in the south east region of the Gulf where the onset of the highest chlorophyll was in the autumn instead of the winter. The in situ data for Chl-a concentrations showed similar patterns of highest Chl-a in February and the lowest in April and this indicate that the climatologies capture the large scale seasonal distribution of the Gulf region. The low Chl-a concentration in April is probably due to the fact that nutrients were depleted by the phytoplankton bloom in winter. According to Nezlin et al. [16], it is typical to have such seasonal cycles in tropical and subtropical oceans, where phytoplankton growth is limited by lack of nutrients due to a strong pycnocline formation. This coincides with thermal stratification that stabilizes the water column, limiting the vertical mixing, and thus, nutrient supply to the surface [39]. Our results are coherent with other studies [16,40], although they performed their analysis on the spatio-temporal variations of phytoplankton biomass in the Arabian Gulf using a single-sensor Chl-a dataset. They reported that the highest Chl-a concentrations in the open-water region of the Gulf takes place in winter, while lower concentrations were observed in both spring and summer.
Satellite sensors are capable of measuring Chl-a concentrations in the top layer of the water column. To understand how much of the water column is detected by the sensors, it is crucial to estimate the penetration depth of the observed signal, which depends on the light attenuation in the water column. In this study, we computed the first optical depth from the satellite-derived Kd(490). Our findings clearly suggest that the first optical depth in the Arabian Gulf region is relatively shallow. The satellite sensors capture shallower depths (4–8 m) in autumn-winter seasons (when Chl-a concentrations are higher), while in contrast, deeper depths (9–11 m) are captured during spring and summer (when Chl-a concentrations are lower). According to Morel [41], in clear open waters, it is normal to have deeper first 1st optical depths at low Chl-a concentrations, ranging between 0.01–1 mg·m−3. The Arabian Gulf is shallow (average depth 35 m), and thus is subject to strong influence by the prevailing winds, i.e., Shamal (northwesterly wind), that blows throughout the year. These northwesterly winds intensify at the peak of the winter (most prominently from December to February) and are responsible for the intense turbidity and vertical mixing of the water column in the whole region [42,43]. Therefore, it is highly probable that suspended sediments and/or coloured dissolved organic matter (CDOM) contributed to a shallower first optical depth in the Gulf region. The latter observations agree well with our in situ and satellite-derived datasets. Due to the shallowness and turbulence found in the sampling area, the waters are likely to be turbid, which means that the bottom reflectance issue is likely minimum. Similar patterns have been reported by Al Kaabi et al. [8], were the authors demonstrated seasonal variations of Secchi disk depth (SDD) over the entire Gulf using a set of in situ SDD measurements versus 14-year time-series of MODIS/Aqua Kd data. Generally, higher SSD values were observed in summer, while lower values were found in winter [8] (Al Kaabi et al., 2016). The authors developed a locally-adapted algorithm to estimate SSD from satellite-derived Kd over the Gulf using Lee’s algorithm [32]. Based on a set of SDD in situ measurements from the Arabian Gulf, the developed algorithm performed well in comparison with other SDD models established in other regions [8]. We compared our first optical depth, calculated based on OC-CCI Kd data, with the SDD calculated using Al Kaabi et al. [8] proposed algorithm for the Arabian Gulf, and the result appeared to be exactly the same (r = 1, p < 0.001) indicating that our findings well captured the first optical depth acquired by the satellite sensors in the Arabian Gulf (Figure S1). Moreover, our findings suggest that the satellite sensors do not capture accurately the DCM in most of the seasons (Figure 4). However, during the winter, the satellite sensors may capture small portion of the DCM due to the intense seasonal vertical mixing in the water column, which redistributes nutrients enhancing phytoplankton growth near the surface. Blondeau-Patissier et al. [14], stated that deep chlorophyll maxima are not always captured by satellites because ocean colour observations are limited to the first optical depth.
To evaluate the performance of satellite sensors in estimating absolute values of surface Chl-a at the Arabian Gulf, we run a comparison experiment with our in situ Chl-a datasets. Although the match-up pairs were sparse, the results showed a significant correlation (r = 0.795, p < 0.001). Our findings suggest that satellite sensors are systematically overestimating Chl-a concentrations in the Gulf (on average by 0.32 mg·m−3). The consistent overestimation (especially at lower Chl-a concentrations) retrieved in our study could be partially explained by the known limitation of remotely sensed Chl-a data in shallow optically complex Case II waters [20,44]. In other words, scattering by sediments in turbid waters and underwater reflectance from shallow areas could result in relatively high water-leaving radiance in the near-infrared (NIR) wavelengths, which could overestimate the correction term (as seen in the near-by Red Sea, [24]). Several shallow coastal regions of the Gulf that exhibited higher Chl-a concentrations (such as the southeastern coast of Qatar) in comparison with the open waters are likely to be influenced by suspended substances and/or bottom reflectance. Therefore, conclusions on the absolute values or seasonal patterns in such areas should be cautious, as the remotely-sensed ocean colour data are likely biased, and thus, should be excluded from a time-series analysis [16]. However, not all the coastal high Chl-a values are necessarily erroneous, as at the northwestern part of the Gulf (Shatt Al-Arab, Figure 2a) where there is a river discharge, which provides a rich source of nutrients that enhance phytoplankton production near that region. Consistent with findings from other regional studies on validation of satellite-derived and in situ Chl-a (Table 1), our results are comparable to the performance of ocean colour sensors in complex coastal waters regions around the globe (such as the Gulf of Gabes in the Mediterranean Sea, northern South China Sea, eastern Arabian Sea, and the Red Sea). Finally, although we provide evidence that the satellite sensors overestimate Chl-a concentrations in the Gulf, we have to acknowledge that some other factors could have also contributed to the uncertainties. Some of these may involve biases due to the low number of matching pairs, the precise difference in time window between in situ and satellite observations, and the complex nature of the very shallow, turbid Arabian Gulf.

5. Conclusions

In this study, we assessed the performance of ocean colour satellite sensors in estimating Chl-a at the Arabian Gulf. Using a unique set of in situ Chl-a measurements, collected from six recent research cruises (2015–2016) covering a large area of the Gulf, and a 16-year dataset of satellite-derived Chl-a (OC-CCI), we found a distinct seasonal pattern of surface Chl-a in the Gulf with maximum concentrations in winter and minimum concentrations in spring. In situ measurements of Chl-a revealed a marked DCM in most seasons at 24–32 m, which was not captured by the satellite sensors since the estimated first optical depth in the Gulf (6–11 m) was shallower than the DCM depth. Although the satellite sensors seem to appropriately represent the seasonality of Chl-a at the Gulf, there is a clear overestimation of Chl-a values. Our comparison experiment between in situ and VIIRS Chl-a indicated an overestimation of Chl-a (on average by 0.32 mg·m−3) mostly for lower Chl-a concentrations. Although many factors are suggested to contribute to the uncertainties of this evaluation (such as the limited number of in situ measurements), our results from the optically complex waters of the Arabian Gulf were found to be comparable with other optically complex regions around the globe. We support the use of ocean colour data in the Arabian Gulf; however, we highlight the need for a regionally-calibrated algorithm to estimate Chl-a in the Gulf. This requires a large set of in situ data covering the whole region of the Gulf, which requires a regional collaborative investigation in the Gulf amid the eight member states of the Regional Organization for the Protection of the Marine Environment (ROPME).

Supplementary Materials

The following are available online at https://www.mdpi.com/2072-4292/9/3/301/s1: Table S1: Descriptive statistics of top 10 m chlorophyll-a in situ measurements (mg·m−3) in the EEZ of Qatar during six sampling cruises in 2015–2016, Figure S1: Correlation between 1st optical depth in the Arabian Gulf derived from OC-CCI Kd data and Al Kaabi et al. (2016) algorithm, Figure S2: Residual plot of in situ Chl-a and Chl-a from linear regression of Figure 6 suggesting that the linear regression model is appropriate as the residuals have no clear pattern and are relatively small in size.

Acknowledgments

This work was support by Qatar University (Grant No. QUST-CAS-FALL-14\15-39). D.E.R. is funded through the NERC’s UK National Centre for Earth Observation. The authors would like to thank the captain and the crew of RV Janan and the technical team at Qatar University Environmental Science Center who made the collection of the in situ data possible. The authors thank Shubha Sathyendranath for the useful discussions on Optical Depth; the NERC Earth Observation Data Acquisition and Analysis Service (NEODAAS) and the ESA Ocean Colour Climate Change Initiative Team for providing OC-CCI chlorophyll data; and NASA for providing MODIS and VIIRS chlorophyll data.

Author Contributions

N.A. and D.E.R. designed the architecture of the manuscript. N.A. and Y.S. designed the field cruises. R.B. contributed to produce climatology maps and helped in Matlab programing. N.A. performed the data analysis and produced the figures. N.A. wrote the first draft of the manuscript, and all authors contributed to revisions.

Conflicts of Interest

The authors declare no conflict of interest.

References

  1. Naser, H. Marine Ecosystem Diversity in the Arabian Gulf: Threats and Conservation. In Biodiversity-The Dynamic Balance of the Planet; Grillo, O., Ed.; InTech Publishing: Rijeka, Croatia, 2014; pp. 297–328. [Google Scholar]
  2. Quigg, A.; Al-Ansi, M.; Al Din, N.; Wei, L.; Nunnally, C.; Al-Ansari, I.; Gilbert, T.R.; Yousria, S.; Ibrahim, A.-M.; Ismail, M.; et al. Phytoplankton along the coastal shelf of an oligotrophic hypersaline environment in a semi-enclosed marginal sea: Qatar (Arabian Gulf). Cont. Shelf Res. 2013, 60, 1–16. [Google Scholar] [CrossRef]
  3. Sheppard, C.R.C. Physical environment of the Gulf relevant to marine pollution: An overview. Mar. Pollut. Bull. 1993, 27. [Google Scholar] [CrossRef]
  4. Brook, M.; Al Shoukri, S.; Amer, K.; Boe, B.; Krupp, F. Physical and Environmental Setting of the Arabian Peninsula and Surrounding Seas. In Policy Perspectives for Ecosystem and Water Management in the Arabian Peninsula; Amer, K., Boer, B., Brook, M., Adeel, Z., Clusener-Godt, M., Saleh, W., Eds.; UNESCO and United Nations University International Network on Water, Environment and Health: Hamilton, ON, Canada, 2006; pp. 1–16. [Google Scholar]
  5. Naser, H. Human impacts on marine biodiversity: Macrobenthos in Bahrain, Arabian Gulf. In The Importance of Biological Interactions in the Study of Biodiversity; Lopez-Pujol, J., Ed.; InTech Publishing: Rijeka, Croatia, 2011; pp. 109–126. [Google Scholar]
  6. Abdel-Jabbar, N.; Baptista, A.; Karna, T.; Turner, P.; Sen, G. US Experience Will Advance Gulf Ecosystem Research. In Geo-Informatics in Resource Management and Sustainable Ecosystem; Springer: Berlin/Heidelberg, Germany, 2013; pp. 125–140. [Google Scholar]
  7. Khan, N.; Munawar, M.; Price, A. The Gulf Ecosystem: Health and Sustainability; Backhuys: Leiden, The Netherlands, 2002. [Google Scholar]
  8. Al Kaabi, M.R.; Zhao, J.; Ghedira, H. MODIS-based mapping of Secchi disk depth using a qualitative algorithm in the shallow Arabian Gulf. Remote Sens. 2016, 8. [Google Scholar] [CrossRef]
  9. Halpern, B.; Walbridge, S.; Selkoe, K.; Kappel, C.; Micheli, F.; D’Agrosa, C.; Bruno, J.; Casey, K.; Ebert, C.; Fox, H.; et al. A global map of human im-pact on marine ecosystems. Science 2008, 319, 948–952. [Google Scholar] [CrossRef] [PubMed]
  10. Sheppard, C.; Al-Husiani, M.; Al-Jamali, F.; Al-Yamani, F.; Baldwin, R.; Bishop, J.; Benzoni, F.; Dutrieux, E.; Dulvy, N.; Durvasula, S.; et al. The Gulf: A young sea in decline. Mar. Pollut. Bull. 2010, 60, 13–38. [Google Scholar] [CrossRef] [PubMed]
  11. Boyer, J.; Kelble, C.; Ortner, P.; Rudnick, D. Phytoplankton bloom status: Chlorophyll a biomass as an indicator of water quality condition in the southern estuaries of Florida, USA. Ecol. Indic. 2009, 9, s56–s67. [Google Scholar] [CrossRef]
  12. Hattab, T.; Jamet, C.; Sammari, C.; Lahbib, S. Validation of chlorophyll-α concentration maps from Aqua MODIS over the Gulf of Gabes (Tunisia): Comparison between MedOC3 and OC3M bio-optical algorithms. Int. J. Remote Sens. 2013, 34, 7163–7177. [Google Scholar] [CrossRef]
  13. McClain, C.A. Decade of Satellite Ocean Colour Observations. Annu. Rev. Mar. Sci. 2009, 1, 19–42. [Google Scholar] [CrossRef] [PubMed]
  14. Patissier, D.B.; Gower, J.; Dekker, A.; Phinn, S.; Brando, V. A review of ocean colour remote sensing methods and statistical techniques for the detection, mapping and analysis of phytoplankton blooms in coastal and open oceans. Prog. Oceanogr. 2014, 123, 123–144. [Google Scholar] [CrossRef] [Green Version]
  15. Sathyendranath, S.; Brewin, R.J.W.; Brockmann, C.; Brotas, V.; Ciavatta, S.; Chuprin, A.; Couto, A.B.; Doerffer, R.; Dowell, M.; Grant, M.; et al. Creating an ocean-colour time series for use in climate studies: The experience of the ocean-colour climate change initiative. Remote Sens. Environ. 2016. under review. [Google Scholar]
  16. Nezlin, N.; Polikarpov, I.; Al-Yamani, F. Satellite-measured chlorophyll distribution in the Arabian Gulf: Spatial, seasonal and inter-annual variability. Int. J. Oceans Oceanogr. 2007, 2, 139–156. [Google Scholar]
  17. Nezlin, N.; Polikarpov, I.; Al-Yamani, F.; Subba Rao, D.; Ignatov, A. Satellite monitoring of climatic factors regulating phytoplankton variability in the Arabian (Persian) Gulf. J. Mar. Syst. 2010, 82, 47–60. [Google Scholar] [CrossRef]
  18. Shehhi, M.; Gherboudj, I.; Ghedira, H. An overview of historical harmful algae blooms outbreaks in the Arabian Seas. Mar. Pollut. Bull. 2014, 86, 314–324. [Google Scholar] [CrossRef] [PubMed]
  19. Zhao, J.; Ghedira, H. Monitoring red tide with satellite imagery and numerical models: A case study in the Arabian Gulf. Mar. Pollut. Bull. 2014, 79, 305–313. [Google Scholar] [CrossRef] [PubMed]
  20. IOCCG (International Ocean-Colour Coordinating Group). Remote Sensing of Ocean Colour in Coastal, and Other Optically-Complex Waters; Sathyendranath, S., Ed.; Report of the International Ocean-Colour Coordinating Group, No. 3; International Ocean-Colour Coordinating Group: Dartmouth, NS, Canada, 2000. [Google Scholar]
  21. Lavender, S.; Jackson, T.; Sathyendranath, S. The Ocean Colour Climate Change Initiative: Merging ocean colour observations seamlessly. Ocean Chall. 2015, 21, 29–31. [Google Scholar]
  22. Racault, M.-F.; Sathyendranath, S.; Platt, T. Impact of missing data on the estimation of ecological indicators from satellite ocean-colour time-series. Remote Sens. Environ. 2014, 152, 15–28. [Google Scholar] [CrossRef]
  23. Brewin, R.J.W.; Sathyendranath, S.; Müller, D.; Brockmann, C.; Deschamps, P.Y.; Devred, E.; White, G.N. The Ocean Colour Climate Change Initiative: III. A round-robin comparison on in-water bio-optical algorithms. Remote Sens. Environ. 2015, 162, 271–294. [Google Scholar] [CrossRef]
  24. Brewin, R.J.W.; Raitsos, D.E.; Dall’Olmo, G.; Zarokanellos, N.; Jackson, T.; Racault, M.F.; Hoteit, I. Regional ocean-colour chlorophyll algorithms for the Red Sea. Remote Sens. Environ. 2015, 165, 64–85. [Google Scholar] [CrossRef]
  25. OceanColour—CCI. Available online: https://www.oceancolour.org/ (accessed on 18 February 2016).
  26. ESA CCI Ocean Colour website. Available online: http://www.esa-oceancolour-cci.org/ (accessed on 20 September 2016).
  27. Oceancolor Data. Available online: https://oceandata.sci.gsfc.nasa.gov/ (accessed on 4 October 2016).
  28. Steinmetz, F.; Deschamps, P.; Ramon, D. Atmospheric correction in presence of sun glint: Application to MERIS. Opt. Express 2011, 19, 571–587. [Google Scholar] [CrossRef] [PubMed]
  29. Racault, M.F.; Raitsos, D.E.; Berumen, M.L.; Brewin, R.J.W.; Platt, T.; Sathyendranath, S.; Hoteit, I. Phytoplankton phenology indices in coral reef ecosystems: Application to ocean-colour observations in the Red Sea. Remote Sens. Environ. 2015, 160. [Google Scholar] [CrossRef]
  30. Grant, M.; Jackson, T.; Chuprin, A.; Sathyendranath, S.; Zühlke, M.; Storm, T.; Groom, S. Ocean Colour Climate Change Initiative (OC-CCI)—Phase Two. Product User Guide. 2015. Available Online: ftp://ftp.rsg.pml.ac.uk/occci-v2.0/documentation/OC-CCI-PUG-v2.0.5.pdf (accessed on 28 September 2016).
  31. Qiu, Z.; Wu, T.; Su, Y. Retrieval of diffuse attenuation coefficient in the China seas from surface reflectance. Opt. Express 2013, 21. [Google Scholar] [CrossRef] [PubMed]
  32. Lee, Z.-P.; Darecki, M.; Carder, K.L.; Davis, C.O.; Stramski, D.; Rhea, W.J. Diffuse attenuation coefficient of downwelling irradiance: An evaluation of remote sensing methods. J. Geophys. Res. Oceans 2005, 110. [Google Scholar] [CrossRef]
  33. Bailey, S.; Werdell, P.A. multi-sensor approach for the on-orbit validation of ocean colour satellite data products. Remote Sens. Environ. 2006, 102. [Google Scholar] [CrossRef]
  34. Wattelez, G.; Dupouy, C.; Mangeas, M.; Lefèvre, J.; Frouin, R. A Statistical algorithm for estimating chlorophyll concentration in the New Caledonian lagoon. Remote Sens. 2016, 8. [Google Scholar] [CrossRef] [Green Version]
  35. Zhang, C.; Hu, C.; Shang, S.; Müller-Karger, F.E.; Li, Y.; Dai, M.; Hong, H. Bridging between SeaWiFS and MODIS for continuity of chlorophyll-a concentration assessments off Southeastern China. Remote Sens. Environ. 2006, 102. [Google Scholar] [CrossRef]
  36. Marrari, M.; Hu, C.; Daly, K. Validation of SeaWiFS chlorophyll a concentrations in the Southern Ocean: A revisit. Remote Sens. Environ. 2006, 105. [Google Scholar] [CrossRef]
  37. Campbell, J.W. The lognormal distribution as a model for bio-optical variability in the sea. J. Geophys. Res. 1995, 100, 13237–13254. [Google Scholar] [CrossRef]
  38. O’Reilly, J.E. SeaWiFS Postlaunch Calibration and Validation Analyse, Part 3; Hooker, S.B., Firestone, E.R., Eds.; NASA Tech. Memo. 2000-206892; NASA Goddard Space Flight Center: Greenbelt, MD, USA, 2000; Volume 11, p. 49.
  39. Doney, S.C. Plankton in a warmer world. Nature 2006, 444, 695–696. [Google Scholar] [CrossRef] [PubMed]
  40. Moradi, M.; Kabiri, K. Spatio-temporal variability of SST and Chlorophyll-a from MODIS data in the Persian Gulf. Mar. Pollut. Bull. 2015, 98. [Google Scholar] [CrossRef] [PubMed]
  41. Morel, A.; Huot, Y.; Gentili, B.; Werdell, P.J.; Hooker, S.B.; Franz, B.A. Examining the consistency of products derived from various ocean colour sensors in open ocean (Case 1) waters in the perspective of a multi-sensor approach. Remote Sens. Environ. 2007, 111. [Google Scholar] [CrossRef]
  42. Perrone, T.J. Winter Shamal in the Persian Gulf, Naval Environmental Prediction Research Facility; Technical Report, 79-06; Naval Environmental Prediction Research Facility: Monterey, CA, USA, 1979; p. 180. [Google Scholar]
  43. Reynolds, R. Physical Oceanography of the Persian Gulf, Strait of Hormuz, and the Gulf of Oman—Results from the Mt. Mitchell Expedition. Mar. Pollut. Bull. 1993, 27, 35–59. [Google Scholar] [CrossRef]
  44. Raitsos, D.E.; Pradhan, Y.; Hoteit, I.; Brewin, R.J.W.; Stenchikov, G. Remote sensing the phytoplankton seasonal succession of the Red Sea. PLoS ONE 2013, 8. [Google Scholar] [CrossRef] [PubMed]
  45. Shang, S.L.; Dong, Q.; Hu, C.M.; Lin, G.; Li, Y.H.; Shang, S.P. On the consistency of MODIS chlorophyll $a$ products in the northern South China Sea. Biogeosciences 2014, 11. [Google Scholar] [CrossRef]
  46. Tilstone, G.H.; Lotliker, A.A.; Miller, P.I.; Ashraf, P.M.; Kumar, T.S.; Suresh, T.; Menon, H.B. Assessment of MODIS-Aqua chlorophyll-a algorithms in coastal and shelf waters of the eastern Arabian Sea. Cont. Shelf Res. 2013, 65. [Google Scholar] [CrossRef]
  47. Brewin, R.J.W.; Raitsos, D.E.; Pradhan, Y.; Hoteit, I. Comparison of chlorophyll in the Red Sea derived from MODIS-Aqua and in vivo fluorescence. Remote Sens. Environ. 2013, 136, 218–224. [Google Scholar] [CrossRef]
  48. Kahru, M.; Kudela, R.M.; Anderson, C.R.; Manzano-Sarabia, M.; Mitchell, B.G. Evaluation of satellite retrievals of ocean chlorophyll-a in the California current. Remote Sens. 2014, 6, 8524–8540. [Google Scholar] [CrossRef]
Figure 1. Bathymetry of the Arabian Gulf and ocean colour data availability (a) Sampling stations along Qatar’s Exclusive Economic Zone (EEZ). The red circles denote the total of 24 stations spread at the northern and northeastern parts of the EEZ. The inset panel shows the Arabian Gulf, Shatt Al-Arab region and the study area outlined with a red polygon representing Qatar’s EEZ. (b) Ocean colour Chlorophyll-a measurements (Chl-a) maps for July 2009: the left panel was produced using only MODIS Level 3 data, illustrating a poor data coverage over the Arabian Gulf region. In contrast, the right panel was produced using OC-CCI data showing an improved coverage of the Arabian Gulf by utilizing merged sensors’ datasets.
Remotesensing 09 00301 g001
Figure 2. Seasonal climatologies of surface Chl-a (mg·m−3) in the Arabian Gulf, based on satellite-derived Ocean Colour Climate Change Initiative (OC-CCI) datasets. The depicted climatologies data are calculated based on 16 years of data (1997–2013). The dashed-line box indicates the Shatt Al-Arab zone, and the solid-line box indicates the study area where the in situ samples were collected.
Remotesensing 09 00301 g002
Figure 3. Monthly time-series climatologies of Chl-a (mg·m−3). (a) Red series represent the open region of the Arabian Gulf. Climatology calculated as monthly average over 1998-2013.Vertical error bars indicate ± standard deviation (b) Black series represent the study area, grey dots represent in situ Chl-a averaged over first optical depth, and the red dots represent OC-CCI Chl-a data averaged on sampling months. Vertical error bars indicate ± standard deviation.
Remotesensing 09 00301 g003
Figure 4. Vertical profiles of in situ Chl-a averaged measurements during four seasons. (a) Vertical profile of Chl-a along the transects in winter, spring, summer and autumn seasons (plotted using Ocean Data View (ODV) Version 4.7). The dashed line represents the first optical Depth (this is an approximate indication of how far the satellite signal penetrates into the water column). (b) Vertical Chl-a profiles. Red line represents mean Chl-a Averaged over 24 stations (Figure 1)/season.
Remotesensing 09 00301 g004
Figure 5. Seasonal climatologies of OC-CCI first optical depth data (m) at Arabian Gulf. The presented data are computed from the monthly averaged OC-CCI diffuse attenuation coefficient Kd(490) over the period 1998-2013. The black box indicates the study area.
Remotesensing 09 00301 g005
Figure 6. Correlation between in situ and satellite-derived Chl-a data in the Arabian Gulf. Chl-a were log10-transformed. For sample stations see Figure 1a.
Remotesensing 09 00301 g006
Table 1. A statistical comparison of the match-ups performed in the Arabian Gulf with those at complex coastal waters.
RegionSensorAlgorithmLog_RMSNStudy
Gulf of GabesMODIS-AquaOC3M0.6430Hattab et al. (2013) [12]
Northern South China SeaMODIS-AquaOC3M0.38114Shang et al. (2014) [45]
Eastern Arabian SeaMODIS-AquaOC3M0.3150Tilstone et al. (2013) [46]
Red SeaMODIS-AquaOC30.1885Brewin et al. (2013) [47]
California Current BedVIIRSOC30.2338Kahru et al. (2014) [48]
Central Arabian GulfVIIRSOC30.3229This study

