
A Novel Approach for Coarse-to-Fine Windthrown Tree Extraction Based on Unmanned Aerial Vehicle Images

1
Key Laboratory of Resources Environment and Geographic Information System, Capital Normal University, Beijing 100048, China
2
Laboratory of 3D-Information Acquisition and Application, Capital Normal University, Beijing 100048, China
*
Author to whom correspondence should be addressed.
Remote Sens. 2017, 9(4), 306; https://doi.org/10.3390/rs9040306
Submission received: 14 November 2016
/
Revised: 20 March 2017
/
Accepted: 21 March 2017
/
Published: 24 March 2017
Abstract
:Surveys of windthrown trees, resulting from hurricanes and other types of natural disasters, are an important component of agricultural insurance, forestry statistics, and ecological monitoring. Aerial images are commonly used to determine the total area or number of downed trees, but conventional methods suffer from two primary issues: misclassification of windthrown trees due to the interference from other objects or artifacts, and poor extraction resolution when trunk diameters are small. The objective of this study is to develop a coarse-to-fine extraction technique for individual windthrown trees that reduces the effects of these common flaws. The developed method was tested using UAV imagery collected over rubber plantations on Hainan Island after the Nesat typhoon in China on 19 October 2011. First, a coarse extraction of the affected area was performed by analyzing the image spectrum and textural characteristics. A thinning algorithm was then used to simplify downed trees into skeletal structures. Finally, fine extraction of individual trees was achieved using a line detection algorithm. The completeness of windthrown trees in the study area was 75.7% and the correctness was 92.5%. While similar values have been reported in other studies, they often include constraints, such as tree height. This technique is proposed to be a more feasible extraction algorithm as it is capable of achieving low commission errors across a broad range of tree heights and sizes. As such, it is a viable option for extraction of windthrown trees with a small trunk diameter.
1. Introduction
As a result of climate change, the risk of hurricane damage in forests and plantations is increasing. Damage assessment after a hurricane or other natural disaster is an important component of agricultural insurance, forestry statistics, and ecological monitoring. Large areas must be surveyed quickly to obtain statistics regarding the number of individual windthrown trees [1,2]. Remote sensing techniques, including optical remote sensing and airborne LiDAR, have been widely employed in this field. Currently, there are three primary extraction methods based on remote sensing techniques: (1) artificial visual interpretation, (2) area extraction, and (3) individual windthrown tree extraction. Fransson et al. proposed a method based on visual interpretation over simulated wind-thrown forests at both the single-tree and stand levels using SAR images from the Swedish airborne CARABAS-II and LORA systems after a storm event [3]. Visual interpretation of remote sensing images is relatively simple and results in a high degree of accuracy [4,5]. However, these methods require a significant amount of time-consuming manual intervention and are dependent on professional knowledge. Thus, it is important to develop automated methods.
In recent years, several authors have proposed automated extraction algorithms. These techniques are typically based on comparisons between data collected before and after a storm in the fallen area. Wang et al. reported on the detection of downed trees in an affected area by comparing changes in optical remote sensing images and standard aerial photographs (4000–5000 m high) before and after a hurricane [6,7]. Szantoi et al. employed a Sobel edge detection algorithm combined with spectral information based on color filtering. They included 15 different statistical combinations of spectral bands to detect downed trees and debris volume through a Leica Airborne Digital Sensor (ADS40) using high-resolution digital images [8]. Although areas with concentrated trees were identified, due to the effects of resolution and obstruction, it was difficult to achieve extraction of individual trees via optical remote sensing images and standard aerial photographs. LiDAR, with its ability to penetrate vegetation and forest canopies, proved to be an effective tool for extraction of individual fallen trees, thereby overcoming the problem of obstruction [9,10,11,12,13]. The focus of current research is the identification and extraction of individual fallen trees using airborne laser scanning. Blanchard et al. used the object-oriented image analysis method to extract fallen pines and cypresses in a forest ecosystem under small canopy coverage, achieving a completeness of 73% [14]. However, due to over-division, the outline of individual fallen trees was not complete. Mücke et al. used full-waveform airborne laser scanning data and extracted windthrown trees based on an object height model and an area-perimeter ratio [15,16,17]. They reported a completeness of 75.6% and an accuracy of 89.9%. Lindberg and Nyström et al. performed binary classification based on height characteristics to eliminate the interference of foreign objects under a closed canopy [18,19]. Their techniques were based on the template matching method, with a reported correctness of 32% and 38% at individual tree level, respectively. Much higher detection rates were reported for taller (>27 m) trees (i.e., 89% by Nyström). The higher value was partially a result of larger tree diameters. In a study of trees with small diameters (<300 mm), Nyström reported a completeness of 43%. Polewski et al. used full-waveform LiDAR point clouds to merge short segments into whole fallen trees using Normalized Cut algorithm in a forest ecosystem with substantial canopy coverage, thereby achieving enhanced extraction. Their reported accuracy reached 80% [20]. This study also demonstrated that trunk diameter was the primary factor affecting extraction resolution.
The above methods suffer from two primary issues: (1) traditional optical images are often low-resolution and include obstructions; (2) height-based LiDAR is prone to the influence of other linear objects—such as the edges of a river ditch, a row of shrubs, or a road—which are often incorrectly identified as windthrown trees. The authors were able to pre-classify terrain and low vegetation points to produce an object height model (OHM), which reduces the influence of other objects. However, it still suffers from interference caused by objects with a shape similar to the OHM. These factors often resulted in low extraction accuracy, especially for trees with small diameters (<300 mm). Since unmanned aerial vehicle (UAV) images are typically high-resolution, they represent new potential for recognition of fallen trees [21]. The overall objective of this study is to develop a novel method for extraction of windthrown trees via a coarse-to-fine algorithm based on UAV images.
2. Study Area and Data Collection
2.1. Study Area
The study area was a rubber tree plantation located in northeastern Hainan, China. The severe 2011 typhoon ‘Nesat’ caused severe damage and felled a large number of trees under an open canopy in a concentrated area. Two subsets were selected in the region for testing purposes: an experimental area (0.13 ha) and a verification area (0.12 ha). Individual windthrown trees were extracted from the experimental area while the verification area was used to assess the feasibility of the proposed technique.
2.2. UAV Image Acquisition and Preprocessing
Aerial images were collected with a commercially available UAV (Sky-01C Zhong 5 UAV) equipped with a Canon EOS 5D Mark II RGB camera. The flying height was at 500m above the ground in a north–south orientation. UAV imaging parameters are shown in Table 1.
500 images were collected in JPEG format with the camera set in automatic at noon under a clear sky and minimize wind. The forward and side overlap were set to 70% and 30%, respectively. Absolute positioning was based on a direct geo-referencing approach using the position/attitude measurements acquired by UAV-embedded GPS/IMU instrumentation.
Images were then processed using the Pix4D software, which was chosen because of its high efficiency and good accuracy [22]. The software processing was based on a conventional photogrammetric approach. An automated image-matching algorithm identified tie points in the images, which were then used to retrieve orientation parameters for the aerial triangulation (bundle-block adjustment). Once oriented, the software allows DSM extraction and the generation of orthomosaics from the images. Color balancing between images with histogram matching was applied during orthomosaicking. Finally, orthophotos (0.1 m) were generated from the UAV images (Figure 1).
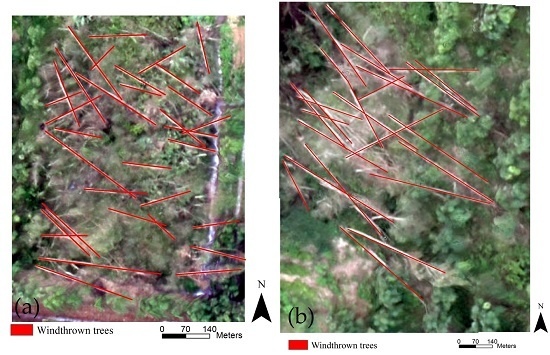
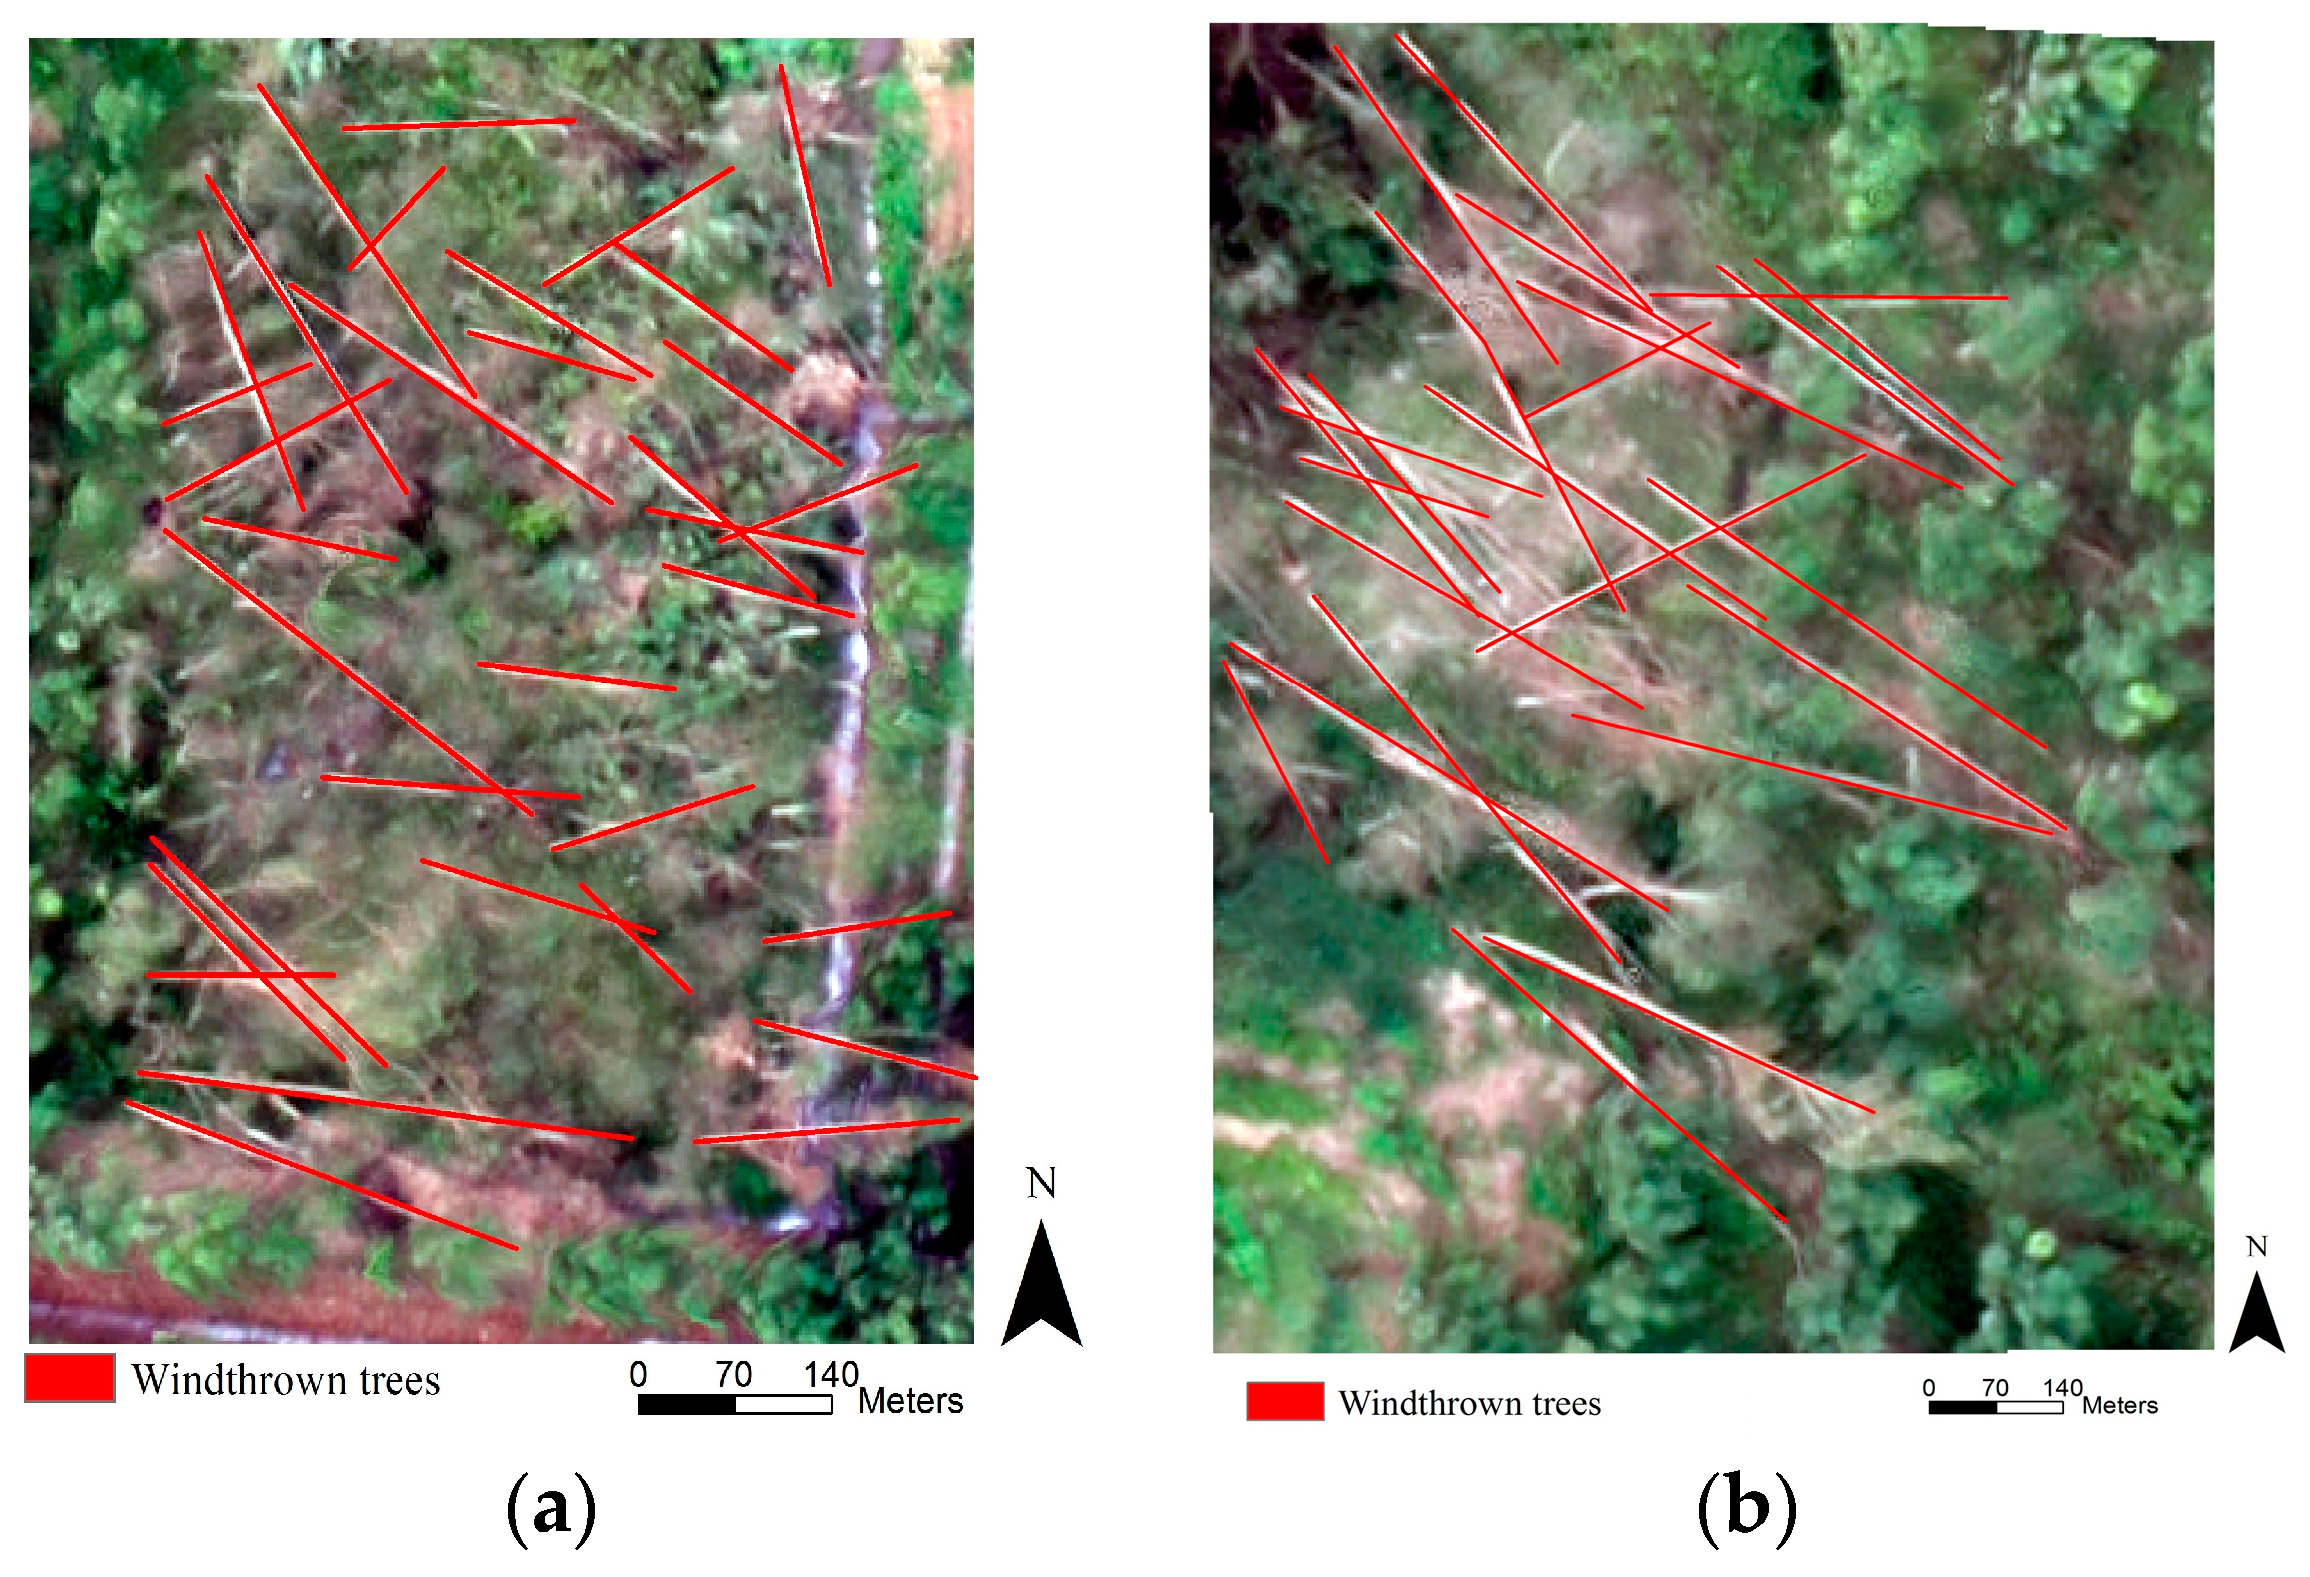
According to field surveys and the aims of the project, the amount of windthrown trees in the two study areas were counted and found to contain 33 and 28 fallen trees, respectively. The spatial distribution of windthrown trees was obtained (Figure 2) from visual inspection. The average length was 10 m and the average trunk diameter was 200 mm, the maximum of which is 300 mm.
3. Methods
The whole workflow for individual windthrown tree extraction can be divided into three parts. First, the area spanned by the downed trees was determined based on a binary random forest classification, during which the spectrum and texture were used as features for classification. Then, in order to reduce the influence of trunk diameter on individual tree extraction, a skeletonization algorithm was used to simplify trees into skeletal lines. Finally, individual windthrown trees were extracted using a Hough transform. The specific extraction process is described below.
3.1. Coarse Extraction of Windthrown Trees
Windthrown trees display slender geometry and a bright spectrum, due to lateral optical scattering, which makes them observably different from other objects. As such, binary image classification was performed to identify the affected windthrown area:
In Equation (1), represents the total possible image area containing downed trees that satisfies the characteristic value in the original image.
Among conventional binary image classification methods, two of the most common are support vector machine (SVM) [23] and random forest (RF) [24]. The RF method was adopted for this study because of its robustness and effectiveness in the classification of varying object types and ease of the execution. Compared to SVM, RF is able to achieve a comparably high classification precision with fewer initialized parameters [25,26]. Random forest only requires two parameters: the number of decision trees (ntree) and the number of random split variable characteristics (mty) [27,28]. The optimal value for ntree is typically determined by out-of-bag (OOB) error convergence, while mty is the square root of the input characteristic numbers [29]. The included spectral characteristics were: red, green, and blue wave bands. Texture characteristics featured six additive statistics—mean, variance, homogeneity, contrast, entropy, and angular second moment—to compensate for the low precision of the spectral criteria [30].
3.2. Fine Extraction of Individual Windthrown Trees
During coarse extraction, misclassification of other objects occurred due to the salt-and-pepper phenomenon, which reduced the significance of linear trunk characteristics in the classification of images. A variety of extraction methods are used to determine linear characteristics. A commonly effective method involves the enhancement of skeleton significance via the morphological closing operation. Specifically, the expansion-corrosion closing operation was used for the coarsely-extracted area [31,32]:
Here, represents an expansion operation, is a corrosion operation, and the result of the closing operation is expressed as .
At this point, the areas of windthrown trees were connected and the linear geometry of downed logs was more apparent. Due to the slender characteristics of windthrown trees, the area-perimeter ratio was used to quantify thinness. This area and the area-perimeter ratio () were used to calculate the total area of windthrown trees. A skeletonization algorithm [33] was then used to simplify trees into skeletal lines. The dominant thin linear characteristics of windthrown trees were highlighted by this approach such that the effects of tree diameter were effectively reduced, making trunks easier to extract.
The most common line detection methods include edge detection [34], line segment detection (LSD) [35], and the Hough transform [36]. Edge detection is too sensitive to noise and often detects defects like isolated edge points or pseudo edges [37]. LSD typically divides structures into multiple lines due to long-line and local fuzzy obstruction [35]. The Hough transform is capable of good anti-noise performance [38] and is less sensitive to partial blockage. As such, it is widely used in the extraction of linear objects such as power lines [39], green houses [40], crop direction [41], and architecture [42]. Windthrown trees have obvious linear characteristics, so the Hough transform was adopted in this study for extraction purposes. The theory involves transferring image coordinate space into a reference space and performing line extraction based on a local maximum of spatial parameters corresponding to the line parameters:
Here, and represent the coordinates of the Hough spatial domain and the image spatial domain, δ is the Dirac delta function. The co-linear points in the original image were transferred to the sine curve . The term is the number of sine curves intersecting at point . This makes it possible to obtain the number of points forming a line. Lines can be detected in the original image by selecting the minimal that could possibly form a line.
3.3. Accuracy Assessment
Evaluation of extraction results consists of two metrics: area-level and individual windthrown tree level. The individual tree results were primarily based on count. The latter was used in this study and two indexes, completeness and correctness, were adopted to assess the accuracy of extraction [43]. Completeness is the ratio between the number of correctly extracted windthrown trees and the total number of windthrown trees in the reference data. The sum of completeness and omission equals 1. Correctness is the proportion correctly extracted from the total number of extracted windthrown trees. The sum of correctness and commission equals 1. These equations are given below:
In Equations (4) and (6), TP indicates the number of extracted windthrown trees present in the reference data, FP is the number of extracted windthrown trees that do not exist in the reference data, and FN is the number of windthrown trees that were not extracted yet are present in the reference data.
All the aforementioned data analysis and processing were conducted using Mathworks MATLAB (www.mathworks.com), ESRI ArcGIS (http://www.esri.com/software/arcgis), and EnMAP-Box (www.enmap.org).
4. Results
4.1. Coarse Extraction
The main purpose of coarse extraction is to isolate the windthrown trees area by distinguishing regions with and without windthrown trees. According to training strategies for samples at different spatial resolutions [44,45,46], we used small polygon blocks to collect train and test samples. This included two types, windthrown tree areas and non-windthrown tree areas, in different locations in the digital orthophoto image. The results are shown in Table 2.
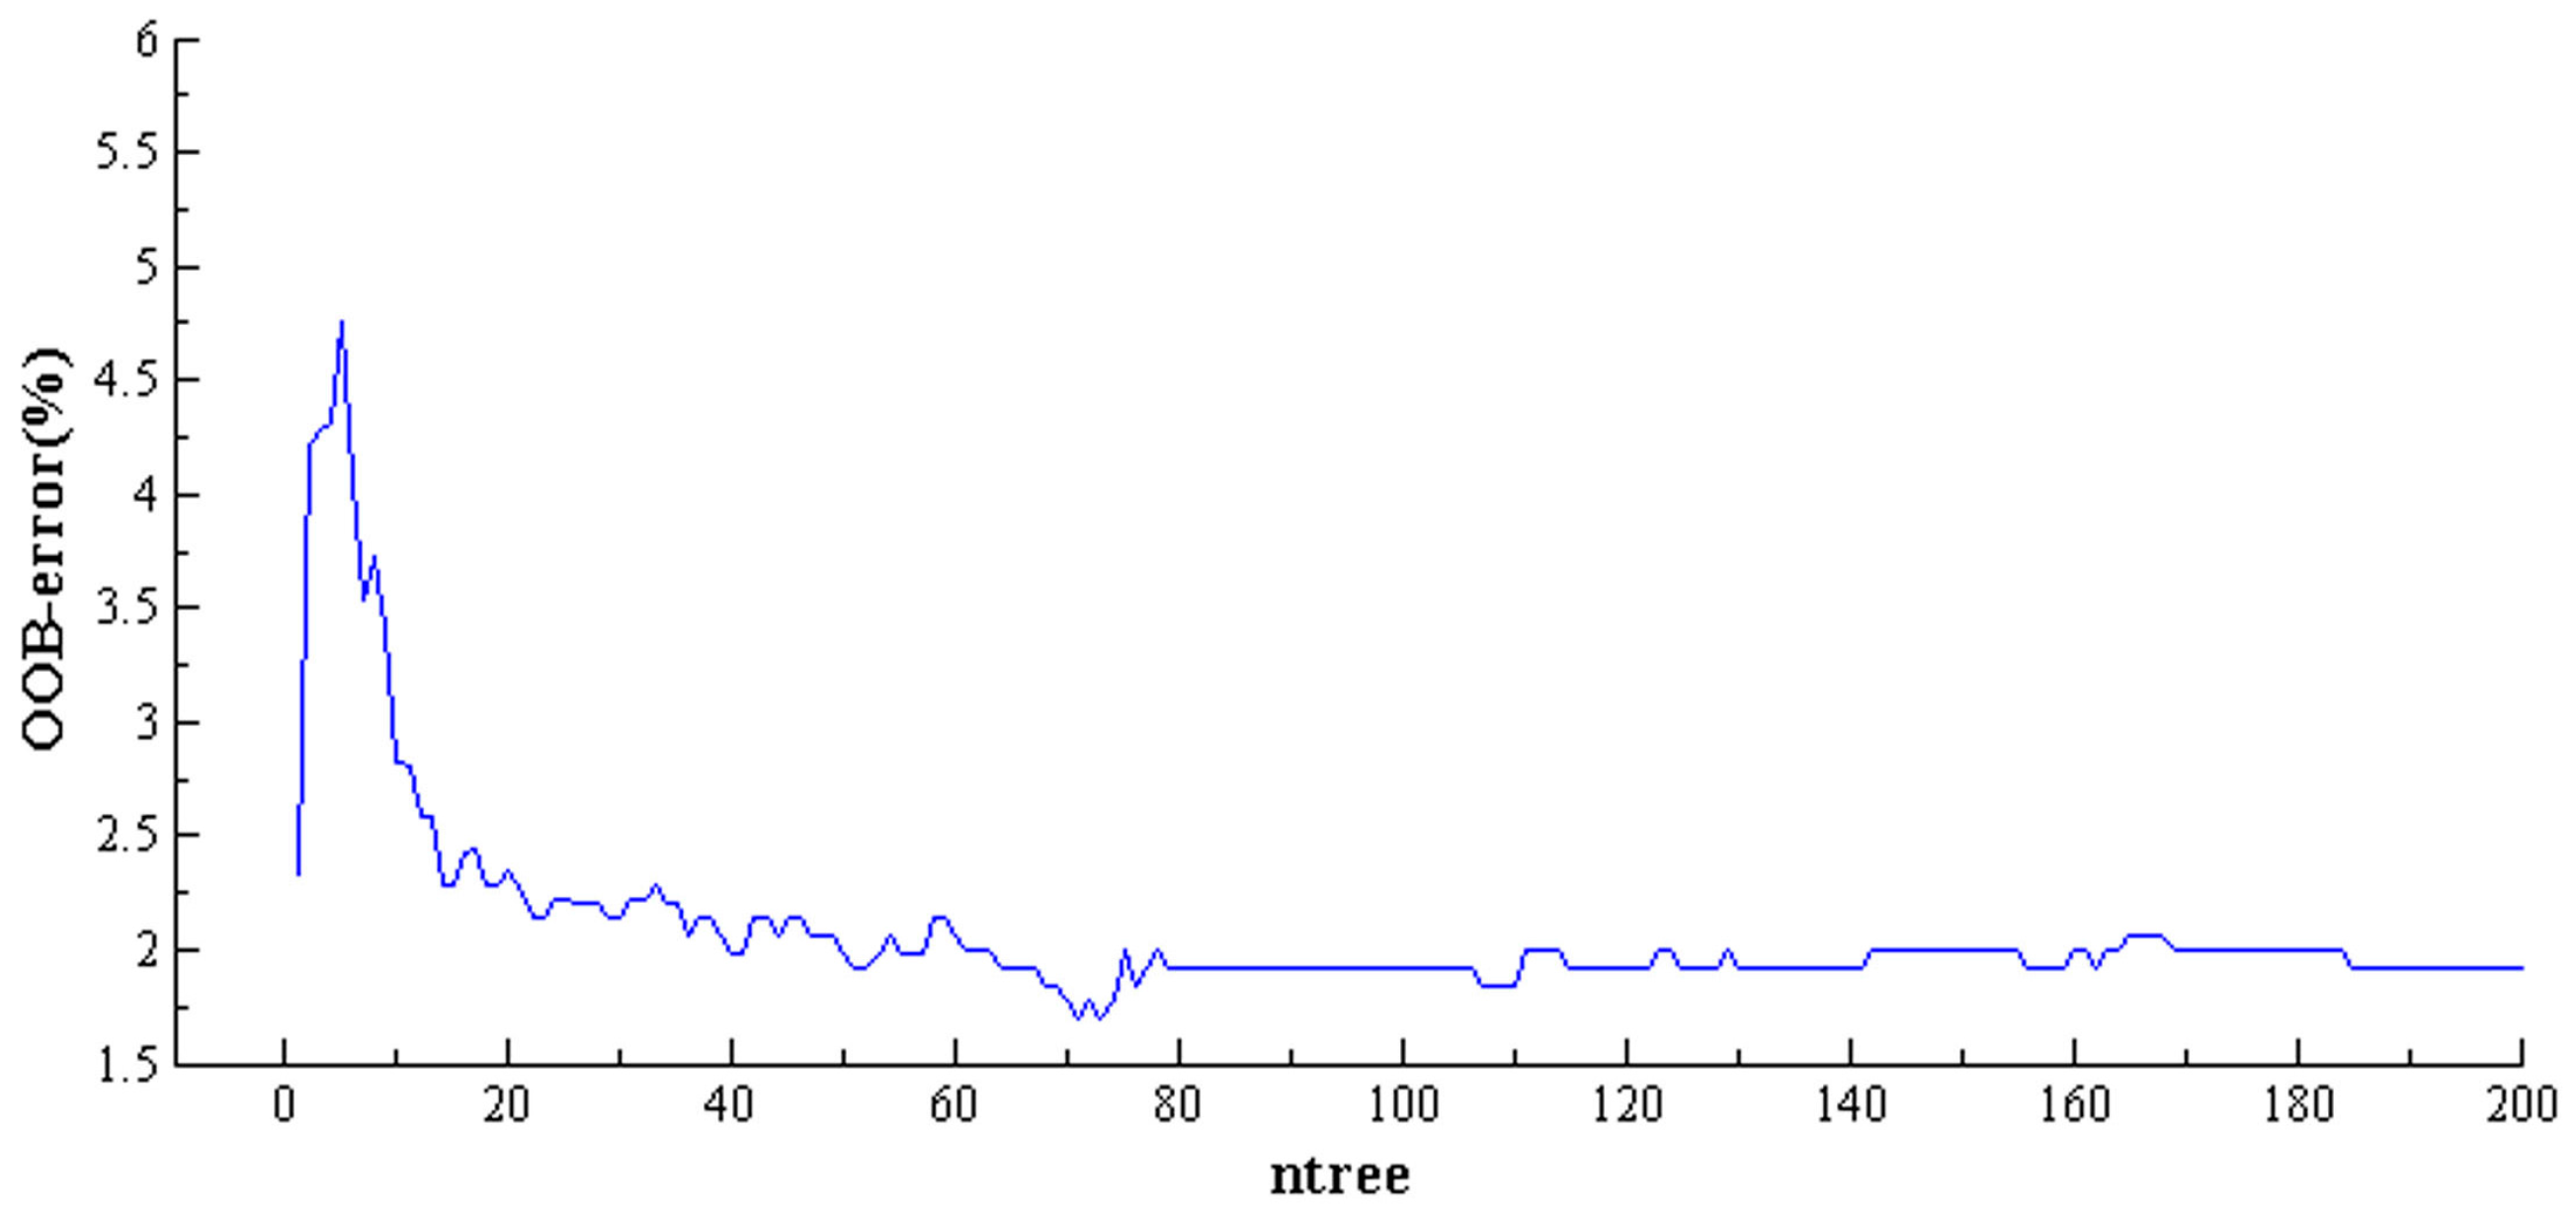
In order to precisely identify the affected area of windthrown trees during coarse extraction, the effects of random forest parameters used during binary random classification should be optimized, because extraction results affect omission rates. As such, binary random forest classification was performed for the original images using the training samples found in Table 2. Classification characteristics included three spectrum wave bands (RGB) and six texture wave bands, for a total of 9 input variables. The term mty was assigned a value of 3 (the square root of 9), the optimal value of ntree was determined based on ntree convergence. During binary random forest classification, variations in the OOB-error were analyzed, thereby obtaining an optimal value of 200.
Figure 3 shows variations in the OOB-error as a function of ntree. When ntree is above 90, the OOB-error tends to converge at 2.57%. Thus, the optimal ntree value was set at 90.
Nine characteristic wave bands were used for classification of objects, namely, red, green, blue, mean, variance, homogeneity, contrast, entropy, and angular second moment. The results of coarse extraction are shown in Figure 4 (black area).
To quantify the results of coarse extraction, verification samples (Table 3) were used to obtain a confusion matrix. Table 3 also shows the customer accuracy, manufactured accuracy, total accuracy, and Kappa coefficient for the windthrown trees area.
The customer accuracy, manufactured accuracy, and total accuracy reached as high as 92.66%, 95.24%, and 94.48%, respectively. The Kappa coefficient was 0.86. Compared with the reference data, binary random forest was able to partially or completely extract an area containing 30 windthrown trees.
4.2. Fine Extraction
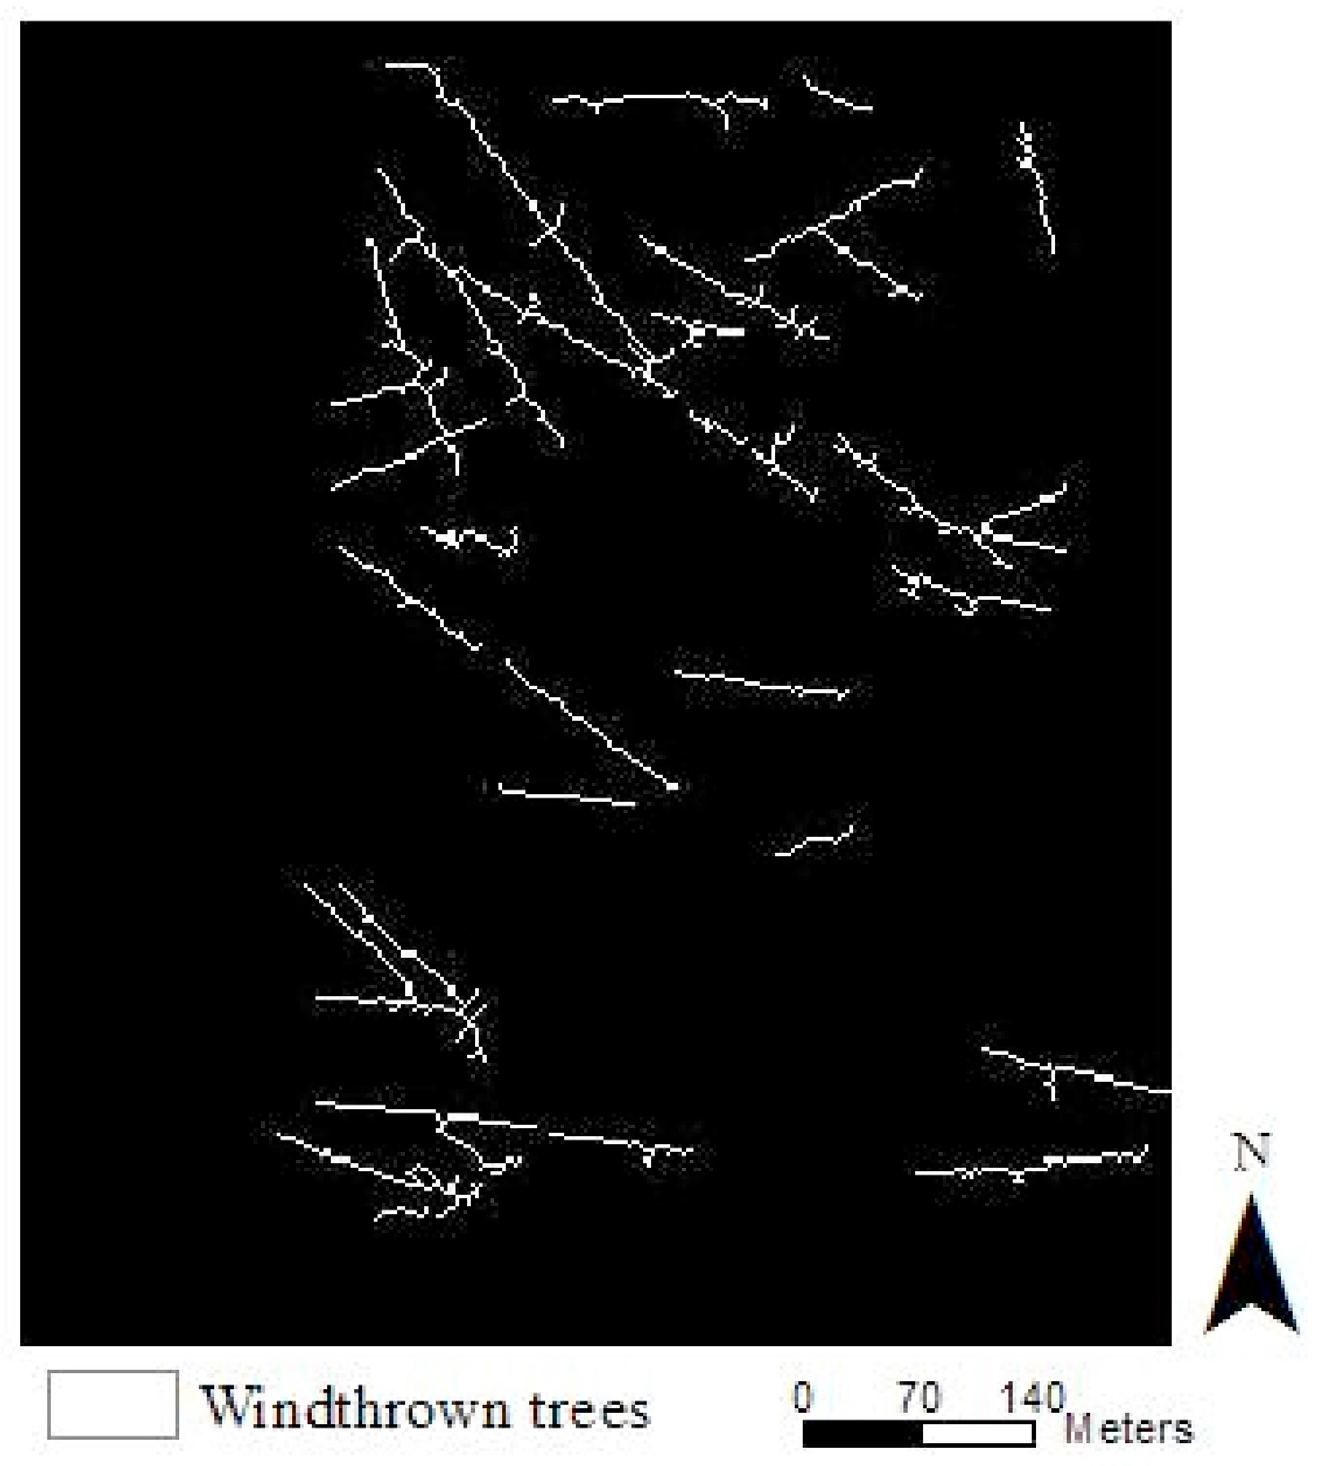
The results of coarse extraction are shown in Figure 4. It is evident in the figure that trunks, branches, scatters, and other objects were successfully extracted. In order to extract individual windthrown trees from Figure 4, small patches need to be removed first. Geometric characteristics were used as a filtering standard, because windthrown trees exhibit an obvious linear shape, while other objects are not nearly as linear. After connecting areas of windthrown trees and filling gaps with the morphological closing operation, area, and area-perimeter ratios were used to filter small scatters and block objects. An area-perimeter ratio was computed to identify elongated features and the resulting value was closer to one for rounded polygons and closer to zero for elongated polygons. We assumed that windthrown trees had an area larger than 4.5 m2 and an area-perimeter ratio smaller than 0.3. Subsequently, all polygons that had an area smaller than 4.5 m2 and an area-perimeter ratio larger than 0.3 were omitted. After filtering, a skeletonization algorithm was used to simplify windthrown tree areas into skeletal lines, as shown in Figure 5. When compared with the reference data shown in Figure 2, it can be seen that common causes of interference were effectively removed. Meanwhile, the linear characteristics of windthrown trees were more apparent and trunks showed a consistent width, which reduced the effects of trunk diameter on extraction. The fine extraction of individual windthrown trees benefited from the use of a Hough transform.
On the basis of skeletal lines, the Hough transform was used to detect individual windthrown trees. The transform was also used to determine the fewest number of points needed along the skeleton to form a windthrown tree—i.e., the number T of intersection points for sine curves in the Hough spatial domain. Only lines containing more than T points were identified as windthrown trees. In order to select the optimal value for T, the designed threshold increased from 20 with a step length of 10, to investigate the relationship between threshold (T), the number of correctly extracted trees, the extraction error, and the omitted error.
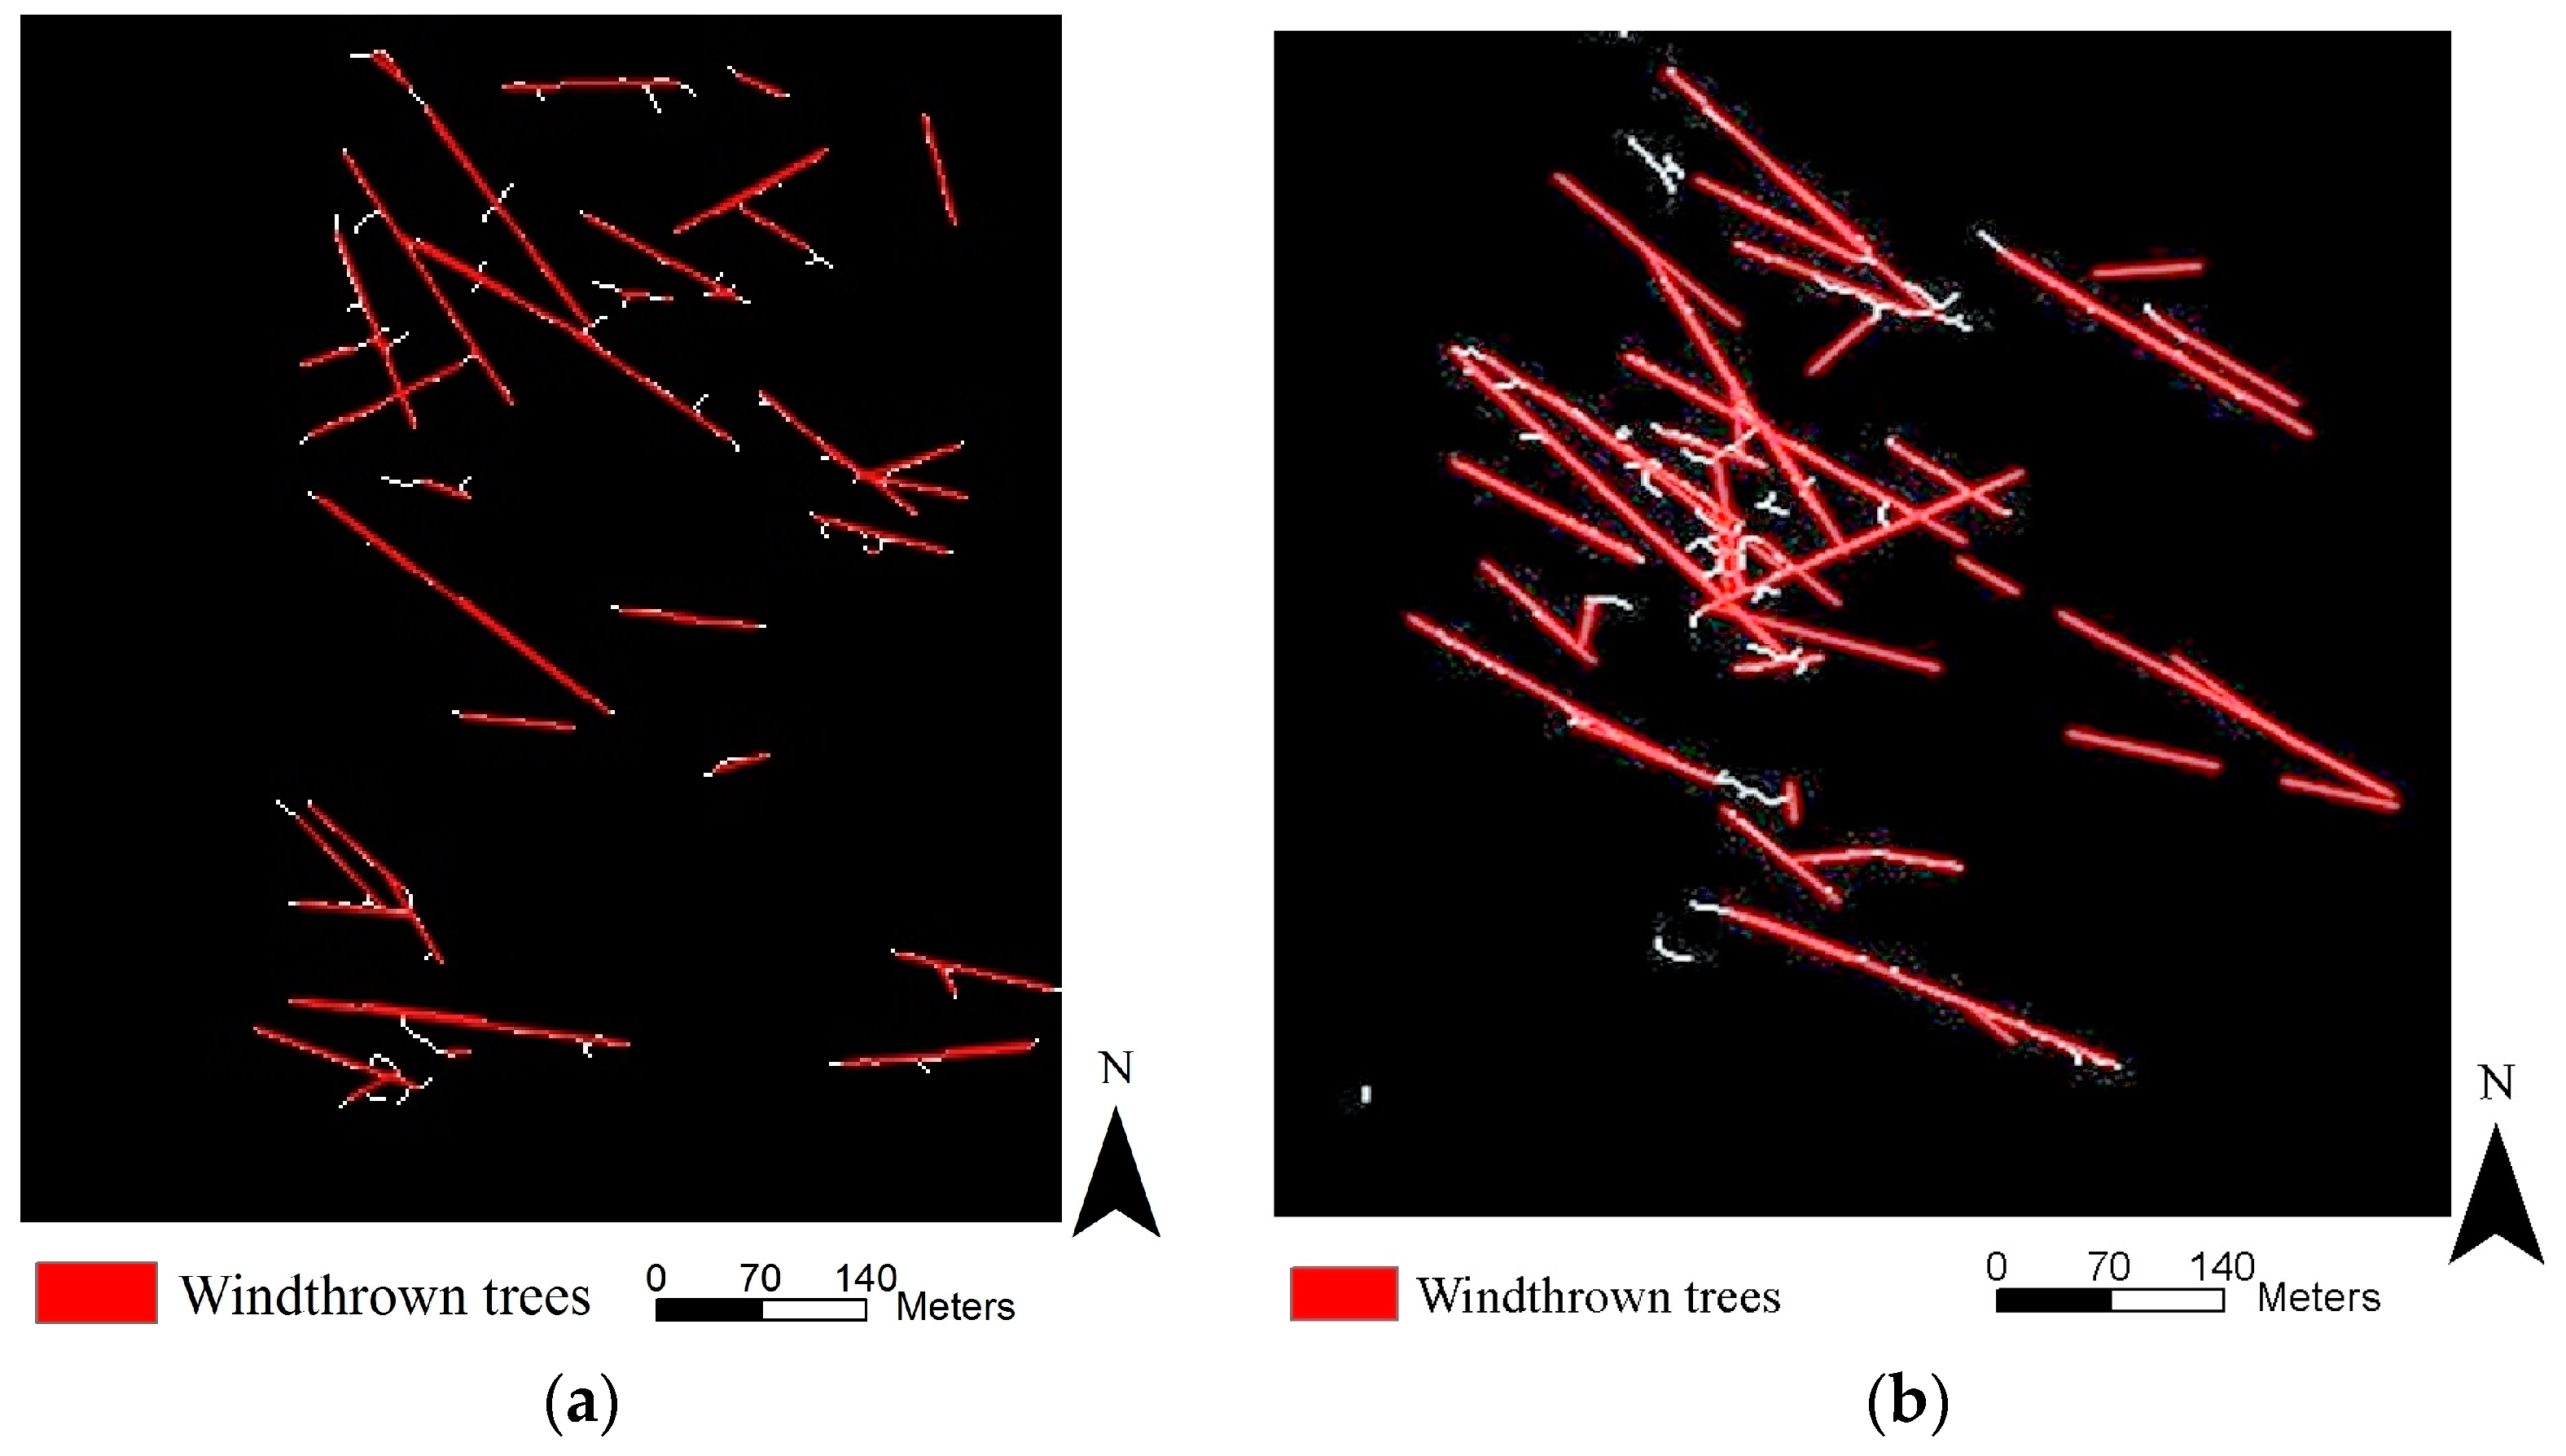
As shown in Figure 6, the number of correct extractions decreased with increasing T. Specifically, it decreased smoothly between 0–50, showing a high number of extractions, and began to decrease drastically when T was above 50. Similarly, the number of extraction errors also decreased with increasing T, yet reached a minimal level when T was above 50. The number of omitted extractions increased as T increased and rose dramatically when T was above 50. At larger thresholds, shorter windthrown trees could not be detected, resulting in increased omission. In contrast, there were multiple small segments at smaller thresholds, causing a large commission error. Therefore, the optimal T value was set to 50—i.e., 5 m in terms of tree length (with an image resolution of 0.1 m). This number is consistent with the average trunk length of windthrown trees found in the study area. Due to canopy obstruction, one tree was extracted into two parts. It was assumed that trees were windthrown in the same direction. When the distance between two trees was less than 1.5 m, they were considered to be one tree. Consequently, the extraction of individual trees was achieved based on the constraints of T >50 and a connection distance >1.5 m, as shown in Figure 7. Red represents the individual extracted trees after application of the Hough transform.
5. Discussion
5.1. Extraction Assessment
Results for the studied area included an omission of 24.3% and a commission of 7.5% (Table 4). The reported completeness and correctness were 75.7% and 92.5%, respectively. One of the regions indicated in Figure 7a was not included in the extraction. Due to subtle spectral characteristics, windthrown trees were not extracted completely during either coarse or fine extraction. Error-prone extraction occurred for branches and other objects featuring a similar geometry.
5.2. Feasibility Verification
To verify the feasibility of the proposed method, windthrown tree extraction was conducted on the verification area. The results are shown in Figure 7b and Table 4. The calculated completeness was 84%, with a correctness of 84%. These results support the feasibility of the proposed method for extraction of windthrown trees with small diameters. Economic forests have the characteristic of large spacing between planting sites, which is not obvious when covered by canopy or after a hurricane. Thus, the proposed method could be used to determine the number of downed trees in an economic forest.
5.3. Comparison with Conventional Methods
As mentioned previously, over-classification is a common problem occurring in concentrated areas, creating difficulties for the extraction of individual windthrown trees [14]. Lindbergand and Nyström reduced interference from other objects by executing binary classification based on height and then extracted fallen trees using template matching. They reported a correctness of 32% and 38%, respectively [18,19]. The interference of objects with a similar geometry (e.g., river boundaries and shrub rows) also poses a challenge as it cannot be effectively removed using only height or geometric characteristics. However, this study conducted binary random forest classification with spectrum and texture features and extracted trees based on geometry, which increased correctness results by 60.5% and 54.5%, respectively. Blanchard and Muecke reported extraction completeness results of 73% and 75.6%, respectively. The main reason for the high completeness is that windthrown trees have larger diameters [14,15]. However, the reported completeness for trees with diameters smaller than 300 mm was only 43% in a study conducted by Mattias and Nyström. Tomoharu Inoue reported they identified 80% to 90% of fallen trees that were >30 cm in diameter, but missed many that were narrower [21]. In order to reduce the effects of trunk diameter on the results in this paper, windthrown trees were simplified to skeletal lines using a skeletonization algorithm, which completeness reached 75.7%. The major contribution of our investigation is the development and demonstration of an efficient and highly automated method for individual windthrown trees detection. In the present study, a coarse-to-fine extraction strategy was proposed and demonstrated for individual windthrown trees in a rubber tree plantation under open canopy, which improved extraction accuracy for small-diameter windthrown trees.
6. Conclusions
The major contribution of our investigation is the development and demonstration of an efficient and highly-automated method for individual windthrown tree detection. In the present study, a coarse-to-fine extraction strategy was proposed and demonstrated in a rubber tree plantation under an open canopy. First, the windthrown area was extracted using binary random forest classification. A skeletonization algorithm was then used to simplify downed trees into skeletal lines. Finally, individual trees were extracted after applying a Hough transform. The proposed method achieved high extraction accuracy with a measured completeness of 75.7% and a correctness of 92.5%. These results are significantly higher than previously reported for the template matching method and are comparable to the accuracy of height and slender feature models. The proposed method effectively reduces commission errors and could therefore be used to extract trees with a small trunk diameter. Application of this method is also highly feasible and offers a versatile option for generalized windthrown tree extraction. Most of the previous methods are based on ALS data, however this paper is based on UAV data as the data source which is easier to acquire and costs less than ALS data. Meanwhile, compared with report of fallen trees identified by eye based on UAV images, the novel approach for coarse-to-fine windthrown tree extraction can also achieve equal accuracy.
This study utilized two relatively concentrated tree areas to develop a new approach. In the future, we will try to extract windthrown trees in a larger area using this approach and attempt to extract other forests that are not economical.
Acknowledgments
This work was supported by the National Natural Science Foundation of China (41101403).
Author Contributions
F.D. conceived and designed the experiments; Y.W. performed the experiments; F.D. and Y.W. analyzed the data; L.D. contributed data; Y.W. and L.D. wrote the paper.
Conflicts of Interest
The authors declare no conflict of interest.
References
- Butler, R.; Angelstam, P.; Ekelund, P.; Schlaepfer, R. Dead wood threshold values for the three-toed woodpecker presence in boreal and sub-Alpine forest. Biol. Conserv. 2004, 119, 305–318. [Google Scholar] [CrossRef]
- Bouget, C.; Duelli, P. The effects of windthrow on forest insect communities: A literature review. Biol. Conserv. 2004, 118, 281–299. [Google Scholar] [CrossRef]
- Ballard, D.H.; Brown, C.M. Computer Vision; Prentice Hall: Upper Saddle River, NJ, USA, 1982. [Google Scholar]
- Fransson, J.E.S.; Magnusson, M.; Folkesson, K.; Hallberg, B. Mapping of wind-thrown forests using VHF/UHF SAR images. In Proceedings of the 2007 IEEE International Geoscience and Remote Sensing Symposium, Barcelona, Spain, 23–28 July 2007; pp. 2350–2353. [Google Scholar]
- Fransson, J.E.S.; Pantze, A.; Eriksson, L.E.B.; Soja, M.J.; Santoro, M. Mapping of wind-thrown forests using satellite SAR images. In Proceedings of the 2010 IEEE International Geoscience and Remote Sensing Symposium, Honolulu, HI, USA, 25–30 July 2010; pp. 1242–1245. [Google Scholar]
- Wang, F.; Xu, Y.J. Comparison of remote sensing change detection techniques for assessing hurricane damage to forests. Environ. Monit. Assess. 2009, 162, 311–326. [Google Scholar] [CrossRef] [PubMed]
- Wang, W.; Qu, J.J.; Hao, X.; Liu, Y.; Stanturf, J.A. Post-hurricane forest damage assessment using satellite remote sensing. Agric. For. Meteorol. 2010, 150, 122–132. [Google Scholar] [CrossRef]
- Szantoi, Z.; Malone, S.; Escobedo, F.; Misas, O.; Smith, S.; Dewitt, B. A tool for rapid post-hurricane urban tree debris estimates using high resolution aerial imagery. Int. J. Appl. Earth Obs. Geoinform. 2012, 18, 548–556. [Google Scholar] [CrossRef]
- Selvarajan, S. Fusion of LiDAR and aerial imagery for the estimation of downed tree volume using support vector machines classification and region based object fitting. Ph.D. Thesis, University of Florida, Gainesville, FL, USA, 2011. [Google Scholar]
- Honkavaara, E.; Litkey, P.; Nurminen, K. Automatic storm damage detection in forests using high-altitude photogrammetric imagery. Remote Sens. 2013, 5, 1405–1424. [Google Scholar] [CrossRef]
- Wallace, L.; Watson, C.; Lucieer, A. Detecting pruning of individual stems using airborne laser scanning data captured from an unmanned aerial vehicle. Int. J. Appl. Earth Obs. Geoinform. 2014, 30, 76–85. [Google Scholar] [CrossRef]
- Tran, T.H.G.; Hollaus, M.; Nguyen, B.D.; Pfeifer, N. Assessment of wooded area reduction by airborne laser scanning. Forests 2015, 6, 1613–1627. [Google Scholar] [CrossRef]
- Niemi, M.T.; Vauhkonen, J. Extracting canopy surface texture from airborne laser scanning data for the supervised and unsupervised prediction of area-based forest characteristics. Remote Sens. 2016, 8, 582. [Google Scholar] [CrossRef]
- Blanchard, S.D.; Jakubowski, M.K.; Kelly, M. Object-based image analysis of downed logs in disturbed forested landscapes using LiDAR. Remote Sens. 2011, 3, 2420–2439. [Google Scholar] [CrossRef]
- Mücke, W.; Hollaus, M.; Pfeifer, N.; Schroiff, A.; Deàk, B. Comparison of discrete and full-waveform ALS features for dead wood detection. ISPRS Ann. Photogramm. Remote Sens. Spat. Inform. Sci. 2013, II-5/W2, 11–13. [Google Scholar]
- Mücke, W.; Hollaus, M.; Pfeifer, N. Identification of dead trees using small footprint full-waveform airborne laser scanning data. Proceedings of SilviLaser, Vancouver, BC, Canada, 16–19 September 2012; pp. 1–9. [Google Scholar]
- Mücke, W.; Deak, B.; Schroiff, A.; Hollaus, M.; Pfeifer, N. Detection of fallen trees in forested areas using small footprint airborne laser scanning data. Can. J. Remote Sens. 2013, 39, S32–S40. [Google Scholar] [CrossRef]
- Lindberg, E.; Hollaus, M.; Mücke, W.; Fransson, J.E.S.; Pfeifer, N. Detection of lying tree stems from airborne laser scanning data using a line template matching algorithm. ISPRS Ann. Photogramm. Remote Sens. Spat. Inform. Sci. 2013, II-5/W2, 169–174. [Google Scholar] [CrossRef]
- Nyström, M.; Holmgren, J.; Fransson, J.E.; Olsson, H. Detection of windthrown trees using airborne laser scanning. Int. J. Appl. Earth Obs. 2014, 30, 21–29. [Google Scholar] [CrossRef]
- Polewski, P.; Yao, W.; Heurich, M.; Krzystek, P.; Stilla, U. Detection of fallen trees in ALS point clouds using a normalized cut approach trained by simulation. ISPRS J. Photogramm. Remote Sens. 2015, 105, 252–271. [Google Scholar] [CrossRef]
- Inoue, T.; Nagai, S.; Yamashita, S.; Fadaei, H.; Ishii, R. Unmanned aerial survey of fallen trees in a deciduous broadleaved forest in eastern Japan. PLoS ONE 2014, 9. [Google Scholar] [CrossRef] [PubMed]
- Pix4D. Available online: http://pix4d.com (accessed on 1 October 2015).
- Vapnik, V.N. The Nature of Statistical Learning Theory; Springer: New York, NY, USA, 1995. [Google Scholar]
- Breiman, L. Random Forest. Mach. Learn. 2001, 45, 5–32. [Google Scholar] [CrossRef]
- Waske, B.; Van der Linden, S.; Oldenburg, C.; Jakimow, B.; Rabe, A.; Hostert, P. Image RF-A user-oriented implementation for remote sensing image analysis with Random Forests. Environ. Model. Softw. 2012, 35, 192–193. [Google Scholar] [CrossRef]
- Xu, L.; Li, J.; Brenning, A. A comparative study of different classification techniques for marine oil spill identification using RADARSAT-1 imagery. Remote Sens. Environ. 2014, 141, 14–23. [Google Scholar] [CrossRef]
- Kühnlein, M.; Appelhans, T.; Thies, B.; Nauss, T. Improving the accuracy of rainfall rates from optical satellite sensors with machine learning—A random forests-based approach applied to MSG SEVIRI. Remote Sens. Environ. 2014, 141, 129–143. [Google Scholar] [CrossRef]
- Tramontana, G.; Ichii, K.; Camps-Valls, G.; Tomelleri, E.; Papale, D. Uncertainty analysis of gross primary production upscaling using random forests, remote sensing and eddy covariance data. Remote Sens. Environ. 2015, 168, 360–373. [Google Scholar] [CrossRef]
- Galiano, V.F.R.; Ghimire, B.; Rogan, J.; Olmo, M.C.; Sanchez, J.P.R. An assessment of the effectiveness of a random forest classifier for landcover classification. ISPRS J. Photogram. Remote Sens. 2012, 67, 93–104. [Google Scholar] [CrossRef]
- Feng, Q.; Liu, J.; Gong, J. UAV remote sensing for urban vegetation mapping using random forest and texture analysis. Remote Sens. 2015, 7, 1074–1094. [Google Scholar] [CrossRef]
- Mcdonald, T.; Chen, Y.R. Application of morphological image processing in agriculture. Trans. ASAE 1990, 33, 1345–1352. [Google Scholar] [CrossRef]
- Zhang, D. Notice of retraction one-eighth rule in the N-queens problem based on group theory and morphological gene combinations. In Proceedings of the International Forum on Information Technology and Applications, Chengdu, China, 15–17 May 2009; pp. 651–654. [Google Scholar]
- Ware, J.M.; Jones, C.B.; Bundy, G.L. A triangulated spatial model for cartographic generalization of areal objects. In Proceedings of the International Conference on Spatial Information Theory, Semmering, Austria, 21–23 September 1995; pp. 173–192. [Google Scholar]
- Ziou, D.; Tabbone, S. Edge detection techniques—An overview. Int. J. Pattern Recognit. Image Anal. 1998, 8, 537–559. [Google Scholar]
- Von Gioi, R.G.; Jakubowicz, J.; Morel, J.; Randall, G. LSD: A line segment detector. Image Process. On Line 2012, 2, 35–55. [Google Scholar] [CrossRef]
- Hough, P.C.V. Methods and Means for Recognizing Complex Patterns. US Patent 3,069,654, 18 December 1962. [Google Scholar]
- Rahnama, M.; Gloaguen, R. Teclines: A Matlab-based toolbox for tectonic lineament analysis from satellite images and DEMs, part 2: Line segments linking and merging. Remote Sens. 2014, 6, 11468–11493. [Google Scholar] [CrossRef]
- Cui, S.; Yan, Q.; Reinartz, P. Complex building description and extraction based on Hough transformation and cycle detection. Remote Sens. Lett. 2012, 3, 151–159. [Google Scholar] [CrossRef]
- Li, Z.; Liu, Y.; Walker, R.; Hayward, A.; Ross, F.; Zhang, J. Towards automatic power line detection for a UAV surveillance system using pulse coupled neural filter and an improved Hough transform. Mach. Vis. Appl. 2009, 21, 677–686. [Google Scholar] [CrossRef]
- Agüera, F.; Liu, J.G. Automatic greenhouse delineation from QuickBird and Ikonos satellite images. Comput. Electron. Agric. 2009, 66, 191–200. [Google Scholar] [CrossRef]
- Chanussot, J.; Bas, P.; Bombrun, L. Airborne remote sensing of vineyards for the detection of dead vine trees. In Proceedings of the 2005 IEEE International Geoscience and Remote Sensing Symposium, Seoul, Korea, 29–29 July 2005; pp. 3090–3093. [Google Scholar]
- Turkera, M.; Koc-San, D. Building extraction from high-resolution optical spaceborne images using the integration of support vector machine (SVM) classification, Hough transformation and perceptual grouping. Int. J. Appl. Earth Obs. Geoinform. 2015, 34, 58–69. [Google Scholar] [CrossRef]
- Heipke, C.; Mayer, H.; Wiedemann, C.; Jamet, O. Evaluation of automatic road extraction. Int. Arch. Photogramm. Remote Sens. 1997, 32, 151–160. [Google Scholar]
- Chen, D.; Stow, D. The effect of training strategies on supervised classification at different spatial resolutions. Photogramm. Eng. Remote Sens. 2002, 68, 1155–1162. [Google Scholar]
- Huiran, J.; Stephen, V.; Giorgos, M. Assessing the impact of training sample selection on accuracy of an urban classification: A case study in Denver, Colorado. Int. J. Remote Sens. 2014, 35, 2067–2068. [Google Scholar]
- Fukunaga, K.; Hayes, R. Effects of sample size in classifier design. IEEE Trans. Pattern. Anal. Mach. Intell. 1989, 11, 873–885. [Google Scholar] [CrossRef]
Figure 1.
Orthophoto of the study area.
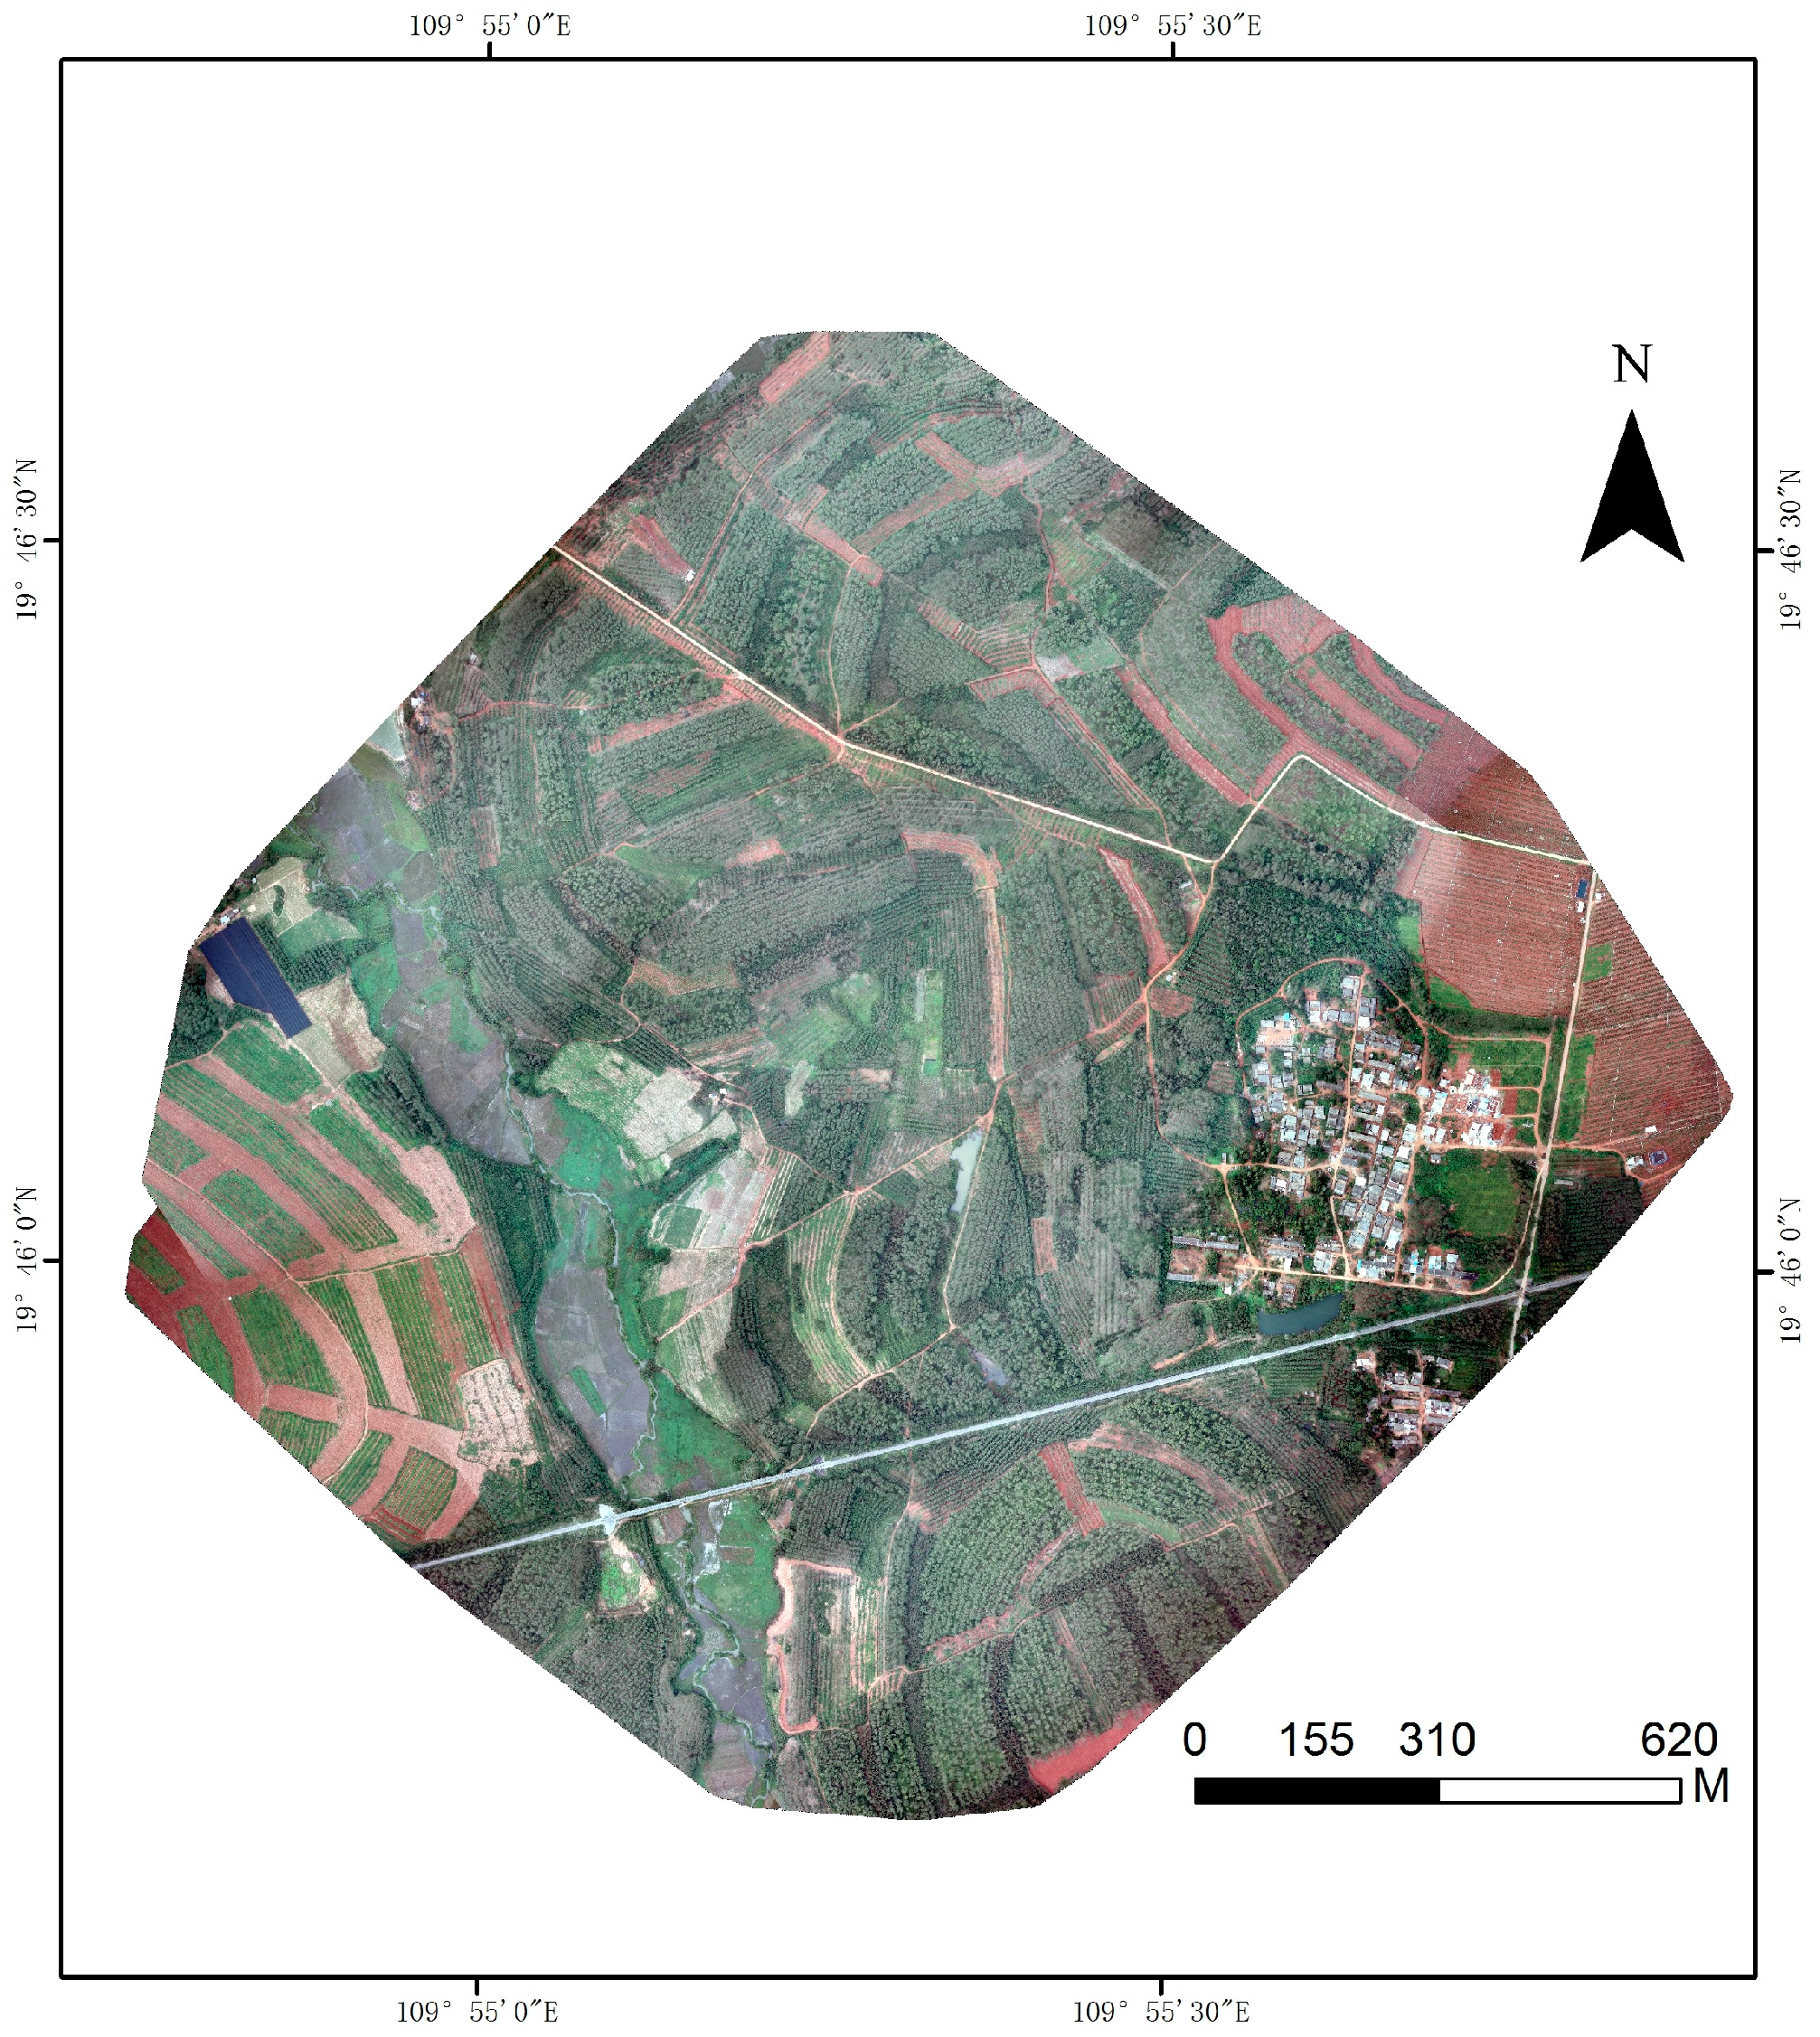
Figure 2.
The reference data: (a) experimental area; (b) verification area.

Figure 3.
Variations in the OOB-error with ntree.

Figure 4.
The results of coarse extraction.
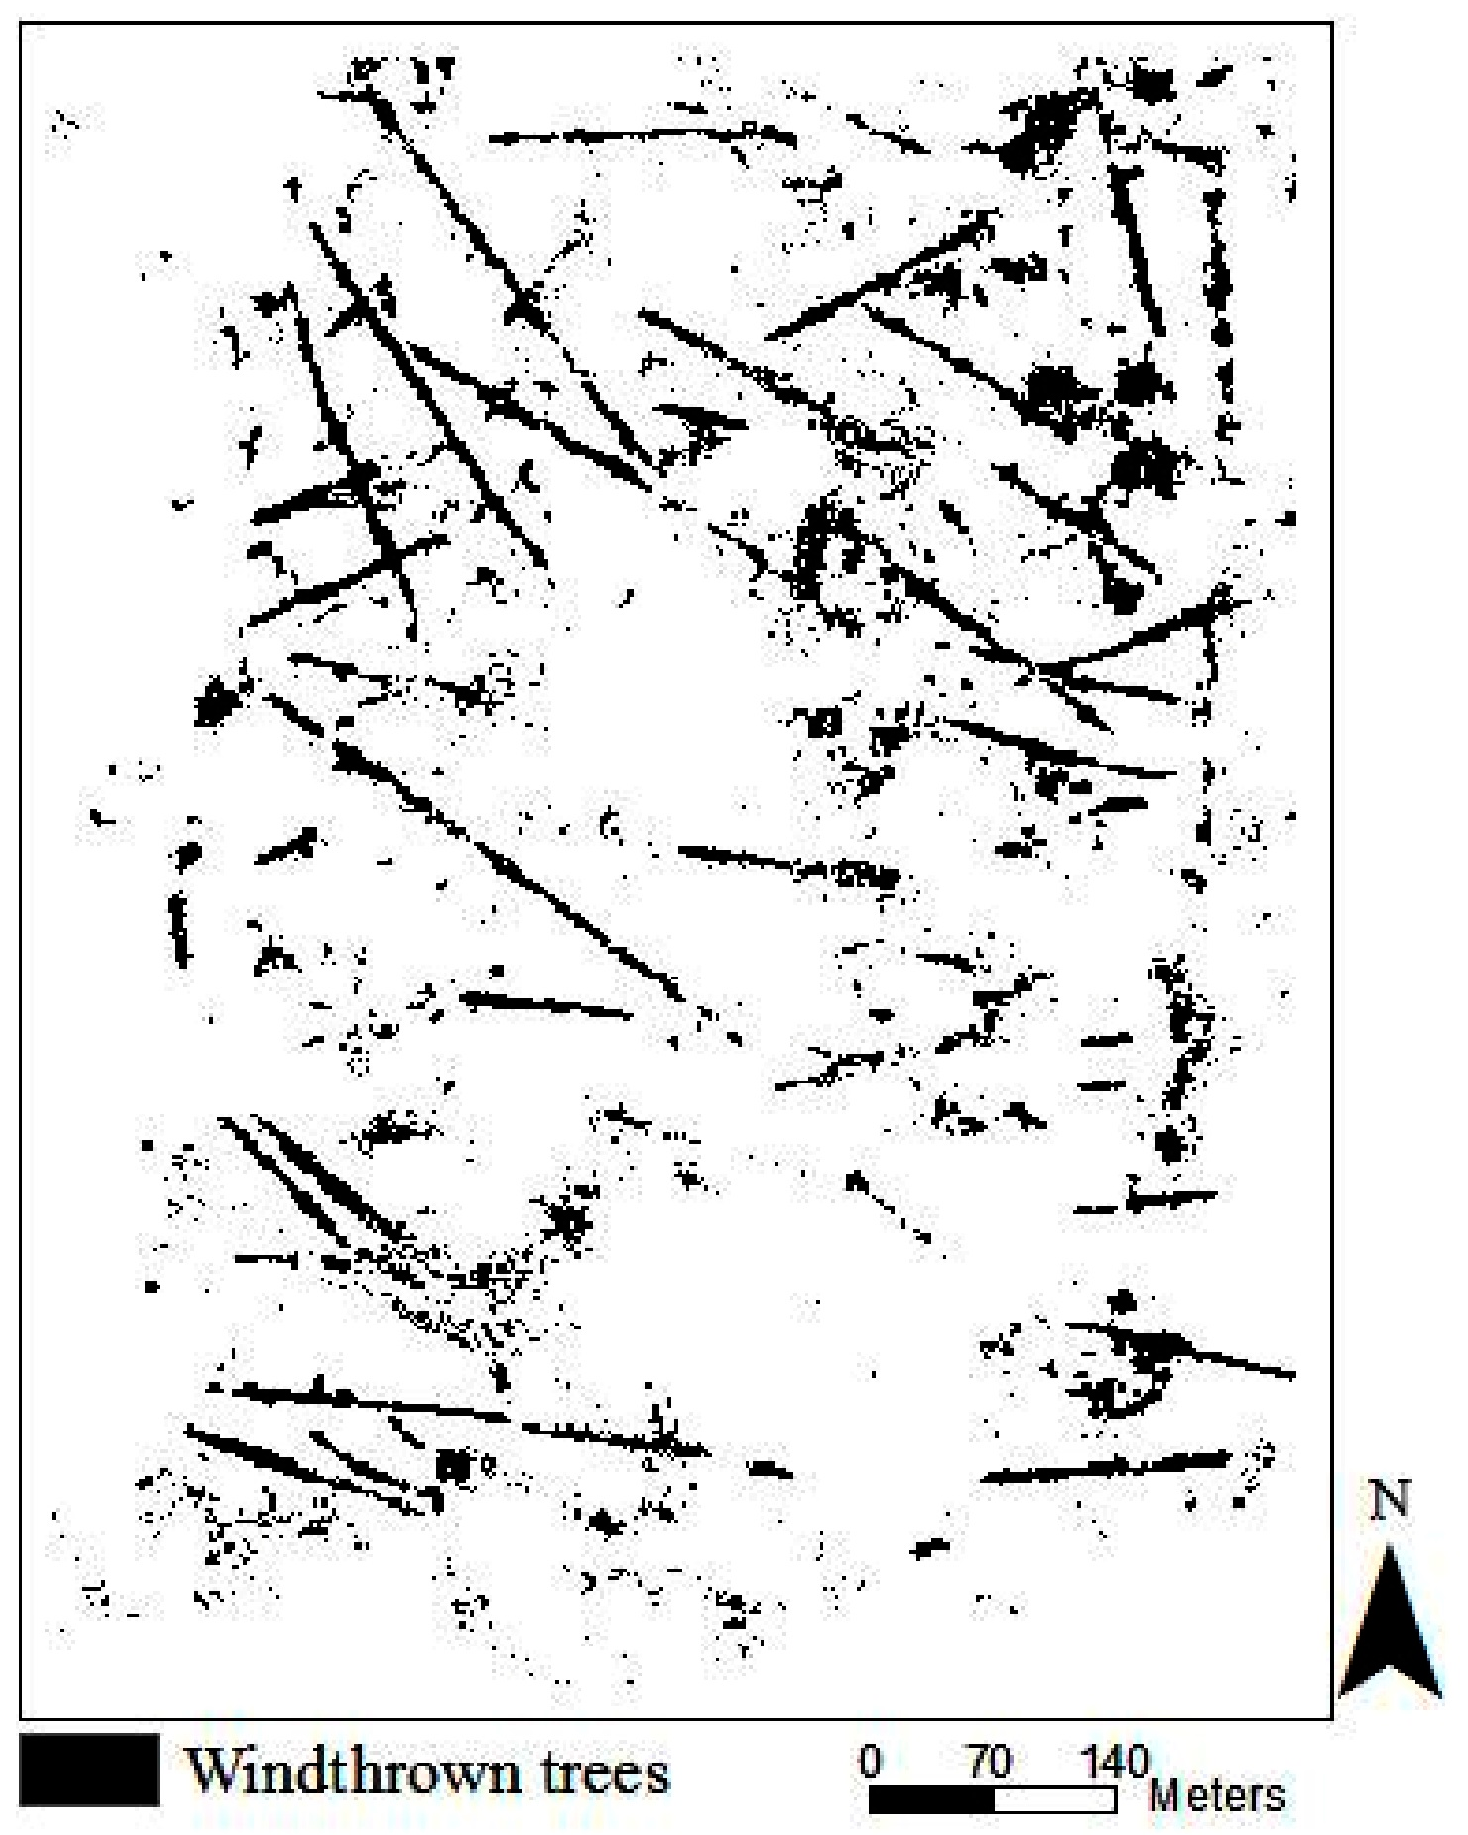
Figure 5.
Skeletal lines representing windthrown trees.

Figure 6.
The relationship between threshold T and the number of correct extractions, extracted errors, and omitted extractions.
Figure 6.
The relationship between threshold T and the number of correct extractions, extracted errors, and omitted extractions.
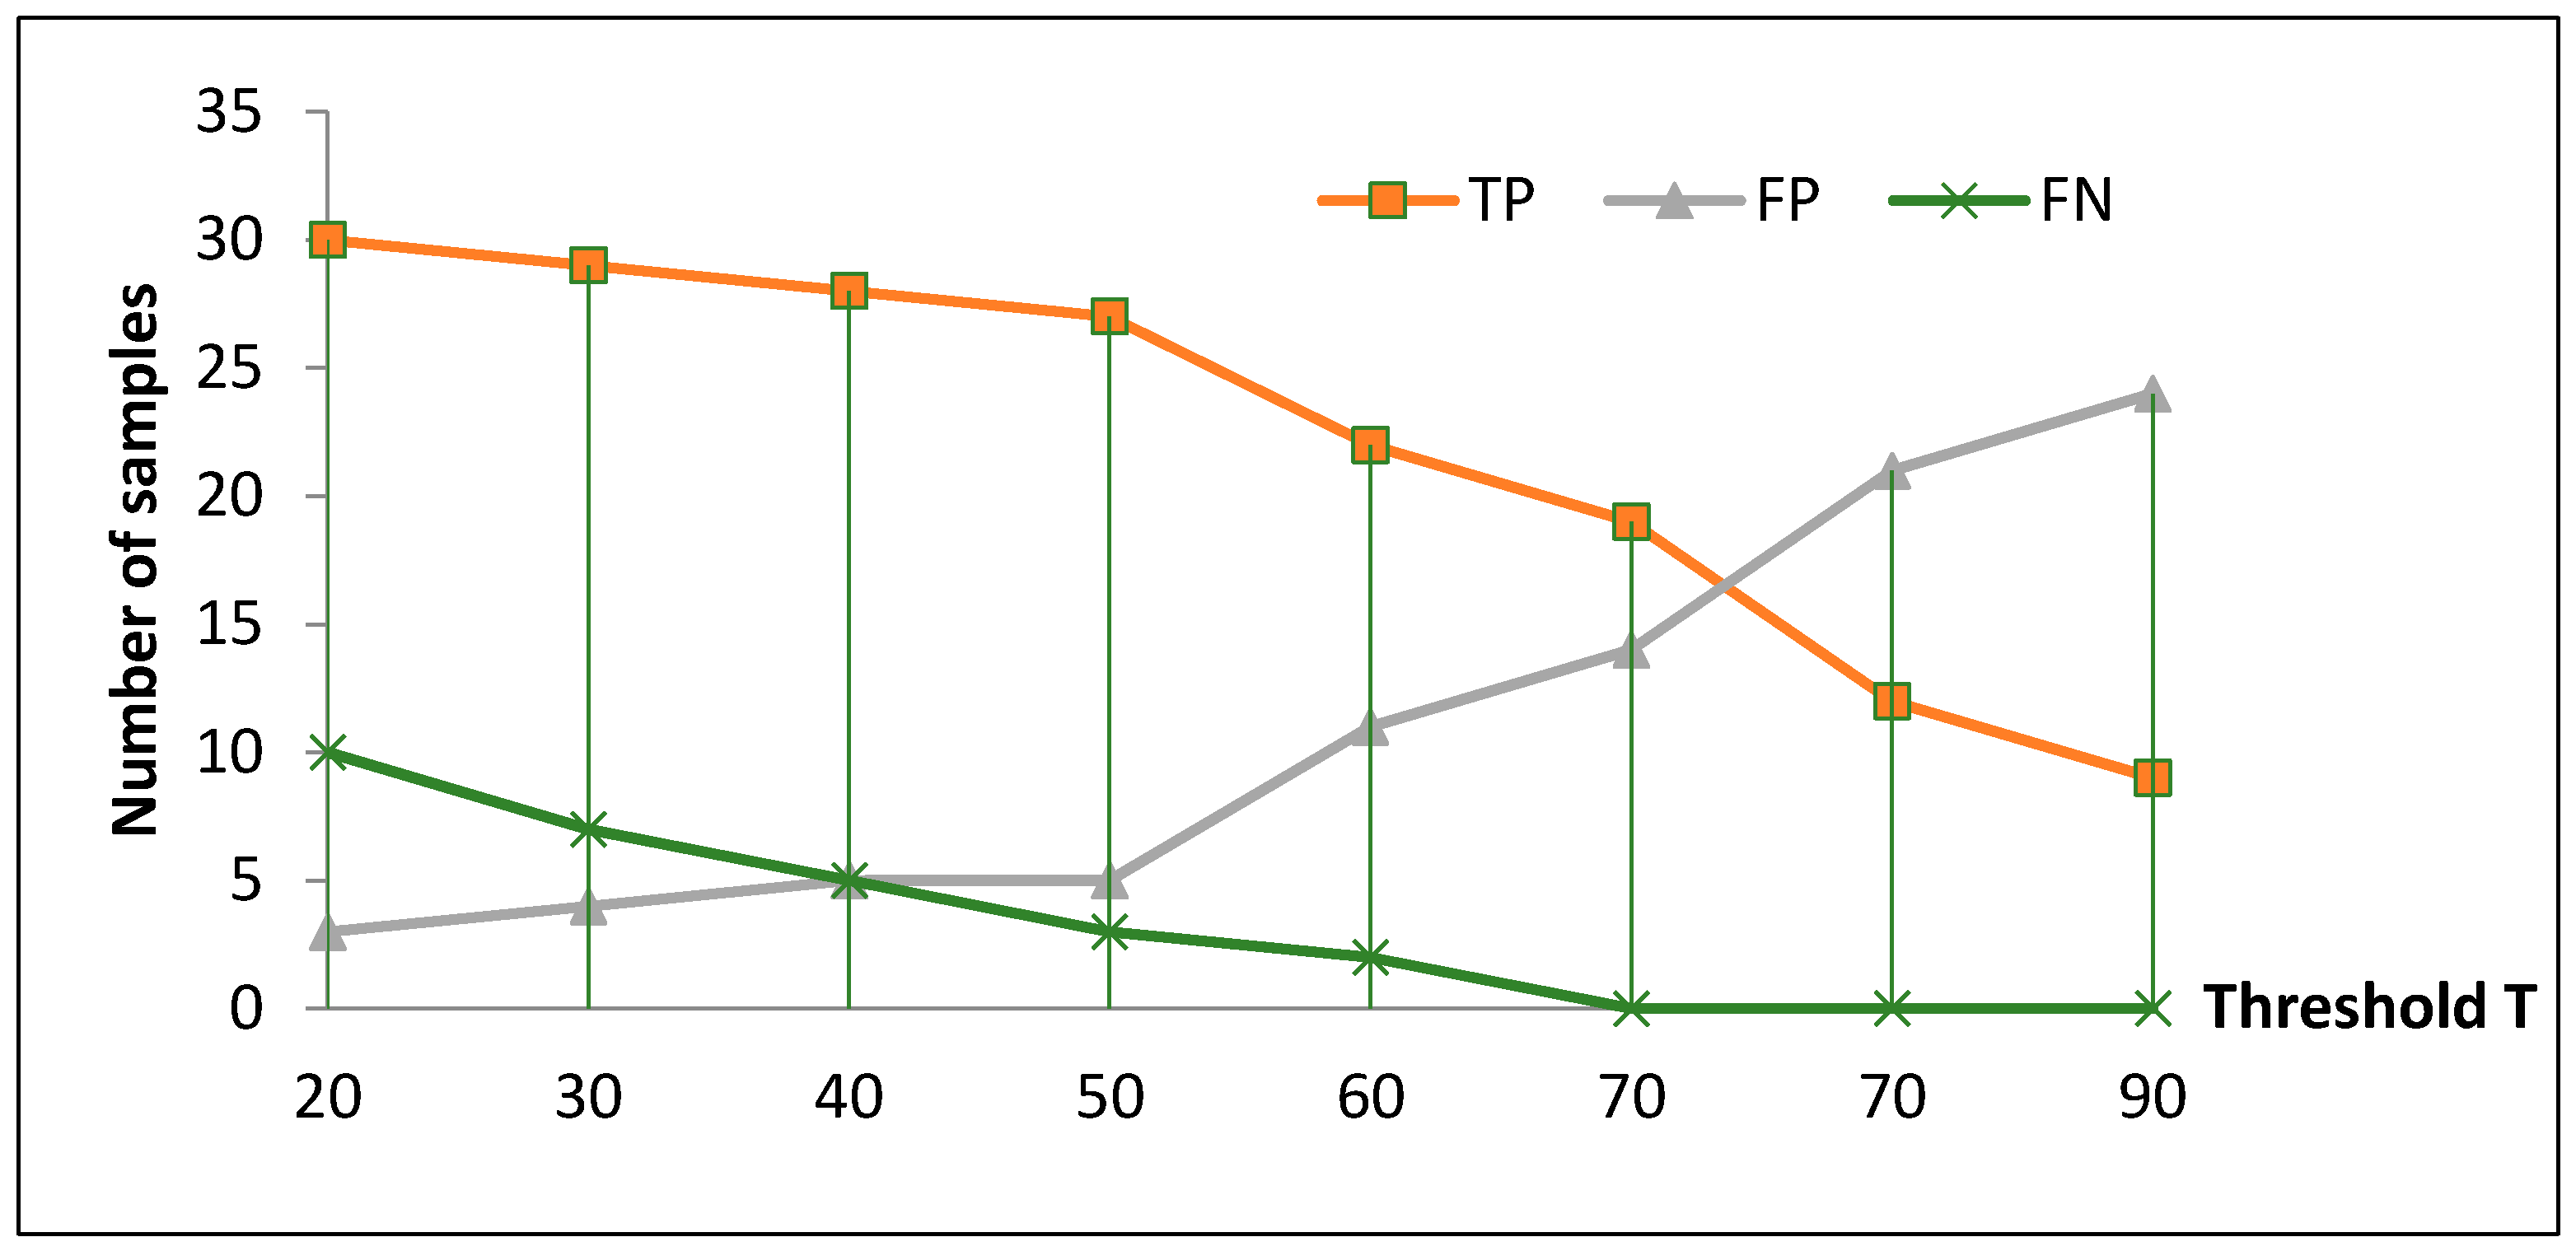
Figure 7.
The results of windthrown tree extraction: (a) experimental area; (b) verification area.


Table 1.
UAV image parameters.
| Parameter | Value |
|---|---|
| Platform | Sky-01C Zhong 5 UAV |
| The type of sensor | CMOS |
| Camera | Canon EOS 5D Mark II |
| Average altitude (above the ground) | 500 m |
| Date | 19 October 2011 |
| Color channel used | Red, Green, Blue |
| Format | JPEG |
| Resolution | 5616 × 3744 |
| Quality | Fine |
| Range of experimental area (pixels) | 320 × 420 |
| Range of verification area (pixels) | 300 × 400 |
Table 2.
Training and testing samples.
| Class No. | Class Type | # of Training Samples | # of Testing Samples |
|---|---|---|---|
| 1 | Windthrown tree patches | 450 | 600 |
| 2 | No windthrown tree patches | 1050 | 190 |
| Total | 1500 | 1700 |
Table 3.
Accuracy of coarse extraction.
| Customer Accuracy | Manufactured Accuracy | Total Accuracy | Kappa Coefficient |
|---|---|---|---|
| 92.66% | 95.24% | 94.48% | 0.86 |
Table 4.
Results of accuracy evaluation.
| Data | Index | |||
|---|---|---|---|---|
| Commission (%) | Omission (%) | Completeness (%) | Correctness (%) | |
| Experimental area | 7.5 | 24.3 | 75.7 | 92.5 |
| Verification area | 16 | 16 | 84 | 84 |
© 2017 by the authors. Licensee MDPI, Basel, Switzerland. This article is an open access article distributed under the terms and conditions of the Creative Commons Attribution (CC BY) license (http://creativecommons.org/licenses/by/4.0/).
Share and Cite
MDPI and ACS Style
Duan, F.; Wan, Y.; Deng, L. A Novel Approach for Coarse-to-Fine Windthrown Tree Extraction Based on Unmanned Aerial Vehicle Images. Remote Sens. 2017, 9, 306. https://doi.org/10.3390/rs9040306
AMA Style
Duan F, Wan Y, Deng L. A Novel Approach for Coarse-to-Fine Windthrown Tree Extraction Based on Unmanned Aerial Vehicle Images. Remote Sensing. 2017; 9(4):306. https://doi.org/10.3390/rs9040306
Chicago/Turabian StyleDuan, Fuzhou, Yangchun Wan, and Lei Deng. 2017. "A Novel Approach for Coarse-to-Fine Windthrown Tree Extraction Based on Unmanned Aerial Vehicle Images" Remote Sensing 9, no. 4: 306. https://doi.org/10.3390/rs9040306
Note that from the first issue of 2016, this journal uses article numbers instead of page numbers. See further details here.