
3D Digitisation of Large-Scale Unstructured Great Wall Heritage Sites by a Small Unmanned Helicopter

1
Harbin Institute of Technology (Shenzhen), Shenzhen, Guangdong 518055, China
2
Shanghai Institute of Space Power-Sources, Shanghai 200245, China
*
Author to whom correspondence should be addressed.
Remote Sens. 2017, 9(5), 423; https://doi.org/10.3390/rs9050423
Submission received: 14 March 2017
/
Revised: 24 April 2017
/
Accepted: 27 April 2017
/
Published: 29 April 2017
Abstract
:The ancient Great Wall of China has long suffered from damage due to natural factors and human activities. A small low-cost unmanned helicopter system with a laser scanner and a digital camera is developed to efficiently visualize the status of the huge Great Wall area. The goal of the system is to achieve 3D digitisation of the large-scale Great Wall using a combination of fly-hover-scan and flying-scan modes. However, pose uncertainties of the unmanned helicopter could cause mismatching among point clouds acquired by each hovering-scan. This problem would become more severe as the target area becomes larger and more unstructured. Therefore, a hierarchical optimization framework is proposed in this paper to achieve 3D digitisation of the large-scale unstructured Great Wall with unpredictable pose uncertainties of the unmanned helicopter. In this framework, different optimization methodologies are proposed for the fly-hover-scan and flying-scan modes, respectively, because different scan modes would result in different features of point clouds. Moreover, a user-friendly interface based on WebGL has been developed for 3D model visualization and comparison. Experimental results demonstrate the feasibility of the proposed framework for 3D digitisation of the Great Wall segments.
1. Introduction
One of the Seven Wonders of the world, the Great Wall of China is composed of a series of fortifications made of stone, brick, tamped earth, and other materials. The Great Wall stretches from east to west across China over a distance of 21,196.18 km that nowadays covers up to 15 provinces [1,2]. However, this miracle of mankind has long suffered from severe damage that is caused by both long-term natural factors and human activities. Almost one third of the Great Wall is gone, and another third is in bad condition. It is always a great challenge to investigate the Great Wall heritage site since it covers huge areas, in harsh environments. Traditionally, it took much time and effort for archaeologists to conduct a survey on the status of the heritage site. In 2002, a simple and rough survey was carried out and only limited on-site pictures and the rough position of each Great Wall segment were recorded. The survey was simultaneously conducted by a group of archaeologists over a period of 45 days. Thus, it is evident that it is almost impossible to do such investigations very frequently. Fortunately, a national-wide technical project was launched about three years ago by the Chinese government to allow archaeologists and scientists to work together to figure out an efficient and economical way to survey these marvelous cultural heritage sites. One of the main objectives of this project is to build a 3D digitisation of the Great Wall heritage site automatically for archaeologists to investigate and take effective remedial measures.
In recent years, 3D digitisation of cultural heritage sites has become popular, and many related projects from all around the world have been conducted [3,4]. In this regard, Remondino [5,6] has reviewed the state-of-art optical 3D measurement sensors and 3D modeling approaches especially for heritage site recording and documentation with remote sensing methods. However, most of those projects and methodologies were for small-scale scenes and individual objects, such as statues of Buddha, sculptures, museum artifacts, etc. According to the comprehensive investigation carried out in reference [5], only a few large-scale cultural heritage sites have been modeled. Achille et al. [7] presented an after-earthquake survey of historical tall buildings using unmanned aerial vehicles (UAVs) based photogrammetry and integrated technologies like terrestrial laser scanner (TLS). Xu et al. [8] presented a similar methodology using a camera-equipped UAV system and TLS for reconstructing 3D models of huge and complex monuments. Similarly, Al-khedera et al. [9] developed a documentation system for desert palaces in Jordan using 3D laser scanning and digital photogrammetry. In reference [10], a multi-resolution and multi-sensor approach, that integrates technologies such as global positioning system (GPS), topography, TLS, aerial imaging, and close range photogrammetry, was reported for the 3D digitisation of the entire Roman Forum (150 × 80 m) in Pompei, Italy. In reference [11], multi-scale images, existing floor plans, and TLS have been used to model complex castles in northern Italy with realistic details. El-Hakim et al. [12] developed an integrated technique for the detailed 3D reconstruction of large-scale heritage sites. In their work, they have used images for basic shapes and structural elements along with laser scanning for fine details and sculpted surfaces. Torres-Martinez et al. [13] have proposed a multi-data source and multi-sensor approach for 3D reconstruction and visualization of complex archaeological sites. Even though these methods are effective, they are not proper for very large areas as it is inefficient to collect large-area range data using ground-based TLS. The most efficient way to cover a large area is from above using airborne scanning and imaging [14]. In this direction, Zlot et al. [14] have developed a handheld 3D mapping system that includes a laser scanner and a digital camera. In their work, they have used this system for 3D mapping of the former Peel Island Lazaret in Queensland, Australia, covering an area of approximately 400 m × 250 m. However, this system is still not efficient for very large heritage sites. Compared with other heritage sites, the Great Wall of China consists of a series of fortifications stretched in wild places with a much larger scale and more complex terrain. Such scenarios pose a great challenge for 3D digitisation.
Small-size UAVs are alternative platforms for laser scanning that provide a good choice for developing an efficient, accurate, and flexible surveying scheme [15]. Lin et al. have developed a UAV-borne light detection and ranging (LiDAR) system for fine-scale mapping, such as tree height estimation, pole detection, road extraction, and digital terrain model refinement [15]. To measure and monitor structural properties of forests, Wallace et al. presented a low-cost UAV-LiDAR system that produces 3D point clouds [16,17]. To the best of our knowledge, there are very few papers that have reported the 3D modeling of large-scale cultural heritage sites with small UAV-based scanning techniques. In this paper, a small unmanned helicopter with a laser scanner and a digital camera is built using fly-hover-scan and flying-scan methods to obtain the 3D data of the Great Wall heritage site. The onboard sensor system comprises a lightweight laser scanner, GPS receiver, micro-electromechanical system (MEMS) based inertial measurement unit (IMU), and barometric altimeter. All the positioning and orientation sensors are lightweight as well as low-cost. The pose uncertainties of the unmanned helicopter could cause mismatching among the point clouds acquired by each scan. This problem could become more severe as the target area becomes larger and more unstructured.
The main contribution of this paper is to propose a new hierarchical optimization framework to achieve 3D digitisation of the large-scale unstructured Great Wall with a low-cost UAV based scanning system. In this framework, different optimization methodologies are proposed for fly-hover-scan and flying-scan modes, respectively. This is because the different scan modes would generate point clouds with different features. In the fly-hover-scan mode, an iterative closest point (ICP) algorithm is first designed to match the neighboring two point clouds automatically. Then a graph optimization algorithm is proposed to further optimize the 3D modeling results. In the flying-scan mode, all point clouds of a specific segment are divided into left pieces and right pieces which the ICP algorithms apply hierarchically.
The aim of this paper is to present a framework for the 3D digisation of the large-scale Great Wall heritage site using small-size UAV equipped with lightweight and low-cost sensors. The remainder of this paper is organized as follows. In Section 2, the UAV system is presented and a hierarchical optimization framework is proposed for the 3D digitisation of the large-scale Great Wall. The experimental results and discussions are presented in Section 3 and Section 4, respectively. Section 5 concludes the work.
2. Materials and Methods
2.1. Airborne Hardware System and Processing Software
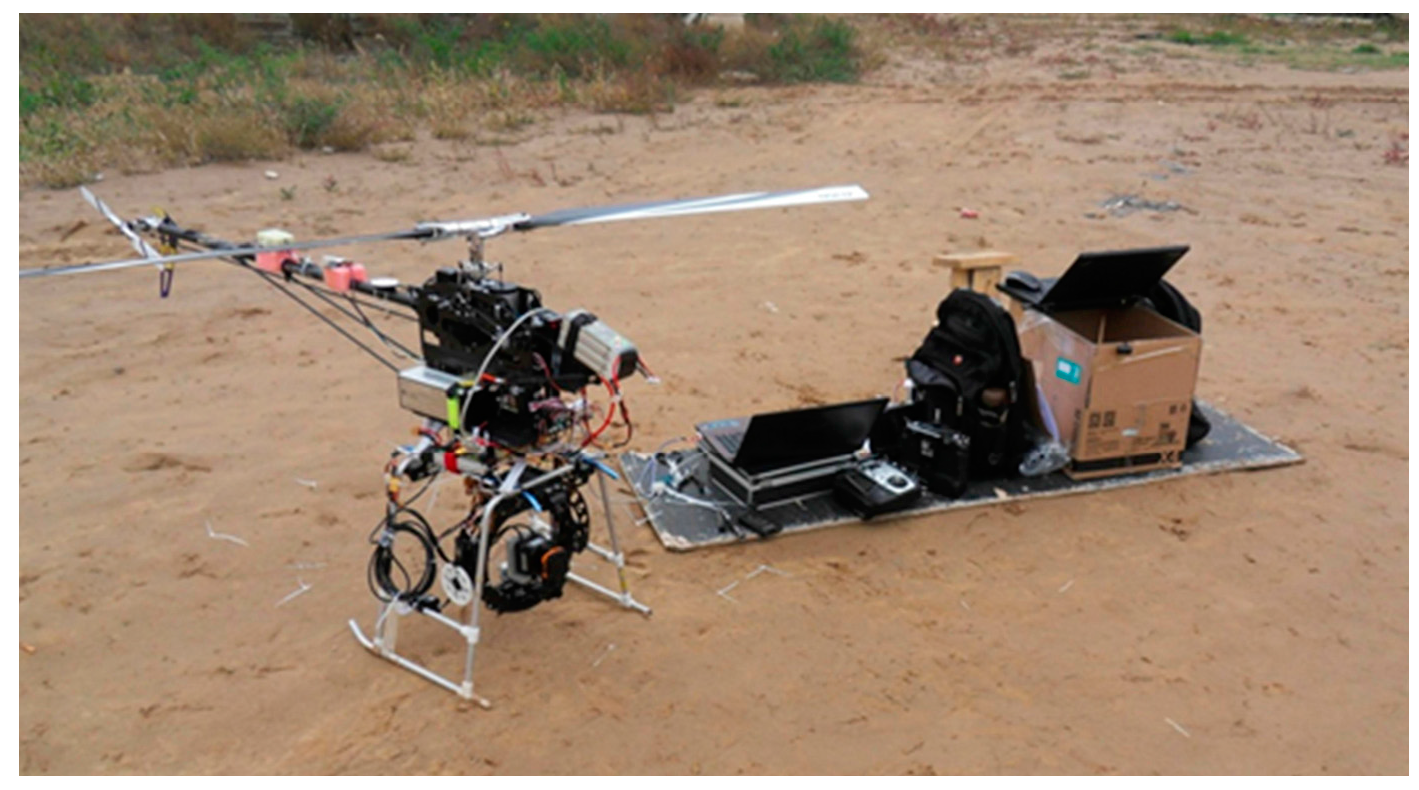
Our experimental system consists of a small unmanned helicopter (ALIGN 800, main rotor diameter 1740 mm, flying weight (without battery) approx. 3950 g), a 2D laser scanner (UTM-30LX), an IMU (ADIS16405BMLZ), a digital compass (HMR3300), a barometric altimeter (MS5611), a GPS receiver (ublox VK24U7 module), and a pan-tilt. The barometric altimeter aids in determining the height since the GPS receiver gives height information with large errors. The pan-tilt is used to implement 3D scanning with the 2D laser scanner which is a lightweight and low-cost solution. The key specifications of the laser scanner and the positioning/orientation sensors are summarized in Table 1 and Table 2. In addition, to make the data acquisition procedure easier, two standard mini digital cameras are installed on the platform. One of these provides the front view of the helicopter, while the other one is used to obtain the images of the object. A real-time operating system, QNX [18], runs on the embedded computer mounted on the helicopter. A ground station system based on OpenPilot [19] is developed to monitor and control the helicopter which runs on a standard laptop. The data acquisition hardware is shown in Figure 1.
The quality of the point cloud is not always so good for 3D reconstruction because of the deficiencies of the data acquisition system and the variety of experimental environments. So it is essential to perform some smoothing for the point cloud, which is of great benefit to surface reconstruction. In this experiment, the moving least square (MLS) method [21] is implemented to reject outlier points. Once the point cloud has been smoothed, Delaunay triangulation is used to construct the 3D model with some wrap functions in Geomagic Studio [22]. As mentioned at the beginning of this paper, 3D digitisation of the Great Wall heritage site is aimed to assist archaeologists in their investigation and research on culture heritage sites. Hence a web-based interface is also developed to allow archaeologists to conveniently observe and explore the current state of the entire Great Wall from their independent locations. WebGL (Web Graphics Library) [23] has been used to develop this interface for rendering interactive 3D computer graphics within any compatible web browser.
2.2. Hierarchical Optimization Framework
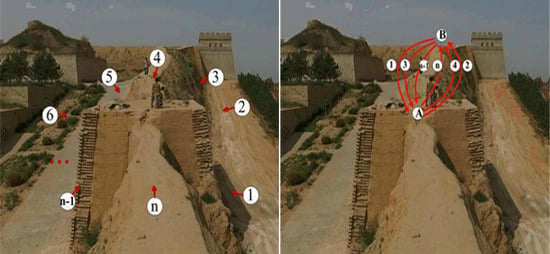
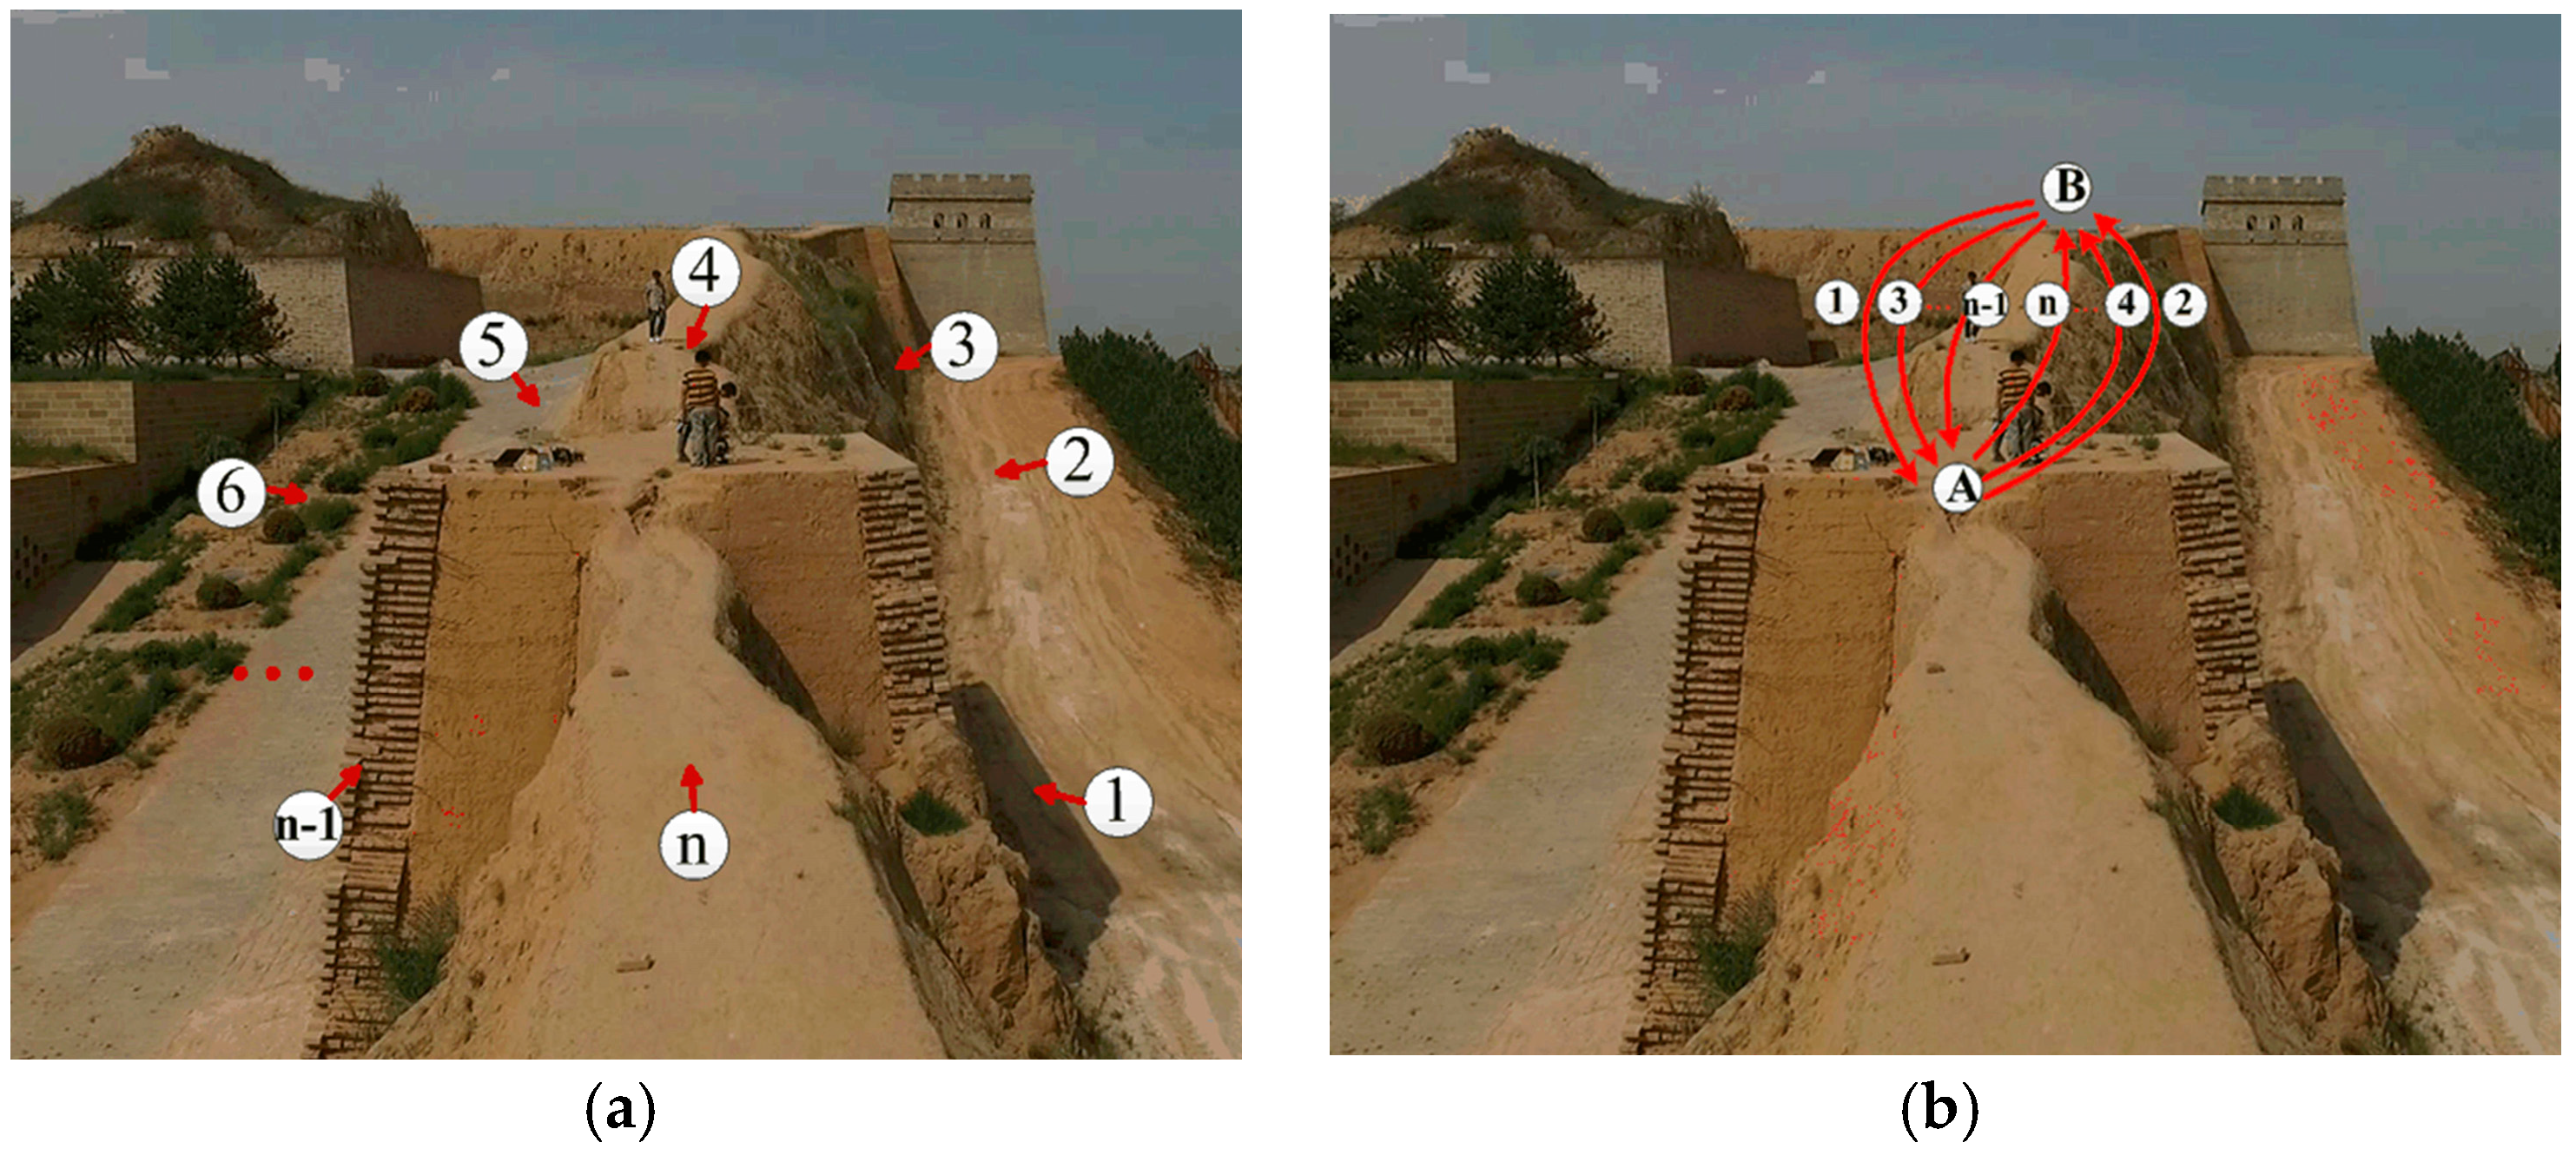
Given that the Great Wall is composed of many connected walls, fortresses, and beacon towers, it would be ideal to divide them into consecutive segments. Each segment is scanned by one take-off where the length of a segment depends on how long the unmanned helicopter could fly. According to suggestions from archaeologists, among these segments, some are preferred to be recorded with more details such as fortresses, beacon towers, and some special wall segments because of their relatively higher archeological significance. To capture more details of the faded profile of these segments, a “fly-hover-scan” method is adopted for each target segment (Figure 2a). The unmanned helicopter flies around the target segment to scan both sides of the target. Once the helicopter arrives at an expected position, say the (n − 1)th position, it keeps hovering for a while to allow the laser scanner to obtain plenty of points. Then, the helicopter moves to the nth position and restarts a new scan. For each segment, the trajectory of the UAV was pre-planned on the ground station. The distance between two adjacent scanning positions was set to ensure some overlap between two adjacent point clouds. This method can generate enough cloud points although it would take a relative long time to model the whole area of the large scale Great Wall.
For other kinds of segments with few features or little archaeological value, such as the wall connections between fortresses and beacon towers, a “flying-scan” method is adopted as a supplement for more efficient modeling where the UAV does not need to hover and the laser scanner is kept still. In the practical experiment, however, the helicopter should fly back and forth quickly to make sure that the scanned area covers the whole object, and enough points are obtained for the surface of an object so that the point cloud can represent as many structural features as possible. An example of the flying-scan mode is shown in Figure 2b where the helicopter flies along the trajectory 1 → 2 → 3 → 4 → 5 → 6… and turns around at the two endpoints A and B.
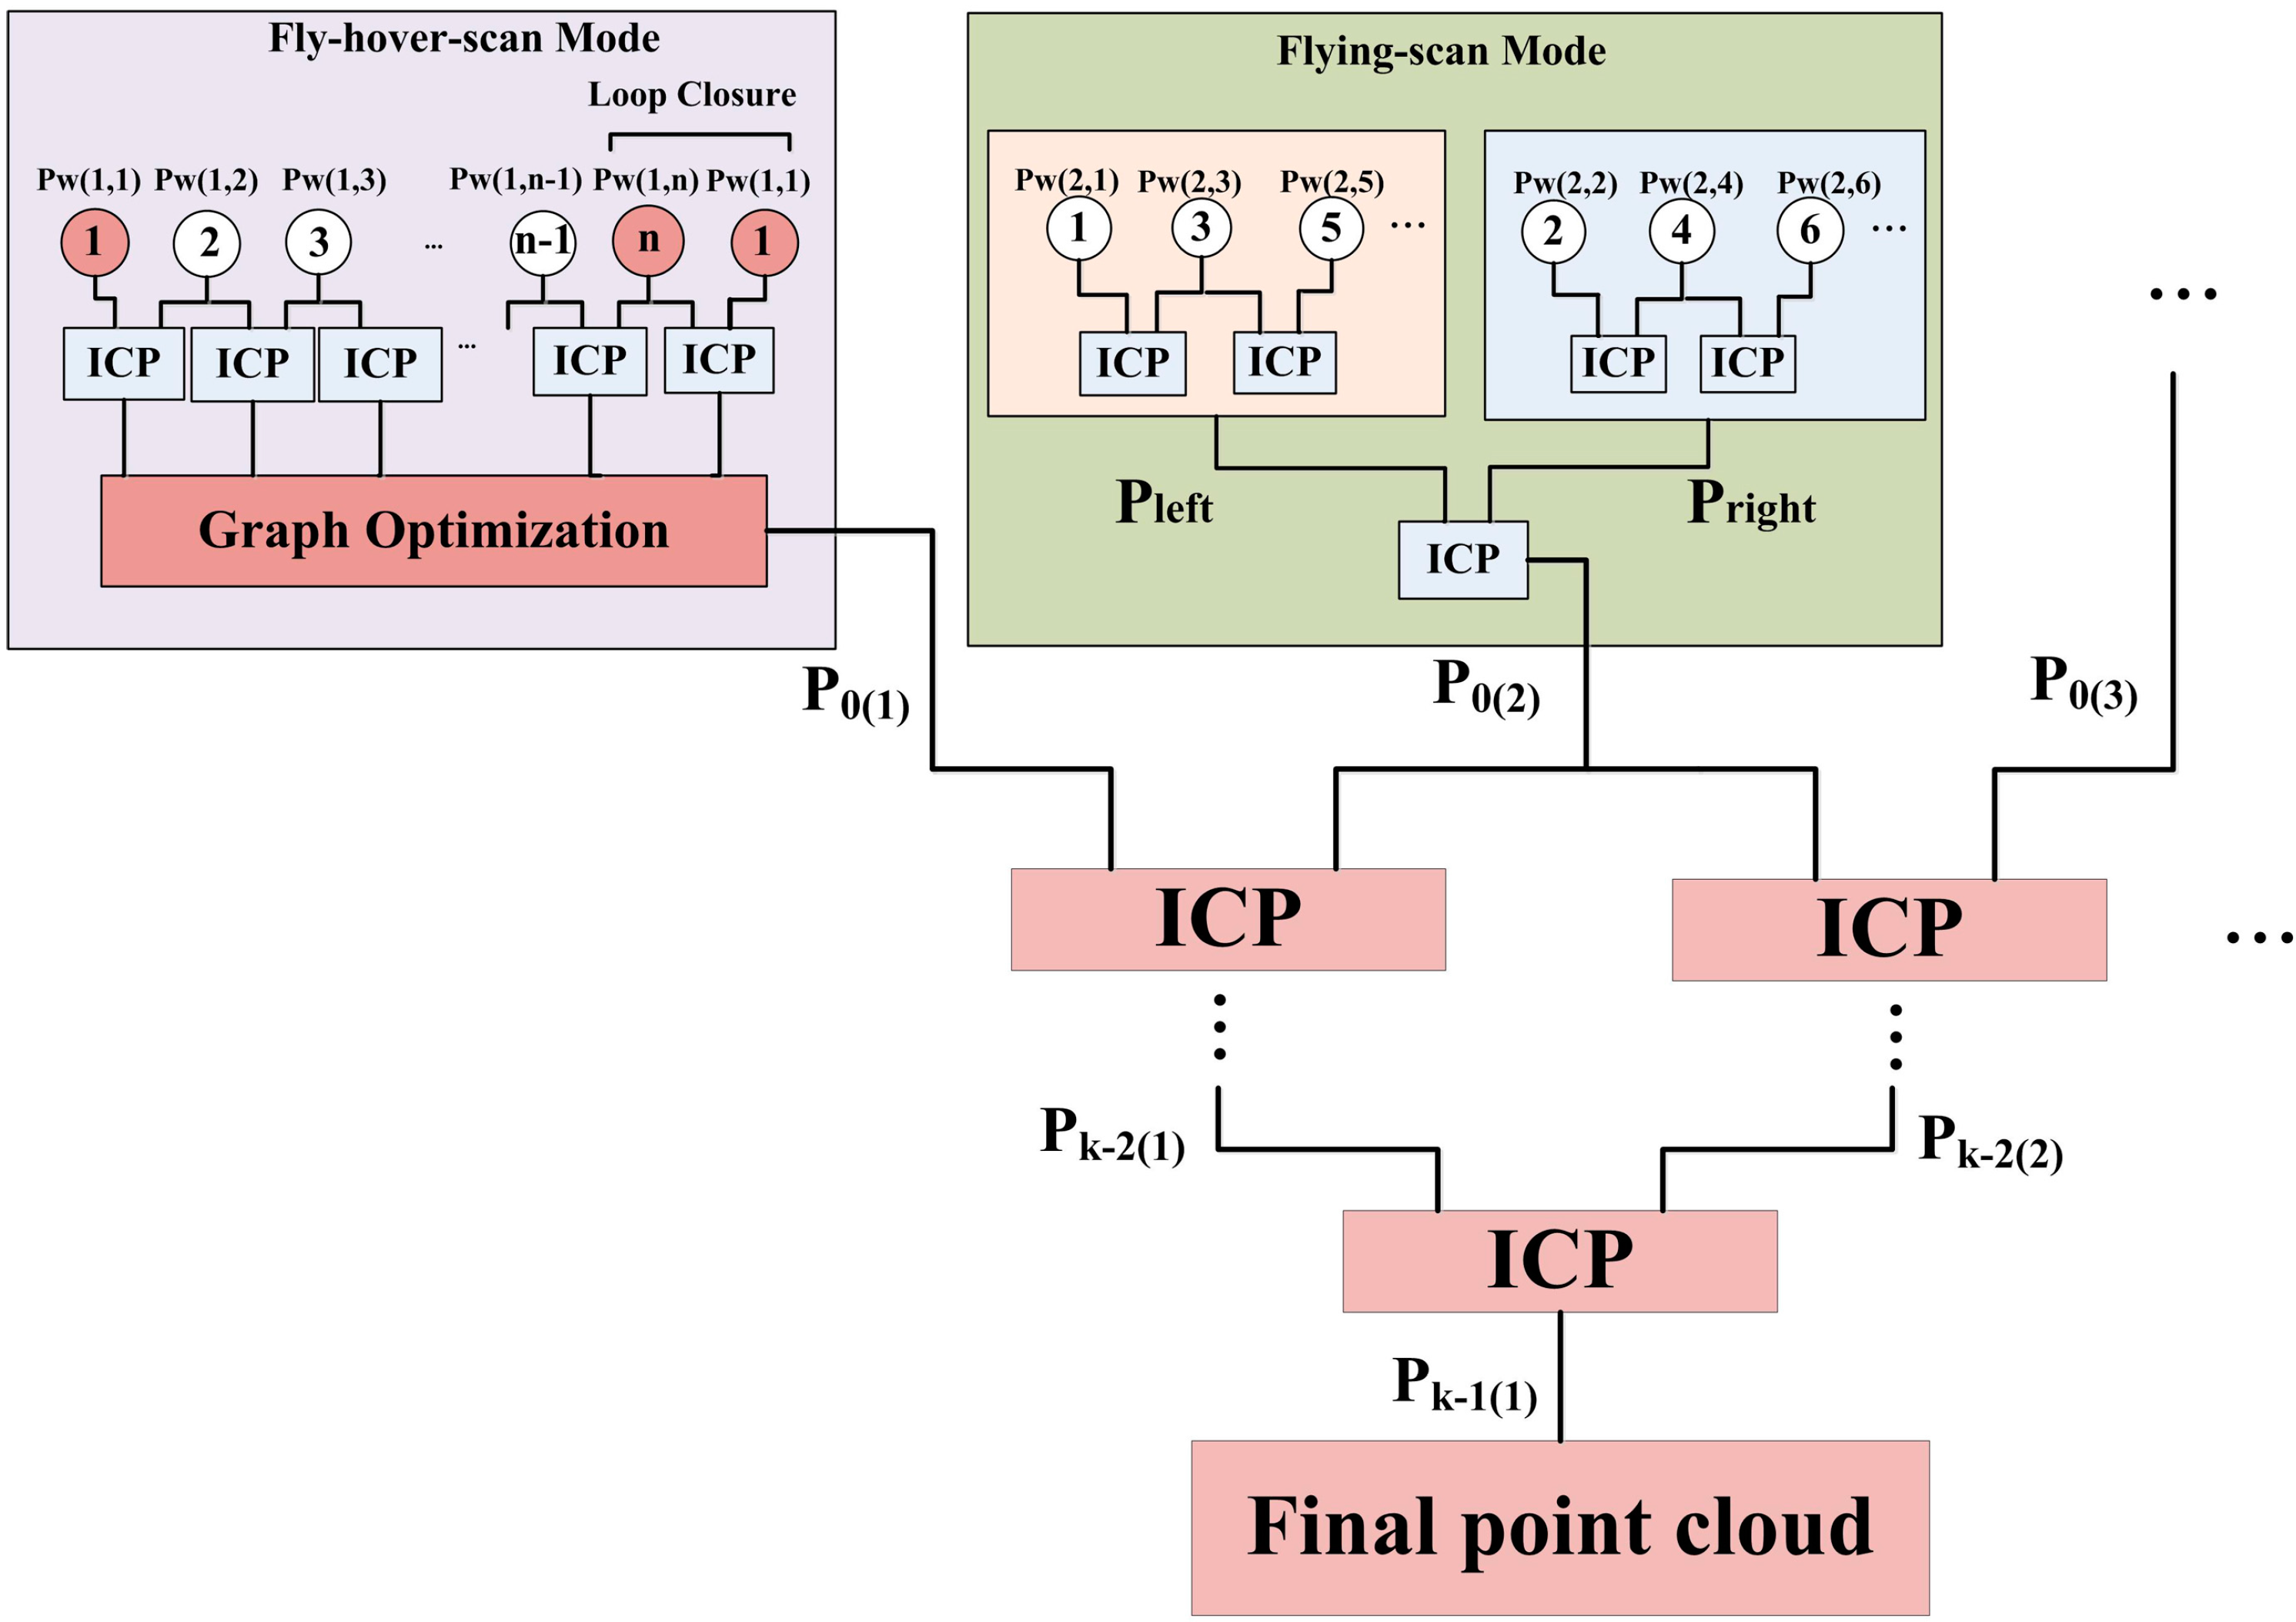
Once all the datasets are obtained by either “fly-hover-scan” or “flying-scan”, these point clouds generated by the laser scans at different locations need to be fused together for modeling each segment. Then all the segment models need to be integrated for the whole area. However, such scenarios demand more accurate positions of the UAV because the pose uncertainties of the helicopter would cause mismatching among different laser scans and/or different segments. Those uncertainties usually result from different factors such as onboard sensor inaccuracy and external disturbances, which might be unpredictable. Moreover, different scanning methods require different optimization techniques because of their individual features. Hence a hierarchical optimization framework is proposed to tackle this problem for more efficient 3D modeling of the large scale Great Wall (Figure 3).
According to Figure 3, all segments are divided into two categories as fly-hover-scan blocks and flying-scan blocks that consist of the 1st layer. The output of each block in the 1st layer, P0(1), P0(2), P0(3), …, represents the optimized point clouds of the individual Great Wall segments. Then two adjacent outputs are fused sequentially using ICP algorithms as the second layer. Likewise, the entire digitisation of the Great Wall heritage site can be obtained eventually. In the following sections, two optimization techniques are proposed for different scan modes, respectively.
2.3. Fly-Hover-Scan Mode
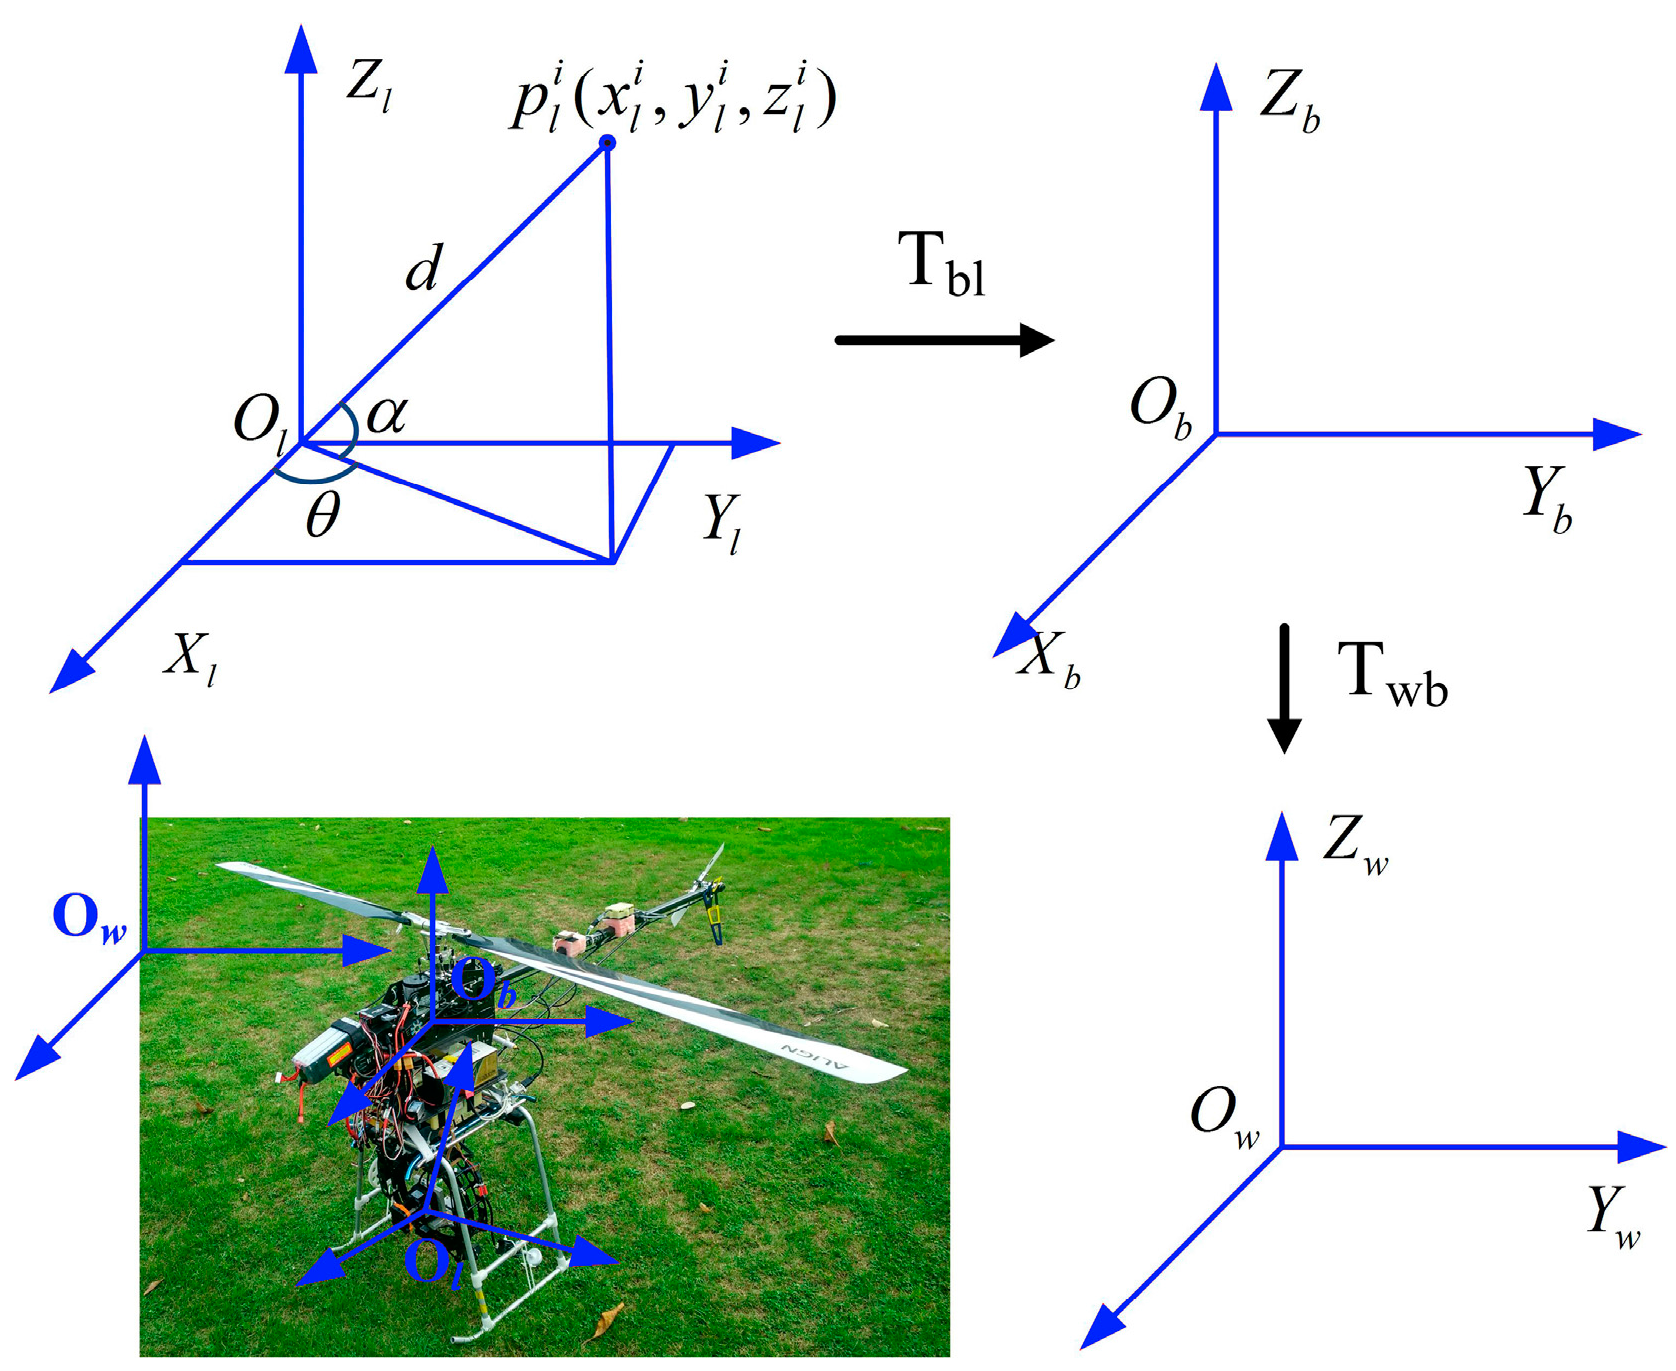
Three coordinate systems are defined in this paper. They are the world coordinate system , the helicopter coordinate system , and the scanner coordinate system , as shown in Figure 4. The raw data of the point cloud is expressed in the scanner coordinate system. The 3D coordinates of the ith object point in the scanner coordinate system, , can be expressed as:
where is the distance from the scanner to the object point , is the angle between the scanning line and the plane, and is the rotation angle of the pan-tilt (3D scanning using a 2D laser range scanner and a pan-tilt). The transformation matrix from the scanner coordinate system to the helicopter coordinate system is denoted by which is obtained from calibration [24]. The transformation matrix from the helicopter coordinates to the north-west-up (NWU) world coordinate system, , is expressed as:
where and are the rotation matrix and translation matrix from the GPS/IMU/altimeter integrated system, using a similar technique presented in [25].
According to the “Fly-hover-scan model” block in Figure 3, two adjacent point clouds ( and ) for a Great Wall segment are matched and fused together using an ICP algorithm [26] based on the sequential and lateral constraints among the laser scans shown in Figure 2a. Each newly generated point cloud is always relative to the previous scan pose. In most circumstances, however, the integrated point clouds might be mismatched because pose estimation for the helicopter has relatively large and inconsistent errors. Hence, graph optimization is then designed to further optimize the fusion results of all point clouds from to given all possible constraints once loop closure is detected between two point clouds and . The same method is adopted for each segment where more detailed structures need to be obtained.
Suppose two adjacent point clouds for the ith Great Wall segment ( and ) have been obtained in the scanner coordinate. Then the corresponding point clouds in the NWU coordinate system, and , can be derived as,
First define the point sets and for the point clouds and , respectively. Then a Euclidean distance threshold Dth is set to pick out the point pairs of interest whose distance is less than Dth using the kd-tree search method. Next, the spatial transformation matrices, and , are determined by minimizing the objective function with the g2o algorithm [27],
To make the algorithm converge, two adjacent scanning areas should have enough overlap during the data acquisition process. In other words, the (j − 1)th and jth positions of the helicopter in Figure 2a cannot be separated too far. Define as and then we have,
Hence, combined with Equation (3), the transformation matrix is obtained for the adjacent point clouds and at adjacent scanning positions as,
Since all point clouds obtained at different positions need to be relative to a reference coordinate, e.g., the helicopter coordinate system at the first scanning position, the transformation matrix for two point clouds at the first and the jth scanning positions is deduced as,
According to Equation (7), all point clouds from the first one to the jth one can be roughly integrated for a typical Great Wall segment.
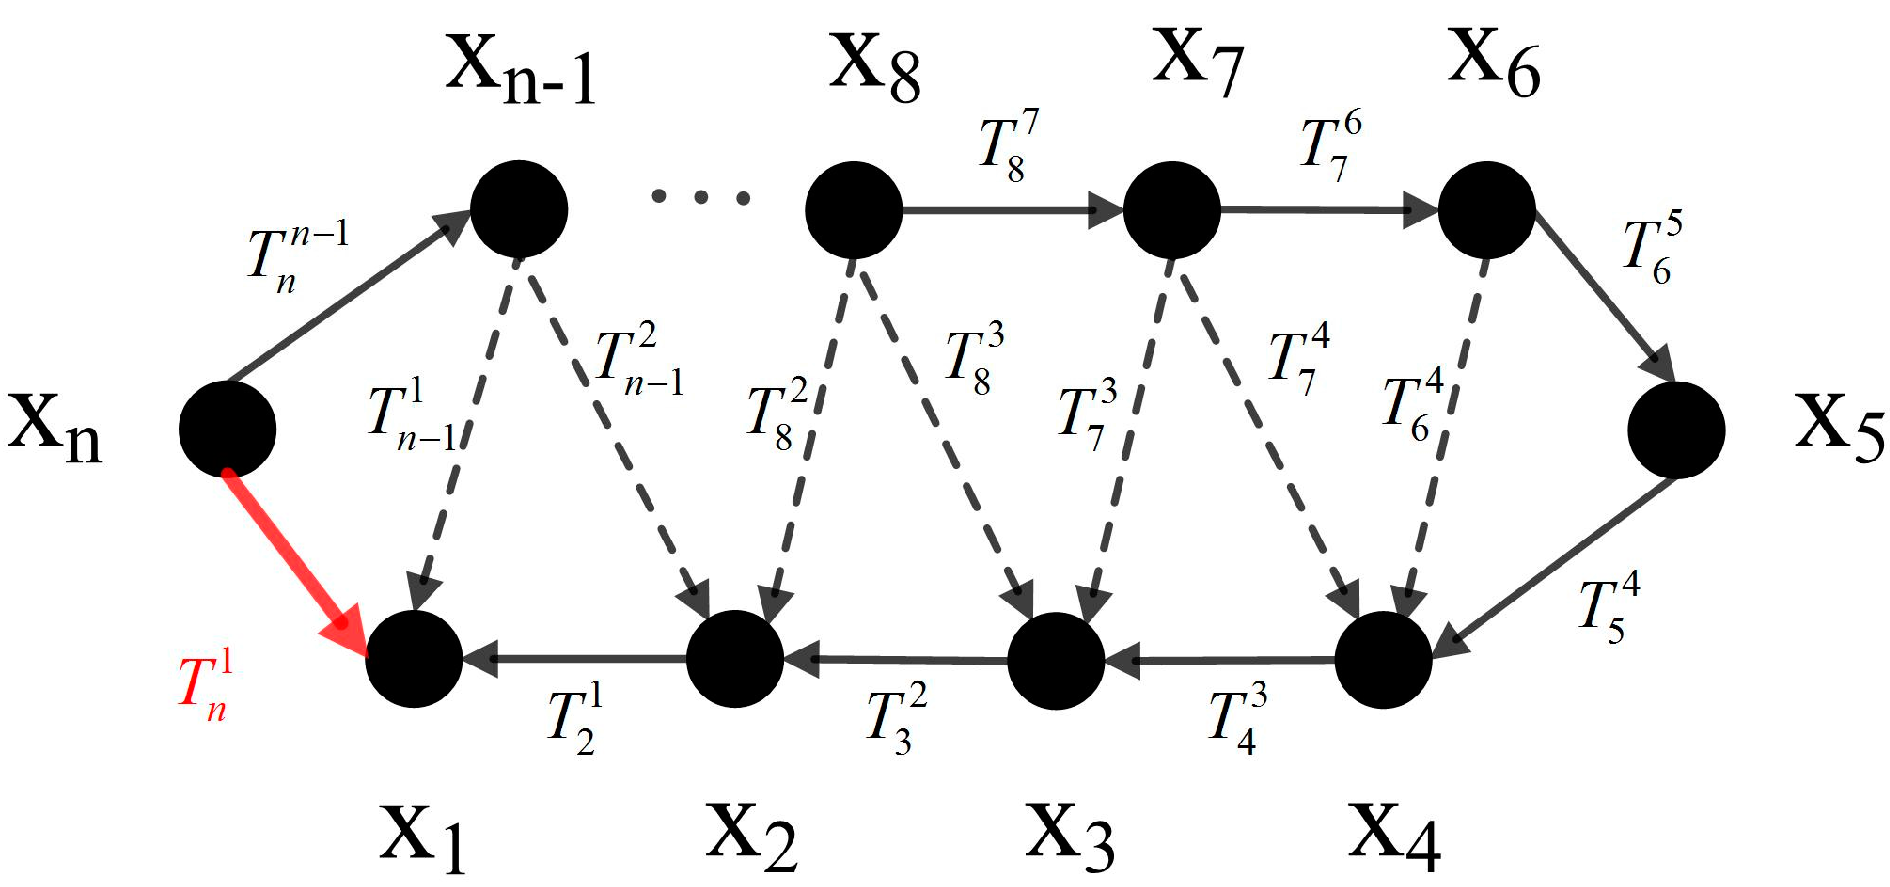
To further reduce mismatches among the different point clouds, the graph optimization algorithm is designed accordingly for a segment scanned by the “fly-hover-scan” method. The helicopter poses at different scanning times can be represented by a pose graph (Figure 5). The graph node represents the helicopter pose and the edge represents the constraint, which for this case represents the transformation relationship obtained by the ICP algorithm as stated previously. The solid line represents the definite constraint while the dotted line represents the possible one. In this algorithm, the constraints will be detected automatically based on the overlap between two point clouds. Due to measurement and estimation errors, those constraints cannot make the trajectory consistent. To create a consistent trajectory, graph optimization is needed.
Before optimization, the transformation matrix between the current helicopter pose and the previous helicopter pose should be checked. If the current helicopter pose changes beyond a threshold compared with the previous pose, it will be labeled as a key pose and added to the pose graph as a node with an edge constraint between the current pose and previous poses. According to the scan mode, the helicopter should fly along a planned trajectory which is roughly around a target wall segment. So a loop closure should exist between the first and last helicopter poses. Then the loop closure detection can be done sequentially based on the order of the scanning time. In this paper, the loop closure is validated with an overlap threshold between two point clouds. If a loop closure is detected between two key poses, a new edge will be added to the pose graph. Once a pose graph is ready, the optimization problem can be defined as,
where is a vector of all helicopter pose nodes to be optimized and represents the ith helicopter pose during the modeling. Furthermore, is defined as , where is the mean of the constraint representing the transformation matrix from the pose node to , which is obtained by the aforementioned ICP algorithm in Section A. In addition, represents the information matrix of . Then the optimal vector can be derived to better estimate the helicopter positions using the g2o algorithm. As each helicopter position also corresponds to a piece of the laser point clouds, all point clouds can be accordingly updated and better matched for the final modeling of a Great Wall segment.
2.4. Flying-Scan Mode
Inaccurate position measurements could still lead to apparent mismatch in the point cloud data obtained by the flying-scan scheme. To solve this problem, an effective method is proposed as the flying-scan block in Figure 3. For a specific segment, the obtained point cloud data are first divided into several pieces. Each piece of the point cloud is generated during the flight between the turning points A and B which are labeled as P1, P2, P3, P4, etc. corresponding to the numbers of the flight trajectory (shown in Figure 2b). Odd-labeled ones P1, P3, etc., and even-labeled ones P2, P4, etc., represent the left and right side of a segment, respectively. Then the ICP matching algorithm (the same as the one in the fly-hover-scan mode) is applied to the adjacent point clouds for the same side of the wall to eliminate the localization error. That is to say, ICP matching is performed between P1 and P3, P3 and P5, P2 and P4, P4 and P6, and so forth. Once the ICP matching between the adjacent point clouds on both sides of the wall is completed, new point clouds representing the left and right side of the wall are generated. Generally, the number of the points in two clouds is extremely large. So a voxel grid filter [28] is used to down sample the point cloud data to speed up the matching. Then these left side and right side clouds will be integrated by the ICP method.
3. Experimental Results
3.1. Study Area
The current state of those disappearing ancient Great Wall sections is of high interest. Some typical heritage sites originally built with tamped earth in the Ming Dynasty (Year 1368–1644) were chosen to evaluate the proposed methods. Specifically, Zhenbei Tai, Jianan Bao, Erlou Cun, and Shiba Dun Cun, located in Yulin, Shannxi Province, China, were chosen for the case study. Zhenbei Tai and Jianan Bao are in relatively good condition and are still functional in some sense (Figure 6). However, the Erlou Cun and Shiba Dun Cun have been severely damaged (Figure 7). All of them are in a desert environment with little vegetation, strong wind, and extreme temperature variation.
We did the scanning experiments in October 2014 and July 2015. It was sunny and without strong wind. The UAV flied above the target up to 5–10 m. It took about 15 minutes to accomplish one segment with each flight. The flight would go on once the battery was replaced. In our experiments, the Great Wall was divided into consecutive segments with a length of 30–100 m (depending on the power limit and the structure complexity) for each one. In addition, there was always some overlap between two consecutive segments. Thus, it was feasible to build the 3D model for the large-scale Great Wall by integrating all the consecutive segments.
3.2. Optimization for the Fly-Hover-Scan
With the method depicted in Section 2.3, Figure 8 and Figure 9 demonstrate an example of a typical wall segment suitable for the fly-hover-scan mode. Figure 8 shows estimations of the helicopter positions before and after graph optimization where the unmanned helicopter flied around the target with 13 hovering positions in total with the end position overlapping the starting position. For this segment, the j in Equation (7) equals 13. Likewise, the number of pose nodes in Equation (8) for the optimization is 13. It can be seen from Figure 8 that the cumulative error makes the last position (−1.5 m, 0.3 m, −2.2 m) be far away from its true position (1 m, 1 m, 1 m) before graph optimization (red dot-line). However, such problems are solved after graph optimization where the last position (0.9 m, 0.9 m, 1.0 m) (blue dot-line) is much closer to the real situation. As a priori, the helicopter took off and landed at the same position for each flight in our experiments. The statistical distance error for the start/end position is 0.26 ± 0.18 m.
The final point cloud after ICP and graph optimization for one segment is shown in blue color in the upper part of Figure 9 while the red color represents point cloud modeling without optimization. The lower part of Figure 9 is the picture taken in the field. For the real wall, there is a slope from the right part to the left at the bottom (dot-line square in the picture). It is obvious that the blue point cloud is much more consistent with the real conditions than the red point cloud. In other words, the blue point cloud represents this segment more accurately. It is, therefore, concluded that the proposed optimization framework performs well enough for the fly-hover-scan mode by eliminating the side effects of helicopter pose uncertainties.
3.3. Optimization for the Flying-Scan
Figure 10a shows the point clouds of another typical Great Wall segment transformed into a consistent coordinate system when the UAV flew along a trajectory. There is an obvious deflection phenomenon observed in Figure 10a.
Ideally, most cloud points at the edges in both the red point cloud P1 and blue point cloud P3 (Figure 10a) should be at the same positions in the world coordinate system for all trajectories on the same side of the wall segment, because they represent essentially the same surface of the wall. However, when these cloud points are transformed from the scanner coordinate system into the world coordinate system, the transformation matrices are a function of the UAV positions. The barometric altimeter is used to estimate the height of the UAV. However, the height measurement is easily affected by air turbulence in the outdoor environments. Figure 10b shows the height measurement (red line) with the flight trajectory in the direction (blue dotted line). It can be seen from Figure 10b that an obvious height jump appears at every turning point A and B (mentioned in Figure 2b). However, the observation was that the helicopter did not make such large drifts in height when turning around. So these height jumps can be considered as a large height estimation error in this scan mode. The main reason is the sudden change in flight direction causes air turbulence.
Figure 11a shows the results after applying the proposed optimization depicted in Section 2.4 to the point clouds P1, P3, etc., which belong to the same side of the segment as shown in Figure 10a. According to Figure 11a, the edges of the segment are obviously matched while different point clouds are pieced together to provide a relatively complete surface point cloud inside the edges. Both the integrated sides of the wall segment are shown in Figure 11b, and the optimized point cloud for the segment is much more consistent. Thus, the proposed method is effective for eliminating the deflection in the flying-scan mode.
3.4. 3D Model of the Great Wall Heritage Site
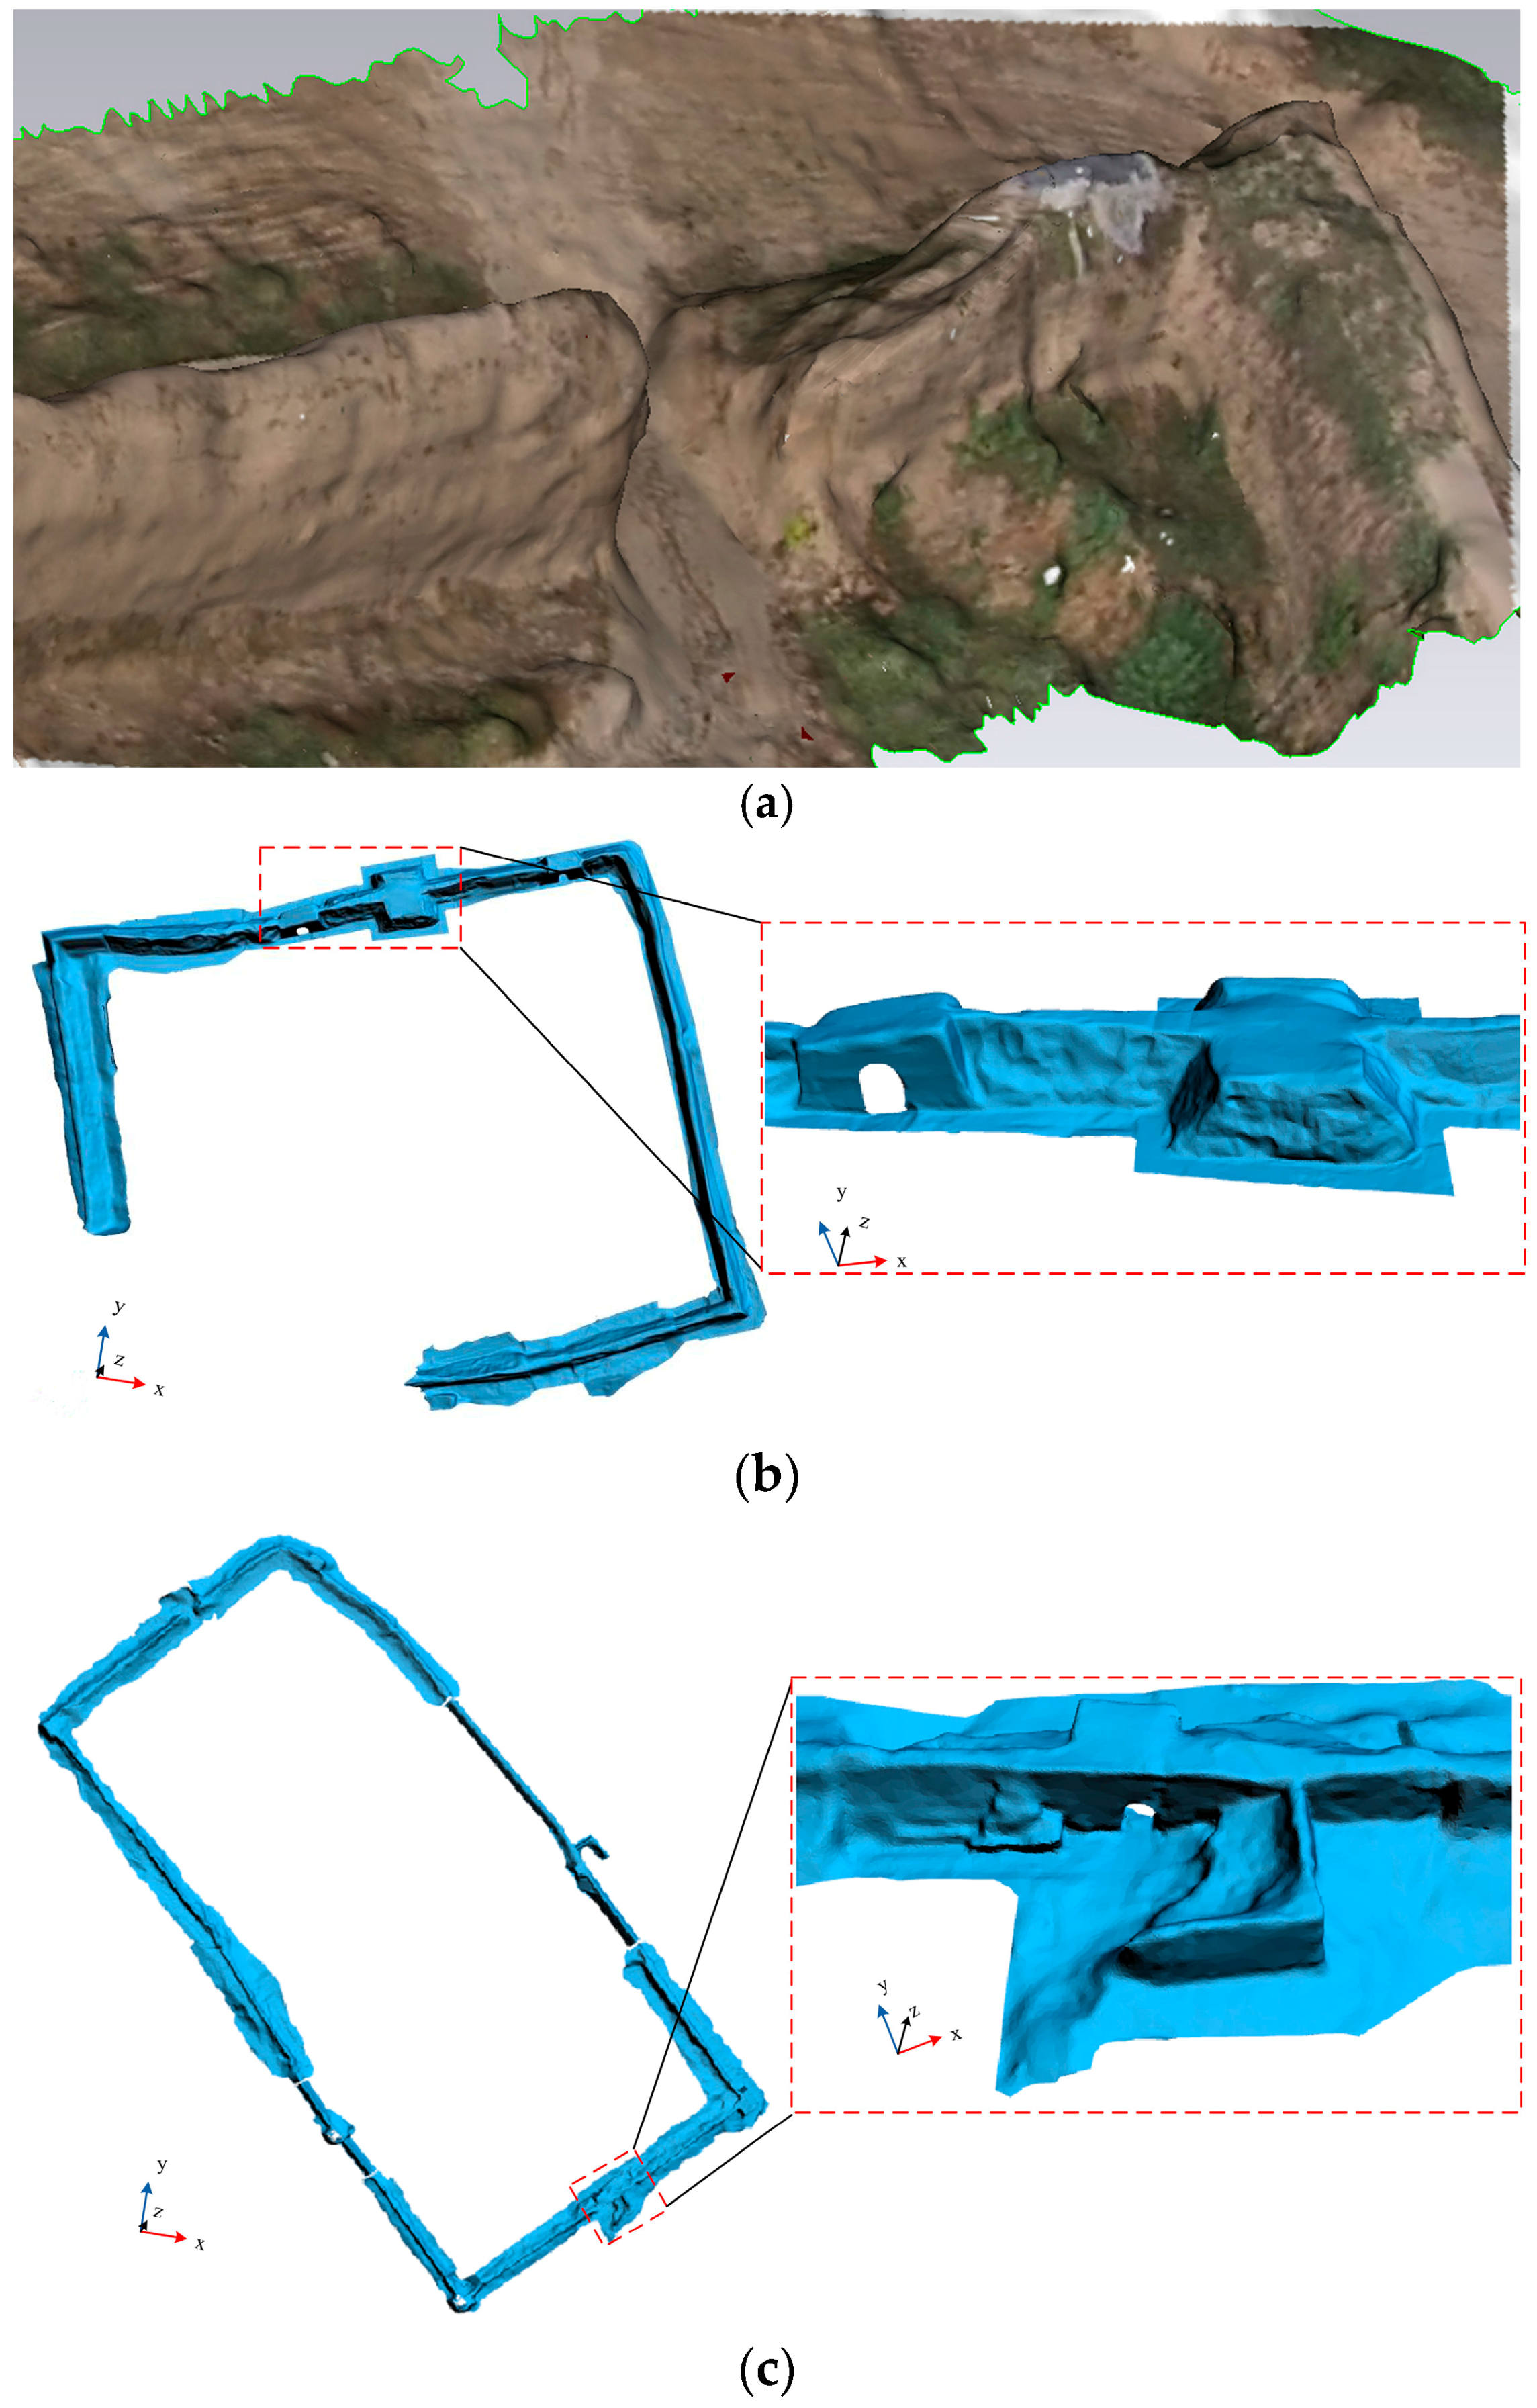
Combining the fly-hover-scan and flying-scan modes, a complete point cloud for the Great Wall can be obtained using the proposed hierarchical optimization framework (Section 2.2). Figure 12 shows examples of the 3D model for the Great Wall heritage site based on the optimized point cloud data. Figure 12a shows a typical single textured segment in Zhenbei Tai using the fly-hover-scan mode. There is a breach in the wall. This feature is of importance for visualization and investigation. That is also why it needs to adopt the fly-hover-scan mode to show more details.
Figure 12b,c demonstrate the 3D models of Zhenbei Tai and Jianan Bao where hybrid scan modes have been used. The recorded Zhenbei Tai has a total length of about 530 m while the Jianan Bao is more than 1060 m long. It should be noticed that some data for the Zhenbei Tai have not been collected, which belong to the complex tall tower. That is because it is beyond the detection of the onboard laser range finder. We are considering using a more advanced sensor in future work.
Figure 12d shows the 3D model of the severely broken Great Wall heritage site in Erlou Cun and Shiba Dun Cun. For Erlou Cun (left, Figure 12d), only one segment remains with a length of ~58 m and an average height of ~7 m. There are many large holes in the wall which were dug as shelters during wartime. For Shiba Dun Cun (right, Figure 12d), they have also been severely damaged and have become some isolated tall mounds with a height of over 10 m and a perimeter of over 40 m.
Some outliers in the point cloud have been removed by the MLS smoothing (the search radius is set to 15 cm for the MLS algorithm), while such surface smoothing could result in some loss of precision [29]. In addition, some idle ground points that apparently do not belong to the body of the Great Wall have been removed manually. The simplified results for the 3D models of the study areas are summarized in Table 3.
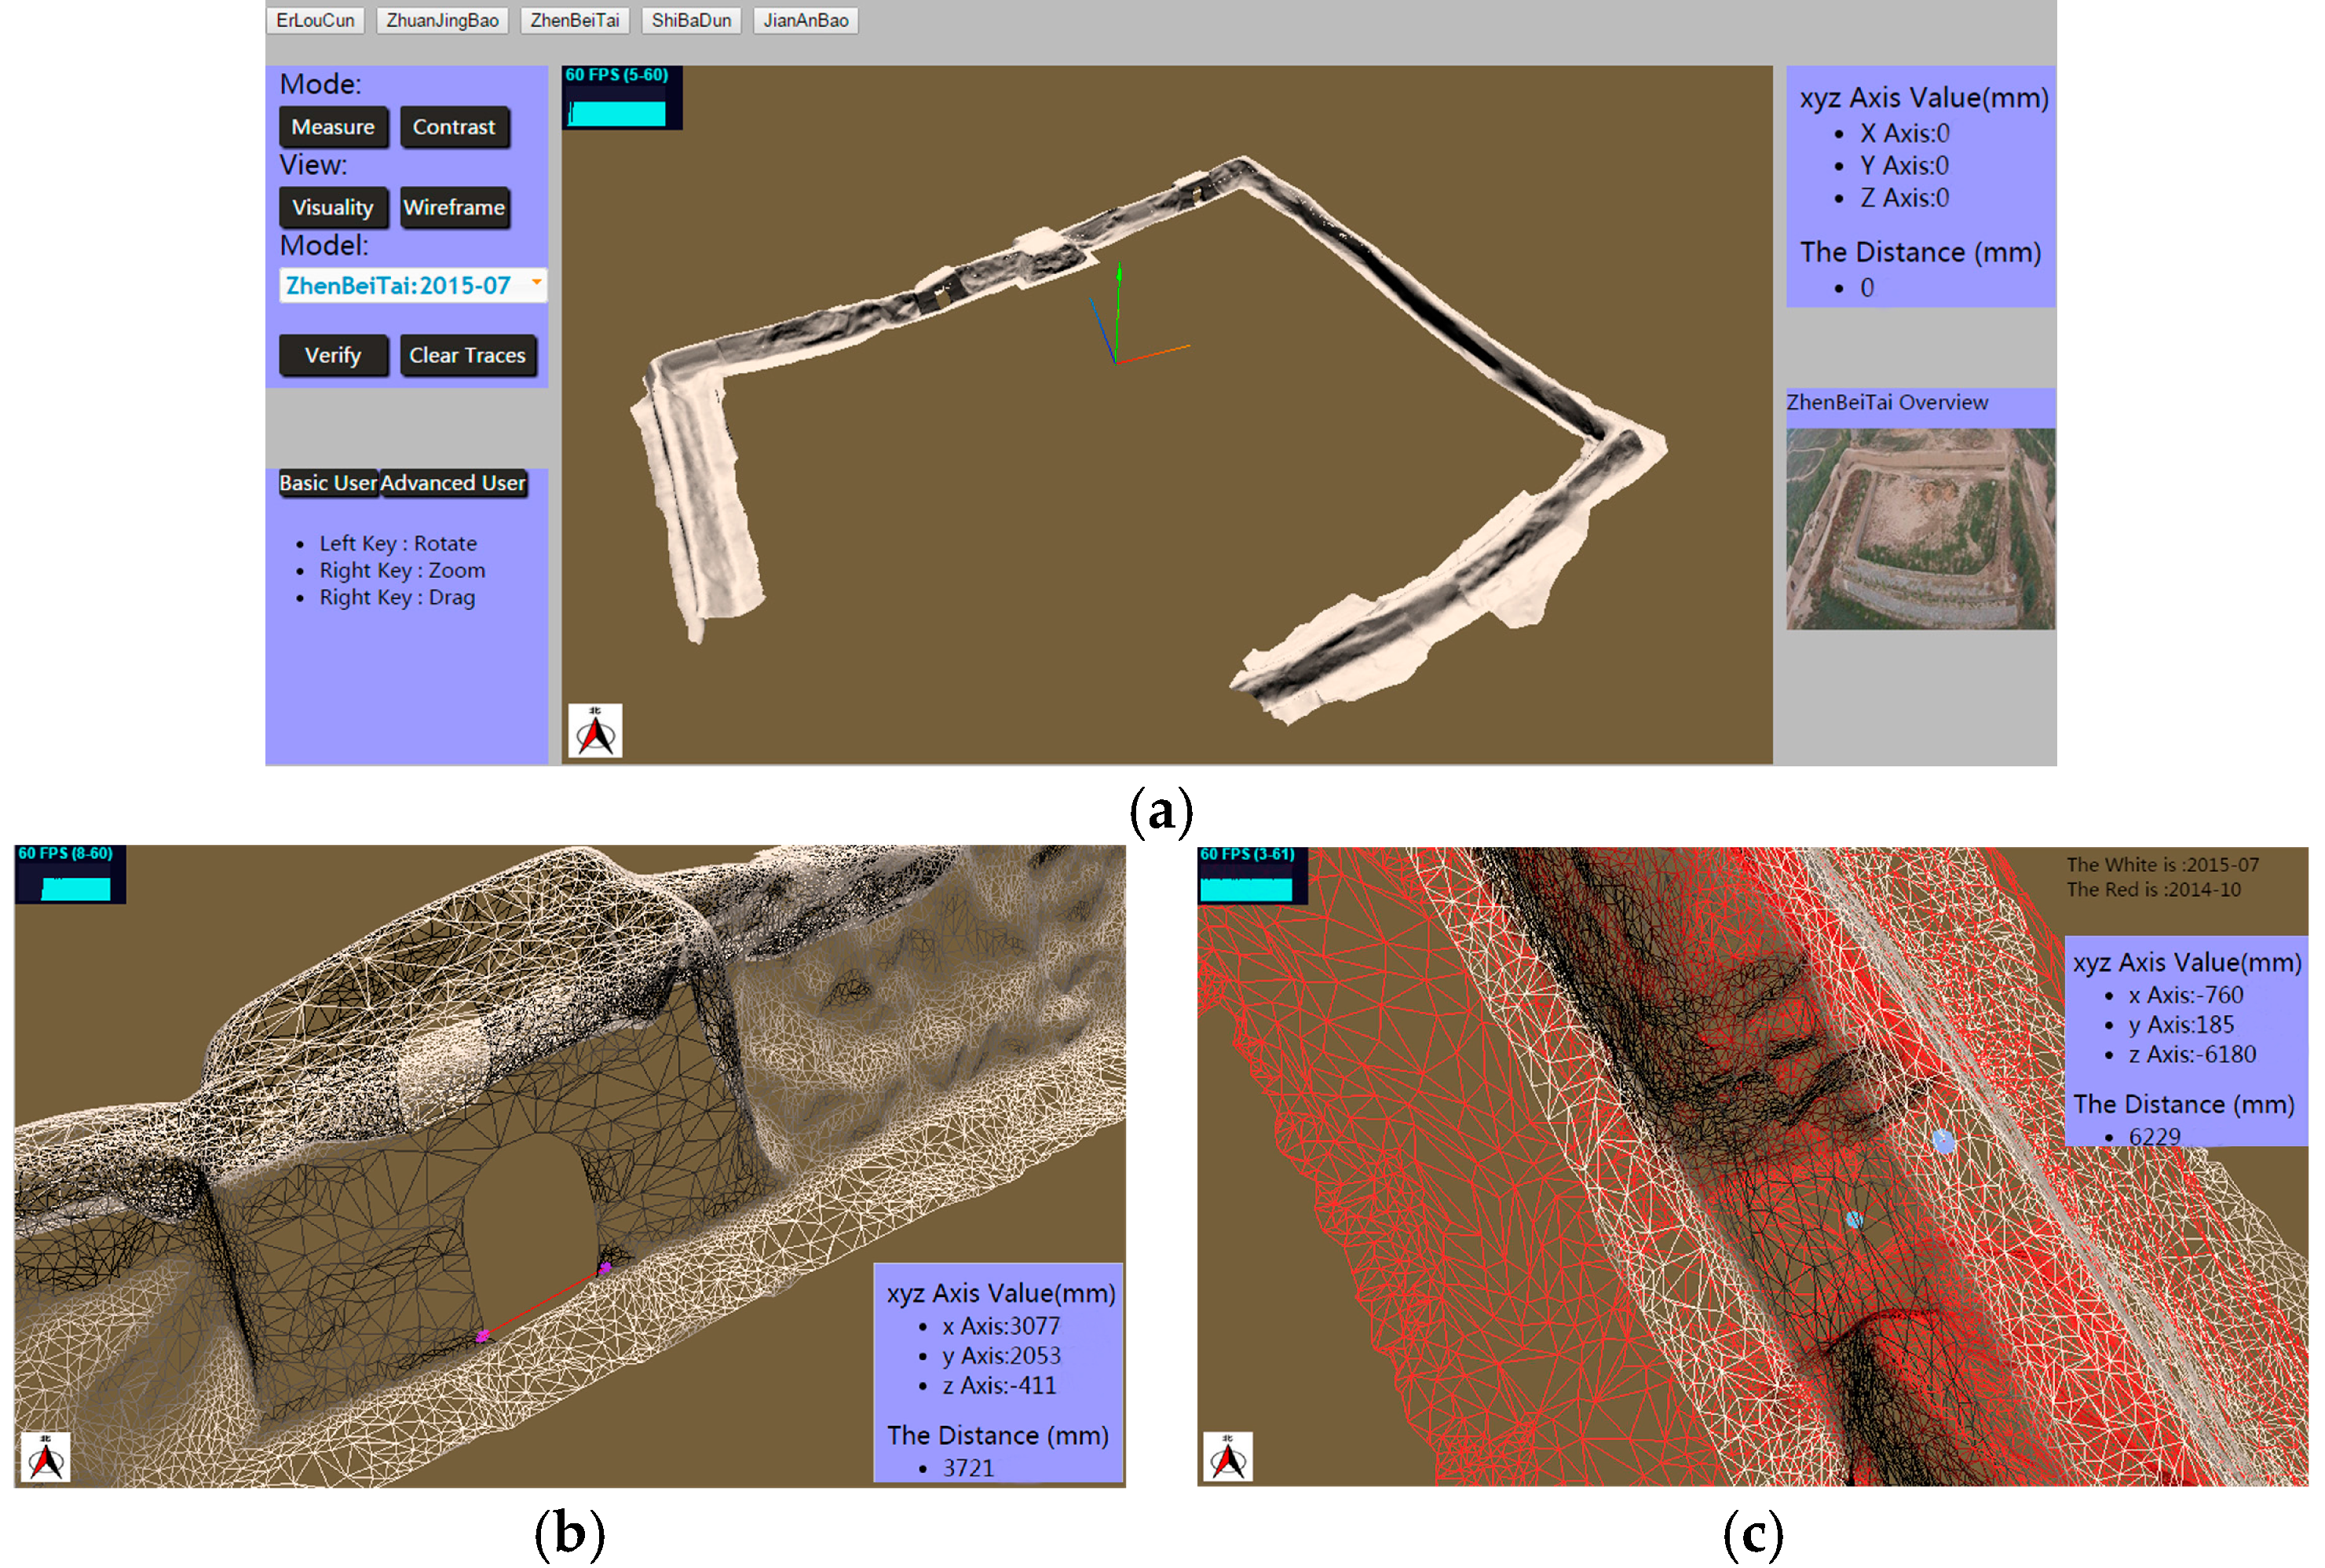
Figure 13a shows the interface for the 3D visualization of the Great Wall on a browser. The displayed model can be rotated, zoomed in/out, and dragged for a better view. A detailed area and an overview can be visualized simultaneously with or without texture mapping. Except for the 3D visualization, the distance between any two points of interest can be measured (e.g., Figure 13b, the gate width is about 3.7 m), which is very helpful for the archaeological investigation. Figure 13c shows that a previous breach in the wall has been mended and the height for the new wall is about 6.2 m.
4. Discussions
In the field of 3D modeling of cultural heritage sites, most previous studies [3,5,7,13] have utilized TLS instead of airborne laser scanning (ALS). Although ALS technology has shown its promising applicability in the large-scale environment and has been a focus of much research in the last two decades, the high-cost impedes its widespread use [30]. On the other hand, some large-scale heritage sites, e.g., the Great Wall, have suffered damage and have even disappeared without any recordings. Thus, a low-cost ALS system with a small-size UAV is proposed in this paper for the 3D digitization of the Great Wall.
One of the challenges is to handle the problem of UAV pose uncertainty which will result in mismatching among scanned point clouds. Few methods have been proposed due to the limits of onboard low-cost sensors. The structure from motion (SfM) technique was adopted to determine the orientation in reference [16]. However, this vision-based method relies on feature extraction and easily fails in featureless environments. Unlike previous methods, a hierarchical optimization framework is proposed in this work. Different optimization methodologies are applied to fly-hover-scan and flying-scan modes, respectively.
For the fly-hover-scan mode, the relative precision has been greatly improved by the proposed graph-based optimization even though low-cost sensors (GPS/IMU/altimeter) are used. The measured relative error is 0.26 ± 0.18 m less than that of normal GPS (Figure 8). It should be noted that the absolute precision could also be improved once the starting pose of the UAV is accurately measured by other methods, e.g., differential global navigation satellite system (GNSS). That is because the uncertainties of the other poses of the UAV can be further reduced with the graph optimization according to the accurate starting pose. Furthermore, the graph structure is independent of the number of scans and could be adapted to each situation. The graph with determined nodes/edges (number of hovering and number of constraints in Equations (7) and (8)) for one specific segment will be generated automatically once the scanning for the target segment is finished. It was found in our experiments that increasing the number of nodes/edges for one specific segment would not increase the optimization accuracy noticeably but at the cost of scanning efficiency, as long as around 20% overlap between two adjacent point clouds was guaranteed. Under this condition, the total number of nodes/edges for each segment falls in the range of 10–20, which is a good compromise between efficiency and accuracy.
For the flying-scan mode, left/right hierarchical optimization has demonstrated its effectiveness for the elimination of mismatching (Figure 11). It means that the effect of pose uncertainty on the final point clouds can be significantly lessened in this paper.
According to the archeologists’ demands, observable changes in the geometric structure (on the order of a few meters considering the large scale of the Great Wall) are of importance for visualizing and investigating the status of the Great Wall. These changes are usually larger than the absolute error of the GPS receiver, the spatial resolution, georeferencing error, and noise of the final 3D model in this work. Our preliminary results have been acceptable to the archeologists who were working with us (Figure 13). However, to detect any changes more accurately, a higher-precision model should be constructed in the future.
5. Conclusions
This paper proposes a hierarchical optimization framework for the 3D digitisation of the large-scale unstructured Great Wall heritage site using a small unmanned helicopter. A Fly-hover-scan mode and its corresponding optimization methodology have been proposed for the modeling those segments with more archaeological significance and where more details are needed. A fast Flying-scan mode and its corresponding optimization method are proposed for the modeling of those segments with less structural details. The 3D digitisation of the entire Great Wall could be efficiently implemented with the hybrid scan modes.
Furthermore, the proposed optimization methodology can be used to increase the accuracy of point cloud registration. It has been demonstrated that through the optimization strategies, the 3D digital surface model (DSM) of the large-scale unstructured Great Wall heritage site could be achieved using an UAV system with lightweight and low-cost sensors. It provides an alternative choice for constructing DSMs in an efficient and economical way.
Finally, a web-based interface for 3D visualization is also developed to provide assistance for inspection and interaction of this cultural heritage site. It could also be of great interest for the general public by providing access to the status of endangered cultural heritage sites.
However, the accuracy and resolution could be further improved to meet the requirements, especially for high-precision archeological mapping and scientific survey. In addition, the final photographic texture assignation is still a challenge due to the low-resolution sensor and the environmental complexity (e.g., occlusion and illumination variation). To this end, future work will focus on constructing more accurate 3D models of the Great Wall with high realistic texture and building a large public database for the Great Wall.
Acknowledgments
This research was supported by the National Science and Technology Ministry of China under Grant No. 2013BAK01B02 and partly supported by the National Natural Science Foundation of China under Grant No. 91648012.
Author Contributions
Fucheng Deng. proposed the algorithms, analyzed the data, and wrote the paper; Xiaorui Zhu conceived and designed the experiments, and partly wrote the paper; Xiaochun Li and Meng Li performed the experiments and contributed to the post-processing of the model construction.
Conflicts of Interest
The authors declare no conflict of interest. The founding sponsors had no role in the design of the study; in the collection, analyses, or interpretation of data; in the writing of the manuscript, and in the decision to publish the results.
References
- Wu, G.Q.; Yang, J.J.; Xu, P.; Cheng, X. Modern technologies used for the preservation of ancient Great Wall heritage. In Proceedings of the International Conference on Remote Technology for the Preservation of Great Wall, Beijing, China, 15 September 2014. (In Chinese). [Google Scholar]
- Chinese Academy of Cultural Heritage. Research on the Huge Heritage Preservation; Heritage Publisher: Beijing, China, 2016; p. 696. (In Chinese) [Google Scholar]
- Gomes, L.; Bellon, O.R.P.; Silva, L. 3D reconstruction methods for digital preservation of cultural heritage: A survey. Pattern Recognit. Lett. 2014, 50, 3–14. [Google Scholar] [CrossRef]
- Chiabrando, F.; Andria, F.D.; Sammartano, G.; Spano, A. 3D modeling from UAV data in Hierapolis of Phrigia (TK). In Proceedings of the International Congress on Archaeology, Computer Graphics, Cultural Heritage and Innovation Arqueológica 2.0, Valencia, Spain, 5–7 September 2016. [Google Scholar]
- Remondino, F. Heritage recording and 3D modeling with photogrammetry and 3D scanning. Remote Sens. 2011, 3, 1104–1138. [Google Scholar] [CrossRef]
- Remondino, F.; Rizzi, A. Reality-based 3D documentation of natural and cultural heritage sites-techniques, problems, and examples. Appl. Geomat. 2010, 2, 85–100. [Google Scholar] [CrossRef]
- Achille, C.; Adami, A.; Chiarini, S.; Cremonesi, S.; Fassi, F.; Fregonese, L.; Taffurelli, L. UAV-based photogrammetry and integrated technologies for architectural applications-methodological strategies for the after-quake survey of vertical structures in Mantua (Italy). Sensors 2015, 15, 15520–15539. [Google Scholar] [CrossRef] [PubMed]
- Xu, Z.H.; Wu, L.X.; Shen, Y.L.; Li, F.S.; Wang, Q.L.; Wang, R. Tridimensional reconstruction applied to cultural heritage with the use of camera-equipped UAV and terrestrial laser scanner. Remote Sens. 2014, 6, 10413–10434. [Google Scholar] [CrossRef]
- Al-Khedera, S.; Al-Shawabkeh, Y.; Haala, N. Developing a documentation system for desert palaces in Jordan using 3D laser scanning and digital photogrammetry. J. Archaeol. Sci. 2009, 36, 537–546. [Google Scholar] [CrossRef]
- Guidi, G.; Remondino, F.; Russo, M.; Menna, F.; Rizzi, A.; Ercoli, S. A multi-resolution methodology for the 3D modeling of large and complex archeological areas. Int. J. Architect. Comput. 2009, 7, 39–56. [Google Scholar] [CrossRef]
- El-Hakim, S.; Gonzo, L.; Voltolini, F.; Girardi, S.; Rizzi, A.; Remondino, F.; Whiting, E. Detailed 3D modeling of castles. Int. J. Architect. Comput. 2007, 5, 200–220. [Google Scholar] [CrossRef]
- El-Hakim, S.F.; Beraldin, J.A.; Picard, M.; Godin, G. Detailed 3D reconstruction of large scale heritage sites with integrated techniques. IEEE Comput. Graph. Appl. 2004, 24, 21–29. [Google Scholar] [CrossRef] [PubMed]
- Torres-Martinez, J.A.; Seddaiu, M.; Rodriguez-Gonzalvez, P.; Hernandez-Lopez, D.; Gonzalez-Aguilera, D. A multi-data source and multi-sensor approach for the 3D reconstruction and web visualization of a complex archaeological site: the case study of “Tolmo De Minateda”. Remote Sens. 2016, 8, 550. [Google Scholar] [CrossRef]
- Zlot, R.; Bosse, M.; Greenop, K.; Jarzab, Z.; Juckes, E. Efficiently capturing large, complex cultural heritage sites with a handheld mobile 3D laser mapping system. J. Cult. Herit. 2014, 15, 670–678. [Google Scholar] [CrossRef]
- Lin, Y.; Hyyppa, J.; Jaakkola, A. Mini-UAV-Borne LIDAR for fine-scale mapping. IEEE Geosci. Remote Sens. Lett. 2011, 8, 426–430. [Google Scholar] [CrossRef]
- Wallace, L.; Lucieer, A.; Watson, C.; Turner, D. Development of a UAV-LiDAR system with application to forest inventory. Remote Sens. 2012, 4, 1519–1543. [Google Scholar] [CrossRef]
- Wallace, L.; Lucieer, A.; Malenovsky, Z.; Turner, D.; Vopenka, P. Assessment of forest structure using two UAV techniques: A comparison of airborne laser scanning and structure from motion (SfM) point clouds. Forests 2016, 7, 62. [Google Scholar] [CrossRef]
- QNX. Available online: https://en.wikipedia.org/wiki/QNX (accessed on 10 March 2017).
- OpenPilot. Available online: https://en.wikipedia.org/wiki/OpenPilot (accessed on 10 March 2017).
- Scanning Range Laser. Available online: http://www.hokuyo-aut.jp/02sensor/07scanner/utm_30lx.html (accessed on 3 April 2017).
- Liu, J.Y.; Yun, T.; Zhou, Y.; Xue, L.F. Three-dimensional reconstruction of point cloud leaf based on the moving least square method. For. Mach. Woodwork. Equip. 2014, 42, 37–42. (In Chinese) [Google Scholar]
- Geomagic Studio. Available online: www.geomagic.com (accessed on 10 March 2017).
- WebGL. Available online: https://en.wikipedia.org/wiki/WebGL (accessed on 10 March 2017).
- Rehder, J.; Siegwart, R.; Furgale, P. A general approach to spatiotemporal calibration in multisensor systems. IEEE Trans. Robot. 2016, 32, 383–938. [Google Scholar] [CrossRef]
- Sasani, S.; Asgari, J.; Amiri-Simkooei, A.R. Improving MEMS-IMU/GPS integrated systems for land vehicle navigation applications. GPS Solut. 2016, 20, 89–100. [Google Scholar] [CrossRef]
- Besl, P.J.; Mckay, N.D. A method for registration of 3-D shapes. IEEE Trans. Pattern Anal. Mach. Intell. 1992, 14, 239–256. [Google Scholar] [CrossRef]
- Kummerle, R.; Grisetti, G.; Strasdat, H.; Konolige, K.; Burgard, W. G2o: A general Framework for Graph Optimization. In Proceedings of the IEEE International Conference on Robotics and Automation, Shanghai, China, 9–13 May 2011. [Google Scholar]
- Liu, Y.; Zhong, R.F. Buildings and Terrain of Urban Area Point Cloud Segmentation Based on PCL. In Proceedings of the 35th International Symposium on Remote Sensing of Environment, Beijing, China, 22–26 April 2013. [Google Scholar]
- Levin, D. Mesh-Independent Surface Interpolation. In Geometric Modeling for Scientific Visualization. Mathematics and Visualization; Brunnett, G., Hamann, B., Müller, H., Linsen, L., Eds.; Springer: Berlin, Germany, 2004. [Google Scholar]
- Balenovic, I.; Milas, A.S.; Marjanovic, H. A comparison of stand-level volume estimates from image-based canopy height models of different spatial resolutions. Remote Sens. 2017, 9, 205. [Google Scholar] [CrossRef]
Figure 1.
Hardware platform for the data acquisition.

Figure 2.
Different scan modes for two typical Great Wall segments (Zhenbei Tai, Yulin, Shannxi Province, China) (a) fly-hover-scan mode; (b) flying-scan mode.
Figure 2.
Different scan modes for two typical Great Wall segments (Zhenbei Tai, Yulin, Shannxi Province, China) (a) fly-hover-scan mode; (b) flying-scan mode.

Figure 3.
Hierarchical optimization framework.

Figure 4.
Coordinate system transformations for the small unmanned helicopter with a lightweight laser scanning system.
Figure 4.
Coordinate system transformations for the small unmanned helicopter with a lightweight laser scanning system.

Figure 5.
Topology of the graph optimization for one segment.

Figure 6.
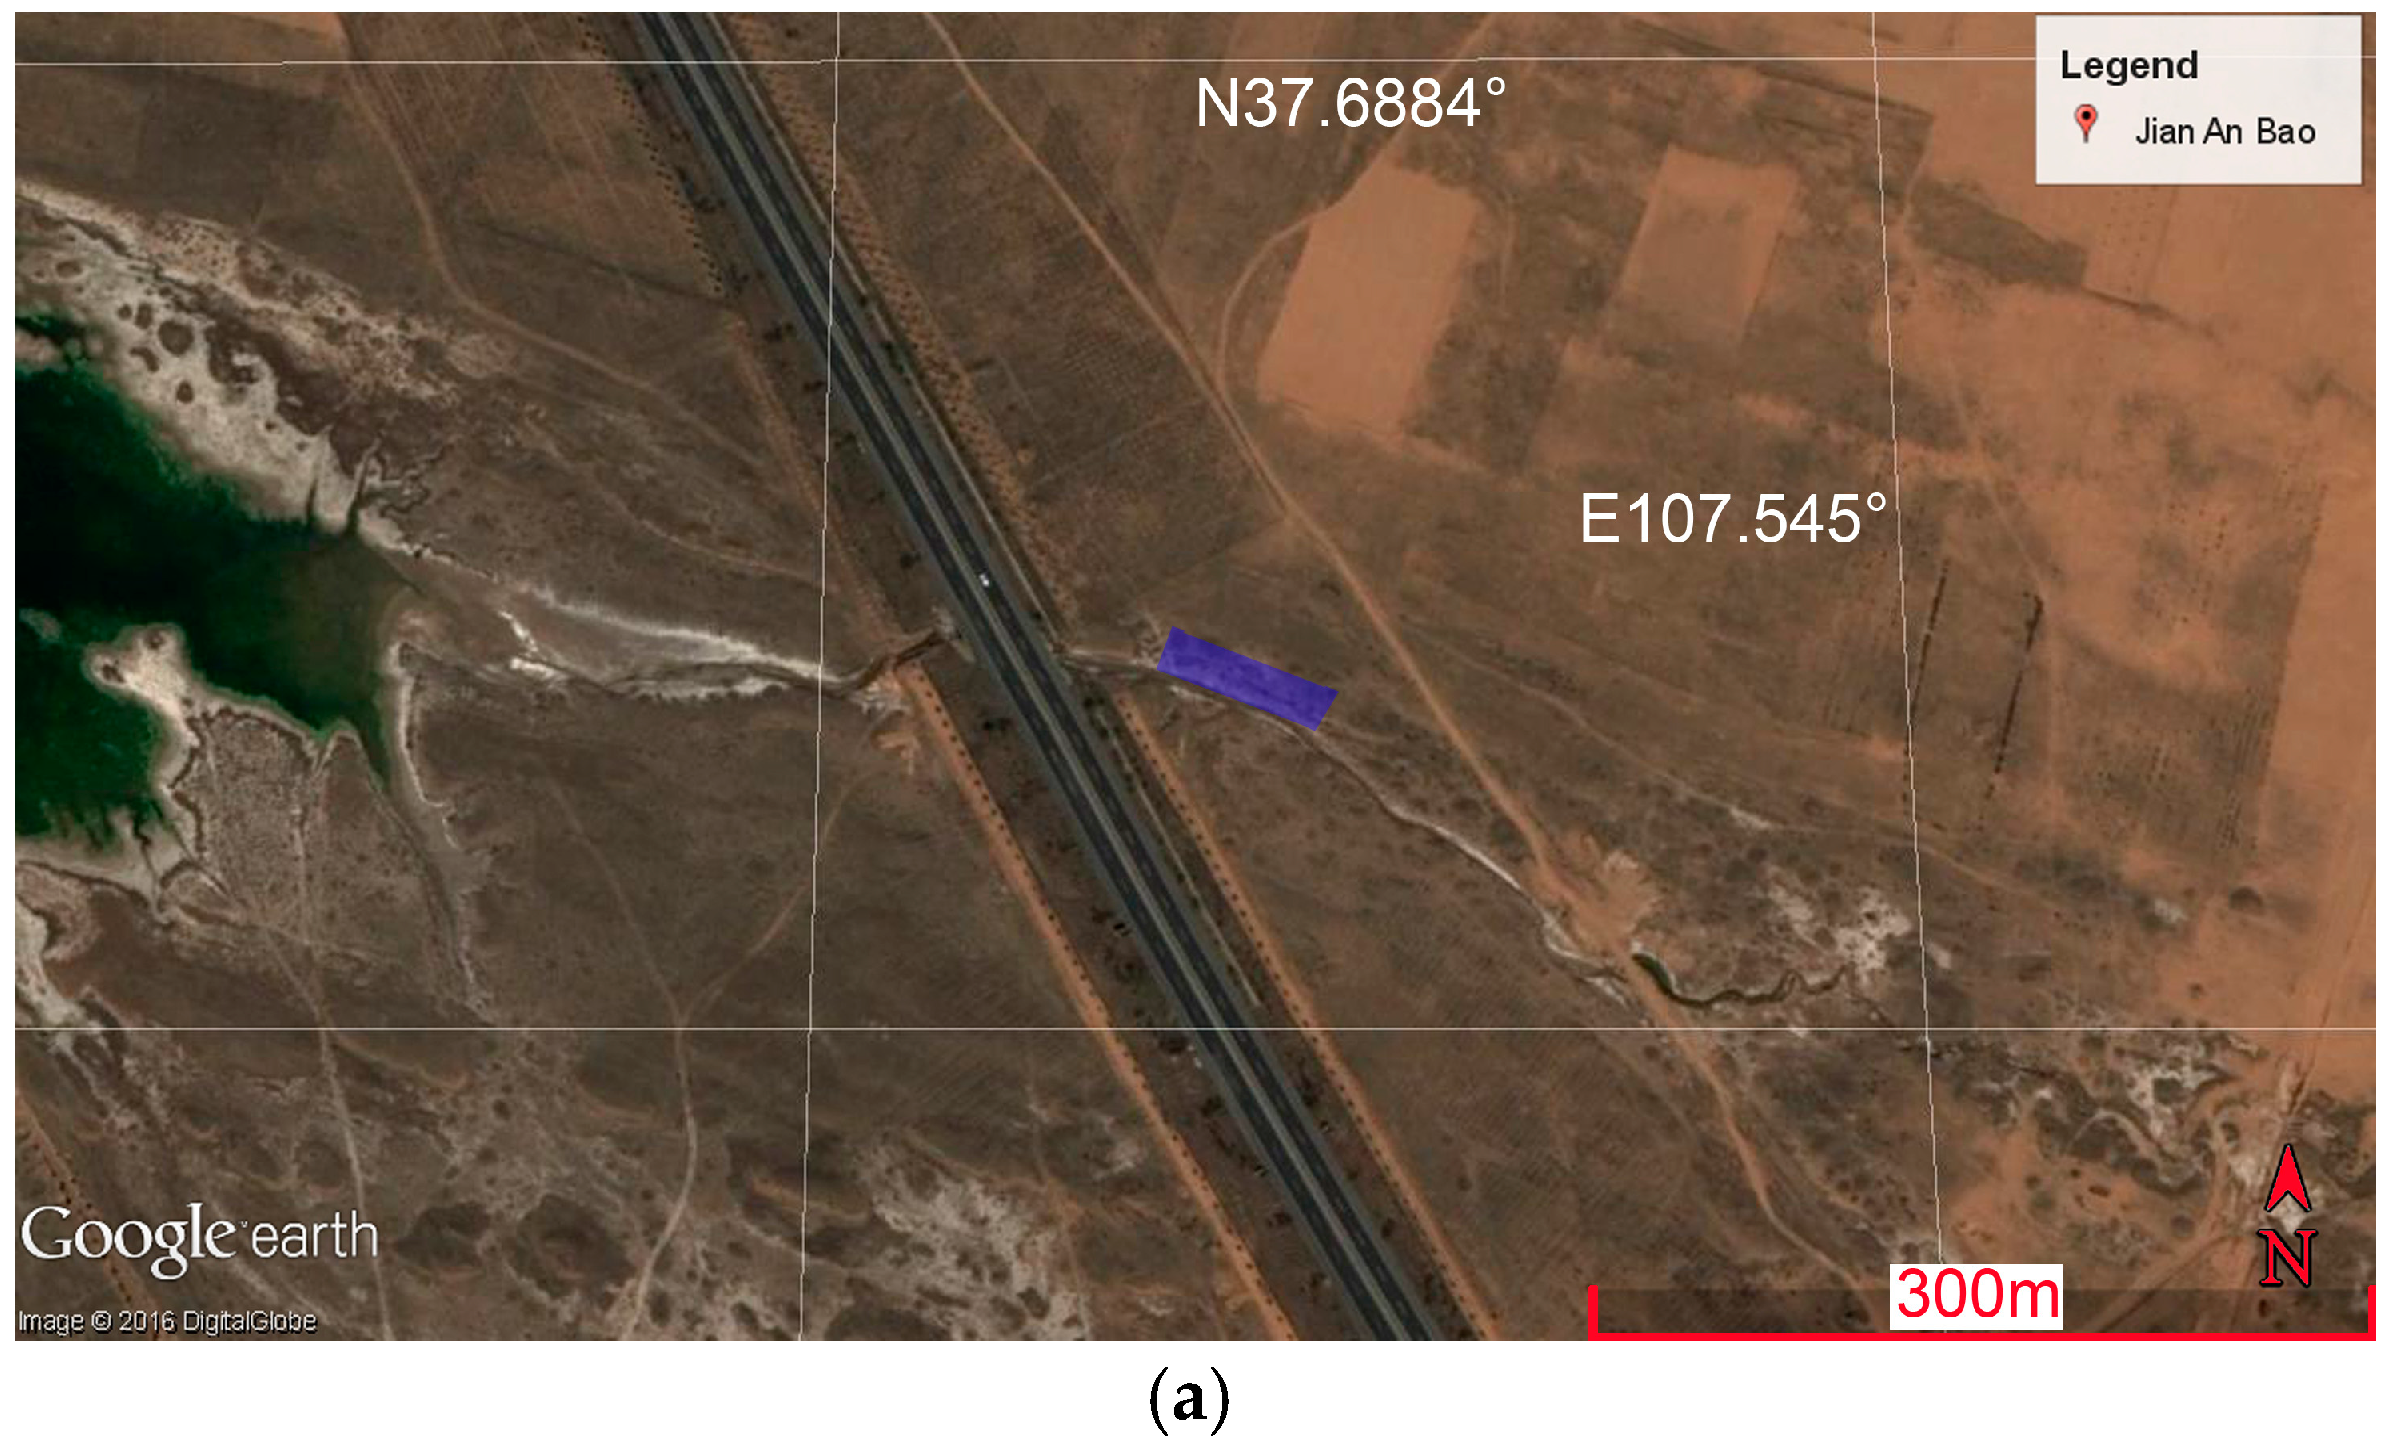
Maps of the study areas (a) Zhenbei Tai (31 January 2016, photos from Google Earth), the scanned area is in light blue and is about 3180 m2; (b) Jianan Bao (21 March 2014, photos from Google Earth), the scanned area is in light blue and is about 5330 m2.
Figure 6.
Maps of the study areas (a) Zhenbei Tai (31 January 2016, photos from Google Earth), the scanned area is in light blue and is about 3180 m2; (b) Jianan Bao (21 March 2014, photos from Google Earth), the scanned area is in light blue and is about 5330 m2.

Figure 7.
Maps of the study areas (a) Erlou Cun (22 April 2012, photos from Google Earth), the scanned area is in light blue and is about 348 m2; (b) Shiba Dun Cun (12 February 2015, photos from Google Earth), the scanned area is in light blue and is about 225 m2.
Figure 7.
Maps of the study areas (a) Erlou Cun (22 April 2012, photos from Google Earth), the scanned area is in light blue and is about 348 m2; (b) Shiba Dun Cun (12 February 2015, photos from Google Earth), the scanned area is in light blue and is about 225 m2.

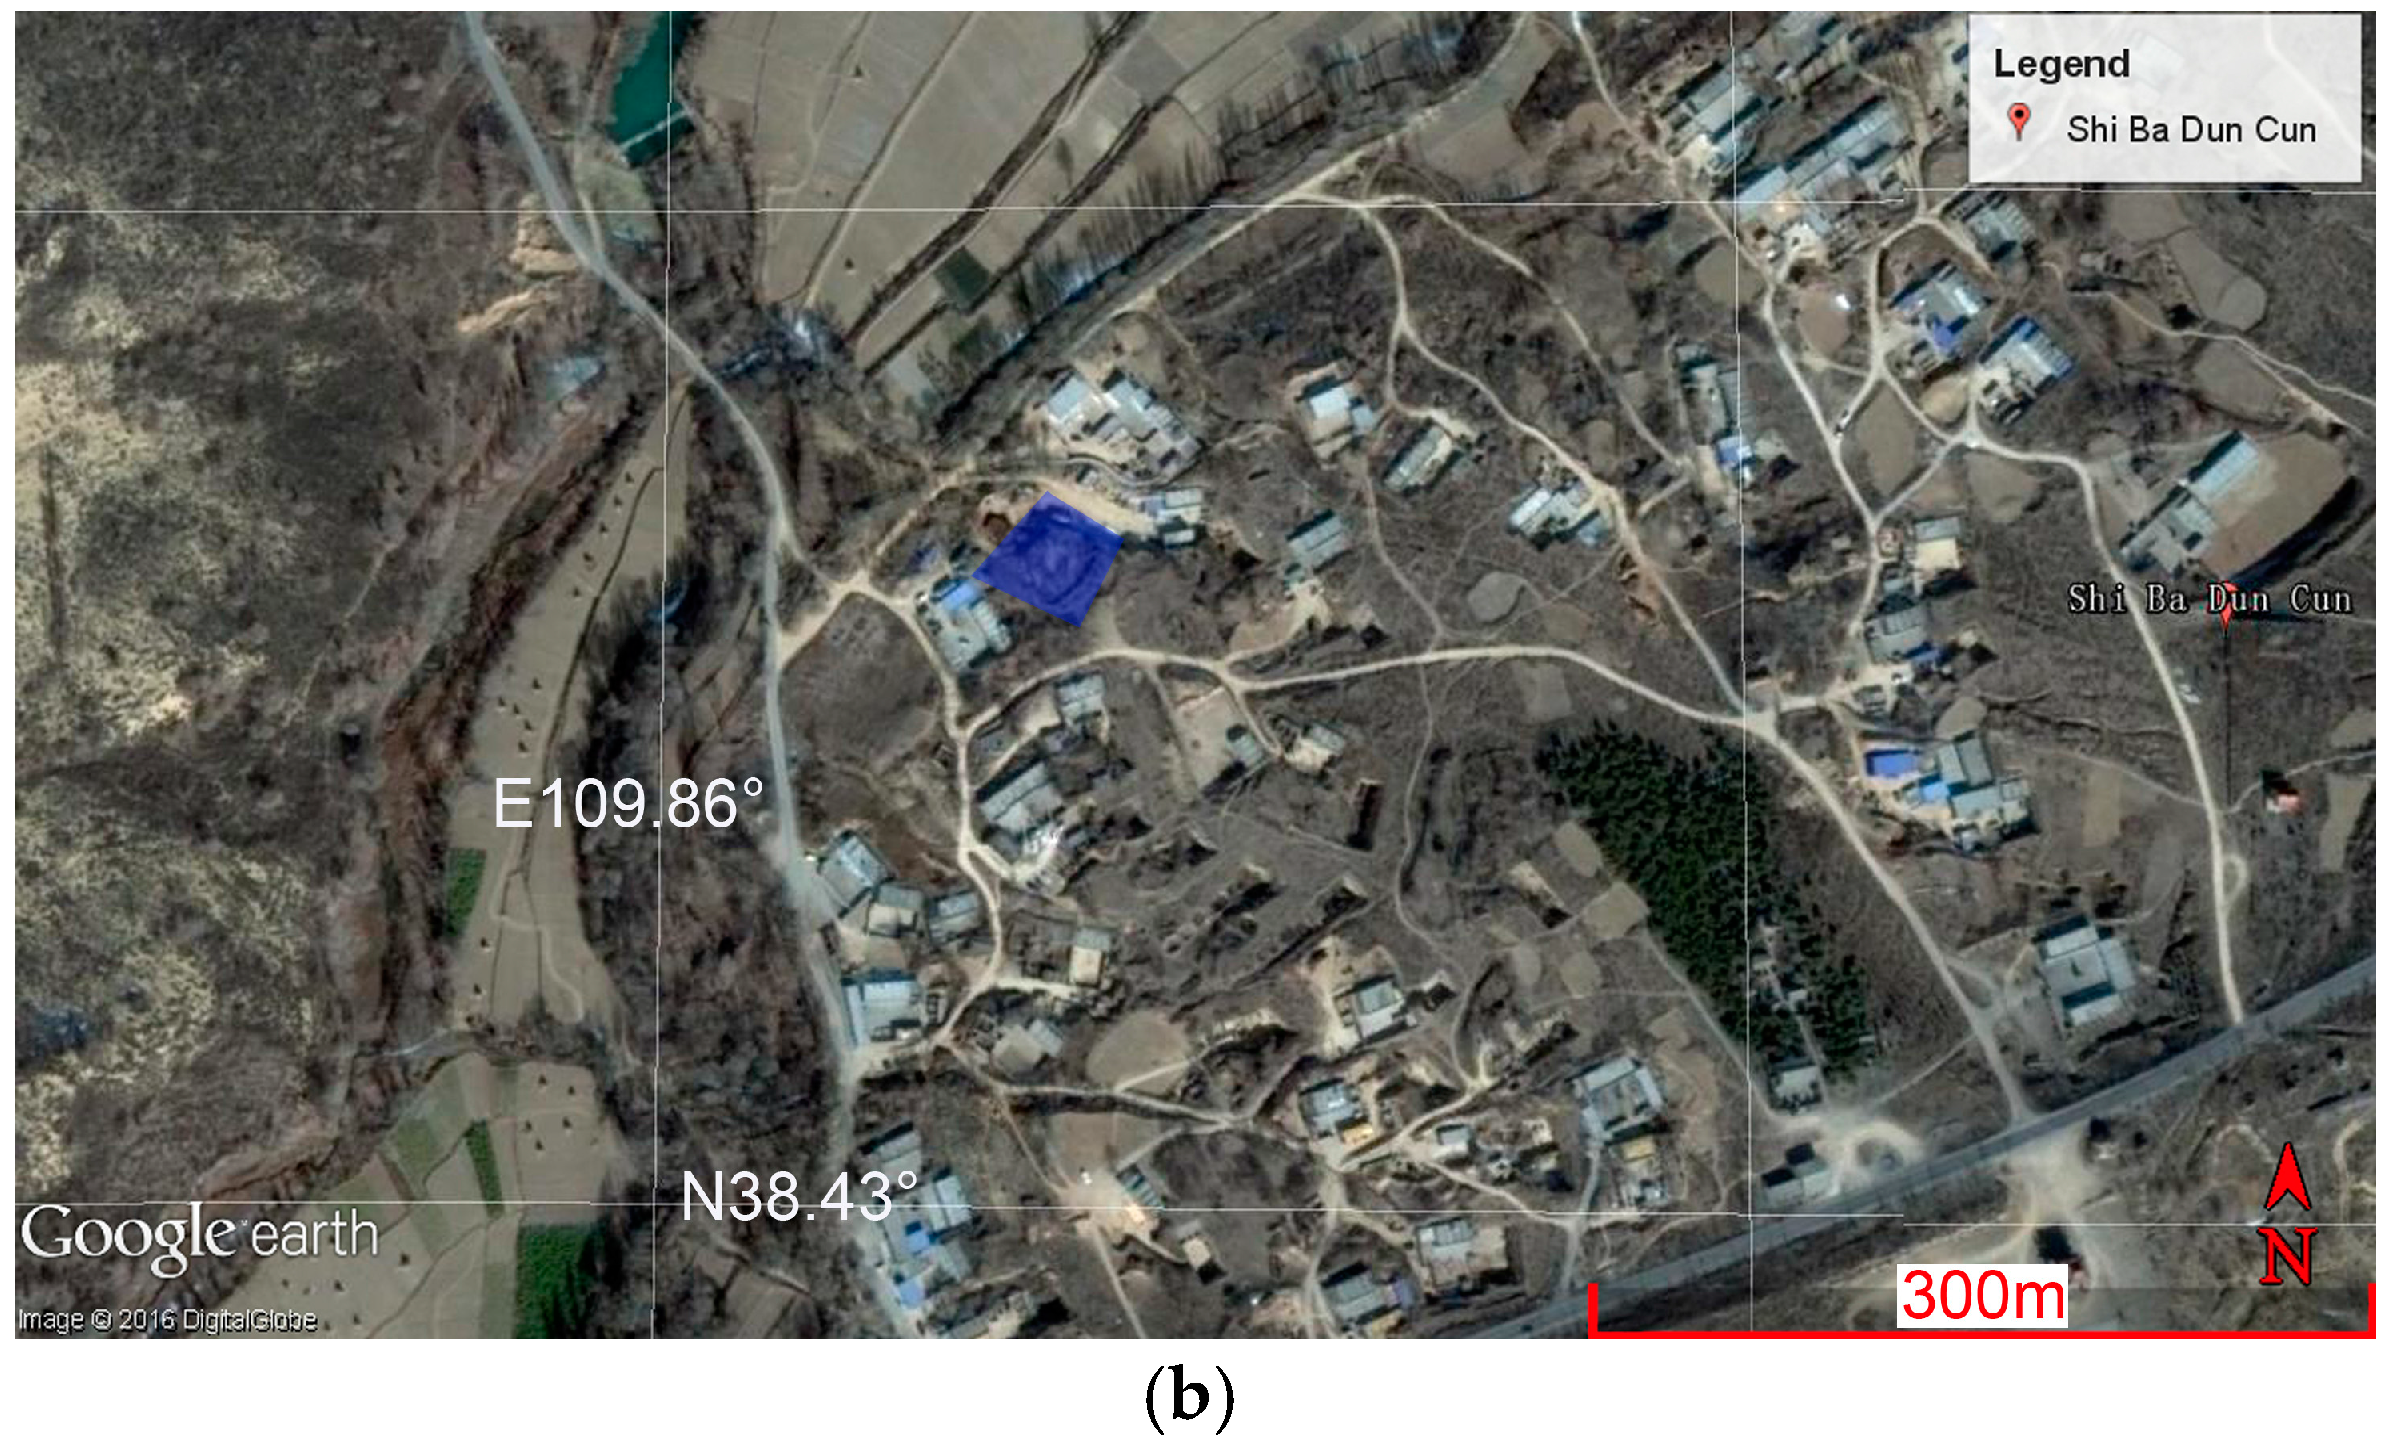
Figure 8.
Pose estimation for the unmanned helicopter during one typical fly-hover-scan (the helicopter took off and landed at the same point).
Figure 8.
Pose estimation for the unmanned helicopter during one typical fly-hover-scan (the helicopter took off and landed at the same point).
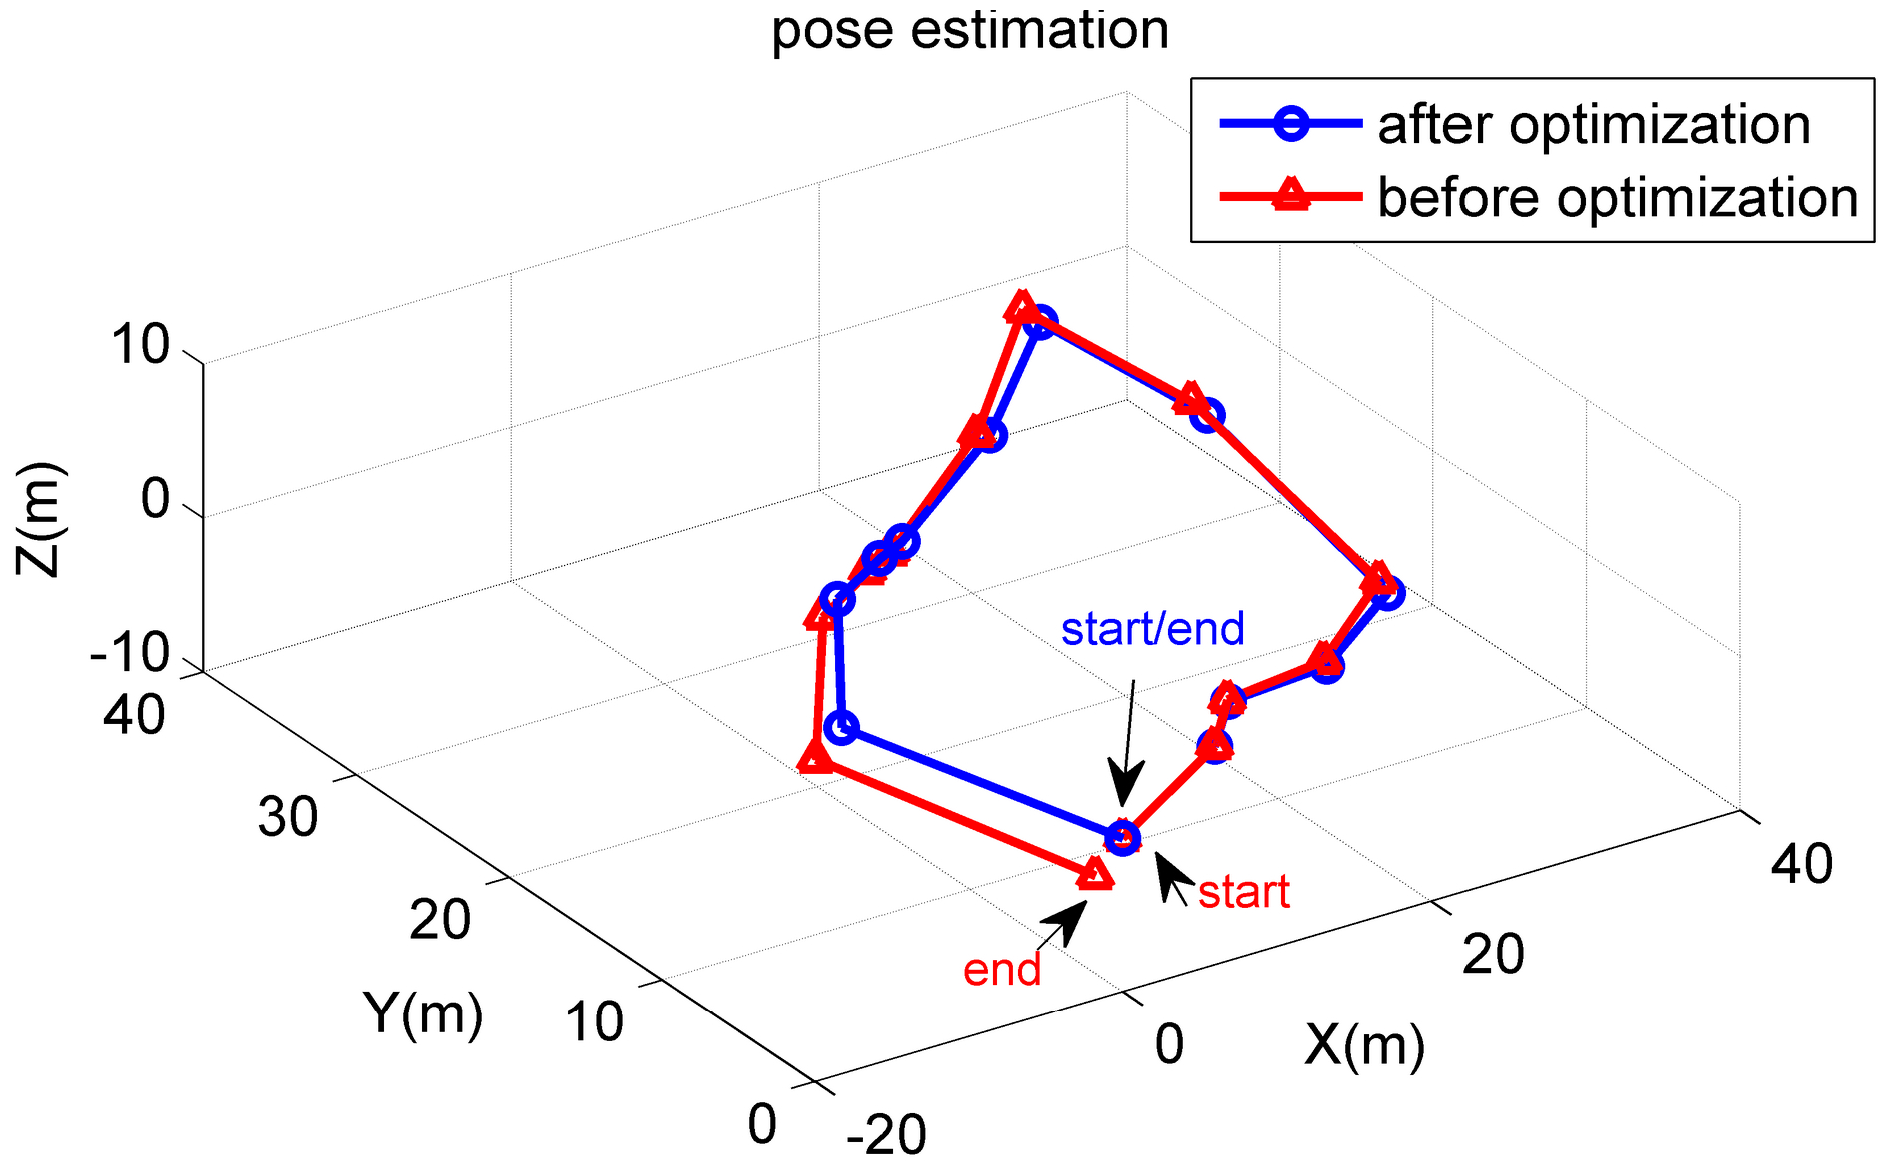
Figure 9.
Comparison between different point clouds modeling for a typical Great Wall segment (the upper image is the point cloud, red: with iterative closest point (ICP), blue: with ICP plus graph optimization).
Figure 9.
Comparison between different point clouds modeling for a typical Great Wall segment (the upper image is the point cloud, red: with iterative closest point (ICP), blue: with ICP plus graph optimization).
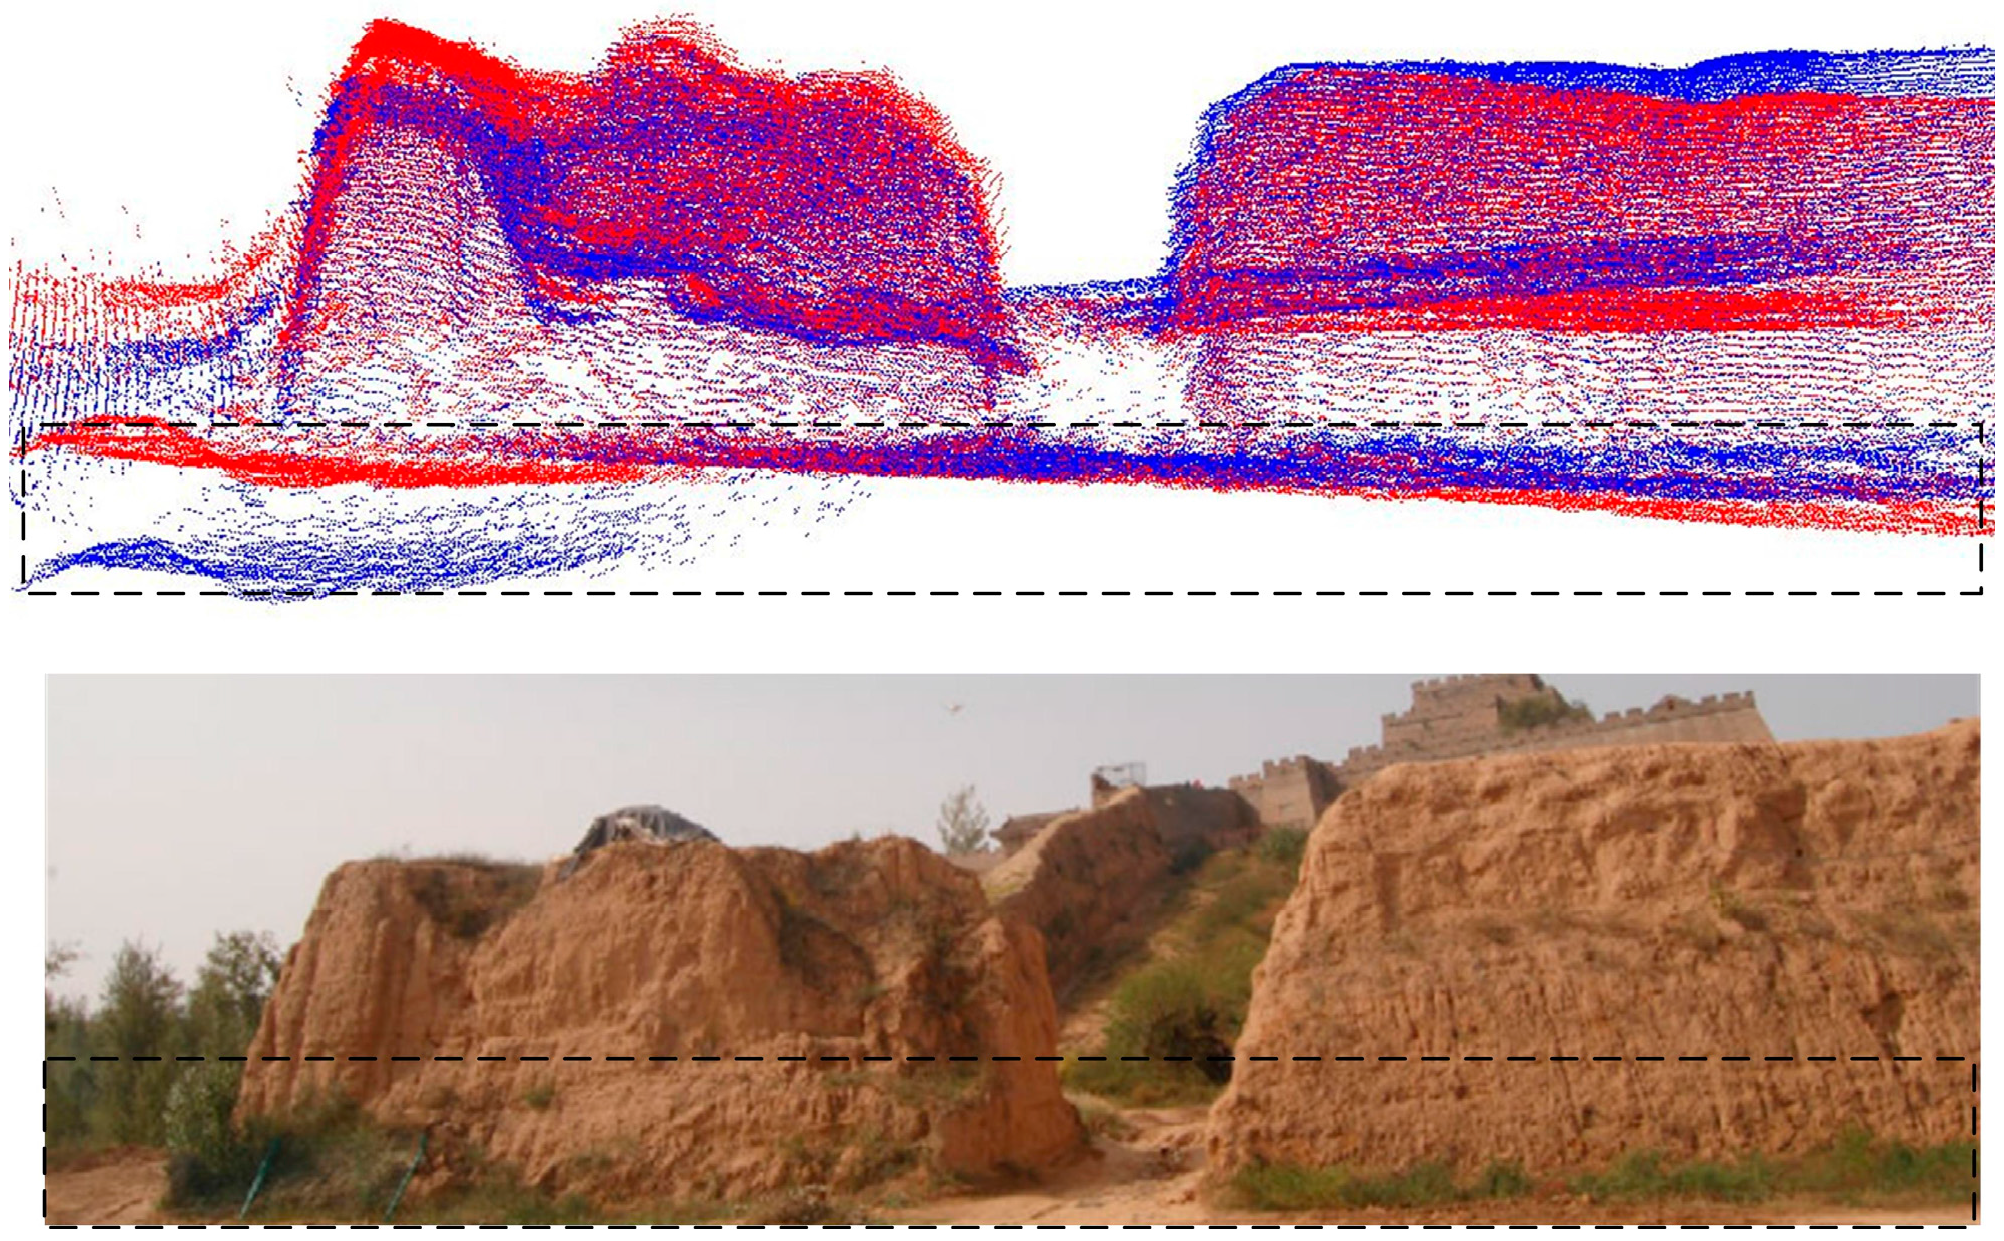
Figure 10.
Deflection phenomenon caused by the helicopter position inaccuracy in flying-scan mode, (a) lateral view of one wall segment with two point clouds; (b) position measurement during the flying-scan.
Figure 10.
Deflection phenomenon caused by the helicopter position inaccuracy in flying-scan mode, (a) lateral view of one wall segment with two point clouds; (b) position measurement during the flying-scan.
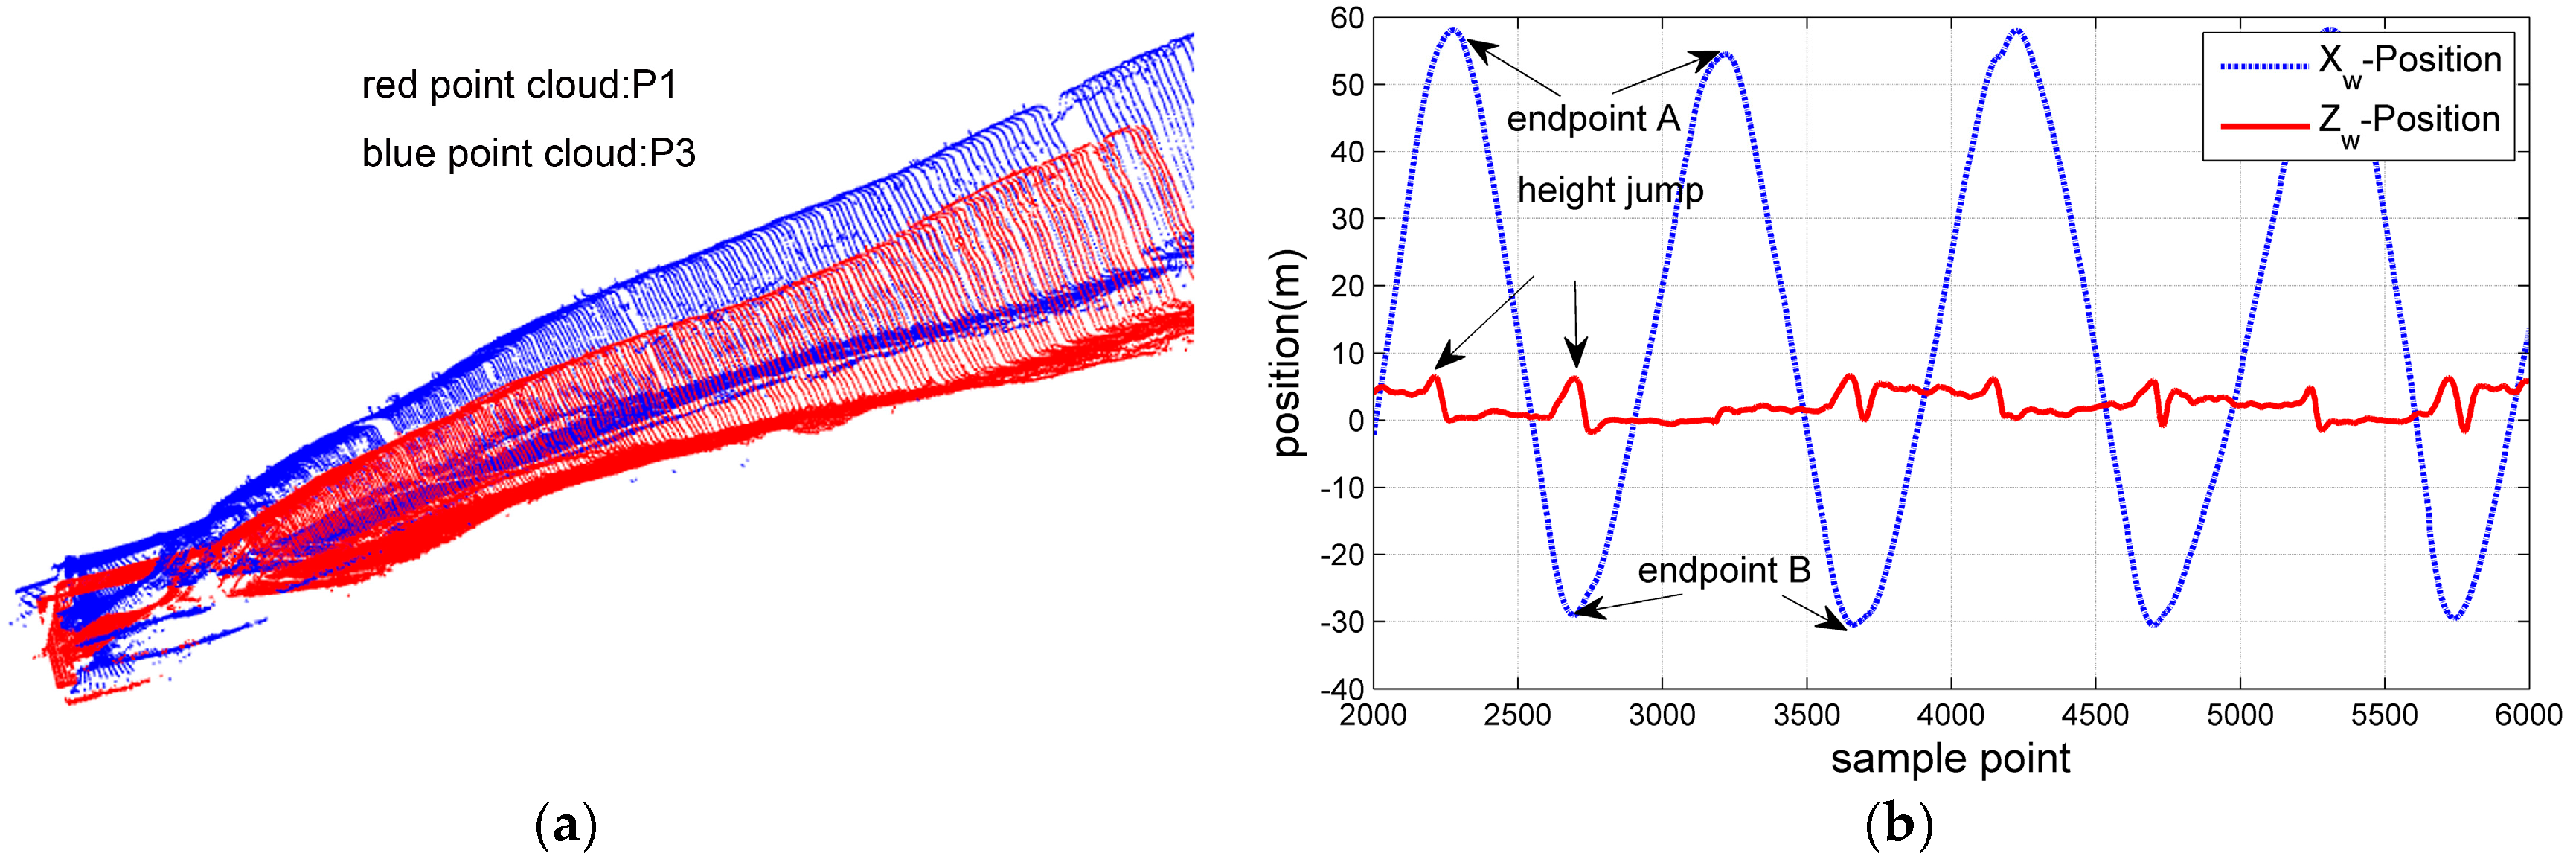
Figure 11.
Optimization in flying-scan mode for a typical wall segment, (a) lateral view of one wall segment with two point clouds (left: before optimization; right: after); (b) vertical view (left: before optimization; right: after).
Figure 11.
Optimization in flying-scan mode for a typical wall segment, (a) lateral view of one wall segment with two point clouds (left: before optimization; right: after); (b) vertical view (left: before optimization; right: after).
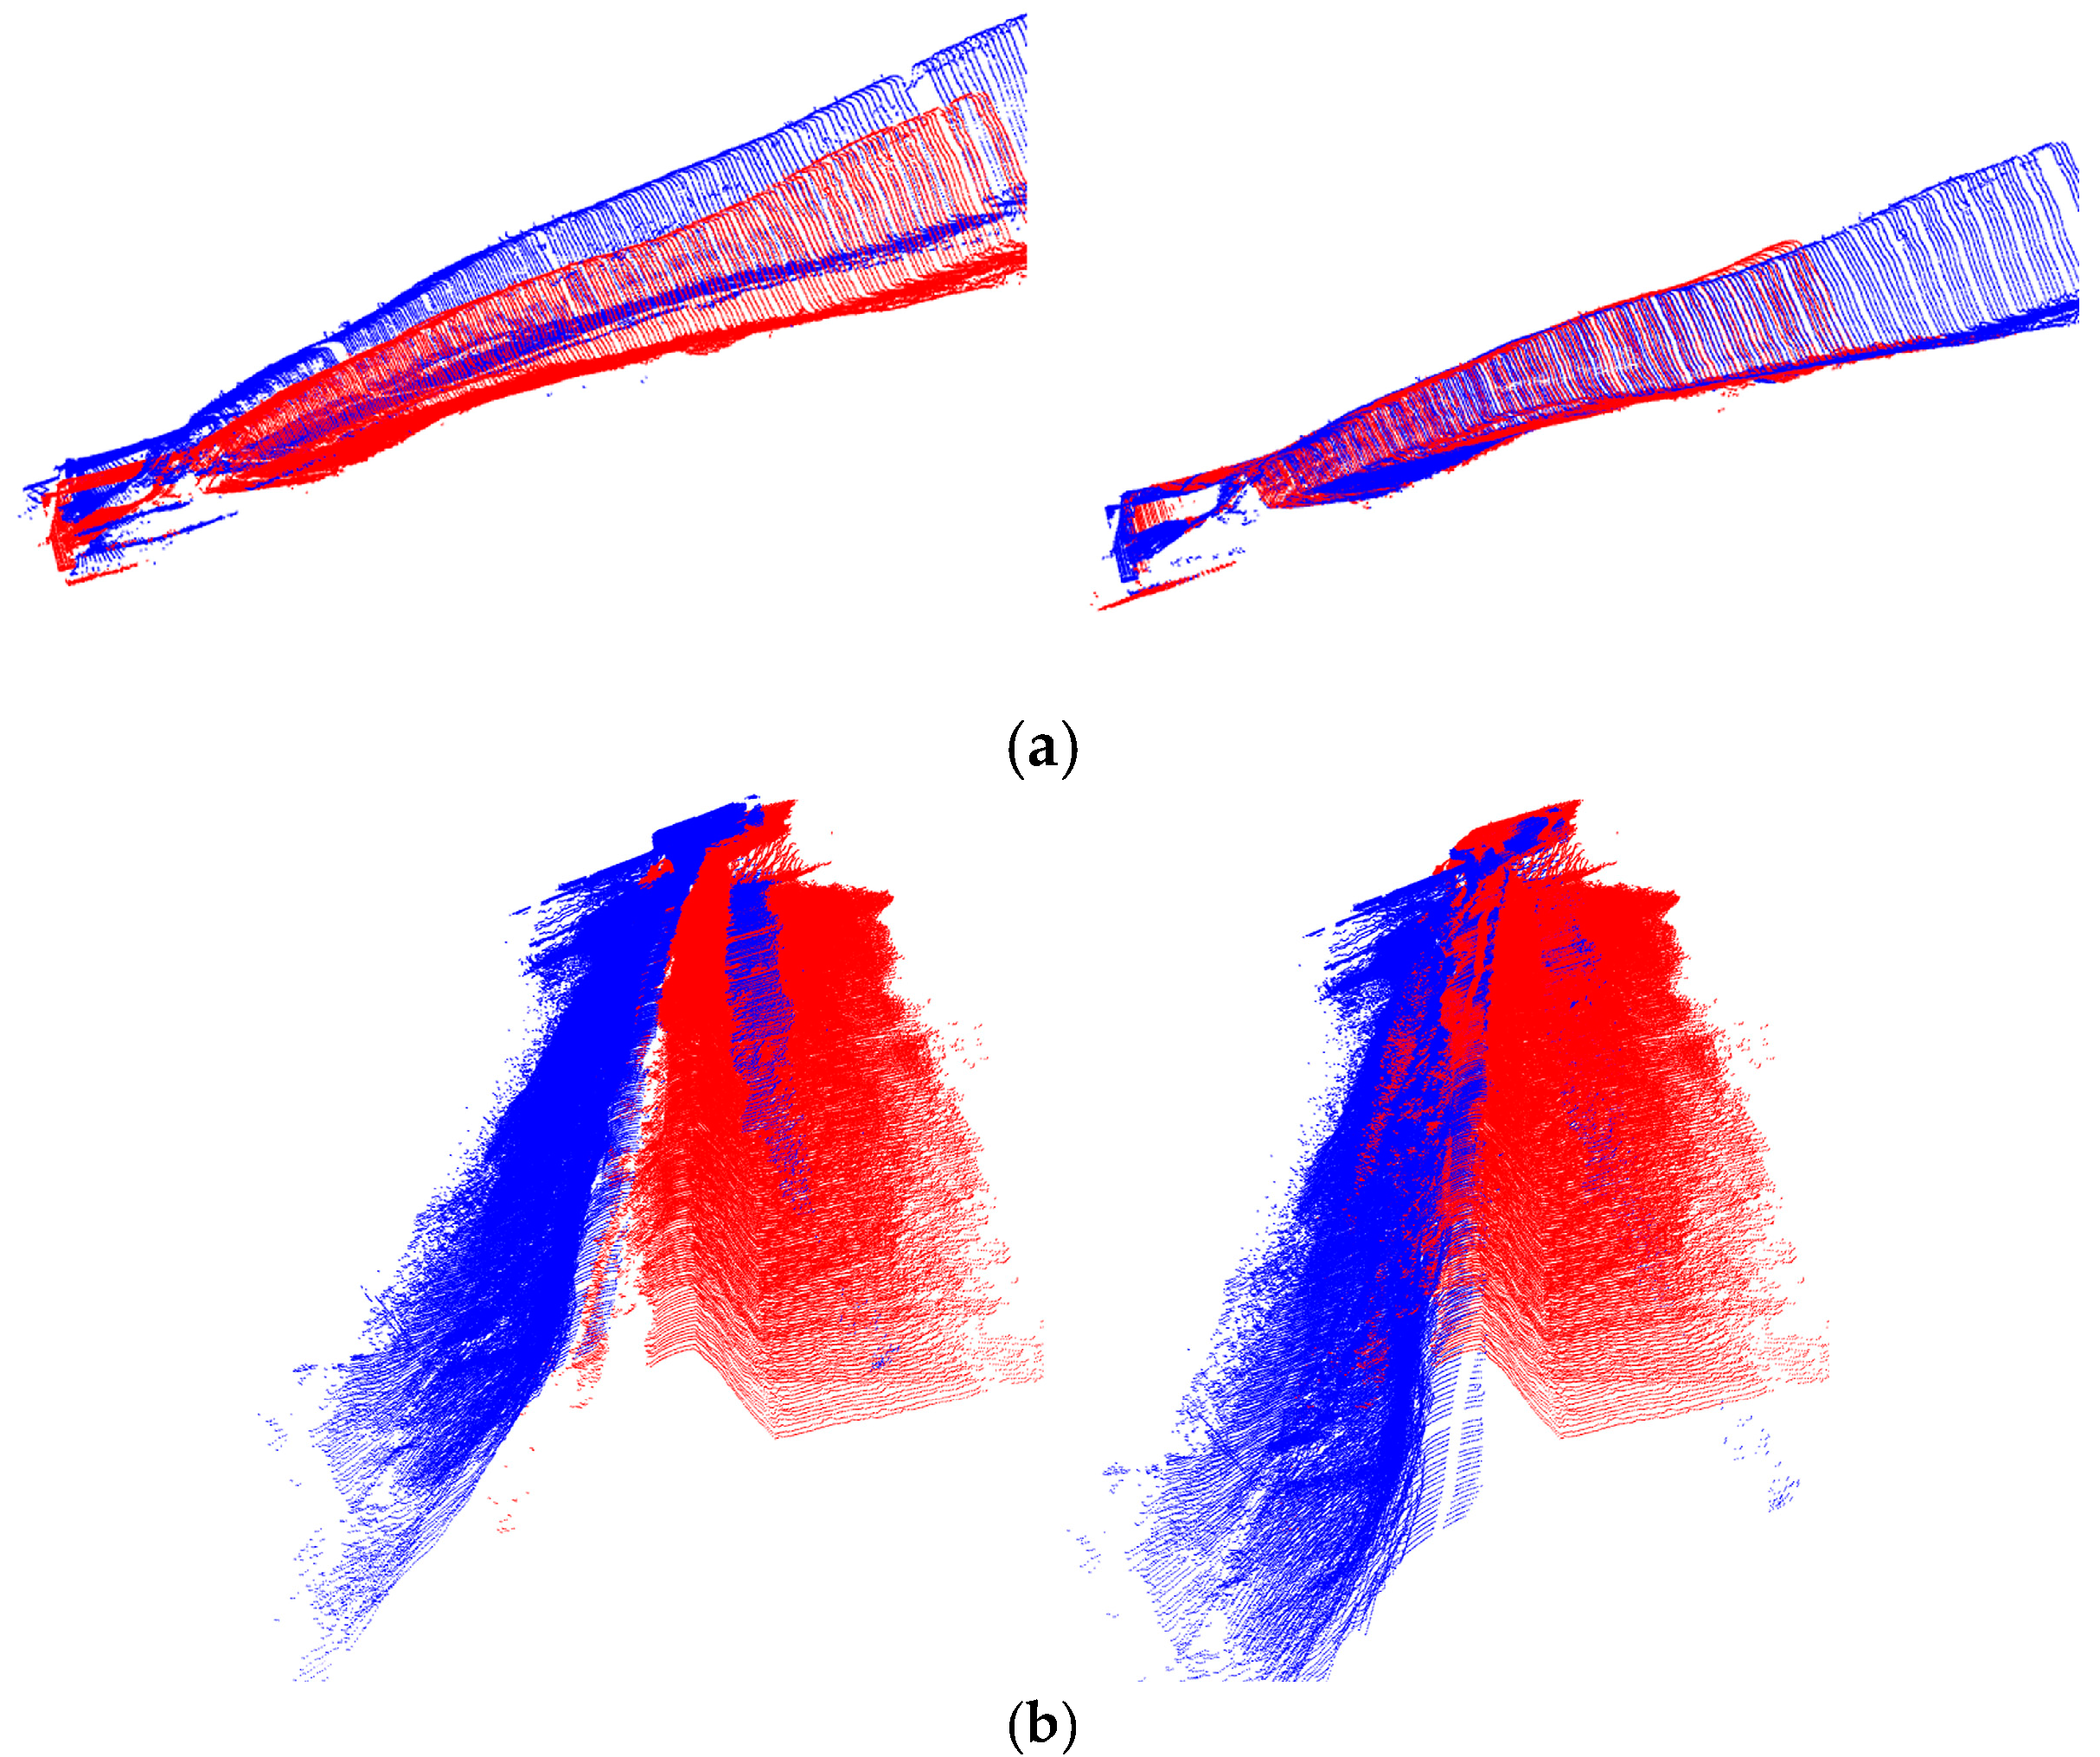
Figure 12.
3D models of the Great Wall heritage site in typical areas, (a) a single textured segment in Zhenbei Tai with a breach (total length ~32 m); (b) Zhenbei Tai without texture for a better view of the geometric structure (total length ~530 m); (c) Jianan Bao (total length ~1066 m); (d) left: Erlou Cun (total length ~58 m), right: Shiba Dun Cun (height ~12 m).

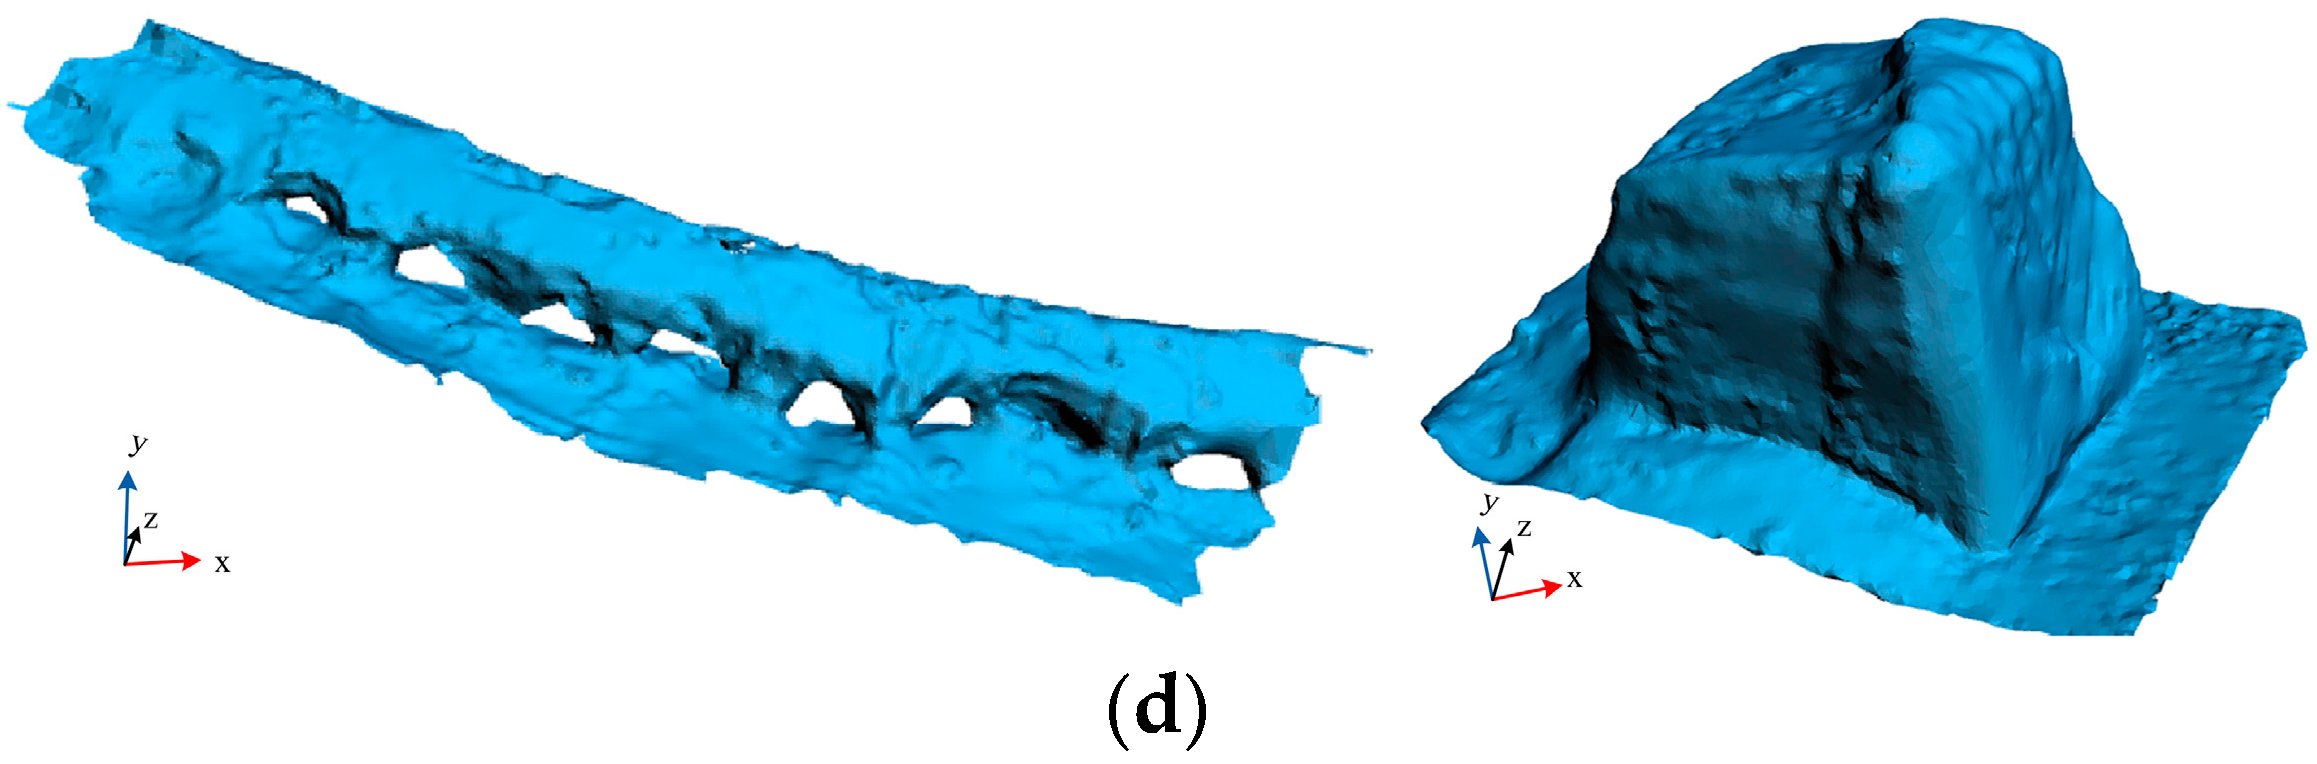
Figure 13.
3D model of Great Wall displayed on a web browser, (a) interface for the 3D visualization on the web; (b) distance measurement between two points of interest on the Zhenbei Tai (for a better view, the model is shown in grid mode); (c) comparison between two models of Zhenbei Tai built at different time periods (white for July 2015, red for October 2014).

Table 1.
Specifications of the laser scanner UTM-30LX [20].
Table 1.
Specifications of the laser scanner UTM-30LX [20].
| Parameter | Value |
|---|---|
| Detection range | Max range 0.1–30 m, 270° |
| Accuracy | 0.1–10 m: 30 mm; 10–30 m: 50 mm |
| Angular resolution | 0.25° (360°/1440) |
| Scan speed | 25 ms/scan |
| Weight | 370 g |
Table 2.
Specifications of the positioning and orientation sensors.
| Sensors | Performance |
|---|---|
| Global positioning system (GPS) receiver | Horizontal position accuracy 5 m |
| Barometric altimeter | Resolution: 10 cm; Accuracy: ±1.5 mbar |
| Innertial measurement unit (IMU) | Gyroscopes: bias stability 0.007 °/s |
| Accelerometers: bias stability 0.2 mg | |
| Digital compass | Heading: accuracy 1 deg, resolution 0.1 deg |
| Pitch and Roll: accuracy 0.7 deg, resolution 0.1 deg |
Table 3.
Simplification for the 3D models of the study areas.
| Zhenbei Tai | Jianan Bao | Erlou Cun | Shiba Dun Cun | |
|---|---|---|---|---|
| Number of points | 442,863 | 870,909 | 35,165 | 25,777 |
| Number of triangles | 885,726 | 1,623,443 | 68,338 | 50,516 |
| Spatial resolution (average) | 20.2 cm | 22.4 cm | 23.3 cm | 21.6 cm |
© 2017 by the authors. Licensee MDPI, Basel, Switzerland. This article is an open access article distributed under the terms and conditions of the Creative Commons Attribution (CC BY) license (http://creativecommons.org/licenses/by/4.0/).
Share and Cite
MDPI and ACS Style
Deng, F.; Zhu, X.; Li, X.; Li, M. 3D Digitisation of Large-Scale Unstructured Great Wall Heritage Sites by a Small Unmanned Helicopter. Remote Sens. 2017, 9, 423. https://doi.org/10.3390/rs9050423
AMA Style
Deng F, Zhu X, Li X, Li M. 3D Digitisation of Large-Scale Unstructured Great Wall Heritage Sites by a Small Unmanned Helicopter. Remote Sensing. 2017; 9(5):423. https://doi.org/10.3390/rs9050423
Chicago/Turabian StyleDeng, Fucheng, Xiaorui Zhu, Xiaochun Li, and Meng Li. 2017. "3D Digitisation of Large-Scale Unstructured Great Wall Heritage Sites by a Small Unmanned Helicopter" Remote Sensing 9, no. 5: 423. https://doi.org/10.3390/rs9050423
Note that from the first issue of 2016, this journal uses article numbers instead of page numbers. See further details here.