
Observational Quantification of Climatic and Human Influences on Vegetation Greening in China

 , , ,
, , ,
Abstract
:
1. Introduction
2. Materials and Methods
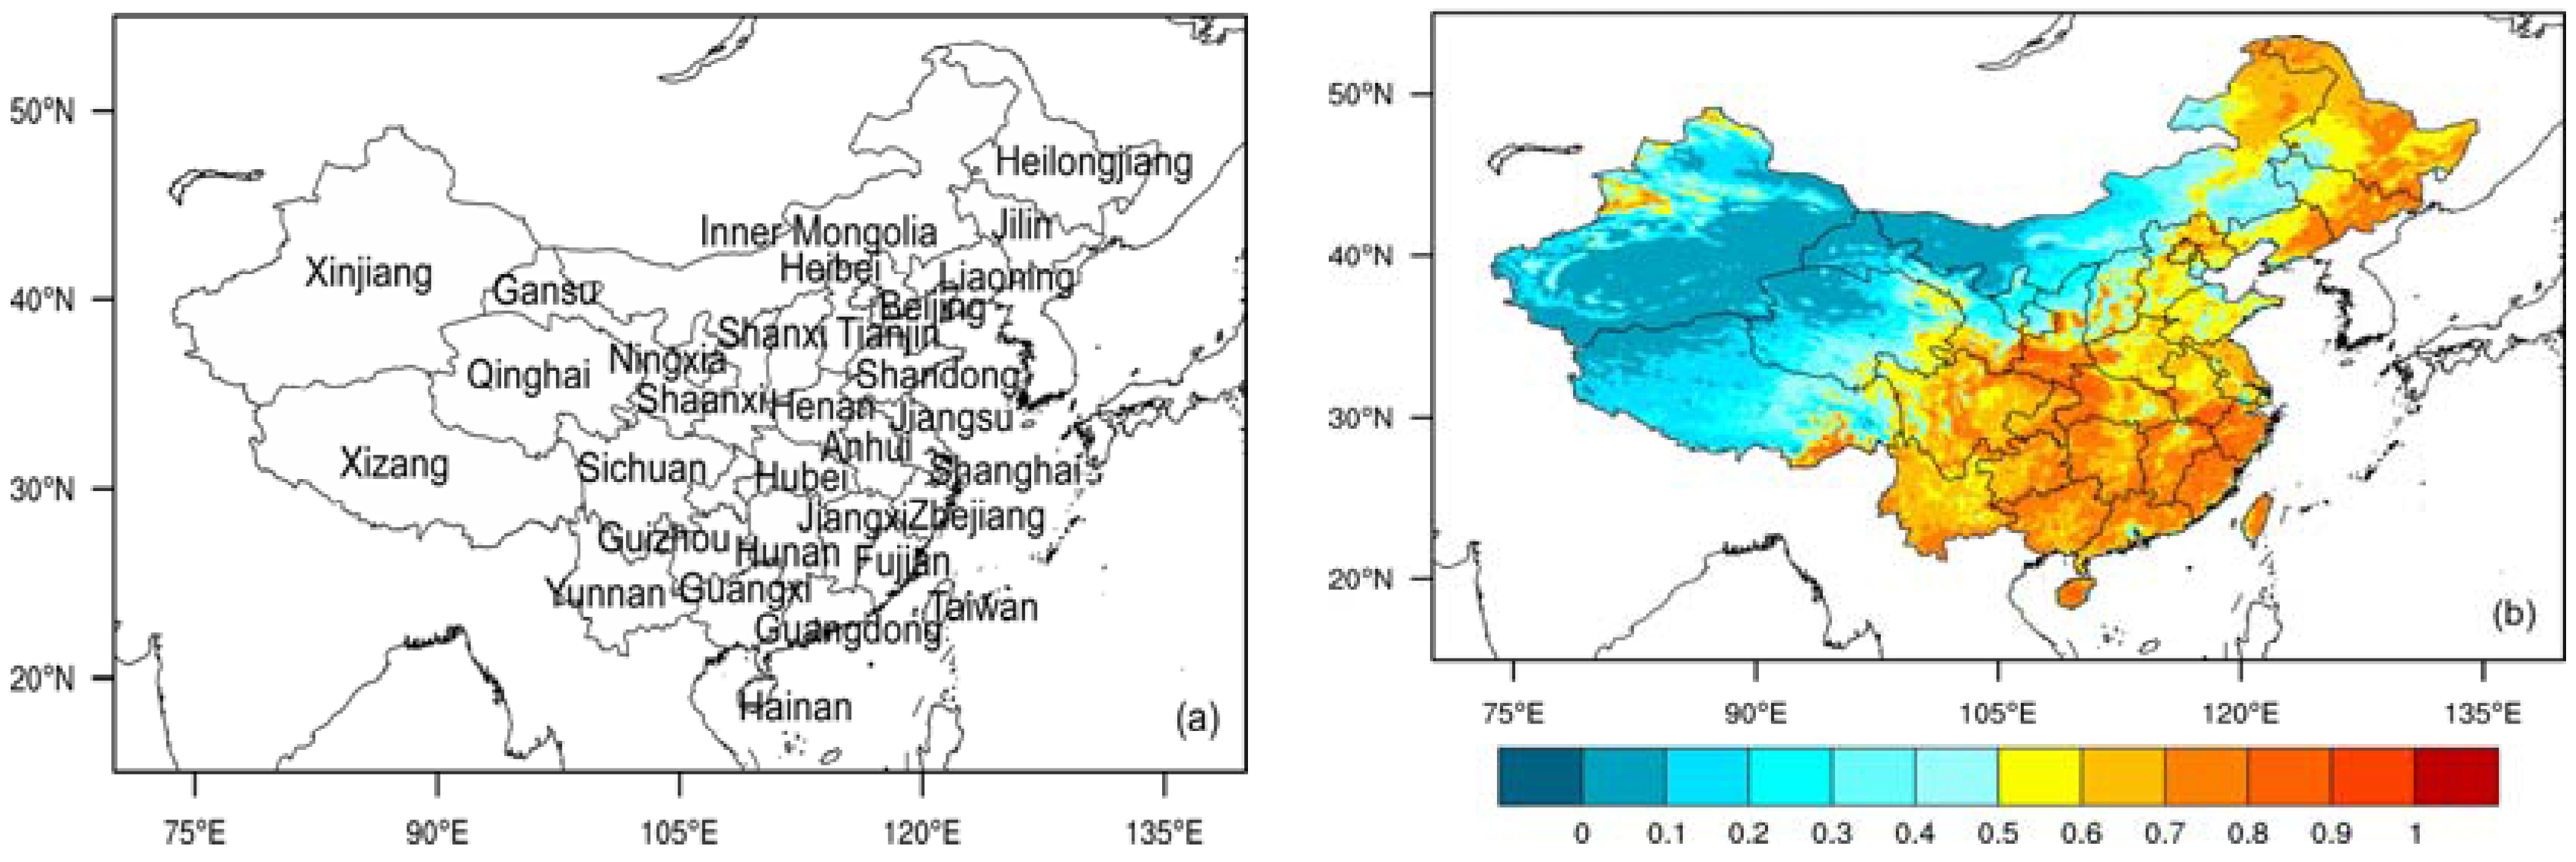
2.1. Data Sets
2.2. Methodology
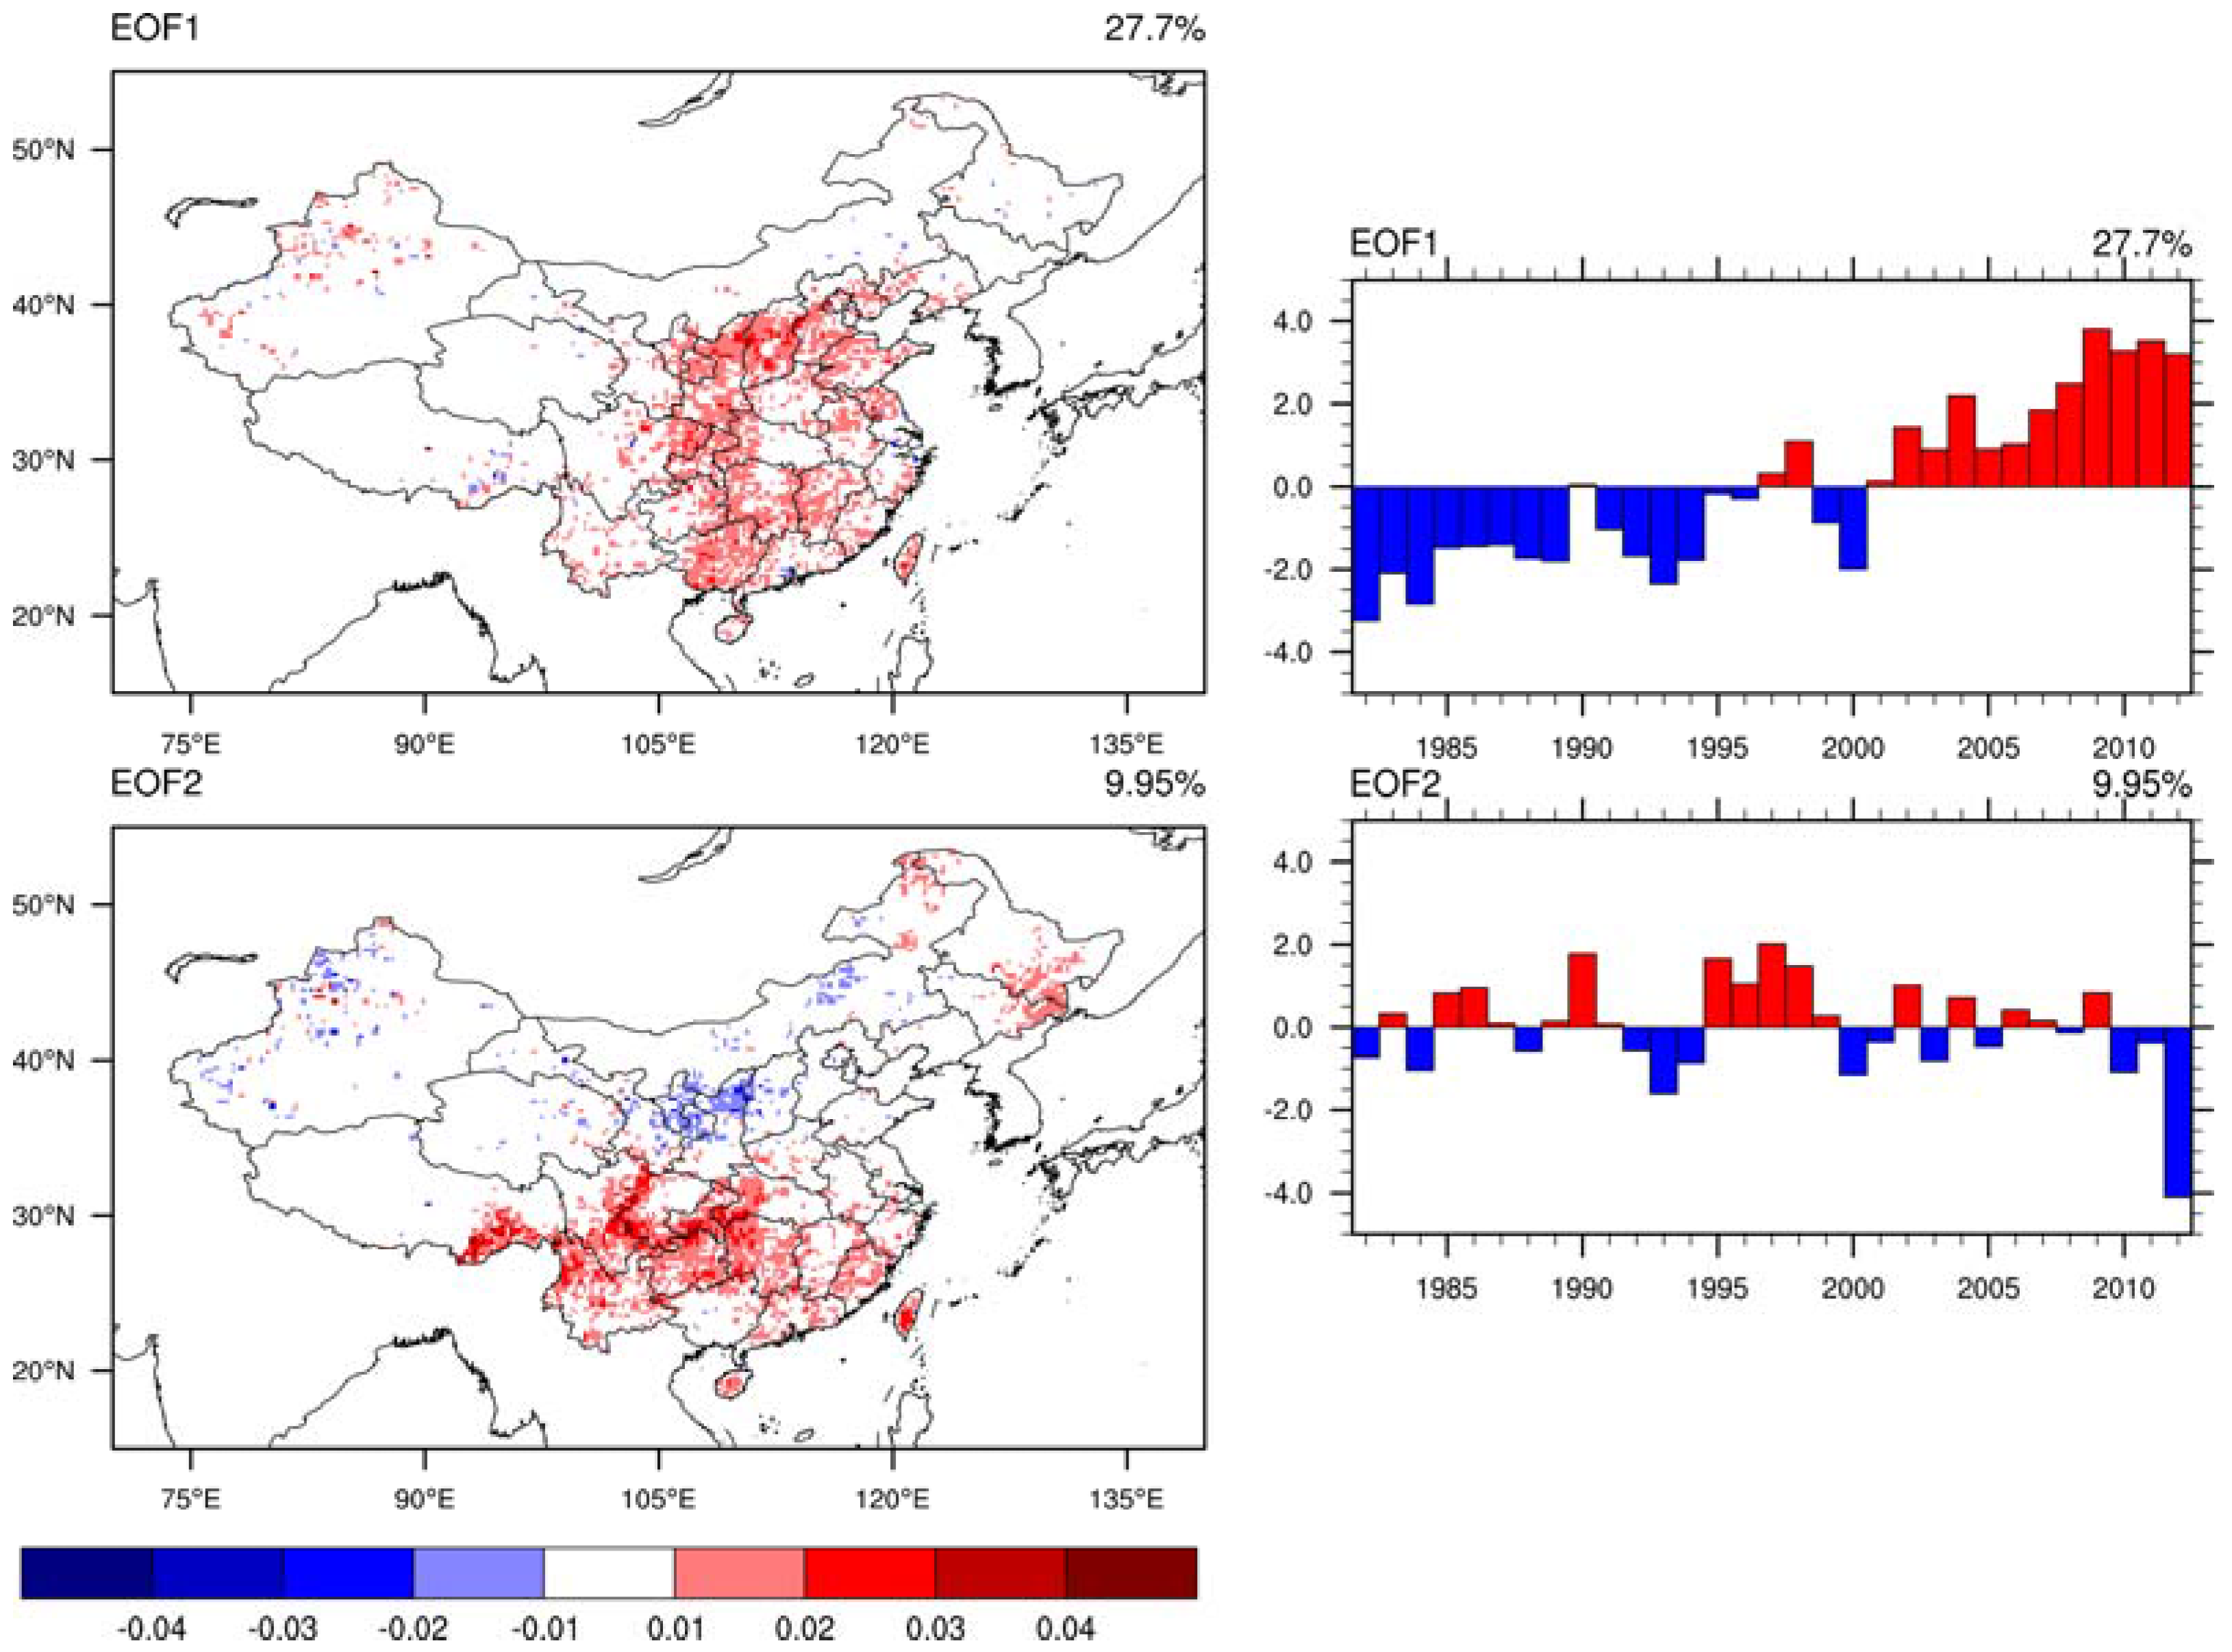
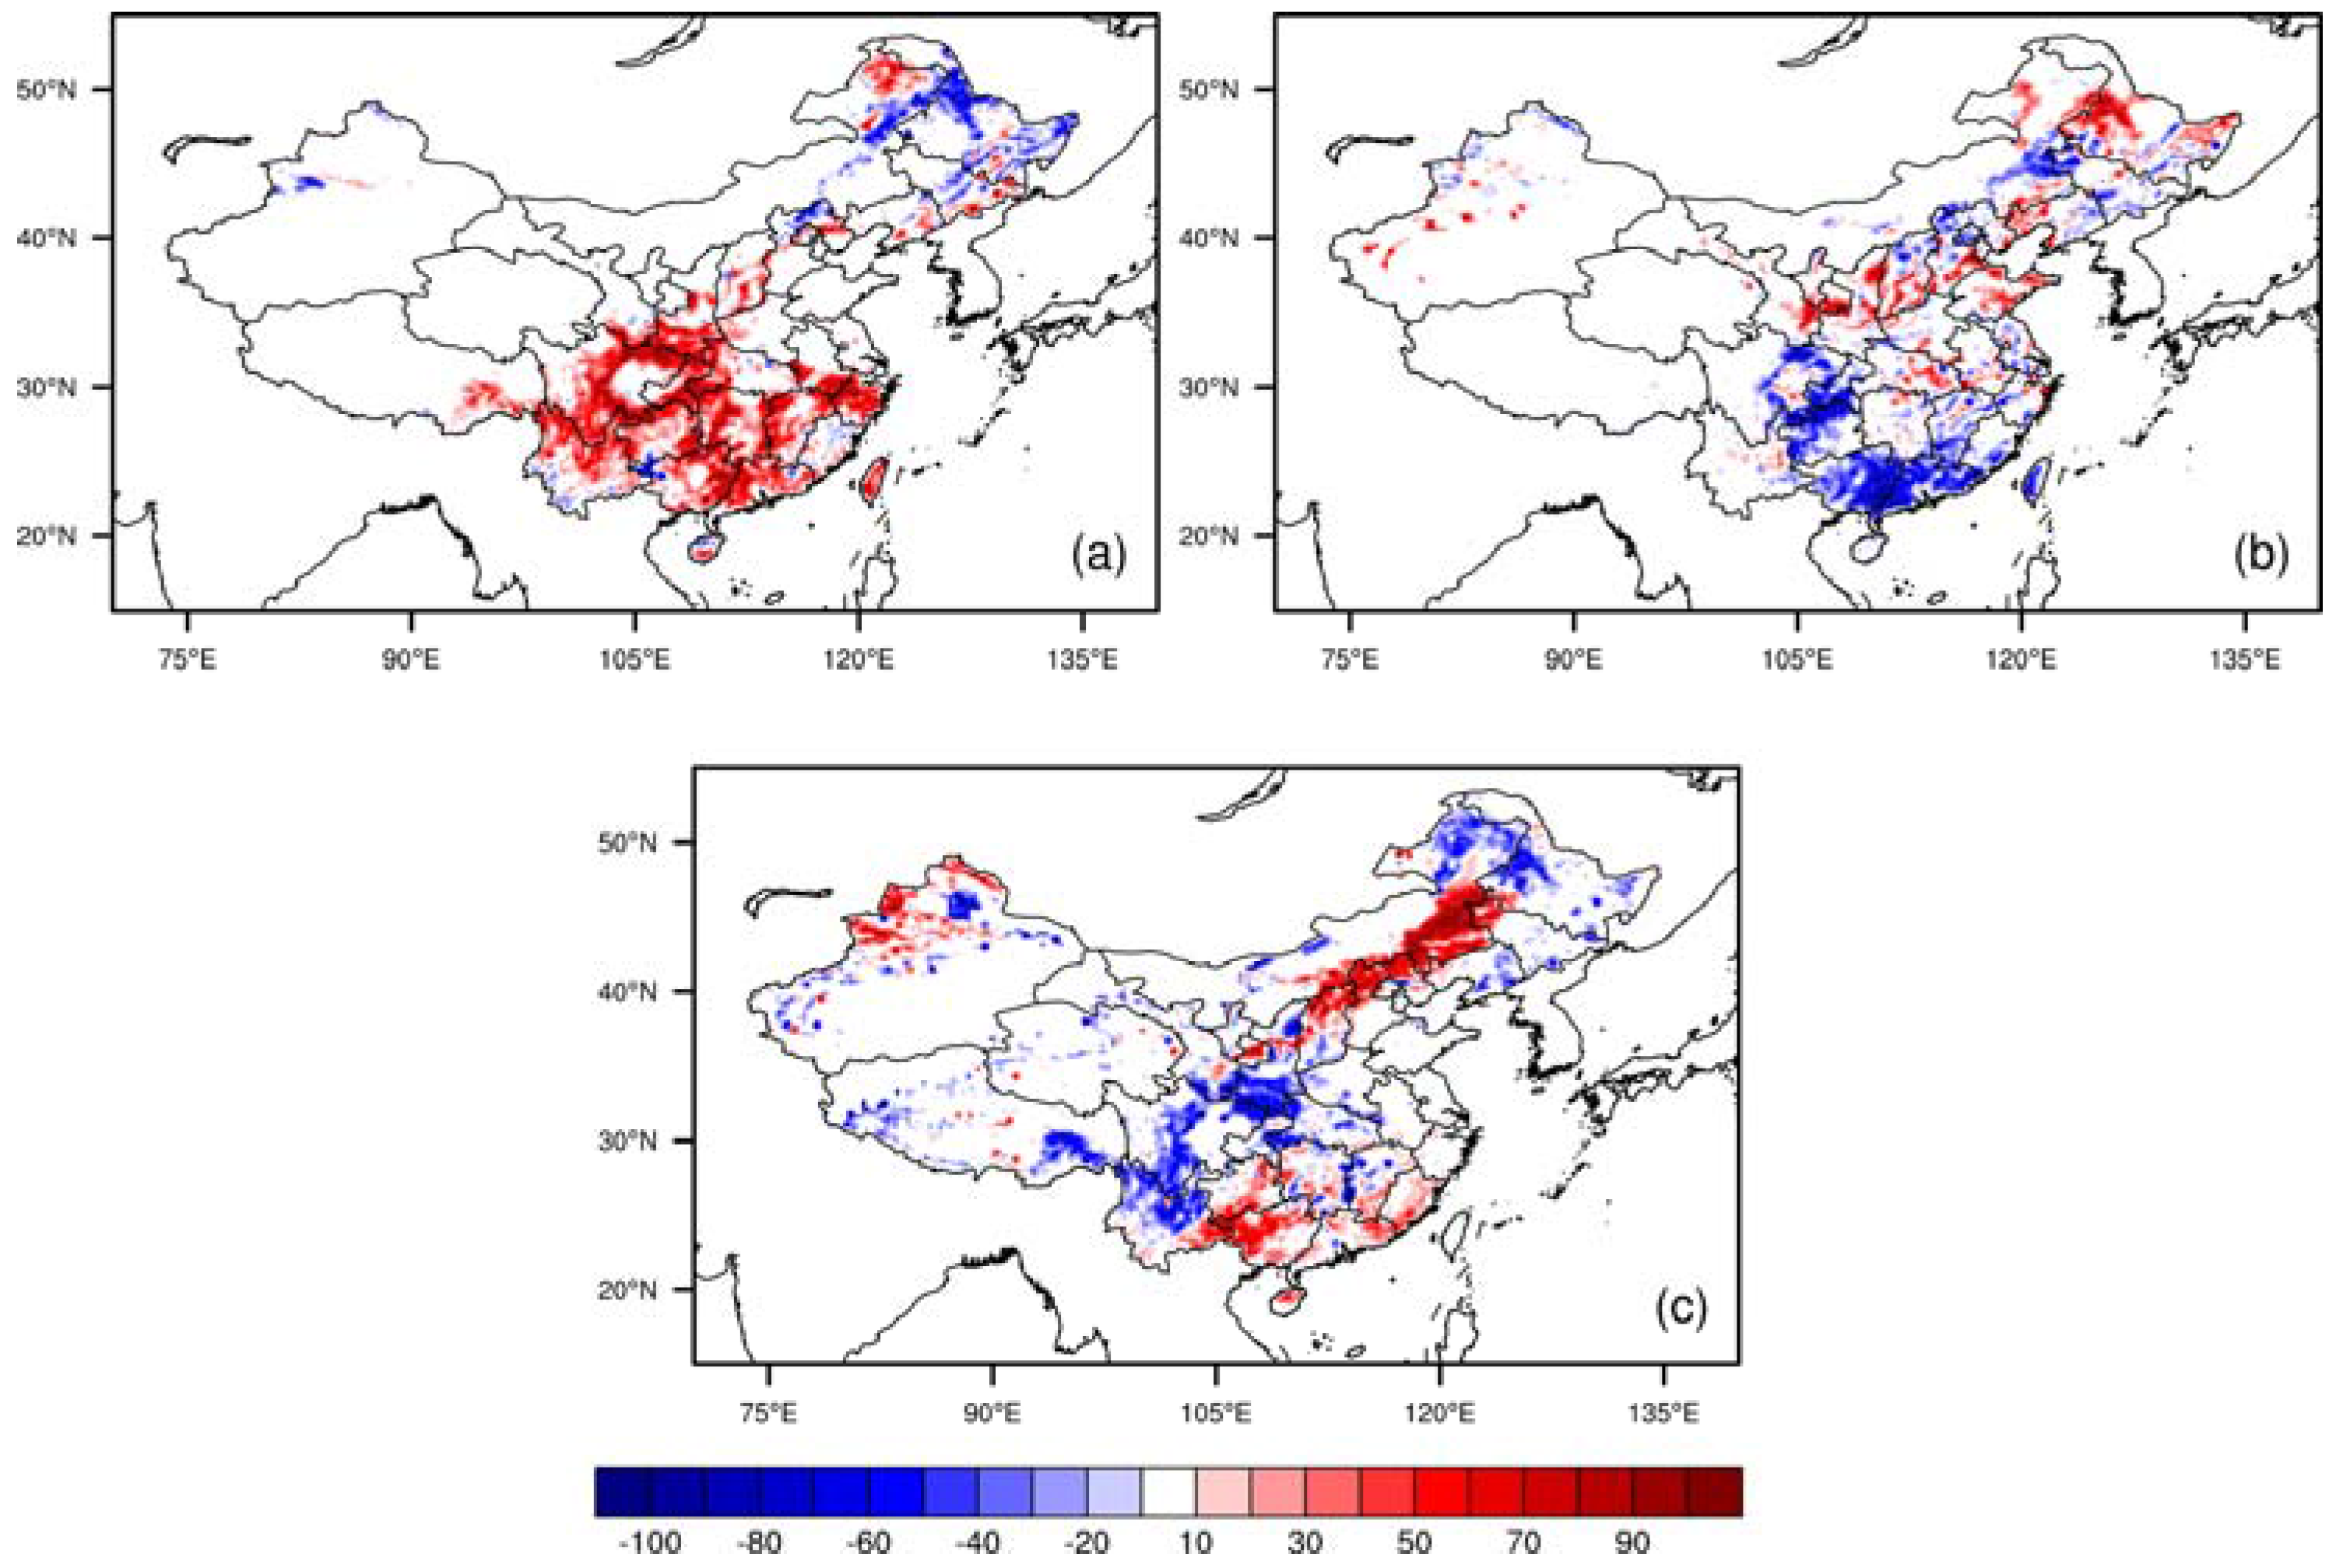
3. Results
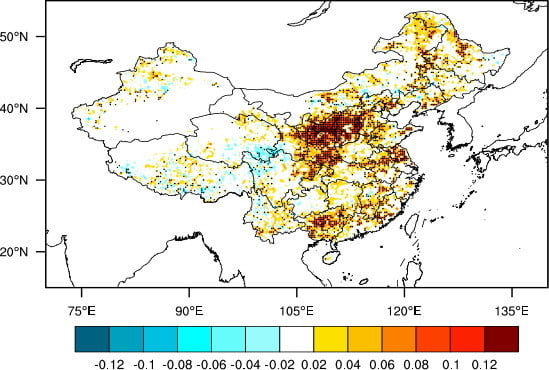
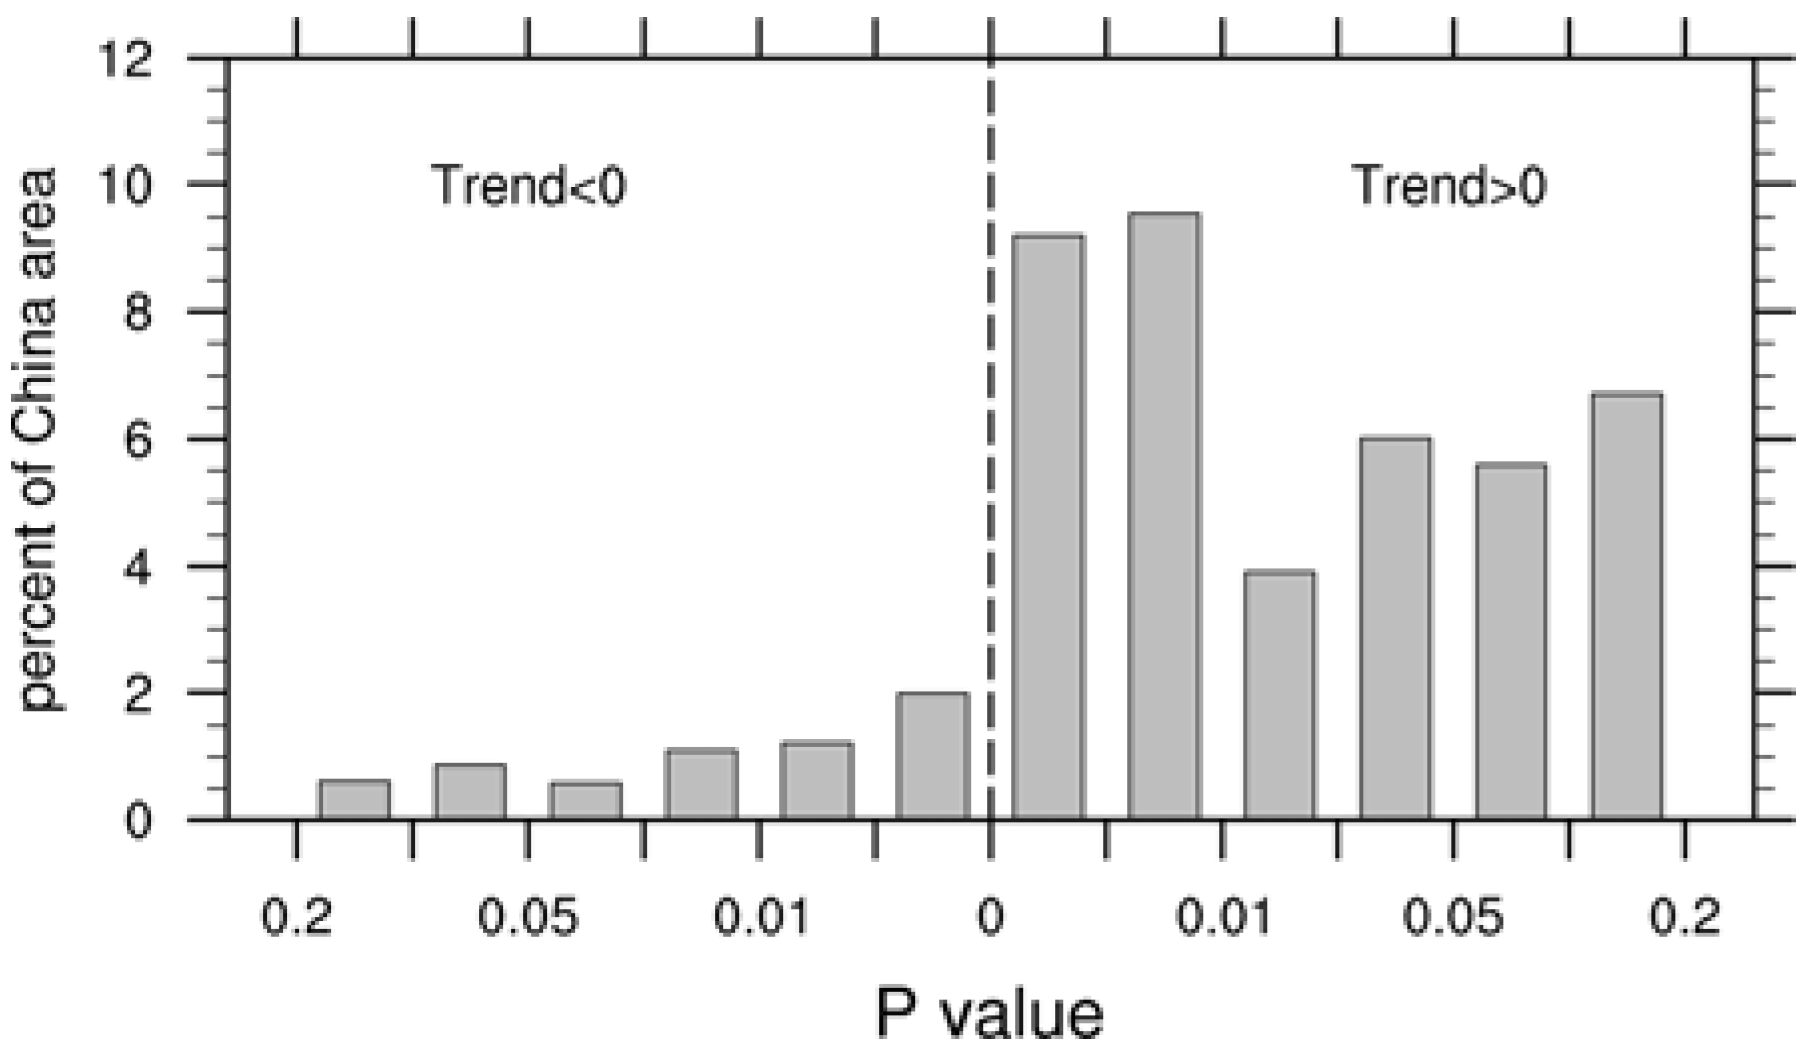
3.1. NDVI Changes
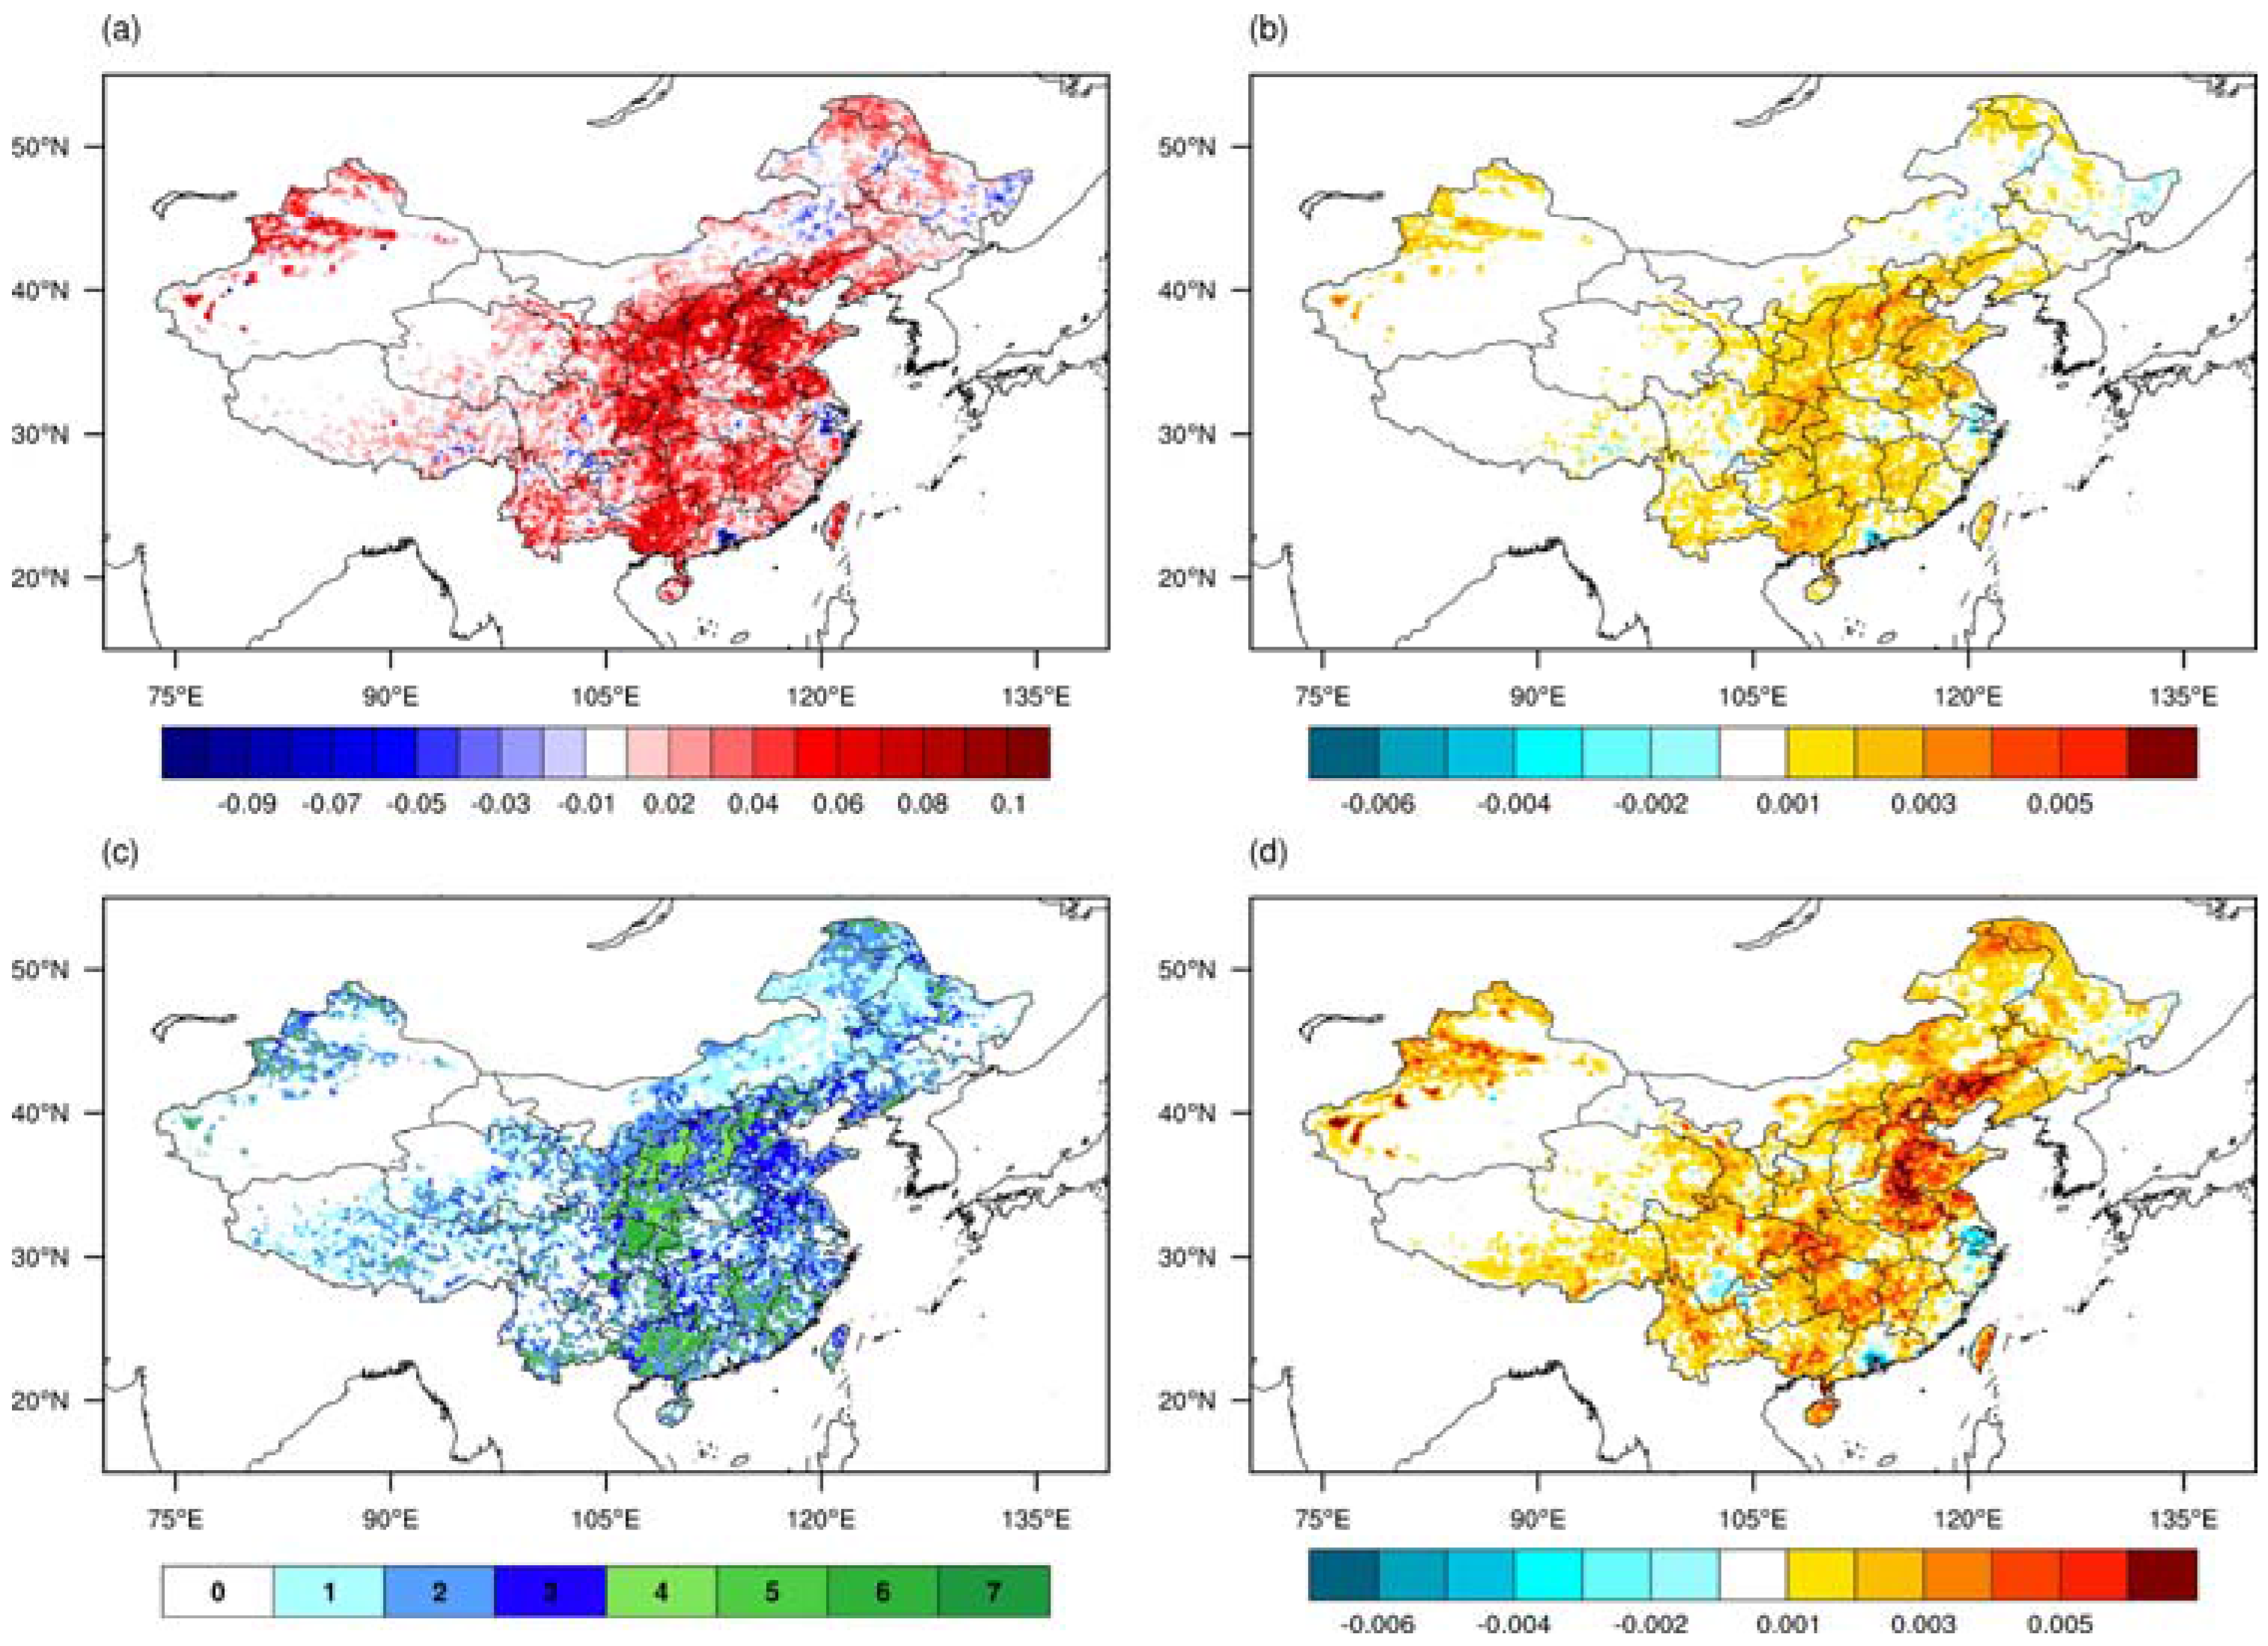
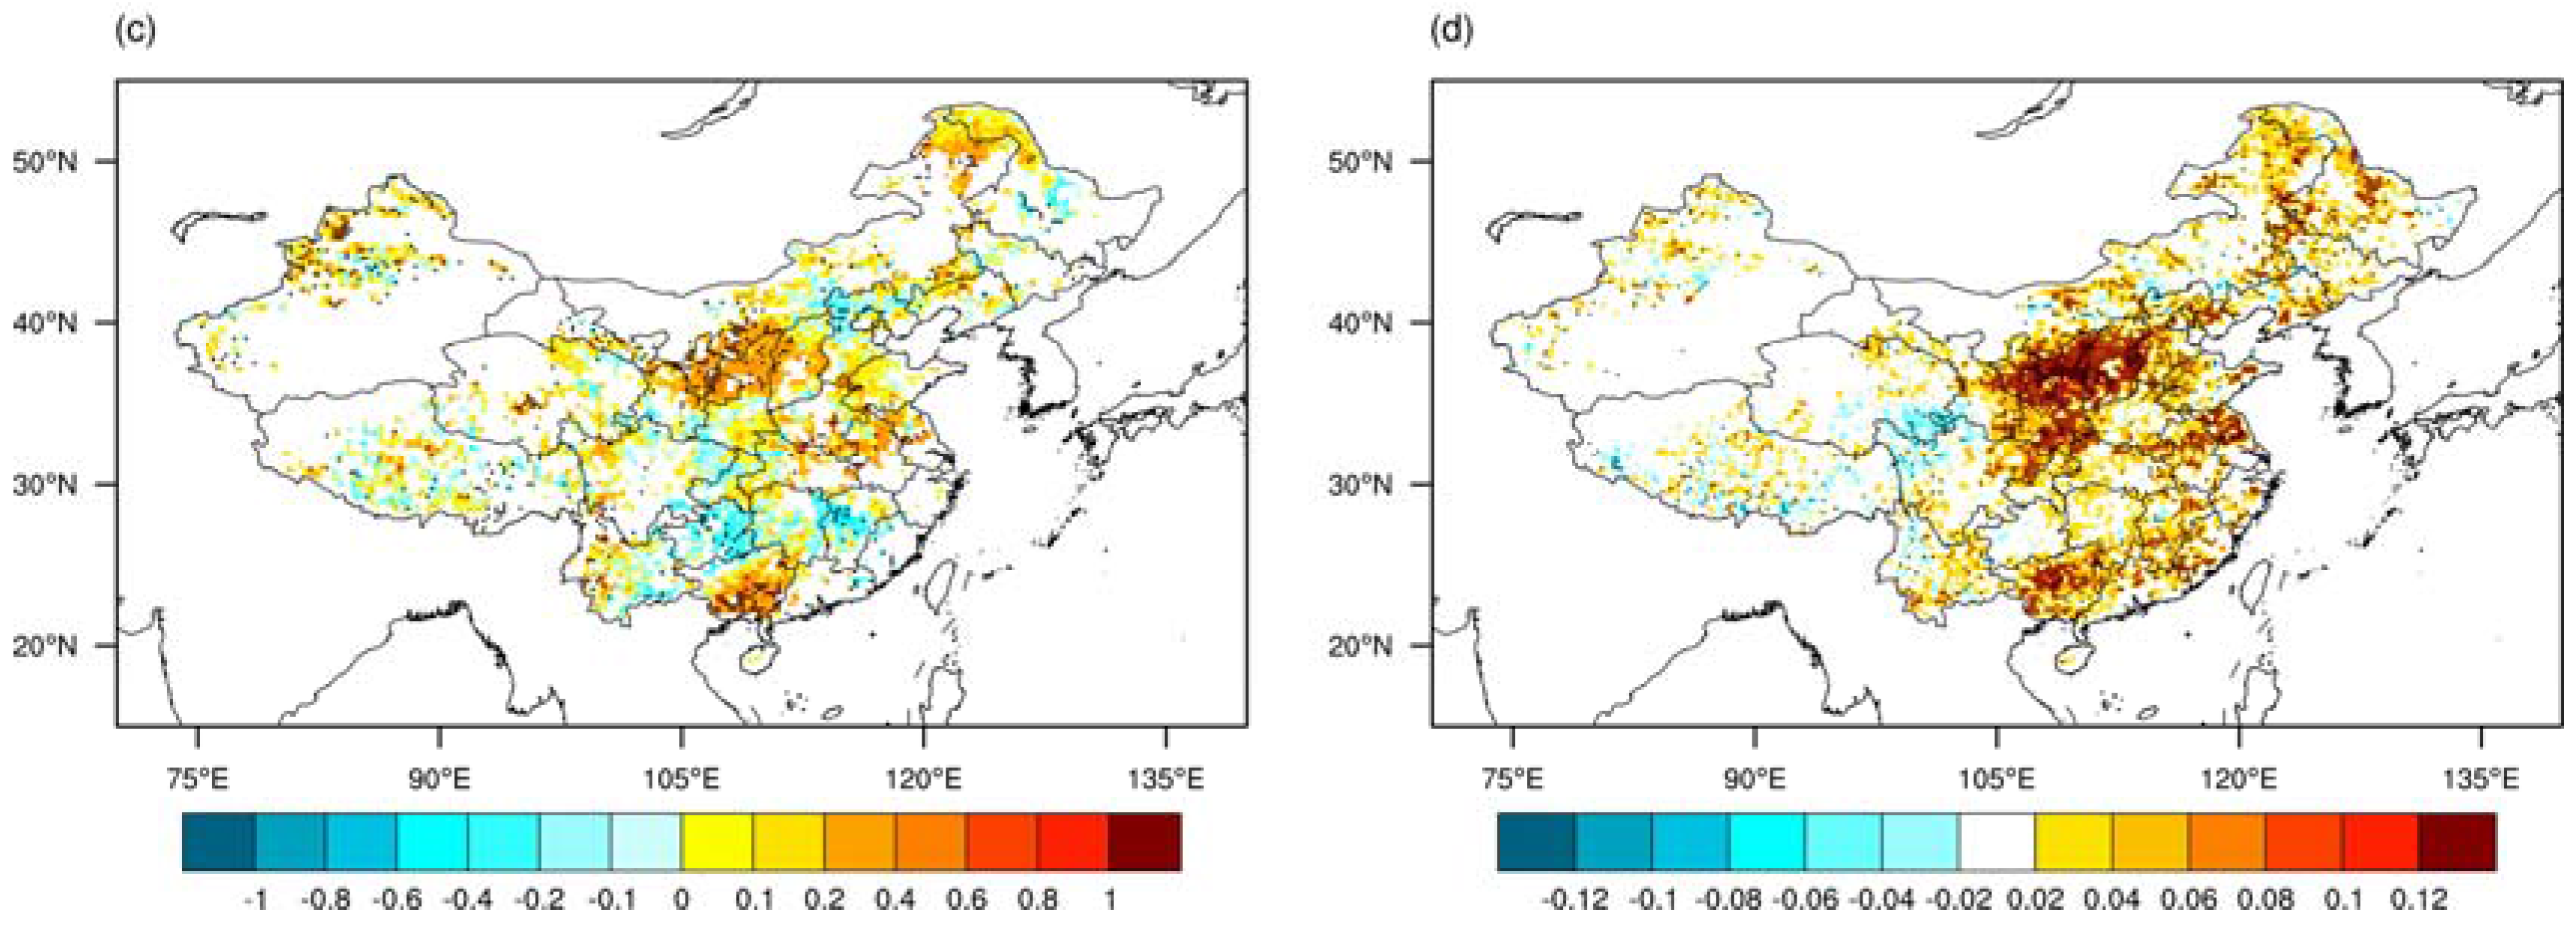
3.2. Separating NDVI Changes into Climatic and Non-Climatic Effects
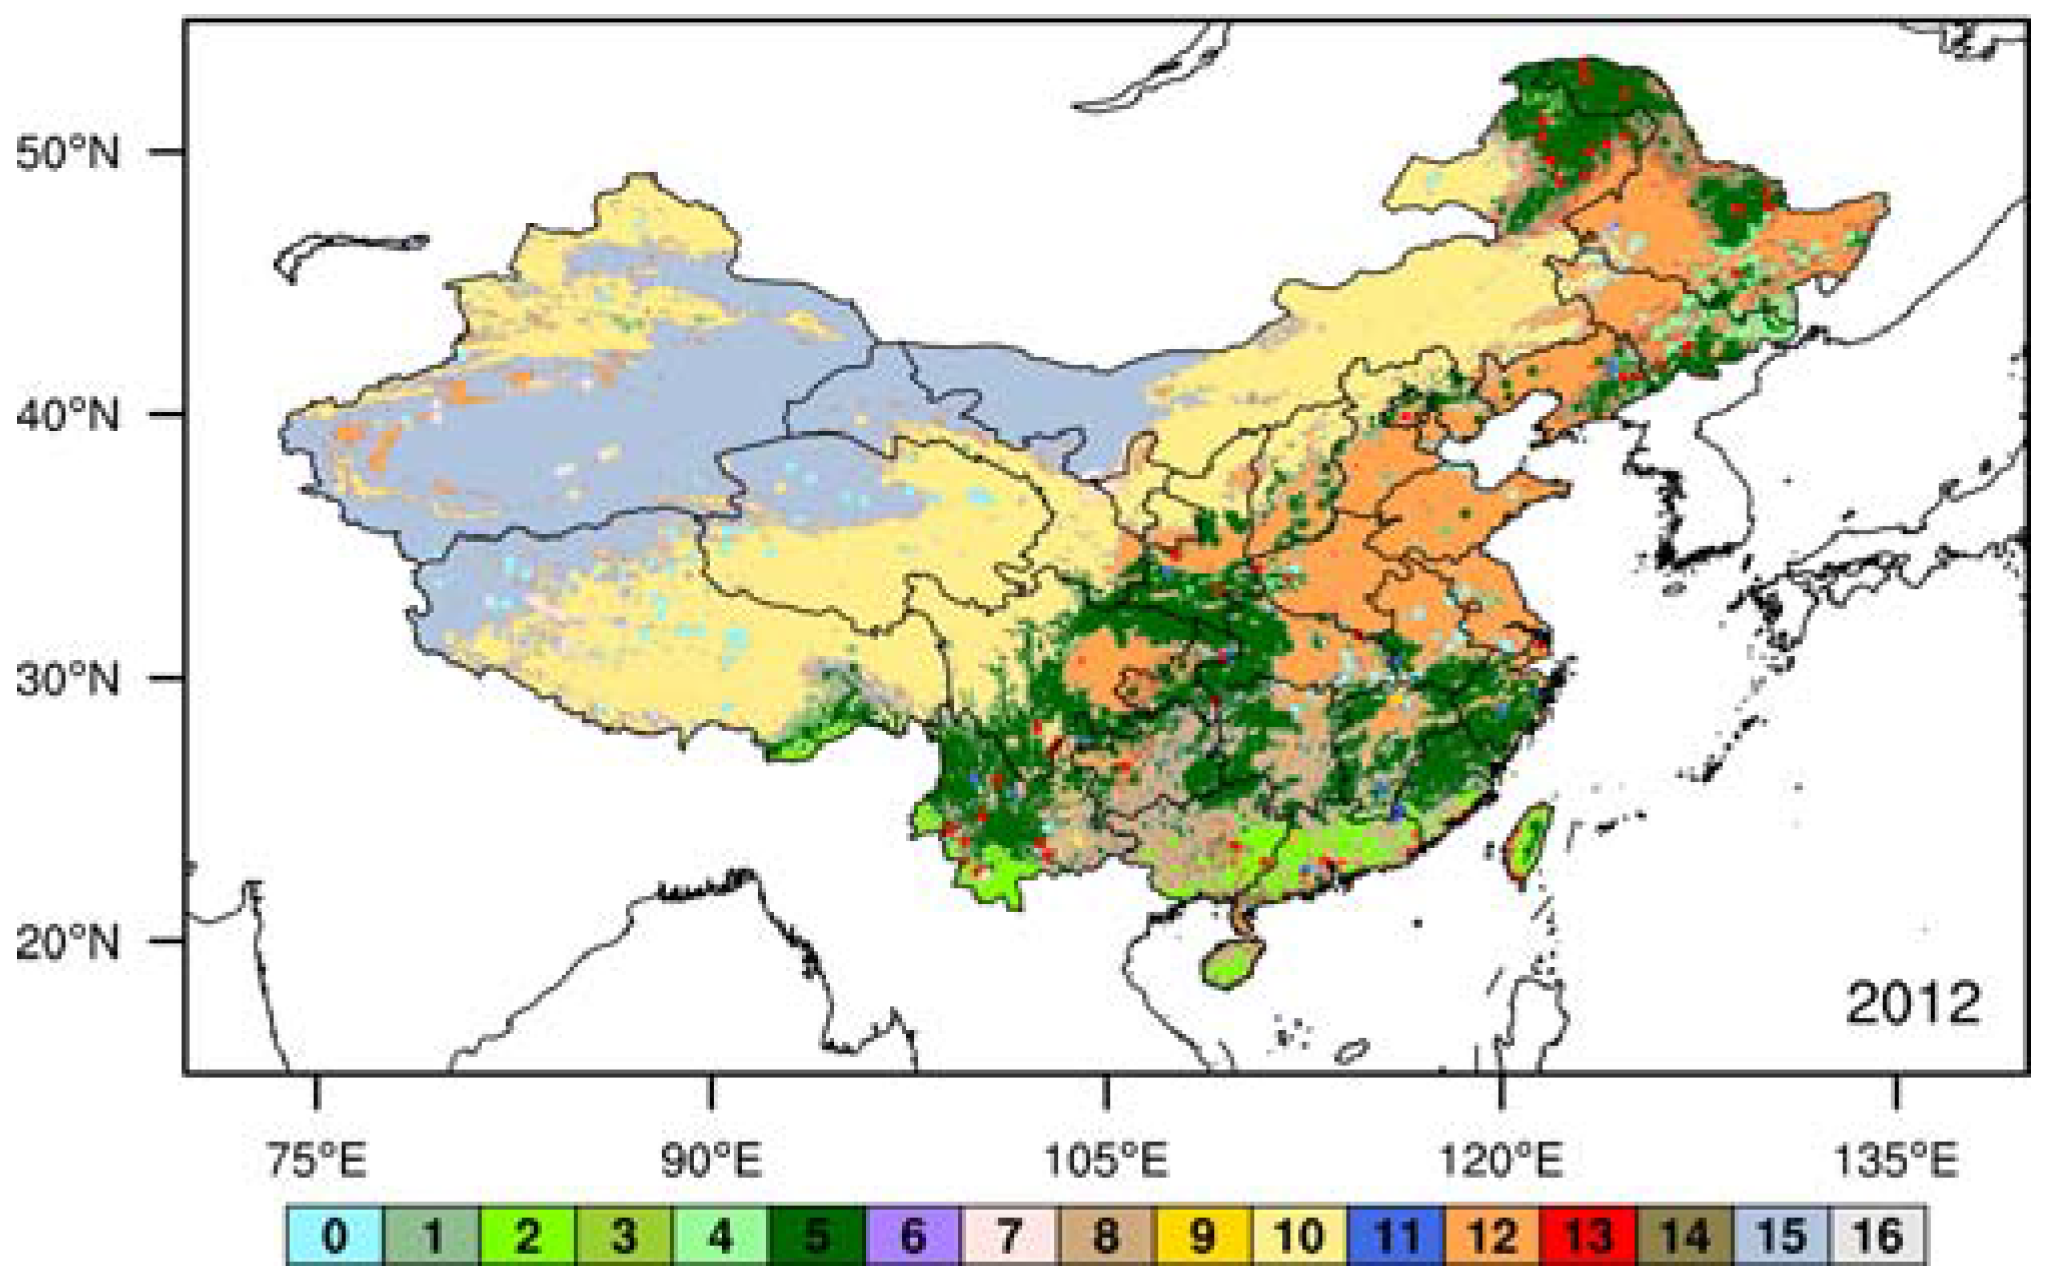
3.3. Linking Non-Climatic Effects on NDVI Changes to LUC
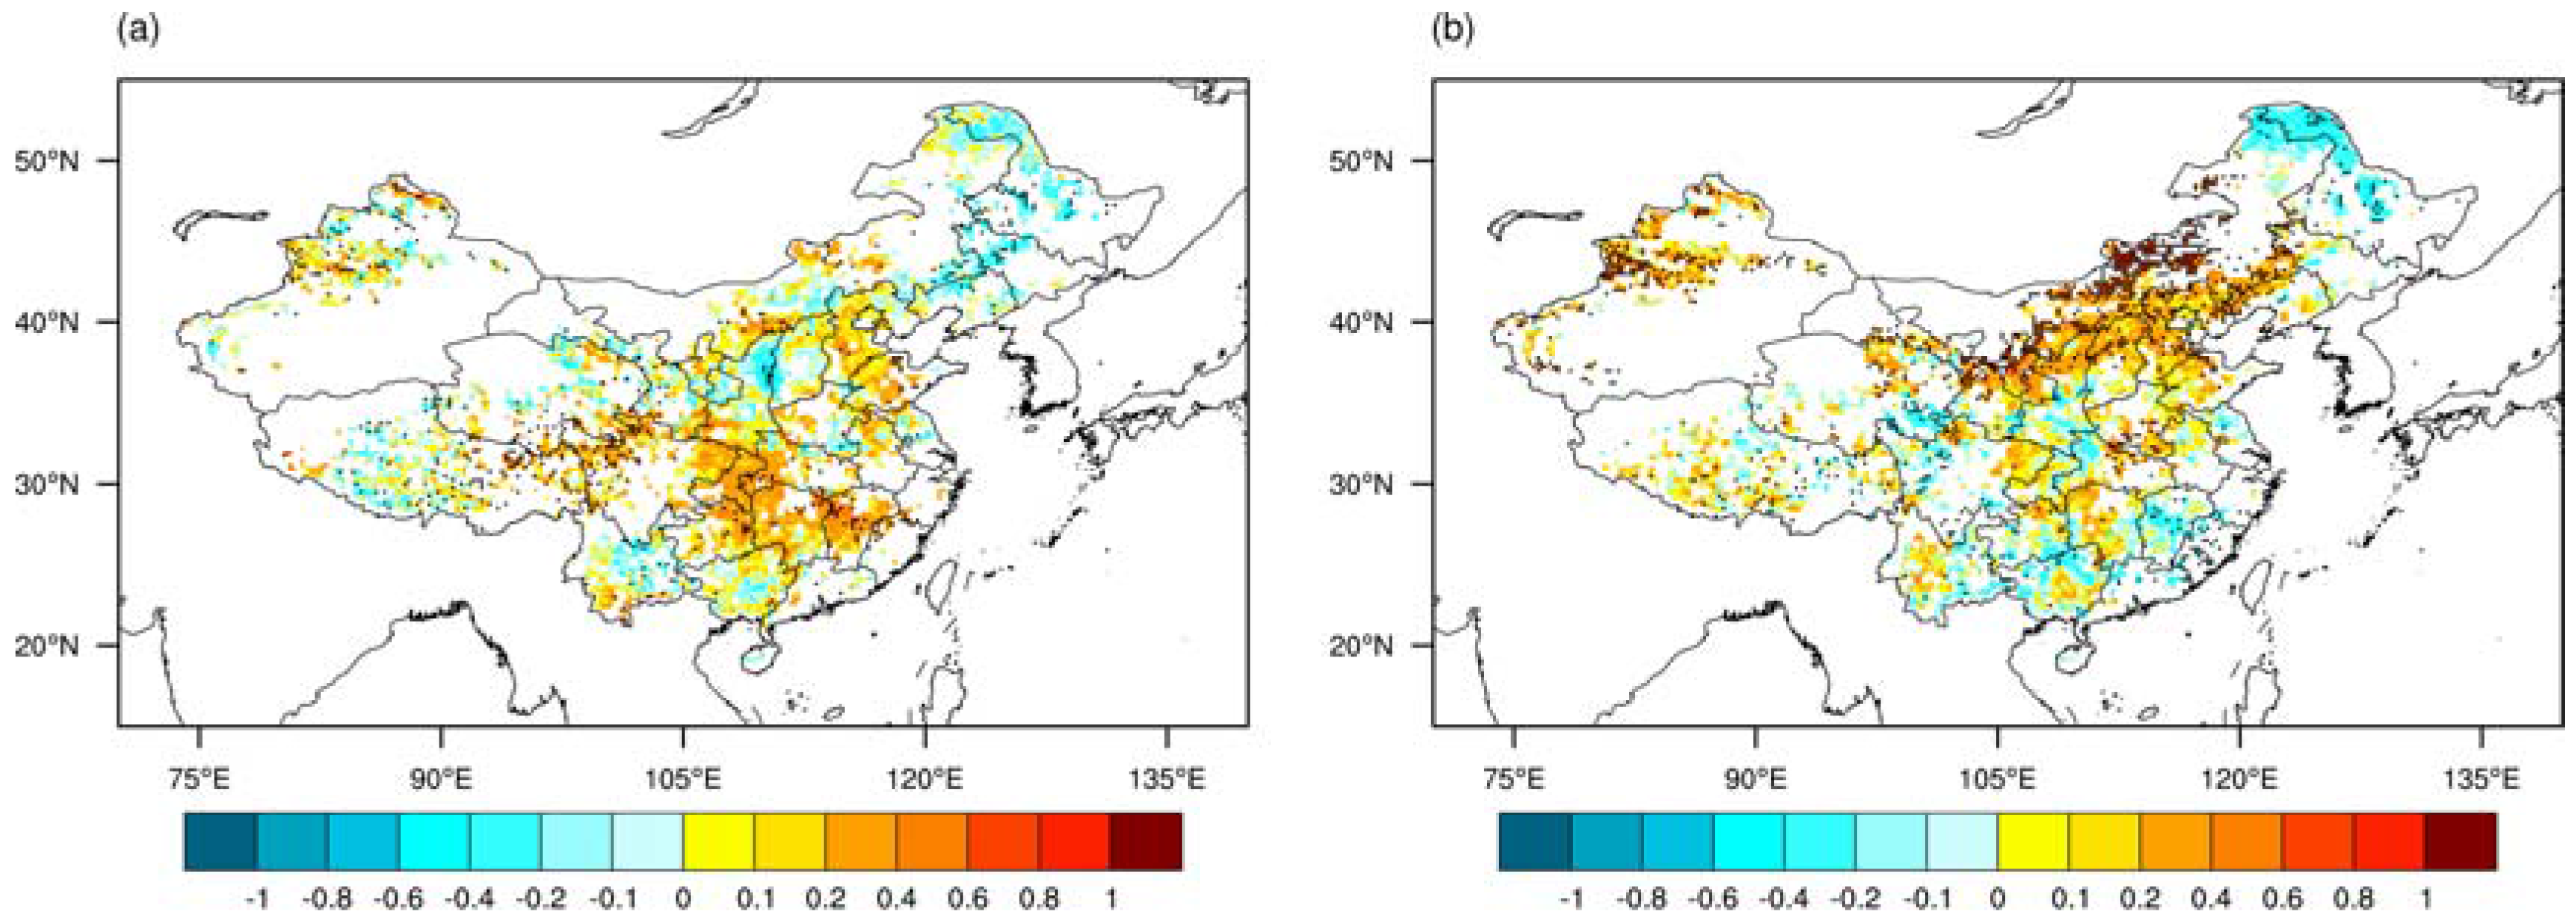
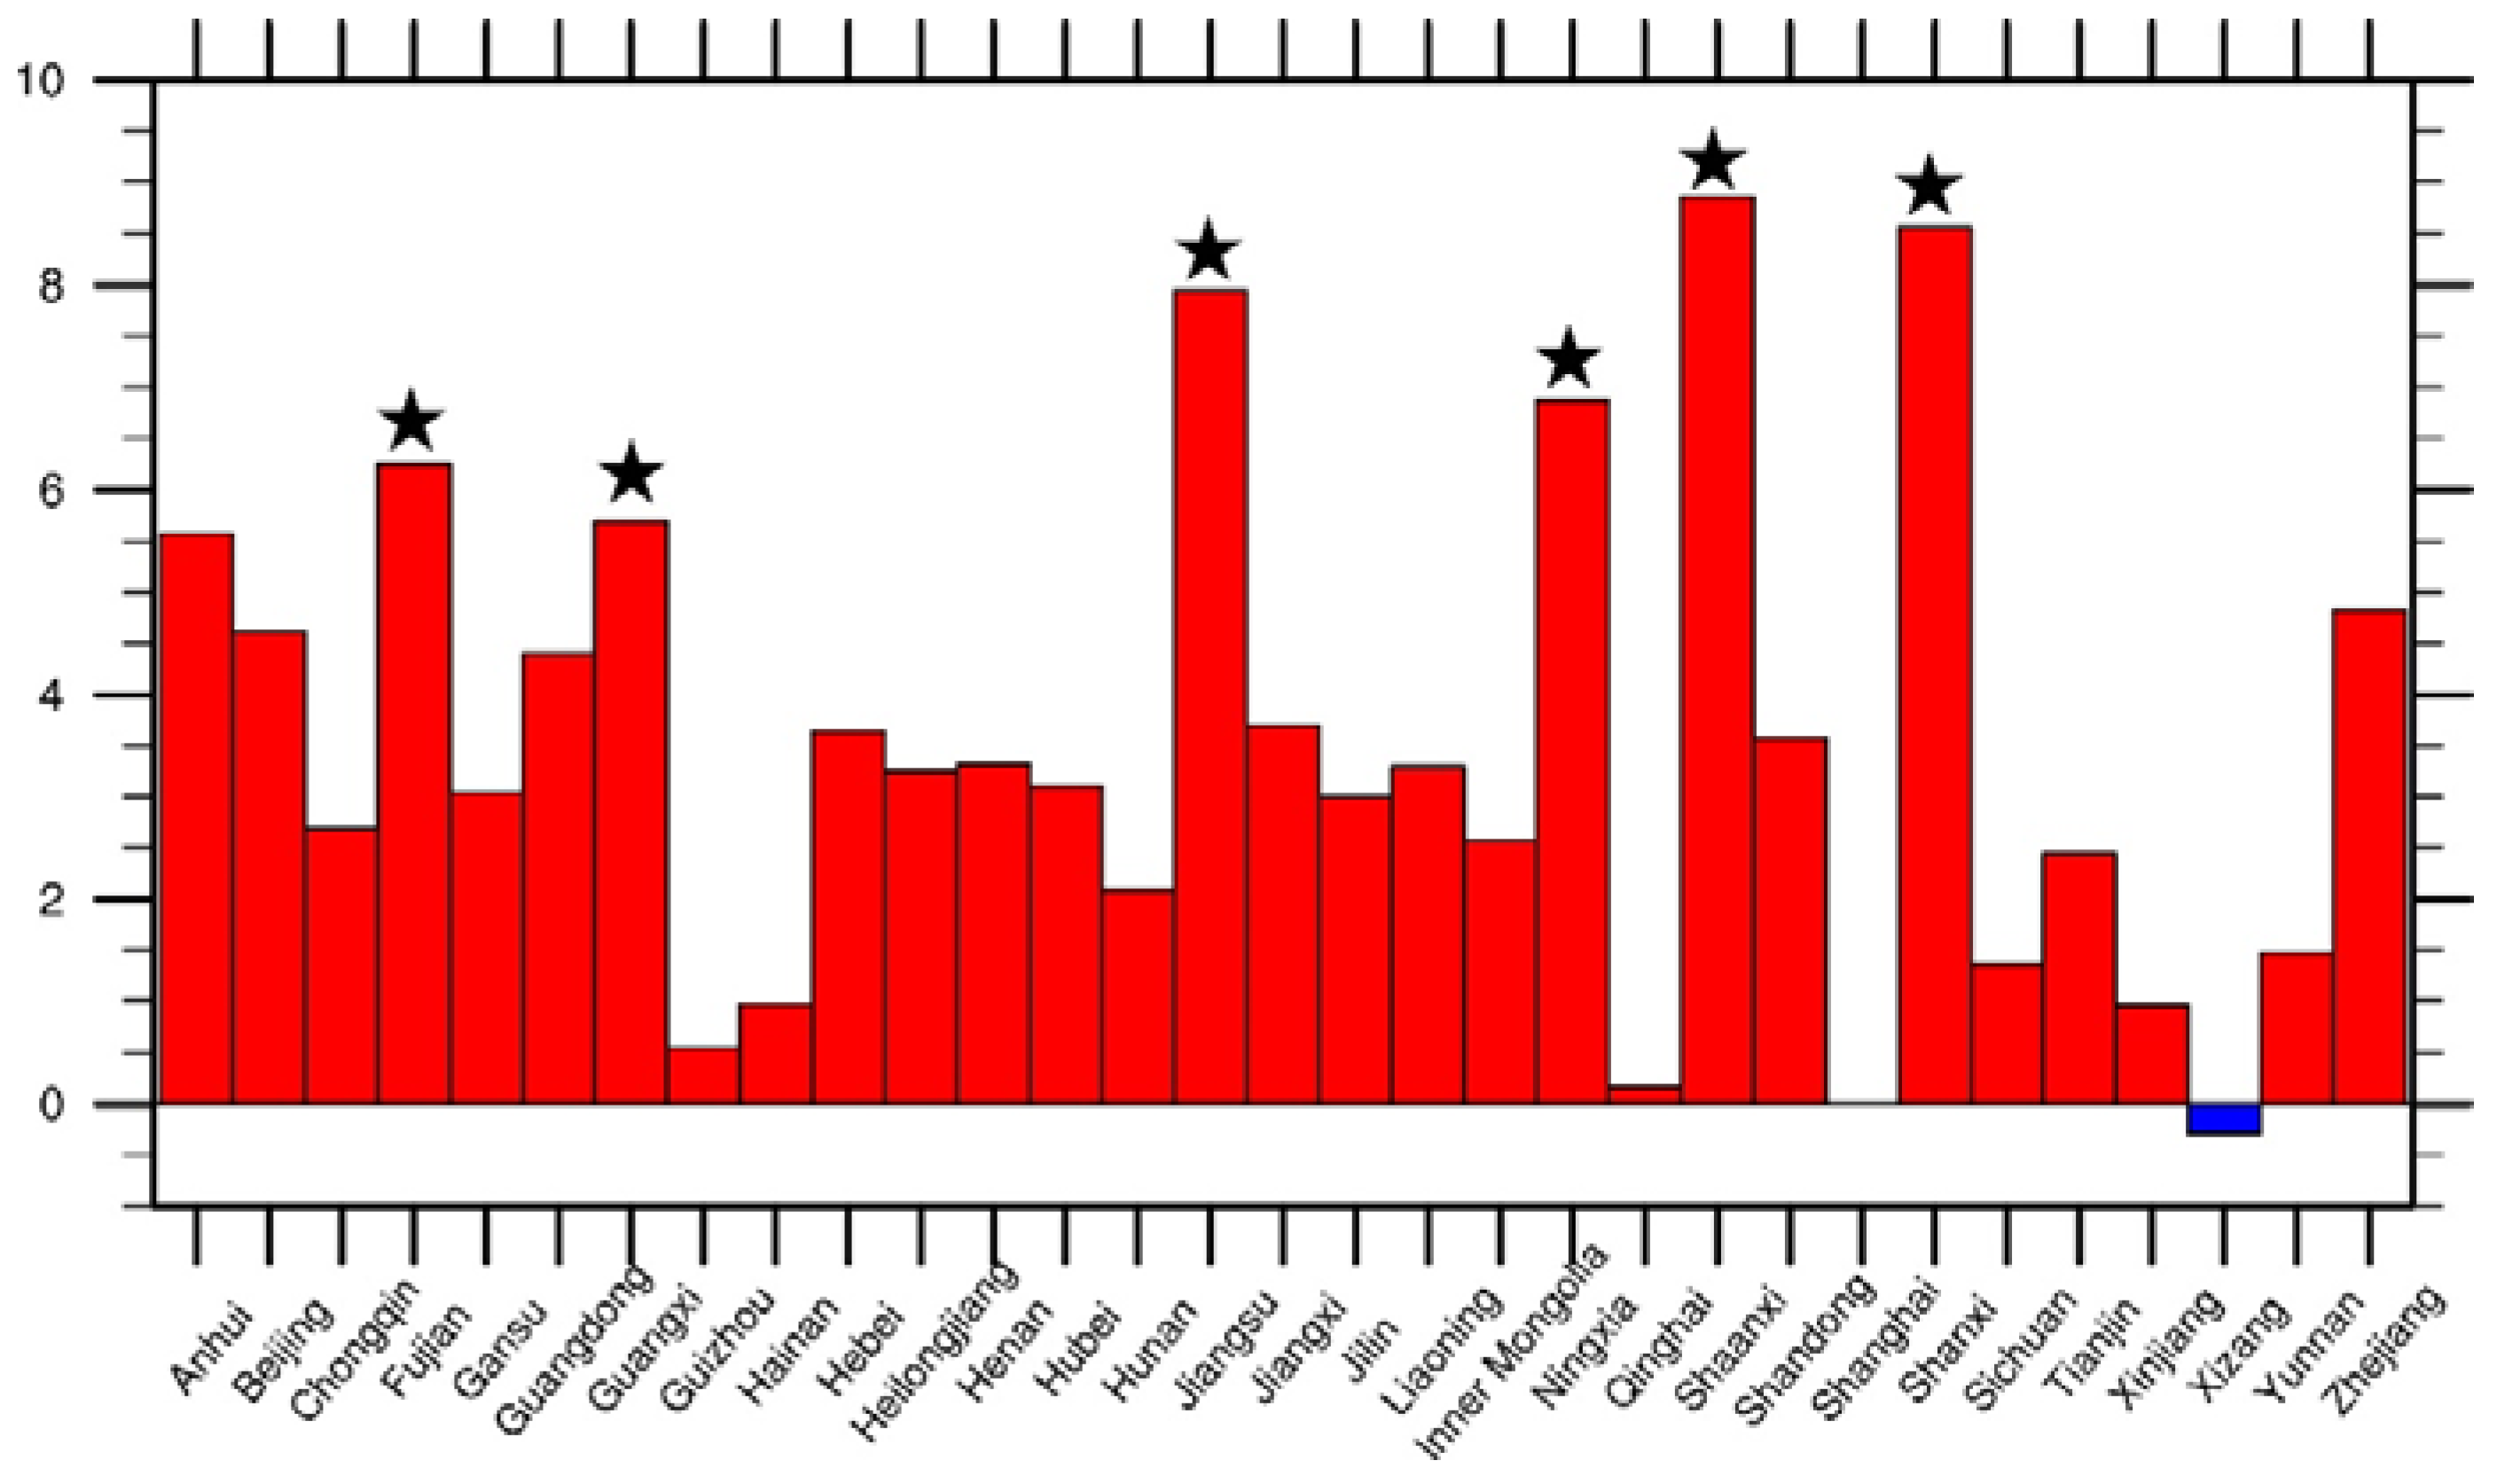
3.4. Verifying Non-Climatic Effects on NDVI Changes with Socioeconomic Data
4. Uncertainties in the Attribution of Observed NDVI Changes
5. Conclusions
Acknowledgments
Author Contributions
Conflicts of Interest
References
- Zhou, L.; Tucker, C.J.; Kaufmann, R.K.; Slayback, D.; Shabanov, N.V.; Myneni, R.B. Variations in northern vegetation activity inferred from satellite data of vegetation index during 1981 to 1999. J. Geophys. Res. 2001, 106, 20069–20083. [Google Scholar] [CrossRef]
- Zhou, L.; Kaufmann, R.K.; Tian, Y.; Myneni, R.B.; Tucker, C.J. Relation between interannual variations in satellite measures of northern forest greenness and climate between 1982 and 1999. J. Geophys. Res. 2003, 108, 4004. [Google Scholar] [CrossRef]
- Piao, S.; Wang, X.; Ciais, P.; Zhu, B.; Wang, T.A.O.; Liu, J.I. E. Changes in satellite-derived vegetation growth trend in temperate and boreal Eurasia from 1982 to 2006. Glob. Chang. Biol. 2011, 17, 3228–3239. [Google Scholar] [CrossRef]
- Myneni, R.B.; Keeling, C.D.; Tucker, C.J.; Asrar, G.; Nemani, R.R. Increased plant growth in the northern high latitudes from 1981 to 1991. Nature 1997, 386, 698–702. [Google Scholar] [CrossRef]
- Zhou, L.; Dickinson, R.E.; Tian, Y.; Zeng, X.; Dai, Y.; Yang, Z.L.; Schaaf, C.B.; Gao, F.; Jin, Y.; Strahler, A.; et al. Comparison of seasonal and spatial variations of albedos from Moderate-Resolution Imaging Spectroradiometer (MODIS) and Common Land Model. J. Geophys. Res. 2003, 108, 4488. [Google Scholar] [CrossRef]
- Hua, W.; Chen, H. Impacts of regional-scale land use/land cover change on diurnal temperature range. Adv. Clim. Chang. Res. 2013, 4, 166–172. [Google Scholar]
- Bonan, G.B. Forests and climate change: Forcings, feedbacks, and the climate benefits of forests. Science 2008, 320, 1444–1449. [Google Scholar] [CrossRef] [PubMed]
- Lee, X.; Goulden, M.L.; Hollinger, D.Y.; Barr, A.; Black, T.A.; Bohrer, G.; Bracho, R.; Drake, B.; Goldstein, A.; Gu, L.; et al. Observed increase in local cooling effect of deforestation at higher latitudes. Nature 2011, 479, 384–387. [Google Scholar] [CrossRef] [PubMed]
- Peng, S.; Piao, S.; Zeng, Z.; Ciais, P.; Zhou, L.; Li, L.Z.X.; Myneni, R.B.; Yin, Y.; Zeng, H. Afforestation in China cools local land surface temperature. Proc. Natl. Acad. Sci. 2014, 111, 2915–2919. [Google Scholar] [CrossRef] [PubMed]
- Nemani, R.R.; Keeling, C.D.; Hashimoto, H.; Jolly, W.M.; Piper, S.C.; Tucker, C.J.; Myneni, R.B.; Running, S.W. Climate-driven increases in global terrestrial net primary production from 1982 to 1999. Science 2003, 300, 1560–1563. [Google Scholar] [CrossRef] [PubMed]
- Gong, D.Y.; Ho, C.H. Detection of large-scale climate signals in spring vegetation index (normalized difference vegetation index) over the Northern Hemisphere. J. Geophys. Res. 2003, 108, 4498. [Google Scholar] [CrossRef]
- Park, H.S.; Sohn, B.J. Recent trends in changes of vegetation over East Asia coupled with temperature and rainfall variations. J. Geophys. Res. 2010, 115, D14101. [Google Scholar] [CrossRef]
- Zhao, M.; Running, S.W. Drought-induced reduction in global terrestrial net primary production from 2000 through 2009. Science 2010, 329, 940–943. [Google Scholar] [CrossRef] [PubMed]
- Xu, L.; Myneni, R.B.; Chapin Iii, F.S.; Callaghan, T.V.; Pinzon, J.E.; Tucker, C.J.; Zhu, Z.; Bi, J.; Ciais, P.; Tommervik, H.; et al. Temperature and vegetation seasonality diminishment over northern lands. Nat. Clim. Chang. 2013, 3, 581–586. [Google Scholar] [CrossRef]
- Wang, X.; Piao, S.; Ciais, P.; Li, J.; Friedlingstein, P.; Koven, C.; Chen, A. Spring temperature change and its implication in the change of vegetation growth in North America from 1982 to 2006. Proc. Natl. Acad. Sci. USA 2011, 108, 1240–1245. [Google Scholar] [CrossRef] [PubMed]
- Piao, S.; Fang, J.; Zhou, L.; Ciais, P.; Zhu, B. Variations in satellite-derived phenology in China's temperate vegetation. Glob. Chang. Biol. 2006, 12, 672–685. [Google Scholar] [CrossRef]
- De Jong, R.; Schaepman, M.E.; Furrer, R.; de Bruin, S.; Verburg, P.H. Spatial relationship between climatologies and changes in global vegetation activity. Glob. Chang. Biol. 2013, 19, 1953–1964. [Google Scholar] [CrossRef] [PubMed]
- Hua, W.; Chen, H. Recognition of climatic effects of land use/land cover change under global warming. Chin. Sci. Bull. 2013, 58, 3852–3858. [Google Scholar] [CrossRef]
- Hua, W.; Chen, H.; Sun, S.; Zhou, L. Assessing climatic impacts of future land use and land cover change projected with the CanESM2 model. Int. J. Climatol. 2015, 35, 3661–3675. [Google Scholar] [CrossRef]
- Hua, W.; Chen, H.; Li, X. Effects of future land use change on the regional climate in China. Sci. China Earth Sci. 2015, 58, 1840–1848. [Google Scholar] [CrossRef]
- Piao, S.; Yin, G.; Tan, J.; Cheng, L.; Huang, M.; Li, Y.; Liu, R.; Mao, J.; Myneni, R.B.; Peng, S.; et al. Detection and attribution of vegetation greening trend in China over the last 30 years. Glob. Chang. Biol. 2015, 21, 1601–1609. [Google Scholar] [CrossRef] [PubMed]
- Zhu, Z.; Piao, S.; Myneni, R.B.; Huang, M.; Zeng, Z.; Canadell, J.G.; Ciais, P.; Sitch, S.; Friedlingstein, P.; Arneth, A.; et al. Greening of the Earth and its drivers. Nat. Clim. Chang. 2016, 6, 791–795. [Google Scholar] [CrossRef]
- Piao, S.; Nan, H.; Huntingford, C.; Ciais, P.; Friedlingstein, P.; Sitch, S.; Peng, S.; Ahlström, A.; Canadell, J.G.; Cong, N.; et al. Evidence for a weakening relationship between interannual temperature variability and northern vegetation activity. Nat. Commun. 2014, 5. [Google Scholar] [CrossRef] [PubMed]
- State Forestry Administration of the People’s Republic of China, B. Eighth National Forest Resource Inventory Report (2009–2013); State Forestry Administration of the People’s Republic of China: Beijing, China, 2014.
- Lü, Y.; Zhang, L.; Feng, X.; Zeng, Y.; Fu, B.; Yao, X.; Li, J.; Wu, B. Recent ecological transitions in China: Greening, browning, and influential factors. Sci. Rep. 2015, 5, 8732. [Google Scholar] [CrossRef] [PubMed]
- Piao, S.; Fang, J.; Zhou, L.; Guo, Q.; Henderson, M.; Ji, W.; Li, Y.; Tao, S. Interannual variations of monthly and seasonal normalized difference vegetation index (NDVI) in China from 1982 to 1999. J. Geophys. Res. 2003, 108, 4401. [Google Scholar] [CrossRef]
- Peng, S.; Chen, A.; Xu, L.; Cao, C.; Fang, J.; Myneni, R.B.; Pinzon, J.E.; Tucker, C.J.; Piao, S. Recent change of vegetation growth trend in China. Environ. Res. Lett. 2011, 6, 044027. [Google Scholar] [CrossRef]
- Xu, X.; Piao, S.; Wang, X.; Chen, A.; Ciais, P.; Myneni, R.B. Spatio-temporal patterns of the area experiencing negative vegetation growth anomalies in China over the last three decades. Environ. Res. Lett. 2012, 7, 035701. [Google Scholar] [CrossRef]
- Anav, A.; Murray-Tortarolo, G.; Friedlingstein, P.; Sitch, S.; Piao, S.; Zhu, Z. Evaluation of land surface models in reproducing satellite Derived leaf area index over the high-latitude northern hemisphere. Part II: Earth system models. Remote Sens. 2013, 5, 3637–3661. [Google Scholar] [CrossRef]
- Murray-Tortarolo, G.; Anav, A.; Friedlingstein, P.; Sitch, S.; Piao, S.; Zhu, Z.; Poulter, B.; Zaehle, S.; Ahlström, A.; Lomas, M.; et al. Evaluation of land surface models in reproducing satellite-derived LAI over the high-latitude Northern Hemisphere. Part I: Uncoupled DGVMs. Remote Sens. 2013, 5, 4819–4838. [Google Scholar] [CrossRef]
- Fang, H.; Jiang, C.; Li, W.; Wei, S.; Baret, F.; Chen, J.M.; Garcia-Haro, J.; Liang, S.; Liu, R.; Myneni, R.B.; et al. Characterization and intercomparison of global moderate resolution leaf area index (LAI) products: Analysis of climatologies and theoretical uncertainties. J. Geophys. Res. 2013, 118. [Google Scholar] [CrossRef]
- Tucker, C.J.; Pinzon, J.E.; Brown, M.E.; Slayback, D.A.; Pak, E.W.; Mahoney, R.; Vermote, E.F.; Saleous, N.E. An extended AVHRR 8-km NDVI dataset compatible with MODIS and SPOT vegetation NDVI data. Int. J. Remote Sens. 2015, 26, 4485–4498. [Google Scholar] [CrossRef]
- Beck, H.E.; McVicar, T.R.; van Dijk, A.I.J.M.; Schellekens, J.; de Jeu, R.A.M.; Bruijnzeel, L.A. Global evaluation of four AVHRR–NDVI data sets: Intercomparison and assessment against Landsat imagery. Remote Sens. Environ. 2011, 115, 2547–2563. [Google Scholar] [CrossRef]
- Fensholt, R.; Proud, S.R. Evaluation of Earth Observation based global long term vegetation trends—Comparing GIMMS and MODIS global NDVI time series. Remote Sens. Environ. 2012, 119, 131–147. [Google Scholar] [CrossRef]
- Zeng, F.W.; Collatz, G.; Pinzon, J.; Ivanoff, A. Evaluating and quantifying the climate-driven interannual variability in global inventory modeling and mapping studies (GIMMS) normalized difference vegetation index (NDVI3g) at global scales. Remote Sens. 2013, 5, 3918–3950. [Google Scholar] [CrossRef]
- Loveland, T.; Brown, J.; Ohlen, D.; Reed, B.; Zhu, Z.; Yang, L.; Howard, S. ISLSCP II IGBP DISCover and SiB Land Cover, 1992–1993. In Hall, ISLSCP Initiative II Collection. Data Set; Forrest, G., Collatz, G., Meeson, B., Los, S., de Colstoun, E.B., Landis, D., Eds.; Oak Ridge National Laboratory Distributed Active Archive Center: Oak Ridge, Tennessee, TN, USA, 2009. [Google Scholar]
- Friedl, M.A.; Sulla-Menashe, D.; Tan, B.; Schneider, A.; Ramankutty, N.; Sibley, A.; Huang, X. MODIS Collection 5 global land cover: Algorithm refinements and characterization of new datasets. Remote Sens. Environ. 2010, 114, 168–182. [Google Scholar] [CrossRef]
- Wu, J.; Gao, X. A gridded daily observation dataset over China region and comparison with the other datasets. Chin. J. Geophys. 2013, 56, 1102–1111. [Google Scholar]
- Kalnay, E.; Kanamitsu, M.; Kistler, R.; Collins, W.; Deaven, D.; Gandin, L.; Iredell, M.; Saha, S.; White, G.; Woollen, J.; et al. The NCEP/NCAR 40-year reanalysis project. Bull. Amer. Meteor. Soc. 1996, 77, 437–471. [Google Scholar] [CrossRef]
- Harris, I.; Jones, P.D.; Osborn, T.J.; Lister, D.H. Updated high-resolution grids of monthly climatic observations–the CRU TS3. 10 Dataset. Int. J. Climatol. 2014, 34, 623–642. [Google Scholar] [CrossRef]
- Wen, Q.H.; Zhang, X.; Xu, Y.; Wang, B. Detecting human influence on extreme temperatures in China. Geophys. Res. Lett. 2013, 40, 1171–1176. [Google Scholar] [CrossRef]
- Peng, S.; Piao, S.; Ciais, P.; Myneni, R.B.; Chen, A.; Chevallier, F.; Dolman, A.J.; Janssens, I.A.; Penuelas, J.; Zhang, G.; et al. Asymmetric effects of daytime and night-time warming on Northern Hemisphere vegetation. Nature 2013, 501, 88–92. [Google Scholar] [CrossRef] [PubMed]
- Holben, B.N. Characteristics of Maximum Value Composite images from temporal AVHRR data. Int. J. Remote Sens. 1986, 7, 1417–1434. [Google Scholar] [CrossRef]
- Sen, P.K. Estimates of the regression coefficient based on Kendall's tau. J. Am. Stat. Assoc. 1968, 63, 1379–1389. [Google Scholar] [CrossRef]
- Richard, O.G. Statistical Methods for Environmental Pollution Monitoring; John Wiley & Sons: New York, NY, USA, 1987. [Google Scholar]
- Davis, J.C. Statistics and Data Analysis in Geology, 2nd ed.; John Wiley and Sons: New York, NY, USA, 1986; pp. 524–537. [Google Scholar]
- Running, S.W.; Nemani, R.R.; Heinsch, F.A.; Zhao, M.; Reeves, M.; Hashimoto, H. A continuous satellite-derived measure of global terrestrial primary production. BioScience 2004, 54, 547–560. [Google Scholar] [CrossRef]
- Tung, K.K.; Zhou, J. The Pacific’s response to surface heating in 130 yr of SST: La Niña–like or El Niño–like? J. Atmos. Sci. 2010, 67, 2649–2657. [Google Scholar] [CrossRef]
- Durbin, J.; Watson, G.S. Testing for serial correlation in least squares regression, III. Biometrika 1971, 58, 1–19. [Google Scholar] [CrossRef]
- Grekousis, G.; Mountrakis, G.; Kavouras, M. An overview of 21 global and 43 regional land-cover mapping products. Int. J. Remote Sens. 2015, 36, 5309–5335. [Google Scholar] [CrossRef]
- Hansen, M.C.; Reed, B. A comparison of the IGBP DISCover and University of Maryland 1 km global land cover products. Int. J. Remote Sens. 2000, 21, 1365–1373. [Google Scholar] [CrossRef]
- Friedl, M.A.; McIver, D.K.; Hodges, J.C.F.; Zhang, X.Y.; Muchoney, D.; Strahler, A.H.; Woodcock, C.E.; Gopal, S.; Schneider, A.; Cooper, A.; et al. Global land cover mapping from MODIS: Algorithms and early results. Remote Sens. Environ. 2002, 83, 287–302. [Google Scholar] [CrossRef]
- Latifovic, R.; Olthof, I. Accuracy assessment using sub-pixel fractional error matrices of global land cover products derived from satellite data. Remote Sens. Environ. 2004, 90, 153–165. [Google Scholar] [CrossRef]
- Zhao, X.; Hu, H.; Shen, H.; Zhou, D.; Zhou, L.; Myneni, R.; Fang, J. Satellite-indicated long-term vegetation changes and their drivers on the Mongolian Plateau. Landsc. Ecol. 2015, 30, 1599–1611. [Google Scholar] [CrossRef]
- Mao, J.; Ribes, A.; Yan, B.; Shi, X.; Thornton, P.E.; Seferian, R.; Ciais, P.; Myneni, R.B.; Douville, H.; Piao, S.; et al. Human-induced greening of the northern extratropical land surface. Nat. Clim. Chang. 2016, 6, 959–963. [Google Scholar] [CrossRef]
- Liu, Y.; Wang, E.; Yang, X.; Wang, J. Contributions of climatic and crop varietal changes to crop production in the North China Plain, since 1980s. Glob. Chang. Biol. 2010, 16, 2287–2299. [Google Scholar] [CrossRef]
- Goetz, S.J.; Bunn, A.G.; Fiske, G.J.; Houghton, R.A. Satellite-observed photosynthetic trends across boreal North America associated with climate and fire disturbance. Proc. Natl. Acad. Sci. 2005, 102, 13521–13525. [Google Scholar] [CrossRef] [PubMed]
- Bond-Lamberty, B.; Peckham, S.D.; Ahl, D.E.; Gower, S.T. Fire as the dominant driver of central Canadian boreal forest carbon balance. Nature 2007, 450, 89–92. [Google Scholar] [CrossRef] [PubMed]
- Zhou, L.; Dickinson, R.E.; Tian, Y.; Fang, J.; Li, Q.; Kaufmann, R.K.; Tucker, C.J.; Myneni, R.B. Evidence for a significant urbanization effect on climate in China. Proc. Natl. Acad. Sci. 2004, 101, 9540–9544. [Google Scholar] [CrossRef] [PubMed]
- IPCC. Climate change 2013: The physical science basis, the contribution of Working Group I to the Fifth Assessment Report of the Intergovernmental Panel on Climate Change; Cambridge University Press: Cambridge, UK, 2013; ISBN 978-1-107-05799-1. [Google Scholar]
- Wu, D.; Zhao, X.; Liang, S.; Zhou, T.; Huang, K.; Tang, B.; Zhao, W. Time-lag effects of global vegetation responses to climate change. Glob. Chang. Biol. 2015, 21, 3520–3531. [Google Scholar] [CrossRef] [PubMed]
- Liu, Y.; Lei, H. Responses of natural vegetation dynamics to climate drivers in China from 1982 to 2011. Remote Sens. 2015, 7, 10243–10268. [Google Scholar] [CrossRef]
- Liu, X.; Zhu, X.; Li, S.; Liu, Y.; Pan, Y. Changes in growing season vegetation and their associated driving forces in China during 2001–2012. Remote Sens. 2015, 7, 15517–15535. [Google Scholar] [CrossRef]
- Zhu, Z.; Fu, Y.; Woodcock, C.E.; Olofsson, P.; Vogelmann, J.E.; Holden, C.; Wang, M.; Dai, S.; Yu, Y. Including land cover change in analysis of greenness trends using all available Landsat 5, 7, and 8 images: A case study from Guangzhou, China (2000–2014). Remote Sens. Environ. 2016, 185, 243–257. [Google Scholar] [CrossRef]
- Xin, Z.; Xu, J.; Zheng, W. Spatiotemporal variations of vegetation cover on the Chinese Loess Plateau (1981–2006): Impacts of climate changes and human activities. Sci. China Ser. D-Earth Sci. 2008, 51, 67–78. [Google Scholar] [CrossRef]
- Liu, J.; Kuang, W.; Zhang, Z.; Xu, X.; Qin, Y.; Ning, J.; Zhou, W.; Zhang, S.; Li, R.; Yan, C.; et al. Spatiotemporal characteristics, patterns, and causes of land-use changes in China since the late 1980s. J. Geogr. Sci. 2014, 24, 195–210. [Google Scholar] [CrossRef]
- Jiang, M.; Tian, S.; Zheng, Z.; Zhan, Q.; He, Y. Human Aactivity influences on vegetation cover changes in Beijing, China, from 2000 to 2015. Remote Sens. 2017. [Google Scholar] [CrossRef]


| Class Name | South China | Class Name | North China | ||
|---|---|---|---|---|---|
| Range | Mean | Range | Mean | ||
| evergreen needleleaf forest | 0.51–0.65 | 0.58 | evergreen needleleaf forest | 0.36–0.63 | 0.50 |
| evergreen broadleaf forest | 0.60–0.74 | 0.69 | deciduous broadleaf forest | 0.57–0.63 | 0.61 |
| deciduous broadleaf forest | 0.69–0.78 | 0.74 | mixed forests | 0.49–0.74 | 0.63 |
| mixed forests | 0.60–0.77 | 0.70 | closed shrubland | 0.40–0.59 | 0.50 |
| woody savannas | 0.56–0.72 | 0.64 | open shrubland | 0.11–0.38 | 0.17 |
| grassland | 0.33–0.66 | 0.50 | grassland | 0.16–0.56 | 0.32 |
| cropland | 0.45–0.67 | 0.57 | cropland | 0.34–0.58 | 0.48 |
| Regions | Forest Cover Changes from Yearbook (%) | Forest Cover Changes from Land Cover Data (%) | Accumulated Planted Forest (10 Hectare/Hectare) | Urbanization (%) | Fire (%) |
|---|---|---|---|---|---|
| Shanxi | 9.92 | 10.81 | 4.67 | 0.65 | 0.11 |
| Shaanxi | 17.27 | 25.71 | 3.94 | 0.42 | −80.33 * |
| Jiangsu | 11.78 | 3.52 | 1.06 | 3.55 | −47.48 * |
| Ningxia | 10.35 | 0.16 | 2.71 | 0.60 | −42.49 |
| Guangxi | 31.17 | 30.37 | 1.91 | 0.46 | −21.84 |
| Fujian | 15.35 | 4.69 | 0.87 | 0.98 | 10.68 |
© 2017 by the authors. Licensee MDPI, Basel, Switzerland. This article is an open access article distributed under the terms and conditions of the Creative Commons Attribution (CC BY) license (http://creativecommons.org/licenses/by/4.0/).
Share and Cite
Hua, W.; Chen, H.; Zhou, L.; Xie, Z.; Qin, M.; Li, X.; Ma, H.; Huang, Q.; Sun, S. Observational Quantification of Climatic and Human Influences on Vegetation Greening in China. Remote Sens. 2017, 9, 425. https://doi.org/10.3390/rs9050425
Hua W, Chen H, Zhou L, Xie Z, Qin M, Li X, Ma H, Huang Q, Sun S. Observational Quantification of Climatic and Human Influences on Vegetation Greening in China. Remote Sensing. 2017; 9(5):425. https://doi.org/10.3390/rs9050425
Chicago/Turabian StyleHua, Wenjian, Haishan Chen, Liming Zhou, Zhenghui Xie, Minhua Qin, Xing Li, Hedi Ma, Qinghan Huang, and Shanlei Sun. 2017. "Observational Quantification of Climatic and Human Influences on Vegetation Greening in China" Remote Sensing 9, no. 5: 425. https://doi.org/10.3390/rs9050425