Article

Rural Settlement Subdivision by Using Landscape Metrics as Spatial Contextual Information

1
Institute of Agriculture Remote Sensing and Information Technology, College of Environmental and Resource Sciences, Zhejiang University, Hangzhou 310058, China
2
Institute of Land and Urban-rural development, Zhejiang University of Finance & Economics, Hangzhou 310019, China
3
Institute of Zhejiang Land Surveying and Planning, Hangzhou 310007, China
*
Authors to whom correspondence should be addressed.
Remote Sens. 2017, 9(5), 486; https://doi.org/10.3390/rs9050486
Submission received: 8 March 2017 / Revised: 11 May 2017 / Accepted: 14 May 2017 / Published: 16 May 2017

Abstract

:
Multiple policy projects have changed land use and land cover (LULC) in China’s rural regions over the past years, resulting in two types of rural settlements: new-fashioned and old-fashioned. Precise extraction of and discrimination between these two settlement types are vital for sustainable land use development. It is difficult to identify these two types via remote sensing images due to their similarities in spectrum, texture, and geometry. This study attempts to discriminate different types of rural settlements by using a spatial contextual information extraction method based on Gaofen 2 (GF-2) images, which integrate hierarchical multi-scale segmentation and landscape analysis. A preliminary LULC map was derived by using only traditional spectral and geometrical features from a finer scale. Subsequently, a vertical connection was built between superobjects and subobjects, and landscape metrics were computed. The vertical connection was used for assigning landscape contextual information to subobjects. Finally, a classification phase was conducted, in which only multi-scale contextual information was adopted, to discriminate between new-fashioned and old-fashioned rural settlements. Compared with previous studies on multi-scale contextual information, this paper employs landscape metrics to quantify contextual characteristics, rather than traditional spectral, textural, and topological relationship information, from superobjects. Our findings indicate that this approach effectively identified and discriminated two types of rural settlements, with accuracies over 80% for both producers and users. A comparison with a conventional top-down hierarchical classification scheme showed that this novel approach improved accuracy, precision, and recall. Our results confirm that multi-scale contextual information with landscape metrics provides valuable spatial information for classification, and indicates the practicability, applicability, and effectiveness of this synthesized approach in distinguishing different types of rural settlements.

Graphical Abstract

1. Introduction

Detailed and precise information on land use and land cover (LULC) in rural areas is essential to establish sustainable rural development and ecosystem management [1,2]. After years of China’s policies such as land exploitation, consolidation, rehabilitation, and the “new countryside” policy, rural settlements have changed enormously in terms of their amount, location, composition, and configuration [3,4]. This has resulted in two distinct types of rural settlements: new-fashioned rural settlements and old-fashioned rural settlements.
Old-fashioned rural settlements are disorderly and contain poor rural housing conditions as a consequence of being built in previous decades. New-fashioned rural settlements are brand new standardized rural communities constructed in recent years [5,6,7]. These two settlement types are not only different in building age, but also different in architectural style (Figure 1). Their differences in architectural style are exhibited by three aspects: composition, morphology, and location. In old-fashioned rural settlements, settlement units usually consist of housing, affiliated facilities (livestock pens and barns), gardens, woodlands, etc. Morphologically, old-fashioned settlement buildings are clustered and have various orientations. There is no identical interval between old-fashioned settlement buildings, and old-fashioned settlements are usually located close to rivers and streams for transport and water supply. In contrast, the units of new-fashioned settlements usually encompass neatly arranged standardized buildings which are surrounded by less vegetation cover and these settlements are usually close to roads for easy transportation routes. Therefore, these two types of settlements have entirely different landscape characteristics [6].
Inefficient planning of these disorderly, clustered, and even vacant old-fashioned rural settlements has created a serious waste of land resources [6,8]. On the other hand, the new-fashioned rural settlements are standardized communities with accurate architectural design and efficient land use management. These policy projects across China have brought about obvious land use changes, which impact the livelihood of rural residents [6]. Crucially, this phenomenon has created a need for detailed approaches in distinguishing between these two types of rural settlement to catch up with rapid social development. Poor management can lead to a tremendous waste of land resources, impacting food security and causing the degradation of natural ecosystems [9]. In previous studies, the concept of lacunarity has been used to identify urban slums using high-resolution satellite imagery [10]. Kuffer developed a morphological unplanned settlement index to differentiate urban settlement patches in metropolitan areas [11].
Although the grey level co-occurrence matrix (GLCM) method and shape measures are widely accepted for classifying different LULC types [12,13], these conventional approaches only take spectral, textural, and shape information into consideration, and therefore encounter serious problems in discriminating heterogeneity between different settlement categories because they share similar properties. Hence, more spatial information is required in the classification process to differentiate old-fashioned and new-fashioned settlements. For instance, the integration of effective mesh size and local indicators of spatial association (LISA) texture images could significantly improve the classification only using spectral images [14]. The triangulated primitive neighborhood method (TPN) could generate more valuable information than the GLCM method [15].
Spatial and contextual properties extracted from both pixel-based and object-based image analysis make valuable contributions in improving classification accuracy [16,17]. Contextual information was first proposed based on the first law of geography [18]. Generally, when a pixel belongs to a certain class, the probability that its neighboring pixels belong to the same class increases [19]. Recently, advancing research is incorporating contextual information on relationships between the target object and its surrounding environment [20]. This relationship information, derived from pixels or objects in remote sensing imagery, is called spatial contextual information [21,22]. Spatial contextual information can be used in various data sets—including multispectral imagery [23], synthetic aperture radar (SAR) [24], and LiDAR data [25]—as well as for different extraction purposes, such as forest fire mapping [26], cloud detection [27], and building detection [28]. To minimize omission errors in mapping burned areas viewed in Landsat data, a hybrid contextual algorithm was used as a second phase to improve the delimitation of burned patches based on logistic regression analysis [23]. Contextual shadow information was evaluated for building detection by combining high resolution images and LiDAR data [25]. A practical method was proposed to discriminate clouds from snow through combining spectral reflectance with spatial–temporal contextual information [27].
Inspired by Li’s spatial contextual analysis categories [20], we divided spatial contextual techniques into four categories: (1) probabilistic graphical models (PGM); (2) texture information extraction; (3) image segmentation and object-based image analysis (OBIA); and (4) geospatial information analysis techniques. PGM techniques such as Markov random fields (MRF) [19,29] and conditional random fields (CRF) [30] are standard techniques for considering context in classification processes. Texture describes the spatial arrangement of repetitions of tones, and is often used to quantify the variability of pixels in a neighborhood. For example, Pacifici utilized multi-scale texture analysis to produce over 190 textual features for urban land use classification [12]. Spatial contextual information has been incorporated in the image segmentation process, with each segment containing spatially contiguous and homogenous pixels. Region-growing segmentation methods like the fractal net evolution approach (FNEA) are prevalent in the fields of photogrammetry and remote sensing [31]. Moreover, in the group of geospatial information analysis techniques, spatial autocorrelation metrics, such as Moran’s Index and Getis statistic have been used as textural features for image classification [32]. LISA measures [14] and lacunarity [33,34] are also considered important components for OBIA classification procedures. These four categories of spatial contextual techniques make up a large body of related literature: research applying various extraction approaches to generate different kinds of needed contextual information.
However, there are multiple disadvantages in these conventional contextual techniques. To begin with, most of those contextual analysis approaches are pixel-based, and therefore ignore the relationship information between objects in OBIA. In addition, some geographical knowledge based approaches only extract limited amounts of contextual information. For instance, the use of only lacunarity is insufficient for classification in some circumstances [35].
Current studies have highlighted a new process, the multi-scale spatial contextual information extraction approach, which synthesizes spatial contextual information and multi-scale segmentation techniques. Binaghi introduced a cognitive–pyramidal extraction method for contextual information by employing a set of concentric windows at different scales around the target element [21]. Binaghi’s findings suggest that contextual information extraction should require considerably larger windows than those employed in traditional digital image classification studies with a 3 × 3 to 9 × 9 matrix of pixels [36]. Bruzzone proposed a multi-level context feature extraction module for classification by exploiting hierarchical multi-level segmentation structures [37]. Hofmann demonstrated a methodology of detecting informal settlements from QuickBird data based on ontology; in this methodology, contextual information was derived from generating two segmentation levels [38]. Johnson utilized superobject variables from coarser segmentations to improve classification accuracy [39]. Han used a similar approach [40], and improved this process further by creating a five-level segmentation to calculate both spectral and textural metrics [41]. All these methodologies extracted contextual information based on multi-scale objects; however, the means used for quantifying spatial contextual information were still simple. For example, most of them chose mean spectral value of superobjects and topological relationship as contextual information.
A previous study proposed using landscape analysis and satellite image annotation for discriminating settlement and industrial areas [35]. In contrast, in this paper, we apply this method to differentiate between two types of rural settlements and we have made improvements to the method by using multi-resolution segmentation (MRS) algorithm and two-level segmentation structure. Although landscape metrics were not originally designed for such classification, landscape analysis could be a simple and effective means of quantifying spatial contextual features for classification. In addition, a variety of landscape metrics could be chosen to characterize contextual behavior. This shows the significance of integrating landscape analysis with a multi-scale contextual information extraction approach in classification applications.
New-fashioned and old-fashioned rural settlements show similar spectral, textural, and geometrical properties. However, they show entirely different landscape characteristics at the community scale (Figure 2). These heterogeneous landscape characteristics can be described by landscape metrics as particular spatial units, that is, as land use units or landscape units [35]. Thus, landscape metrics contain the spatial contextual information of different land use objects, and therefore landscape metrics have the potential to be integrated into object-based classification.
In this paper, to discriminate different types of rural settlements, we present a novel approach for extracting spatial contextual information by combining hierarchical multi-scale segmentation and landscape analysis, thereby achieving the following objectives:
(1)
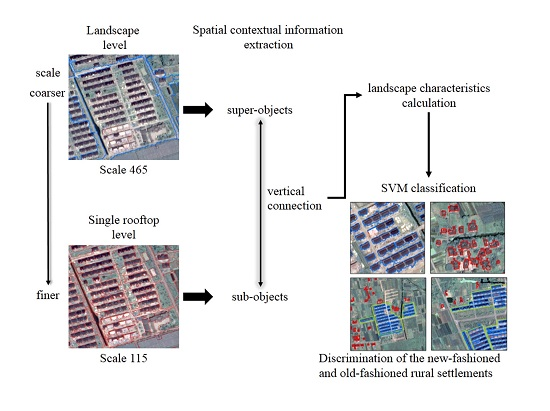
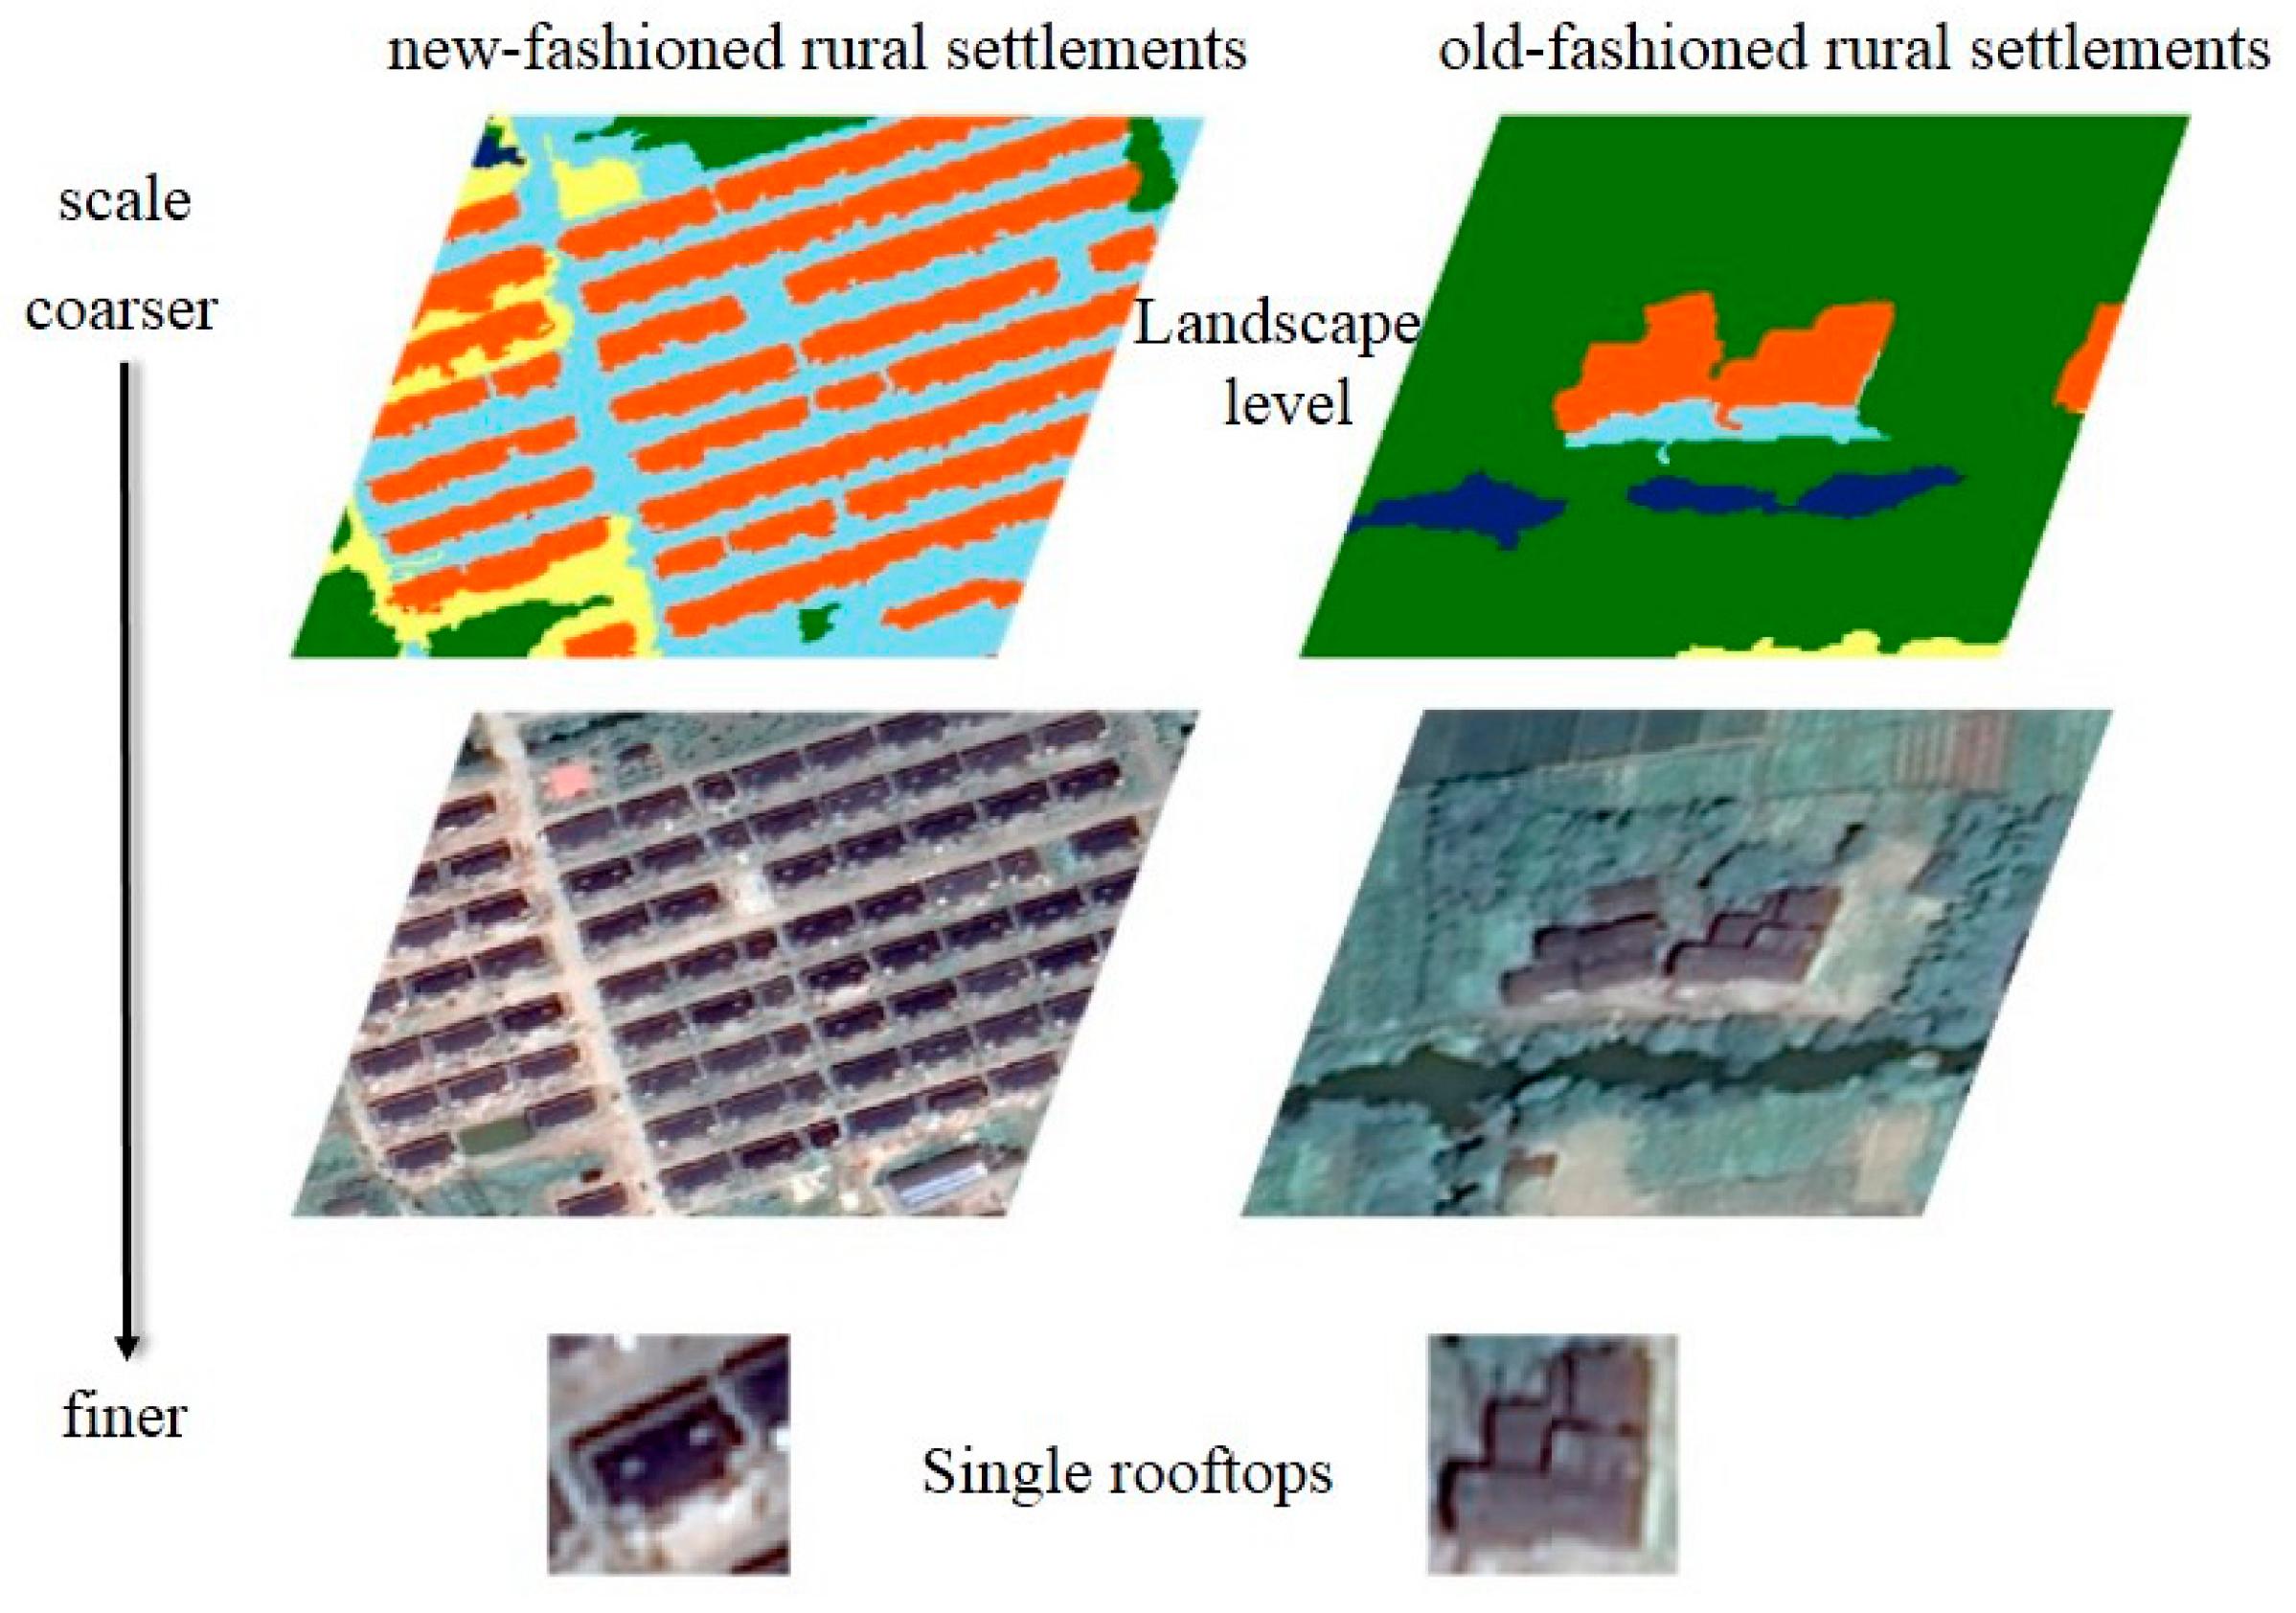
Create a two-level hierarchical segmentation (a finer scale and a coarser scale) using Gaofen 2 (GF-2) data to identify different LULC features. For example, detailed LULC features such as rooftops, houses, roads, and farmlands can be identified from the finer scale, and LULC feature aggregations such as settlement communities, forests, and agriculture fields can be identified from the coarser scale.
(2)
Derive a land cover map at the finer scale using traditional spectral and geometrical features. Furthermore, use this map to enable landscape contextual information extraction by building a vertical connection between subobjects (that is, the segments of detailed LULC features) and superobjects (the segments that they are located within).
(3)
Assign landscape metric information to subobjects, and undertake a second classification incorporating only multi-scale landscape contextual information.
The aim of this study is to establish an approach which completely exploits the contextual information in OBIA and discriminates between new-fashioned and old-fashioned rural settlements with satisfactory accuracy.

2. Materials and Methods

2.1. Study Area

Longxiang subdistrict is selected as the study area and is located in Tongxiang County, Zhejiang Province (120°30′55″E, 30°40′30″W, Figure 3). Longxiang subdistrict has an area of 39.83 km2, and represents a typical rural environment in the Yangtze River Delta. It has a subtropical climate with a clear monsoonal character and four distinct seasons [42]. The annual average temperature and total annual precipitation are approximately 16.5 °C and 1246.7 mm, respectively. Due to the excellent climate and soil conditions, this place has an ideal environment for grain production. Since the 2000, many land exploitation, consolidation, and rehabilitation projects have taken place in this district. Therefore, Longxiang subdistrict study site contains a large number of new-fashioned rural settlements and old-fashioned settlements.

2.2. Data and Preprocessing

Besides those frequently-used Very High Resolution (VHR) Imagery (e.g., IKONOS, QuickBird and WorldView), Chinese Gaofen Satellites (GF-1 and GF-2) are regarded as suitable inputs in LULC application [43,44,45]. In this research, PMS sensor imagery of GF-2 satellite was selected. The PMS imagery includes four multispectral bands (MSS) with a spatial resolution of 3.2 m, and a panchromatic band (PAN) in sub-metric resolution of 0.8 m. This image was acquired on 22 July 2016, with a cloud-free and haze-free atmospheric condition for the whole coverage, thus there was no need for atmospheric correction in the preprocessing step. The MSS image and PAN image were orthorectified into the Universal Transverse Mercator (UTM) projection system, and fused using Gram–Schmidt pan-sharpening method in ENVI (v5.1, Exelis Visual Information Solutions, Boulder, CO, USA, 2014). Eventually, the fused image of 0.8 m spatial resolution was used in the following classification process. The study area was then extracted using the boundary of Longxiang.
GF-2 is the first Chinese satellite with sub-metric spatial resolution for civil use, and provides a good image quality with fine spatial resolution (subset image data contains 13,000 × 10,000 pixels). Except those original multispectral bands, Normalized Difference Vegetation Index (NDVI) was also applied. Ancillary datum was collected in this study in the form of land-use planning maps (provided by the Institute of Zhejiang Land Surveying and Planning) for rural villages, and was employed at the accuracy assessment step. This map was derived by visual interpretation of 0.5-m spatial resolution aerial photography and corrected by ground survey.

2.3. Methodology

The overall framework of this research is shown in Figure 4. Following preprocessing and pan-sharpening, a finer scale and a coarser scale segmentation were conducted, respectively, on a GF-2 image. Through feature selection and cross validation, the optimal features and parameters were obtained. Only traditional spectral and geometrical features were integrated into this classification phase, in order to get a preliminary LULC map using the finer scale segments. Subsequently, a vertical connection was built between superobjects and subobjects, and landscape metrics were calculated based on the preliminary LULC map. The vertical connection was utilized for assigning landscape contextual information to subobjects. A final classification phase was conducted by using only multi-scale contextual information to discriminate the two types of rural settlements. In order to verify whether the proposed method effectively improved classification accuracy, this study used a conventional top-down hierarchical classification scheme for comparison.

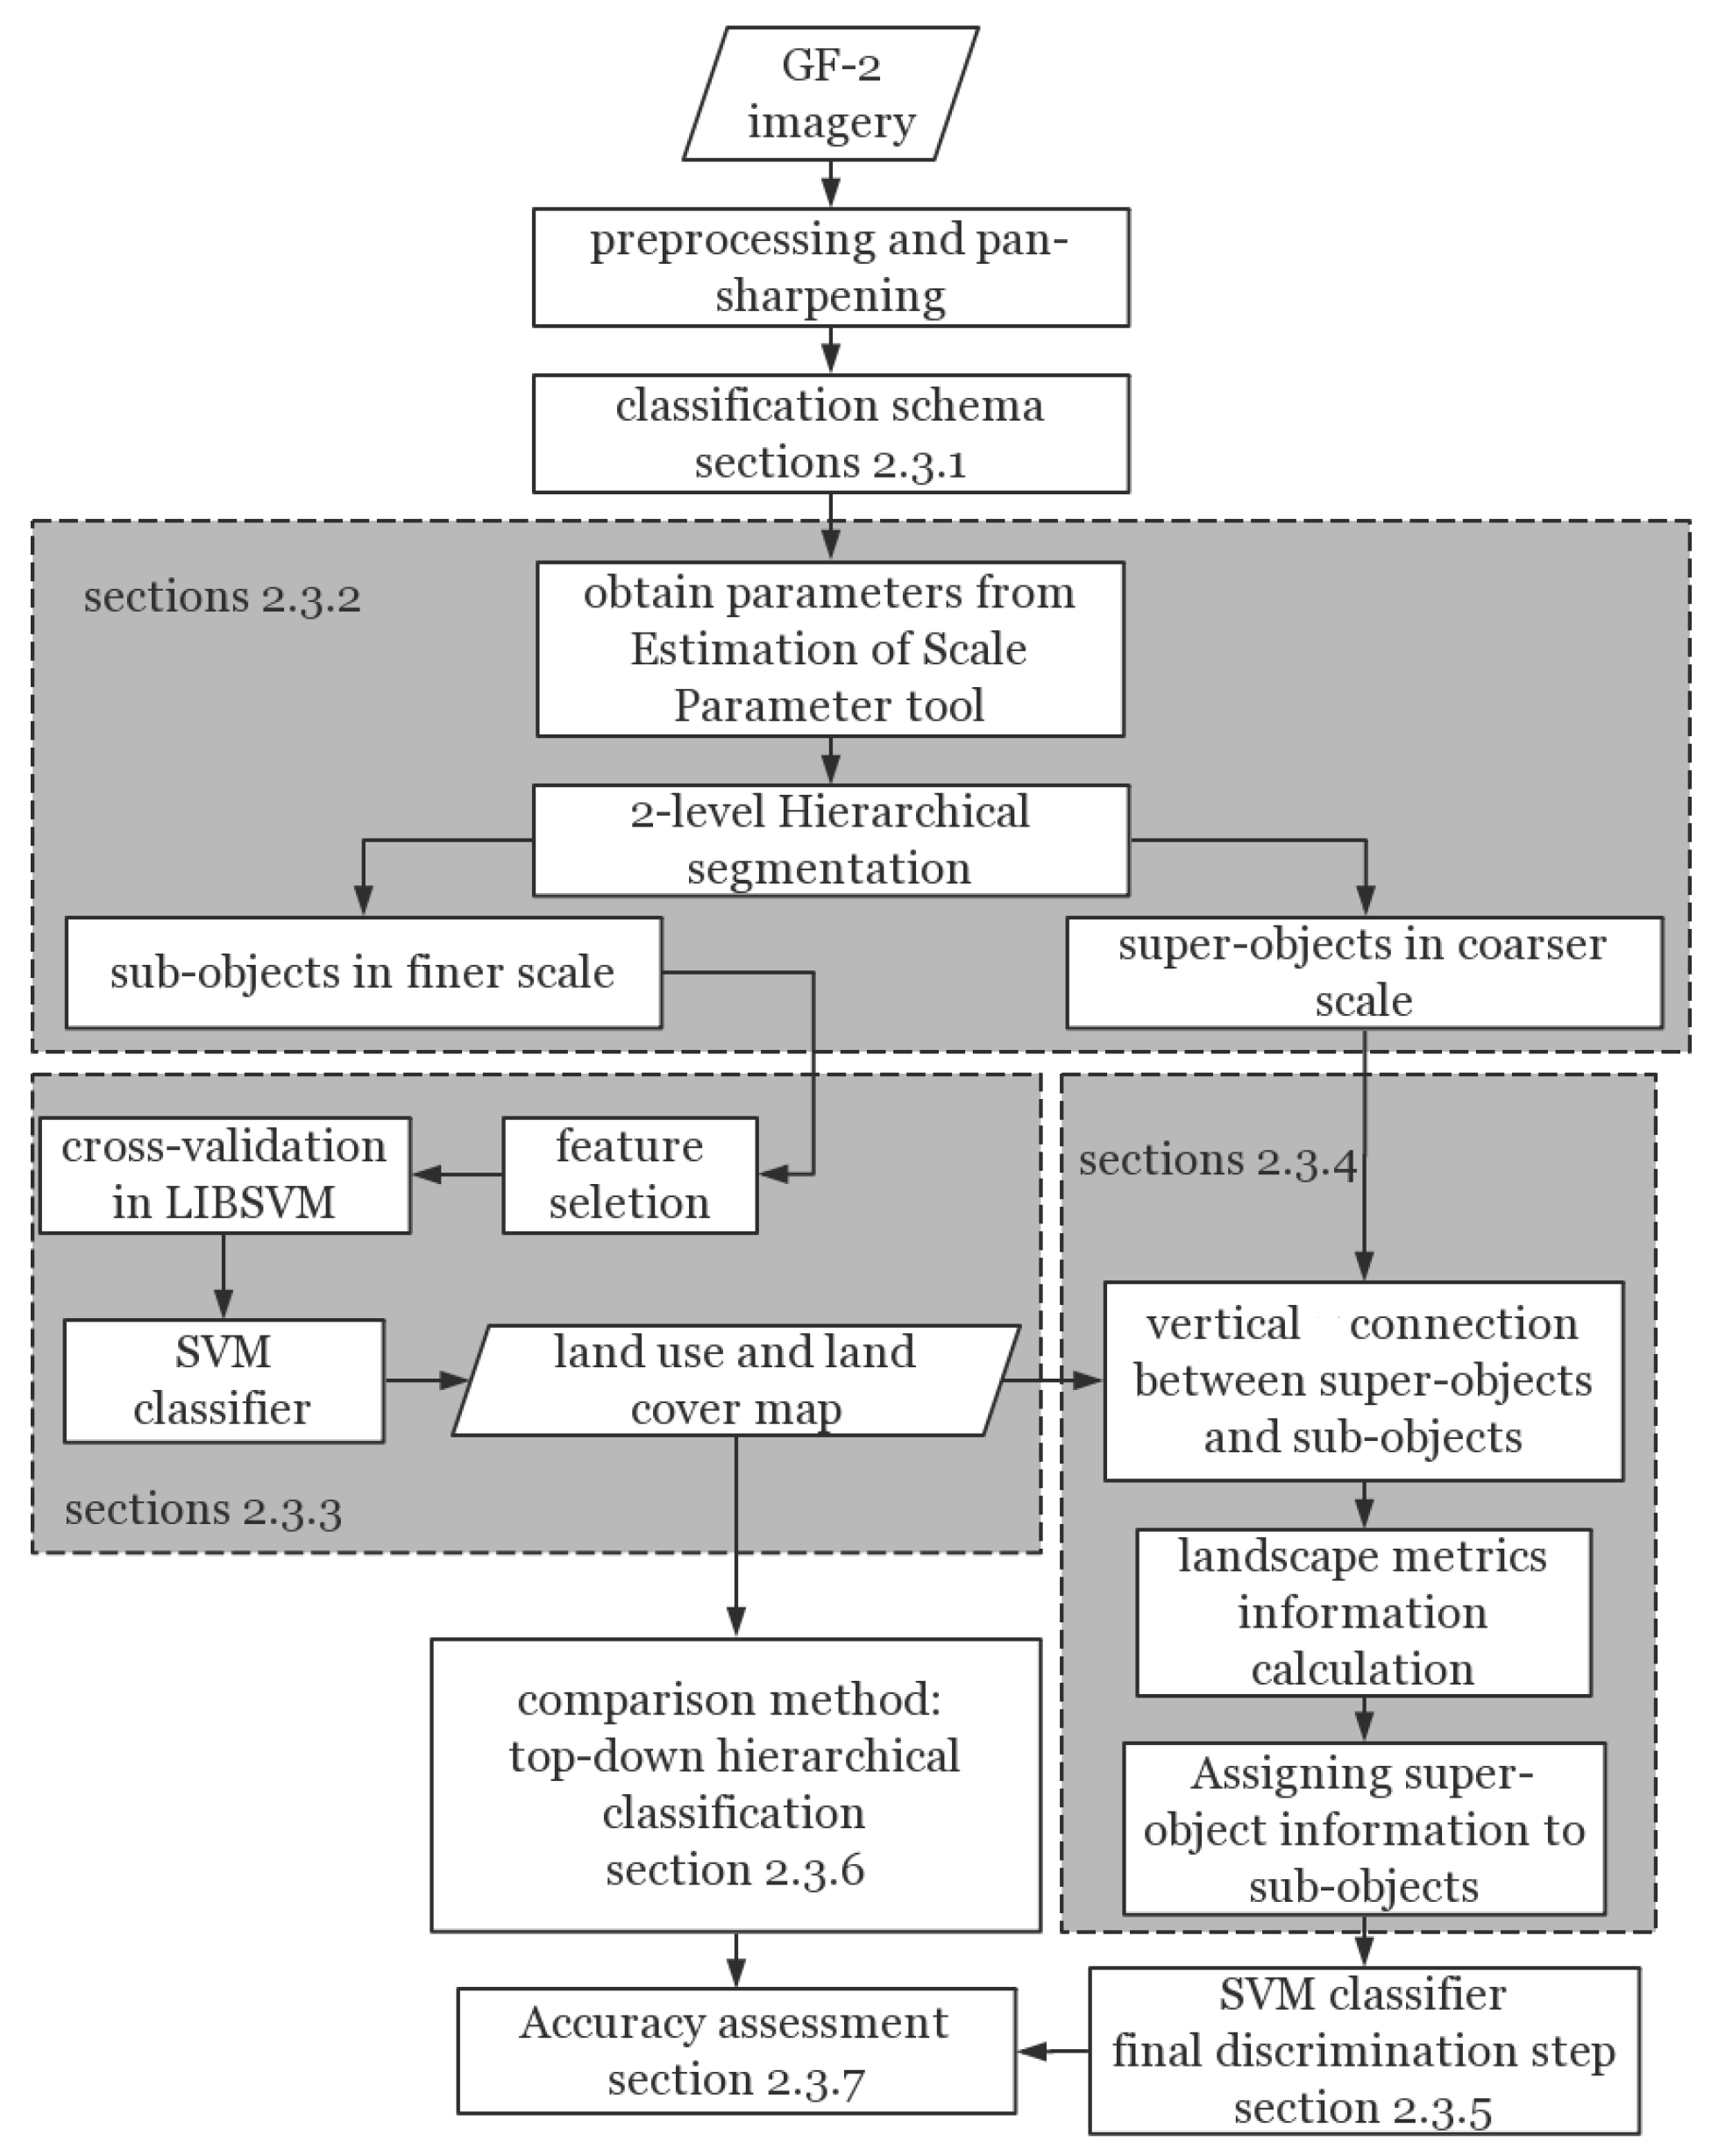
2.3.1. Classification Schema

Based on visual investigation throughout the whole remote sensing image subset, a three-level hierarchical classification scheme was developed (Table 1). In the first level, land cover land use classes were classified into two major types: artificial and non-artificial surface materials. Next, these materials were subdivided into seven categories: water bodies (including rivers, ponds, and streams); vegetation (including farmland, woodland, and shrubs); bare soil; industrial warehouse (mainly blue metal rooftops); asphalt; high-albedo impervious surface; and low-albedo rooftops. Normally, low albedo impervious surfaces (ISAL) include low-albedo rooftops and asphalt roads. Low-albedo rooftops and asphalt could be distinguished successfully at Level 2 because they have different geometrical features (compactness, shape index, and density). The rooftop material in rural areas was mainly clay, and low-albedo rooftops dominated all rural settlements. In the third level, high-albedo impervious surfaces were subdivided into concrete (mainly country roads) and greenhouse by using traditional attributes. Low-albedo rooftops were subdivided into new-fashioned and old-fashioned rural settlements by using the novel discrimination approach proposed in this paper. Figure 5 presents some examples of LULC cover types throughout the rural area.

2.3.2. Two-Level Segmentation

After image preprocessing, segmentation algorithm was operated twice in two-level scales, generating finer and coarser scale objects (segments). In this paper, the wide-use multi-resolution segmentation algorithm (MRS) was adopted using eCognition® software package (v9.0, Trimble Germany GmbH, Munich, Germany, 2014) [16]. MRS is also known as Fractal Net Evolution Approach (FNEA), which is based on region growing methods and three homogeneity criteria: scale parameter, shape, and compactness [46]. Optimum segmentation parameters were usually obtained by subjective manual trial-and-error test. However, in our two-level segmentation framework, an objective method named Estimation of Scale Parameter (ESP) 2 tool [47] was used to identify the candidate scale parameters. The ESP2 tool iteratively generates objects at multiple scale levels in fixed step sizes and calculates the local variance (LV) in each scale. The rates of change of LV (ROC-LV) were plotted against the corresponding scales in Figure 6. Based on this plot diagram, the peaks of the curve indicate appropriate scale parameters for segmentation [48,49]. The scale of 115 appeared promising as the first sharp break in ROC-LV curve after continuous and abrupt decay. As a result, we set 115 as the finer segmentation scale. After visual judgment on candidate scales around 500, we chose 465 as the coarser scale. Dotted vertical lines indicated the optimal scale parameters in Figure 6.
Shape and color criteria were set equally as 0.5, because we wanted to treat spectral and geometrical information equally. Both smoothness and compactness weights were set equally as 0.5, because we wanted to extract both compact and non-compact land cover features. These four equal parameters were tested, and found suitable for both artificial and non-artificial features. Four multispectral bands of GF-2 data and NDVI were used as the input raster layers for segmentation procedure, which were assigned equal weights of 1.

2.3.3. Preliminary Classification

Land-cover classification was performed on the finer scale segmentation result, extracting preliminary LULC features throughout the whole study area. Based on the three-level hierarchical classification scheme, water body, vegetation, bare soil, industrial warehouse, asphalt, concrete, greenhouse, and low albedo impervious surface rooftop were identified by Support Vector Machine (SVM) classifier [50]. The SVM is a common supervised learning algorithm which establishes a classification hyperplane as the decision curved surface. SVM has been demonstrated to provide reliable performance in many remote sensing classification problems [50]. In the feature selection step, a wrapper method in Weka software (v3.8, University of Waikato, New Zealand, 2016) was adopted to identify significant features of optimal class separation [42]. The Weka wrapper tool evaluated attribute sets by using a learning scheme. Cross validation was used to estimate the accuracies for every set of attributes [51]. Eventually, mean values and standard deviation of all image bands, brightness, Max. Diff., NDVI, geometrical features (compactness, shape index, and density) were selected as the optimal feature subset in SVM classifier. All these features were normalized before classification procedure. A SVM Radial Basis Function (RBF) kernel was applied using the optimal parameters (the gamma value and penalty parameter) obtained from LIBSVM [52]. LIBSVM tool employed five-fold cross-validation to evaluate the accuracies of the learning scheme for each set. SVM has showed additional robustness to small data samples [50]. In this study. Only 300 segments were collected as samples in the classification phase. The two-level segmentation generated approximately 25,000 image objects at the finer scale of 115. As a result, approximately 1.2% of the whole image objects were used in SVM classifier. Table 2 summarized classification objects, attributes, and method of this entire three-level classification framework.

2.3.4. Vertical Connection and Landscape Metrics Calculation

As mentioned previously in the segmentation operation, a two-level hierarchy was produced in which segments generated at the finer scale were nested inside objects generated at the coarser scale. This multi-resolution segmentation followed the region-merging algorithm; therefore, vertically connected objects (superobjects and subobjects) should obey the spatial rules that a subobject from a finer scale be entirely within its superobject and that subobjects cannot extend beyond the boundary of their superobjects. The spatial join tool in ArcGIS (v10.1, Esri Inc., Redlands, CA, USA) was used for building vertical connections between superobjects and subobjects. Based on the preliminary classification result, we calculated landscape metrics using FRAGSTATS software [53]. Therefore, in the landscape metrics calculation step, segments from the coarser scale were regarded as spatial landscape units, and all the metrics were computed at the landscape level for each landscape unit. Landscape metrics that characterize the properties of area, shape, edge, aggregation, and diversity were collected into feature spaces for classification. The percentage of landscape (PLAND) of each LULC type, patch density (PD), edge density (ED), landscape shape index (LSI), and Shannon’s diversity index (SHDI) were calculated in our approach. Once these landscape statistics were derived, vertical connection was employed, and eventually the subobjects from the finer scale (that is, segments generated using a scale parameter of 115) were assigned the landscape statistics of their superobjects from the coarser scale (segments generated using a scale parameter of 465). All subobjects of low-albedo rooftops which contained the superobjects’ landscape metrics were employed in the subsequent discrimination process.

2.3.5. Discrimination between New-Fashioned and Old-Fashioned Rural Settlements

In this classification procedure, only landscape metric statistics were used as input features in SVM classification. These landscape metrics acted as the contextual information for subobjects. The RBF kernel was applied, again using the optimal parameters. A subset of 70 low-albedo rooftop samples were selected from the 300 segments examples in preliminary classification, including 35 samples of old-fashioned settlement and 36 samples of new-fashioned settlement. The final result was that all low-albedo rooftop objects were subdivided into two subclasses: new-fashioned and old-fashioned rural settlements. Thus, nine artificial and non-artificial LULC classes (water bodies; vegetation; bare soil; concrete; greenhouse; industrial warehouse; and asphalt, new-fashioned, and old-fashioned rural settlements) were represented in the final map at the finer scale.

2.3.6. Comparison Method: Top-Down Hierarchical Classification

To provide a comparison, this study also implemented another method to distinguish between these two settlement types. Based on the land cover map derived from the preliminary classification result, a top-down approach was applied.
The same examples used in contextual information classification were selected again, and then the SVM was used to further distinguish new-fashioned and old-fashioned settlements. Compared with the discrimination method using multi-scale contextual information, this top-down classification approach only utilized single-scale object features. The identical features in the preliminary classification step were reimported into the SVM classifier. We found that the new-fashioned and old-fashioned rural settlements were different in compactness and density attributes. Therefore, though only to a certain extent, settlements could be divided into separate categories by applying this method.

2.3.7. Accuracy Assessment and Comparison

In this paper, the proposed classification framework utilizing multi-scale landscape contextual information was compared to a top-down classification approach with single-scale object properties. Accuracy assessments were conducted on the final classification maps (scale 115), with a total of 1520 randomly selected segments for construction of the error matrix. A visual interpretation was conducted to confirm whether the selected segments were correctly classified. During the visual interpretation, a 2016 land use planning map of rural villages was used as reference data. This map contained detailed spatial distribution for the new-fashioned rural settlements, therefore providing the exact locations of the new-fashioned settlements. Eventually, the actual distribution map for the two types of rural settlements was obtained, via visual interpretation, for accuracy assessment. Accuracy statistics, including producer accuracy (PA), user accuracy (UA), and overall accuracy (OA) were calculated based on the error matrix.
In order to compare the accuracies of the two classification results, three commonly used evaluation metrics were adopted: accuracy, precision, and recall [27,54,55]. These metrics were calculated as follows:
Accuracy = (TP + TN)/(TP + TN + FP + FN)
Precision = TP/(TP + FP)
Recall = TP/(TP + FN)
where TP: true positive, TN: true negative, FP: false positive, FP: false negative.
In this research, we regarded rural settlement subdivision as a binary classification. Thus, true positive and true negative were defined as the number of new-fashioned and old-fashioned rural settlements correctly labeled. Precision and recall accuracies were calculated separately for new-fashioned and old-fashioned settlements. Eventually, for comparing discrimination approaches using contextual information and the top-down hierarchical framework, we calculated two accuracy values using Equation (1), four precision values using Equation (2) and four recall values using Equation (3).

3. Results

3.1. Two-Level Segmentation and Preliminary Classification Result

The classification result for the preliminary map is shown in Figure 7, with the hierarchical segmentation results. After visual examination of the output map (Figure 7), semantic meaningful objects are delineated accurately in both finer and coarser scale, and land use and land cover categories are identified successfully.
At the finer scale (115), building rooftops, grain-sunning ground, roads, parking lots, gardens, farmland, etc. can be identified, generating approximately 25,000 image objects. At the coarser scale (465), settlement aggregates, forests, agricultural fields, etc. can be identified, generating over 1600 image objects. This segmentation result is fully consistent with expectations of the classification framework shown in Figure 2. The preliminary classification result was used in the accuracy assessment step conducted on the final map.

3.2. Accuracy Assessment on the Final Map

Based on visual assessment, new-fashioned and old-fashioned rural settlements can be discriminated effectively by using the proposed method. The confusion matrix of the final map is shown in Table 3. Over 1500 segments are randomly collected, with no less than 270 objects, in two types of rural settlements. Because this study focuses on rural areas, over 300 vegetation segments are collected. In summary, these randomly selected objects show the typical characteristics of LULC distribution in rural regions.
We find the new-fashioned settlement type has the highest producer accuracy (PA) value of 96.15%. The PA of the old-fashioned settlement type is greater than 90%. The industrial warehouse type has the highest value of user accuracy (UA). Vegetation and water bodies have relatively high UA values of 96.47% and 91.15%, respectively. Both new-fashioned and old-fashioned rural settlement types have UAs greater than 80%. Hence, settlement areas are classified successfully, with all PA and UA over 80%.
We notice that the PA for bare soil and the UA of asphalt are the two lowest of all classification accuracy results, at 72.28% and 77.78%, respectively. Some bare soil cover in the reference group was misclassified as concrete, and vice versa, leading to decreases in both the PA of bare soil and the UA of concrete. Some asphalt is misclassified as settlements. This is because the spectral characteristics of bare soil and concrete, and of asphalt and settlement rooftops, are similar [17]. Some vegetation cover is misclassified as settlements because these areas are located around buildings and contaminated by shadows. This shadow effect can also lead to misclassification between water bodies and settlements and between concrete and settlements [56].

3.3. Accuracy Comparison

Visual comparison between the two classified maps in Figure 8 shows that the classification approach using contextual information produces relatively improved correspondence between the discrimination result and real conditions. By utilizing contextual information about landscape, new-fashioned rural settlement areas in modern communities are extracted successfully, and scattered old-fashioned settlement areas are detected precisely at the same time. Even in some mixed scenarios of these two different settlement types, multi-scale contextual information has provided valuable spatial information in classification and improved accuracy. However, using a top-down hierarchical classification and conventional single-scale object features, the spatial distribution of the new-fashioned and old-fashioned settlements still remains mixed in some communities.
To further quantitatively assess the accuracy of these two classification results, accuracy, precision, and recall values were evaluated for each approach (Table 4). The multi-scale contextual information approach has achieved good balance between precision and recall, with the highest precision value for old-fashioned rural settlements at 98.09%, indicating that over 98% of the detection results are truly old-fashioned settlements. The lowest value is found in the recall of new-fashioned rural settlements using the top-down hierarchical framework, at 77.83%. In other words, 22.17% of the actual new-fashioned rural settlements in the image are detected as the old-fashioned type. Eventually, our proposed method achieved higher overall discrimination accuracy, at 96.40%. In contrast, the traditional method achieved a lower accuracy of 82.60%.

4. Discussion

4.1. Multi-Scale Contextual Information and Rural Settlement Subdivision

In this paper, we explored a novel multi-scale contextual information extraction technique to generate landscape features for representing the landscape characteristics of different types of rural settlements. Current research indicates a trend towards methodologies with a cognitive pyramid [21], ontology using multi-level segmentation [38] and superobject metrics [39]. Inspired by Li’s spatial contextual analysis categories [20], we categorized these spatial contextual analyses as multi-scale contextual information techniques. Multi-scale contextual information has the potential to provide valuable information in image classification, and this technique can be adapted for rural settlement subdivisions. Although new-fashioned and old-fashioned rural settlements share similar characteristics of spectrum, texture, and geometry in subobjects, they show contrasting landscape characteristics in aggregates and communities in superobjects. Since new-fashioned and old-fashioned rural settlement communities are different in composition, morphology, location, etc., multi-scale contextual analysis can capture these heterogeneous landscape characteristics.

4.2. Landscape Metrics and Spatial Contextual Information

Landscape metrics are designed to describe heterogeneous landscape characteristics at certain spatial scales [57]. In other words, landscape metrics contain the spatial contextual information for different land use objects. Although landscape metrics were not originally designed for the classification phase of image processing, some studies have suggested and succeeded in using landscape metrics for image classification [35].
The wide range of landscape metrics available allows landscape-metrics-based contextual information to have the potential to integrate relationship information between the target object and its surroundings to its maximum capability. Thus, landscape analysis is a simple, effective, and appropriate way to model contextual behavior.
The landscape characteristics of new-fashioned rural settlement units show clear differences from those of old-fashioned settlement units. In composition, old-fashioned settlement units have diverse land cover types, such as buildings, grain-sunning grounds, gardens, and farmland. New-fashioned rural settlement units are generally dominated by artificial material such as rooftops and concrete. Morphologically, old-fashioned rural settlements are clustered while new-fashioned standardized settlement communities are neat and tidy, including only neatly arranged buildings. Consequently, new-fashioned rural settlement units and old-fashioned units show significant differences in patch number, edge, fragmentation, and diversity at the landscape level.
A variety of landscape metrics have been developed for calculating landscape patterns in geographic information technology, including metrics that describe area, edge, shape, aggregation, and diversity at the path level, class level, and landscape level. After analysis of both settlement types’ landscape characteristics, as mentioned above, we recognize that old-fashioned rural settlement units should have more patches, longer edges, and contain more types of land cover compared to new-fashioned rural settlement units. Consequently, old-fashioned settlements have higher values in patch density (PD), edge density (ED), landscape shape index (LSI), and Shannon’s diversity index (SHDI) than new-fashioned settlements, at the landscape level. Furthermore, these two settlement types should have significant differences in PLAND values. Figure 9 shows the spectral, geometric, and contextual differences between these two types. PD, ED, LSI, SHDI, and PLAND were calculated and collected as features in the classification phase.
However, we have not fully studied every possible landscape metric in this paper, such as perimeter–area fractal dimension (PAFRAC), effective mesh size (MESH), etc. Therefore, future research could concentrate on identifying whether there are any other metrics beneficial for classification, and which metrics are the most useful and essential features.

4.3. Related Methods and Innovation

In this study, our proposed approach has been compared with a top-down hierarchical classification framework (Figure 4). The use of multi-scale contextual metrics improved the classification result when compared with the top-down technique. The differences between these two approaches highlight two aspects. Firstly, they have different classification procedures. A top-down hierarchical classification scheme follows the top to bottom principle, in which the classification of the next level is based on the results from an upper level. In contrast, the proposed approach only needs classifier algorithms at a finer scale. Secondly, these two methods adopt different features at the classification phase. The top-down framework adopts conventional object features such as spectral, textual, spatial, and geometrical information. In this new approach, we use spatial contextual information generated by a multi-scale segmentation algorithm with landscape analysis metrics.
Compared with traditional pixel-based contextual information such as MRF [19] and lacunarity [34], the object-based contextual information extraction method using multi-scale segmentation in this paper is novel. Conventional pixel-based contextual extraction methods ignore the relationship information among objects in OBIA, and few of them take geographical knowledge into consideration. Hence, some of them fail to describe all kinds of geographic characteristics in classification, with insufficient geographic information extracted. For example, the use of only lacunarity is insufficient for extracting some LULC types in rural areas [35].
Compared with related studies on multi-level context, the major difference between this approach and previous research is that we have employed landscape metrics as attributes in classification rather than traditional spectral, textural, or topological spatial relationship information from superobjects [39,41]. Landscape analysis is a simple and effective way to quantify contextual characteristics for classification. Moreover, a variety of landscape metrics can be used to characterize contextual behavior.
Geographic object-based image analysis with ontology is a similar approach to ours, because it includes the possibility of expressing spatial context [58]. Similar contextual metrics of spatial relationships (composition, morphology, and location) can be described ontologically. On the other hand, there are additional various landscape analysis metrics, which can describe all kinds of landscape characteristics, such as LSI, SHDI, and other aggregation and diversity properties. In our study, landscape analysis generated sufficient geographic spatial information for classification. This suggests that landscape features can completely use relationship information among objects.
Another similar method is the tile-level annotation technique of satellite images. In those image annotation techniques, each image is tiled into rectangular patches for labeling [59,60,61]. In previous work, chessboard segmentation and landscape analysis have been tested in classification of settlement and industrial areas [35]. Landscape features are calculated based on rectangular squares created by chessboard segmentation. However, rectangular patches and chessboard segmentation are not the most suitable techniques for acquiring land use units or landscape units (such as new-fashioned rural settlement units and old-fashioned units) at different scales. The scale problem and the boundary problem are inevitable and lead to decreasing accuracy. To address this problem, we have applied multi-scale segmentation and multi-resolution segmentation algorithms to generate segments at two levels. By using this approach, land use units at different spatial scales can be delineated successfully. We think the multi-level framework with multi-resolution segmentation is a more appropriate approach to generate multi-scale contextual information.

4.4. Scale Effect and Boundary Problem

In our approach, it is crucial to generate a set of superobjects at the landscape level for calculating landscape features, because these superobjects at the coarser scale are regarded as settlement landscape units, that is, new-fashioned and old-fashioned rural settlements units. We chose the multi-resolution segmentation algorithm since it follows from the region-merging algorithm. However, the boundaries of superobjects at the landscape level may not coincide with the corresponding settlement landscape units in the real world. For instance, a patch or just a single building from one settlement community may extend beyond the boundary of the superobject, causing so-called scale problems and boundary problems [62]. Unfortunately, these scale and boundary problems have not been completely solved. In our two-level segmentation framework, we have used the multi-resolution segmentation algorithm and an objective method, the ESP tool, to identify two candidate scale parameters. Compared to tile-level image annotation techniques, this approach is more appropriate for obtaining landscape units at different scales. However, uncertainties still exist in the entire segmentation framework and further research is essential. Therefore, technical improvements in the performance of segmentation methods for delineating landscape units are still required.

5. Conclusions

The work on discriminating old-fashioned from new-fashioned rural settlements provides valuable information on monitoring LULC dynamic patterns caused by China’s “new countryside” policy. Our research provides a novel spatial contextual information extraction method to subdivide different types of rural settlements. This approach integrates hierarchical multi-scale segmentation and landscape statistics. The framework includes a two-level multi-resolution segmentation. A vertical connection was built to link superobjects and subobjects, and landscape metrics information was calculated based on the preliminary classification result. These landscape features were regarded as spatial contextual information, and adopted in the final classification phase for discriminating two types of rural settlements.
Improved classification accuracy occurred using multi-scale contextual information compared to a conventional top-down classification framework. The result showed that landscape metrics generated by two-level segmentation could provide valuable information in image classification. This highlights that landscape metrics information can be used to characterize spatial contextual information for different settlement types. Our approach shows the practicability, applicability, and effectiveness of the entire procedure.
Compared to the spectral information and topological relationship information widely used in conventional multi-scale contextual approaches, landscape analysis is a simple and effective way to quantify contextual characteristics. With a variety of landscape metrics to select from, depending on the user’s objectives, this synthesized approach has the advantage of making full use of relationship information among segments of OBIA.
Future research may focus on testing this approach in other types of environments (urban areas, wetlands, etc.) and on discriminating other LULC types (commercial building, industrial construction, etc.). In addition, more segmentation methods should be tested and improved for delineating landscape units at various scales and of irregular sizes and shapes. Moreover, it is necessary to explore more features for modeling contextual behavior, and other potential landscape metrics should be investigated.

Acknowledgments

Funding for this work was provided by Ministry of Science and Technology of China (Grant No. 2015BAC02B00), Zhejiang Provincial Natural Science Foundation (Grant No. LQ14D010003 and Q17D010009), Zhejiang Provincial Department of Audit (Grant No. 201602001).

Author Contributions

Xinyu Zheng designed the study and wrote the manuscript; Muye Gan and Jing Zhang supervised the study and reviewed the manuscript; Bowen Wu contributed materials and analysis; Ke Wang, Jinxia Zhu, and Jinsong Deng contributed to the discussions; and Melanie Valerie Weston contributed to the discussions and revised the writing. All authors read and approved the final manuscript.

Conflicts of Interest

The authors declare no conflict of interest.

References

  1. Goodin, D.G.; Anibas, K.L.; Bezymennyi, M. Mapping land cover and land use from object-based classification: An example from a complex agricultural landscape. Int. J. Remote Sens. 2015, 36, 4702–4723. [Google Scholar] [CrossRef]
  2. Okubo, S.; Muhamad, D.; Harashina, K.; Takeuchi, K.; Umezaki, M. Land use/cover classification of a complex agricultural landscape using single-dated very high spatial resolution satellite-sensed imagery. Can. J. Remote Sens. 2010, 36, 722–736. [Google Scholar] [CrossRef]
  3. Liu, Y.; Fang, F.; Li, Y. Key issues of land use in China and implications for policy making. Land Use Policy 2014, 40, 6–12. [Google Scholar] [CrossRef]
  4. Song, W.; Pijanowski, B.C. The effects of China’s cultivated land balance program on potential land productivity at a national scale. Appl. Geogr. 2014, 46, 158–170. [Google Scholar] [CrossRef]
  5. Li, Y.; Liu, Y.; Long, H.; Cui, W. Community-based rural residential land consolidation and allocation can help to revitalize hollowed villages in traditional agricultural areas of China: Evidence from Dancheng County, Henan Province. Land Use Policy 2014, 39, 188–198. [Google Scholar] [CrossRef]
  6. Long, H.; Liu, Y.; Wu, X.; Dong, G. Spatio-temporal dynamic patterns of farmland and rural settlements in Su-Xi-Chang region: Implications for building a new countryside in coastal China. Land Use Policy 2009, 26, 322–333. [Google Scholar] [CrossRef]
  7. Long, H.; Liu, Y.; Li, X.; Chen, Y. Building new countryside in China: A geographical perspective. Land Use Policy 2010, 27, 457–470. [Google Scholar] [CrossRef]
  8. Liu, G.; Wang, H.; Cheng, Y.; Zheng, B.; Lu, Z. The impact of rural out-migration on arable land use intensity: Evidence from mountain areas in Guangdong, China. Land Use Policy 2016, 59, 569–579. [Google Scholar] [CrossRef]
  9. Forman, R.T.T.; Wu, J. Where to put the next billion people. Nature 2016, 537, 608–611. [Google Scholar] [CrossRef] [PubMed]
  10. Kit, O.; Lüdeke, M.; Reckien, D. Texture-based identification of urban slums in Hyderabad, India using remote sensing data. Appl. Geogr. 2012, 32, 660–667. [Google Scholar] [CrossRef]
  11. Kuffer, M.; Barros, J.; Sliuzas, R.V. The development of a morphological unplanned settlement index using very-high-resolution (VHR) imagery. Comput. Environ. Urban Syst. 2014, 48, 138–152. [Google Scholar] [CrossRef]
  12. Pacifici, F.; Chini, M.; Emery, W.J. A neural network approach using multi-scale textural metrics from very high-resolution panchromatic imagery for urban land-use classification. Remote Sens. Environ. 2009, 113, 1276–1292. [Google Scholar] [CrossRef]
  13. Van der Werff, H.M.A.; Van der Meer, F.D. Shape-based classification of spectrally identical objects. ISPRS J. Photogramm. Remote Sens. 2008, 63, 251–258. [Google Scholar] [CrossRef]
  14. Han, N.; Wang, K.; Yu, L.; Zhang, X. Integration of texture and landscape features into object-based classification for delineating Torreya using IKONOS imagery. Int. J. Remote Sens. 2012, 33, 2003–2033. [Google Scholar] [CrossRef]
  15. Hay, G.J.; Niemann, K.O.; McLean, G.F. An object-specific image-texture analysis of H-resolution forest imagery. Remote Sens. Environ. 1996, 55, 108–122. [Google Scholar] [CrossRef]
  16. Blaschke, T.; Hay, G.J.; Kelly, M.; Lang, S.; Hofmann, P.; Addink, E.; Queiroz Feitosa, R.; van der Meer, F.; van der Werff, H.; van Coillie, F.; et al. Geographic Object-Based Image Analysis—Towards a new paradigm. ISPRS J. Photogramm. Remote Sens. 2014, 87, 180–191. [Google Scholar] [CrossRef] [PubMed]
  17. Weng, Q. Remote sensing of impervious surfaces in the urban areas: Requirements, methods, and trends. Remote Sens. Environ. 2012, 117, 34–49. [Google Scholar] [CrossRef]
  18. Tobler, W.R. A Computer Movie Simulating Urban Growth in the Detroit Region. Econ. Geogr. 1970, 46, 234–240. [Google Scholar] [CrossRef]
  19. Tso, B.; Olsen, R.C. A contextual classification scheme based on MRF model with improved parameter estimation and multiscale fuzzy line process. Remote Sens. Environ. 2005, 97, 127–136. [Google Scholar] [CrossRef]
  20. Li, M.; Zang, S.; Zhang, B.; Li, S.; Wu, C. A review of remote sensing image classification techniques: The role of Spatio-contextual information. Eur. J. Remote Sens. 2014, 47, 389–411. [Google Scholar] [CrossRef]
  21. Binaghi, E.; Gallo, I.; Pepe, M. A cognitive pyramid for contextual classification of remote sensing images. IEEE Trans. Geosci. Remote Sens. 2003, 41, 2906–2922. [Google Scholar] [CrossRef]
  22. Moser, G.; Serpico, S.B.; Benediktsson, J.A. Land-Cover Mapping by Markov Modeling of Spatial–Contextual Information in Very-High-Resolution Remote Sensing Images. Proc. IEEE 2013, 101, 631–651. [Google Scholar] [CrossRef]
  23. Bastarrika, A.; Chuvieco, E.; Martín, M.P. Mapping burned areas from landsat TM/ETM+ data with a two-phase algorithm: Balancing omission and commission errors. Remote Sens. Environ. 2011, 115, 1003–1012. [Google Scholar] [CrossRef]
  24. Feng, J.; Cao, Z.; Pi, Y. Polarimetric contextual classification of PolSAR images using sparse representation and superpixels. Remote Sens. 2014, 6, 7158–7181. [Google Scholar] [CrossRef]
  25. Hermosilla, T.; Ruiz, L.A.; Recio, J.A.; Estornell, J. Evaluation of automatic building detection approaches combining high resolution images and LiDAR data. Remote Sens. 2011, 3, 1188–1210. [Google Scholar] [CrossRef]
  26. Lin, L.; Meng, Y.; Yue, A.; Yuan, Y.; Liu, X.; Chen, J.; Zhang, M.; Chen, J. A spatio-temporal model for forest fire detection using HJ-IRS satellite data. Remote Sens. 2016, 8. [Google Scholar] [CrossRef]
  27. Bian, J.; Li, A.; Liu, Q.; Huang, C. Cloud and snow discrimination for CCD images of HJ-1A/B constellation based on spectral signature and spatio-temporal context. Remote Sens. 2016, 8. [Google Scholar] [CrossRef]
  28. Niemeyer, J.; Rottensteiner, F.; Soergel, U. Contextual classification of lidar data and building object detection in urban areas. ISPRS J. Photogramm. Remote Sens. 2014, 87, 152–165. [Google Scholar] [CrossRef]
  29. Martinis, S.; Twele, A. A hierarchical spatio-temporal Markov model for improved flood mapping using multi-temporal X-band SAR data. Remote Sens. 2010, 2, 2240–2258. [Google Scholar] [CrossRef]
  30. Alioscha-Perez, M.; Sahli, H. Efficient learning of spatial patterns with multi-scale conditional random fields for region-based classification. Remote Sens. 2014, 6, 6727–6764. [Google Scholar] [CrossRef]
  31. Blaschke, T. Object based image analysis for remote sensing. ISPRS J. Photogramm. Remote Sens. 2010, 65, 2–16. [Google Scholar] [CrossRef]
  32. Ghimire, B.; Rogan, J.; Miller, J. Contextual land-cover classification: Incorporating spatial dependence in land-cover classification models using random forests and the Getis statistic. Remote Sens. Lett. 2010, 1, 45–54. [Google Scholar] [CrossRef]
  33. Malhi, Y.; Román-Cuesta, R.M. Analysis of lacunarity and scales of spatial homogeneity in IKONOS images of Amazonian tropical forest canopies. Remote Sens. Environ. 2008, 112, 2074–2087. [Google Scholar] [CrossRef]
  34. Ma, L.; Wu, D.; Deng, J.; Wang, K.; Li, J.; Gu, Q.; Dai, Y. Discrimination of residential and industrial buildings using LiDAR data and an effective spatial-neighbor algorithm in a typical urban industrial park. Eur. J. Remote Sens. 2015, 48, 1–15. [Google Scholar] [CrossRef]
  35. Zheng, X.; Wang, Y.; Gan, M.; Zhang, J.; Teng, L.; Wang, K.; Shen, Z.; Zhang, L. Discrimination of Settlement and Industrial Area Using Landscape Metrics in Rural Region. Remote Sens. 2016, 8. [Google Scholar] [CrossRef]
  36. Hodgson, M.E. What size window for image classification? A cognitive perspective. Photogramm. Eng. Remote Sens. 1998, 64, 797–807. [Google Scholar]
  37. Bruzzone, L.; Carlin, L. A multilevel context-based system for classification of very high spatial resolution images. IEEE Trans. Geosci. Remote Sens. 2006, 44, 2587–2600. [Google Scholar] [CrossRef]
  38. Hofmann, P.; Strobl, J.; Blaschke, T.; Kux, H. Detecting informal settlements from Quickbird data in Rio de Janeiro using an object based approach. In Object-Based Image Analysis; Springer: Berlin/Heidelberg, Germany, 2008; pp. 531–553. [Google Scholar]
  39. Johnson, B.; Xie, Z. Classifying a high resolution image of an urban area using super-object information. ISPRS J. Photogramm. Remote Sens. 2013, 83, 40–49. [Google Scholar] [CrossRef]
  40. Han, N.; Du, H.; Zhou, G.; Sun, X.; Ge, H.; Xu, X. Object-based classification using SPOT-5 imagery for Moso bamboo forest mapping. Int. J. Remote Sens. 2014, 35, 1126–1142. [Google Scholar] [CrossRef]
  41. Han, N.; Du, H.; Zhou, G.; Xu, X.; Ge, H.; Liu, L.; Gao, G.; Sun, S. Exploring the synergistic use of multi-scale image object metrics for land-use/land-cover mapping using an object-based approach. Int. J. Remote Sens. 2015, 36, 3544–3562. [Google Scholar] [CrossRef]
  42. Tongxiang Bureau of Statistics. Tongxiang Statistical Year Books; China Statistical Press: Beijing, China, 2012; pp. 83–92. [Google Scholar]
  43. Kong, F.; Li, X.; Wang, H.; Xie, D.; Li, X.; Bai, Y. Land Cover Classification Based on Fused Data from GF-1 and MODIS NDVI Time Series. Remote Sens. 2016, 8. [Google Scholar] [CrossRef]
  44. Shao, Z.; Fu, H.; Fu, P.; Yin, L. Mapping Urban Impervious Surface by Fusing Optical and SAR Data at the Decision Level. Remote Sens. 2016, 8. [Google Scholar] [CrossRef]
  45. Zhou, Y.; Lin, C.; Wang, S.; Liu, W.; Tian, Y. Estimation of Building Density with the Integrated Use of GF-1 PMS and Radarsat-2 Data. Remote Sens. 2016, 8. [Google Scholar] [CrossRef]
  46. Benz, U.C.; Hofmann, P.; Willhauck, G.; Lingenfelder, I.; Heynen, M. Multi-resolution, object-oriented fuzzy analysis of remote sensing data for GIS-ready information. ISPRS J. Photogramm. Remote Sens. 2004, 58, 239–258. [Google Scholar] [CrossRef]
  47. Drǎguţ, L.; Csillik, O.; Eisank, C.; Tiede, D. Automated parameterisation for multi-scale image segmentation on multiple layers. ISPRS J. Photogramm. Remote Sens. 2014, 88, 119–127. [Google Scholar] [CrossRef] [PubMed]
  48. Drǎguţ, L.; Tiede, D.; Levick, S.R. ESP: A tool to estimate scale parameter for multiresolution image segmentation of remotely sensed data. Int. J. Geogr. Inf. Sci. 2010, 24, 859–871. [Google Scholar] [CrossRef]
  49. Belgiu, M.; Drǎguţ, L. Comparing supervised and unsupervised multiresolution segmentation approaches for extracting buildings from very high resolution imagery. ISPRS J. Photogramm. Remote Sens. 2014, 96, 67–75. [Google Scholar] [CrossRef] [PubMed]
  50. Mountrakis, G.; Im, J.; Ogole, C. Support vector machines in remote sensing: A review. ISPRS J. Photogramm. Remote Sens. 2010, 66, 247–259. [Google Scholar] [CrossRef]
  51. Hall, M.; Frank, E.; Holmes, G.; Pfahringer, B.; Reutemann, P.; Witten, I.H. The WEKA Data Mining Software: An Update. Available online: http://www.cms.waikato.ac.nz/~ml/publications/2009/weka_update.pdf (accessed on 15 May 2017).
  52. Fan, R.E.; Chen, P.H.; Lin, C.J. Working set selection using second order information for training support vector machines. J. Mach. Learn. Res. 2005, 6, 1889–1918. [Google Scholar]
  53. McGarigal, K.; Cushman, S.A.; Neel, M.C.; Ene, E. FRAGSTATS v4: Spatial Pattern Analysis Program for Categorical and Continuous Maps. Available online: http//www.umass.edu/landeco/research/fragstats/fragstats.html (accessed on 10 May 2016).
  54. Powers, D.M.W. Evaluation: From Precision, Recall and F-Measure To Roc, Informedness, Markedness & Correlation. J. Mach. Learn. Technol. 2011, 2, 37–63. [Google Scholar]
  55. Witharana, C.; Lynch, H.J. An object-based image analysis approach for detecting penguin guano in very high spatial resolution satellite images. Remote Sens. 2016, 8. [Google Scholar] [CrossRef]
  56. Sawaya, K. Extending satellite remote sensing to local scales: land and water resource monitoring using high-resolution imagery. Remote Sens. Environ. 2003, 88, 144–156. [Google Scholar] [CrossRef]
  57. Turner, M.; Gardner, R.; O’Neill, R. Landscape Ecology in Theory and Practice; Springer: New York, NY, USA, 2001. [Google Scholar]
  58. Arvor, D.; Durieux, L.; Andrés, S.; Laporte, M.A. Advances in Geographic Object-Based Image Analysis with ontologies: A review of main contributions and limitations from a remote sensing perspective. ISPRS J. Photogramm. Remote Sens. 2013, 82, 125–137. [Google Scholar] [CrossRef]
  59. Hu, F.; Yang, W.; Chen, J.; Sun, H. Tile-level annotation of satellite images using multi-level max-margin discriminative random field. Remote Sens. 2013, 5, 2275–2291. [Google Scholar] [CrossRef]
  60. Lienou, M.; Maitre, H.; Datcu, M. Semantic Annotation of Satellite Images Using Latent Dirichlet Allocation. IEEE Geosci. Remote Sens. Lett. 2010, 7, 28–32. [Google Scholar] [CrossRef]
  61. Zhao, B.; Zhong, Y.; Zhang, L. A spectral-structural bag-of-features scene classifier for very high spatial resolution remote sensing imagery. ISPRS J. Photogramm. Remote Sens. 2016, 116, 73–85. [Google Scholar] [CrossRef]
  62. Moser, B.; Jaeger, J.A.G.; Tappeiner, U.; Tasser, E.; Eiselt, B. Modification of the effective mesh size for measuring landscape fragmentation to solve the boundary problem. Landsc. Ecol. 2007, 22, 447–459. [Google Scholar] [CrossRef]
Figure 1. Image examples both on the ground and satellite for new-fashioned and old-fashioned rural settlements.
Remotesensing 09 00486 g001
Figure 2. New-fashioned and old-fashioned rural settlements show different landscape characteristics. Based on the multi-level segmentation, we can identify settlement rooftops from a finer scale, while we can discriminate different settlement communities from a coarse scale.
Remotesensing 09 00486 g002
Figure 3. The study area Longxiang subdistrict is a typical rural region in Zhejiang Province, and a GF-2 image of study area subset is showed in true color.
Remotesensing 09 00486 g003
Figure 4. Flow chart of the classification framework in this paper including two-level segmentation, contextual information extraction, classification and comparison method.
Remotesensing 09 00486 g004
Figure 5. Example of LULC cover types throughout the rural area: (a) greenhouse; (b,c) represent the new-fashioned rural settlements; (d) industrial warehouse; (e,f) represent the old-fashioned rural settlements examples.
Remotesensing 09 00486 g005
Figure 6. ESP result plot diagram. Local variance (LV, black circles and gray line) and rates of change of LV (ROC-LV, black triangles and black line) is plotted against corresponding scale. Grey dotted vertical lines indicate the optimal scale parameters selected.
Remotesensing 09 00486 g006
Figure 7. Output map from SVM classifier in preliminary classification phase, for the whole study area (a); some subset examples for segmentation result in coarser (b) and finer scale (c).
Remotesensing 09 00486 g007
Figure 8. The discrimination results by using contextual information (a) and top-down hierarchical approach (b). The black arrows indicate that some communities can be discriminated accurately by utilizing contextual information, while by using conventional single-scale object features, these two types of settlements remain mixed. Some subset examples are collected on the final map: (c) aggregation of new-fashioned settlement; (d) example of old-fashioned settlement, and mixed scenario of these two types (e) and (f); the land-use planning map of rural villages as reference data is showed in (e,f).
Remotesensing 09 00486 g008
Figure 9. Feature values comparison between settlement types in spectrum (NDVI), geometry (density), and context. PLAND VEG: the PLAND of vegetation, PD: patch density, ED: edge density, LSI: landscape shape index, SHDI: Shannon’s diversity index. Feature values were normalized between 0 and 100.
Remotesensing 09 00486 g009
Table 1. Three-level category schema in the classification approach of this paper.
Level 1Level 2Level 3
Non-artificialWater bodies
Vegetation
Bare soil
ArtificialLow-albedo rooftopsNew-fashioned rural settlements
Old-fashioned rural settlements
High-albedo impervious surfaceConcrete
Greenhouse
Industrial warehouse
Asphalt
Table 2. Description of the classification objects, attributes, and method in preliminary classification.
LevelClassification ObjectsClassification AttributesClassification Method
Level 1Artificial and non-artificial surfaceBrightness
Layer mean
Max. diff.
Standard deviation
Compactness
Shape index
Density
NDVI
SVM RBF with optimal parameter obtained from cross-validation
Level 2Subdivide artificial surface into three subclasses, i.e., low-albedo rooftops, high-albedo impervious surface, industrial warehouse and asphalt
Subdivide non-artificial surface into three subclasses, i.e., water bodies, vegetation, bare soil
Level 3Subdivide high-albedo impervious surface into two subclasses, i.e., concrete, greenhouse
Subdivide low-albedo rooftops into two subclasses, i.e., new-fashioned and old-fashioned rural settlementsLandscape metrics acted as contextual information
Table 3. The error matrix for the final map. In total, we selected 1520 randomly segments for construction of the error matrix, and no less than 270 objects for two types of rural settlements each were collected. PA: producer accuracy, UA: user accuracy.
Reference Class
Water BodiesBare SoilOld-Fashioned SettlementAsphaltVegetationIndustrial WarehouseConcreteNew-Fashioned SettlementGreenhouseSum
Predicted classWater bodies10301070200113
Bare soil0730010091093
Old-fashioned settlement15925711101055313
Asphalt007492023063
Vegetation42003010500312
Industrial warehouse000005000050
Concrete090014319400220
New-fashioned settlement3313391112253271
Greenhouse050011707185
Sum125101278533555524023479
PA82.40%72.28%92.45%92.45%84.79%90.91%80.83%96.15%89.87%
UA91.15%78.49%82.11%77.78%96.47%100.00%88.18%83.03%83.53%
Overall accuracy87.04%
Table 4. Quantitative comparison of the proposed method and the top-down hierarchical framework. The error matrix and evaluation metrics including accuracy, precision, and recall values for each approach are showed. Old-fashioned: the old-fashioned rural settlement, new-fashioned: the new-fashioned rural settlement.
MethodsMulti-Scale Contextual Information ClassificationTop-Down Hierarchical Classification
Reference Class
Old-FashionedNew-FashionedOld-FashionedNew-Fashioned
Predicted ClassOld-fashioned257523451
New-fashioned1322536179
Evaluation CriteriaPrecision98.09%94.54%82.11%83.26%
Recall95.19%97.83%86.67%77.83%
Accuracy96.40% 82.60%

