Article

An Enhanced Satellite-Based Algorithm for Detecting and Tracking Dust Outbreaks by Means of SEVIRI Data

by
Francesco Marchese
1,*,
Filomena Sannazzaro
2,
Alfredo Falconieri
1,
Carolina Filizzola
1,
Nicola Pergola
1 and
Valerio Tramutoli
2
1
National Research Council, Institute of Methodologies for Environmental Analysis, C. da S. Loja, 85050 Tito Scalo (Pz), Italy
2
School of Engineering, University of Basilicata, Via dell’Ateneo Lucano, 10, 85100 Potenza, Italy
*
Author to whom correspondence should be addressed.
Remote Sens. 2017, 9(6), 537; https://doi.org/10.3390/rs9060537
Submission received: 6 April 2017 / Revised: 19 May 2017 / Accepted: 25 May 2017 / Published: 27 May 2017

Abstract

:
Dust outbreaks are meteorological phenomena of great interest for scientists and authorities (because of their impact on the climate, environment, and human activities), which may be detected, monitored, and characterized from space using different methods and procedures. Among the recent dust detection algorithms, the RSTDUST multi-temporal technique has provided good results in different geographic areas (e.g., Mediterranean basin; Arabian Peninsula), exhibiting a better performance than traditional split window methods, in spite of some limitations. In this study, we present an optimized configuration of this technique, which better exploits data provided by Spinning Enhanced Visible and Infrared Imager (SEVIRI) aboard Meteosat Second Generation (MSG) satellites to address those issues (e.g., sensitivity reduction over arid and semi-arid regions; dependence on some meteorological clouds). Three massive dust events affecting Europe and the Mediterranean basin in May 2008/2010 are analysed in this work, using information provided by some independent and well-established aerosol products to assess the achieved results. The study shows that the proposed algorithm, christened eRSTDUST (i.e., enhanced RSTDUST), which provides qualitative information about dust outbreaks, is capable of increasing the trade-off between reliability and sensitivity. The results encourage further experimentations of this method in other periods of the year, also exploiting data provided by different satellite sensors, for better evaluating the advantages arising from the use of this dust detection technique in operational scenarios.

Graphical Abstract

1. Introduction

Dust storms are complex processes determined by the interaction of wind speed with bared soils and dry air conditions. In recent years, climate changes and the poorly managed human activities have increased the number of dust events, amplifying their effects in arid and semi-arid regions [1]. The Sahara is the main source of desert dust aerosols on Earth, which are mainly composed of minerals such as quartz, feldspars, and clays [1,2,3]. Such aerosols, having a diameter ranging from 0.1–10 μm and a lifetime of hours to weeks, may be transported thousands of kilometres from the source [1,2,3,4]. Through scattering and absorbing the solar and terrestrial radiation, they affect the air temperature [5,6] and act as a condensation nuclei for meteorological clouds [7,8,9]. Dust particles influence the pH of rainwaters, as well hurricane and tropical cyclone dynamics [10,11], altering both sea and agriculture productivity [2,12]; moreover, they reduce the air quality by increasing the PM10 level in the ambient air, whose limit in Europe was established to be 50 μg/m3, causing serious diseases to populations [13,14,15]. In addition, dust outbreaks may destroy communication facilities, cause possible air traffic disruptions [16,17,18], and transport microorganisms, insects, and chemicals, having a strong toxicological effect on human health [19,20].
Hence, an efficient monitoring and forecasting of dust storms is crucial to mitigate the impact of these meteorological phenomena on both social and economic human activities.
Satellite remote sensing plays an important role in detecting, tracking, and characterizing (in terms of optical depth, altitude, and mean particle size) dust events (e.g., [21,22,23,24,25,26,27]). Among the space-based sensors, SEVIRI (Spinning Enhanced Visible and Infrared Imager), aboard MSG (Meteosat Second Generation) satellites, has been profitably used to study the diurnal cycle of dust emissions (e.g., [28,29]), thanks to the high frequency of observations (15 min) and the spatial resolution of about 3 km × 3 km at nadir. Moreover, this instrument is suited to map airborne dust over wide geographic regions, enabling the identification of dust source areas if proper methods are used (e.g., [30,31]).
In this work, we exploit SEVIRI data to study three massive Saharan dust events that have affected Europe and the Mediterranean basin in recent years, testing an optimized configuration of the RSTDUST (Robust Satellite Technique for Dust detection) multi-temporal technique, which performs a qualitative analysis of dust phenomena from space [32,33]. The algorithm presented here, christened eRSTDUST (enhanced RSTDUST), aims at improving the identification of dust outbreaks, particularly over arid and semi-arid regions, and at better discriminating dust from meteorological clouds, minimizing false detections.

2. Background

Since the 1970’s, satellite remote sensing has been used for studying and monitoring dust outbreaks. The first studies on this topic were performed using the MSS (Multi Spectral Scanner) and VHRR (Very High Resolution Radiometer) sensors, aboard ERTS-1 (Earth Resources Technology Satellites-1) and NOAA (National Oceanic and Atmospheric Administration) meteorological satellites (e.g., [34,35,36]). In these pioneering works, the authors analysed the signal acquired in the visible region of the electro-magnetic spectrum to retrieve the Aerosol Optical Depth (AOD) over oceanic regions, where the contribution of airborne dust to the upwelling visible radiance is stronger [37]. Almost concurrently, Shenk and Curran [38] investigated the brightness temperature difference (BTD) BT11–BT12, based on signals measured in the Thermal Infrared (TIR) band at around 11 μm and 12 μm wavelengths, to detect dust clouds over land surfaces. Indeed, the BTD generally decreases up to negative values in the presence of desert dust aerosols [39], owing to the reverse absorption effect of silicate-rich particles in comparison with water/ice droplets at the aforementioned wavelengths (e.g., [40]). Following this, a number of studies exploited TIR and/or MIR (Medium Infrared) radiances to investigate dust phenomena (e.g., [41]), also using data provided by sensors like AVHRR (Advanced Very High Resolution Radiometer), onboard NOAA (National Oceanic and Atmospheric Administration) satellites, and MODIS (Moderate Resolution Imaging Spectroradiometer), aboard NASA Terra and Aqua platforms.
Ackerman [42] developed a three-band technique to better distinguish dust from meteorological clouds, combining two brightness temperature differences: i.e., BT11–BT12 and BT8–BT11 (analysing the signal at 8.5 μm and 11 μm wavelengths), whose values depend on several factors such as particle size and concentration. Wald et al. [43] experimented with a similar approach to improve the identification of mineral dust over desert regions, implementing a bi-spectral threshold test on MODIS data. This method required an accurate characterization of background surface emissivity to provide reliable results [44].
The Saharan Dust Index (SDI) [45], developed for correcting sea surface temperatures retrieved by satellite, is another well-established method used for monitoring dust outbreaks. Specifically, the SDI uses four SEVIRI infrared spectral channels to detect airborne dust, including channel 4 (MIR) centred at a 3.9 μm wavelength. Because of the reflected solar component affecting this spectral channel, the SDI (which is less effective for satellite zenith angles greater than 60°) was only useful in night-time conditions [45]. Thereafter, a daytime SDI was developed, but with a degraded accuracy in comparison with the original algorithm configuration [46].
Recent dust detection methods have analysed SEVIRI imagery at two different time slots per day [47], employed a cloud screened BTD image [48], used dynamic reference brightness temperature differences [49], or integrated several fixed threshold tests on BTD and BTR (Brightness Temperature Ratio) signals [50]. Despite the advantages offered by these algorithms, as well as by other novel techniques (e.g., [51,52]) also combining information provided by different satellite sensors (e.g., [53]), an effective identification and mapping of airborne dust, regardless of background surfaces and of atmospheric/observational conditions, still represents a challenge for scientists. In particular, some critical scenarios remaining challenging for most of the algorithms analysing VIS/IR radiances developed so far include: airborne dust identification over bright surfaces (e.g., desert regions); the dependence of IR signals on dust plume features (e.g., plume height [54]); the sensitivity of BTD to variability in surface emissivity [48]; the impact of cirrus clouds on the BTD signal [48,55].
In this work, we address this topic proposing and testing an enhanced configuration of the RSTDUST multi-temporal algorithm [32], which is described in detail in the next section.

3. Methods

3.1. Standard RSTDUST Algorithm

The RST (Robust Satellite Techniques) multi-temporal approach considers each anomaly in the space-time domain as a deviation from an unperturbed state that may be preliminarily determined by processing plurennial time series of homogeneous (i.e., same calendar month, same overpass times) cloud-free satellite records. In more detail, RST uses a change detection index named ALICE (Absolutely Local Index of Change of Environment) to identify anomalous variations of the signal related to possible perturbing events [56]:
V ( x , y , t ) V ( x , y , t )   V r e f ( x , y ) σ V ( x , y )    
In Equation (1), V ( x , y , t ) is the satellite signal under investigation, ( x , y ) are the geographic coordinates of the image pixel, and t is the acquisition time. V r e f ( x , y ) is the expected value of the signal (e.g., minimum, maximum, average value), while σ V ( x , y ) stands for the temporal standard deviation. These terms are calculated after filtering out water/ice clouds by means of an adequate cloud detection method and using the iterative clipping filter to remove signal outliers [56].
RSTDUST is a specific configuration of the RST approach; it uses the following local variation index, based on Equation (1), to identify dust clouds [28,29]:
Δ T I R ( x , y , t ) Δ T ( x , y , t ) μ Δ T ( x , y ) σ Δ T ( x , y )
In Equation (2), Δ T ( x , y , t ) = B T 11 ( x , y , t ) B T 12 ( x , y , t ) is the brightness temperature and difference at 11 μm and 12 μm wavelengths, whereas the terms μ Δ T ( x , y ) and σ Δ T ( x , y ) are the relative temporal mean and standard deviation computed, for the same location (x,y), by means of the above-mentioned multi-temporal analysis. The ⊗ΔTIR(x,y,t) index was originally used to detect ash plumes (e.g., [57]), since negative values of this index generally characterize ash/dust clouds dominated by particles having a diameter smaller than 10 μm [33]. Regarding the airborne dust, we assessed such an index behaviour studying an intense dust outbreak affecting Australia during September 2009 by means of infrared MTSAT-1R (Multifunctional Transport Satellites) data [32]. Afterwards, we demonstrated that RSTDUST is capable of performing better than traditional split window methods [33,58]. The algorithm, however, may be still affected by some meteorological clouds (e.g., high level clouds) and generally performs less well for arid and semi-arid regions [33]. These limitations suggested that we needed to optimize the algorithm performance, exploiting information provided by other SEVIRI spectral channels, as discussed in the next section.

3.2. Enhanced RSTDUST Algorithm (eRSTDUST)

In this study, we introduce two additional local variation indices, based on Equation (1), to increase the performance of RSTDUST:
V I S ( x , y , t ) R V I S ( x , y , t ) μ V I S ( x , y ) σ V I S ( x , y )    
T I R ( x , y , t ) B T 11 ( x , y , t ) μ B T 11 ( x , y ) σ B T 11 ( x , y )   
In Equation (3), R V I S ( x , y , t ) is the radiance measured in the visible channel of SEVIRI centred at around 0.6 μm, while μ V I S ( x , y ) and σ V I S ( x , y ) , which have the same meaning as before, in reference to the visible signal. Equation (4), B T 11 ( x , y , t ) is the TIR brightness temperature (at around 11 μm); μ B T 11 ( x , y ) and σ B T 11 ( x , y ) are the relative temporal mean and standard deviation.
The ⊗VIS(x,y,t) index is integrated within the RSTDUST scheme to filter out pixels less reflective in the visible band, which are generally not affected by dust or by water/ice clouds (e.g., [59]). The ⊗TIR(x,y,t) index is used for better distinguishing dust from meteorological clouds (e.g., high level clouds), exploiting their different spectral behaviour at TIR wavelengths (e.g., [60]).
Thus, eRSTDUST implements up to three local variation indices in combination to identify dusty pixels over land (L) and sea (S) areas, according to the following detection scheme:
Daytime:
VIS(x,y,t) > 0 ANDTIR(x,y,t) > −2 ANDΔTIR(x,y,t) < 0, −1, −2, … (L)
VIS(x,y,t) > 1 ANDTIR(x,y,t) > −2 ANDΔTIR(x,y,t) < 0, −1, −2, … (S)
Nighttime:
TIR(x,y,t) > −2 ANDΔTIR(x,y,t) < −1, −2, −3 (L/S)
As can be seen from tests (5) and (6), two different cutting levels of the ⊗VIS(x,y,t) index are used in the daytime to take into account the smaller contribution of airborne dust over land than sea areas to upwelling visible radiance measured by satellite (e.g., [37]). Obviously, during the night-time, the ⊗VIS(x,y,t) index is unusable. Therefore, to guarantee a performance comparable to the daylight conditions, values of −1 ≤ ⊗ΔTIR(x,y,t) < 0 are not investigated (see test (7)).
It is worth stating that eRSTDUST is a tuneable algorithm. Hence, the lower the ⊗ΔTIR(x,y,t) index, which is the most sensitive to airborne dust, the higher the confidence level of detection.

Implementation on MSG-SEVIRI Data

To implement both the standard and the enhanced RSTDUST algorithm on MSG-SEVIRI data, we processed hundreds of satellite imagery, stratified according to the same month and time of acquisition, acquired at the School of Engineering (SI) of the University of Basilicata (UNIBAS) (Italy) since 2004 (e.g., data of 2004–2007 were processed for studying the dust episode of May 2008).
The first step of the pre-processing phase was the calibration of satellite imagery [61,62]. Afterwards, we extracted a Region of Interest (ROI) from the original full disk data, corresponding to a sub-scene of 725 × 533 pixels in size, covering North Africa and Europe (see Figure 1). Moreover, we integrated a specific cloud-screening procedure within the process to filter out clouds from the scenes (aerosol effects were removed by means of the iterative clipping filter; see Section 3.1), making the spectral reference fields as representative as possible of unperturbed conditions (in the presence of residual outliers, an increase in the natural variability of the signal is expected). This procedure combines the outputs of the EUMETSAT (European Organisation for the Exploitation of Meteorological Satellites) cloud mask product, whose detailed description can be found in [63], with those of the One Channel Cloud Detection Approach (OCA) [64]. The latter is a RST-based method which identifies cloudy radiances, based on the signal divergence from an unperturbed “clear sky” condition, exploiting information provided by SEVIRI VIS (at 0.6 μm) and TIR (at 10.8 μm) channels (e.g., [64,65]). The joint use of EUMETSAT and OCA cloud mask products generally guarantees an efficient removal of cloudy pixels, both in night-time and daylight conditions.
In Figure 1, we show an example of temporal mean and standard deviation images which were generated, for the month of interest (i.e., May), in reference to the time slot of 06:00 UTC, after using the above-mentioned cloud mask procedure. As can be seen from the top panel (see Figure 1a), both arid/semi-arid regions of North Africa and ice/snow surfaces (e.g., Alps) show higher values of temporal mean and standard deviation than sea areas (see Mediterranean Sea) in the visible band. In general, the satellite signal tends to fluctuate less over sea than land regions, as is evident when looking at the right panels, referring to the temporal standard deviation images for the VIS (Figure 1a), TIR (Figure 1b), and BT11-BT12 (Figure 1c) signals.

4. Validation Products

In this work, we use the following aerosol products to assess the identification of dusty areas by satellite:
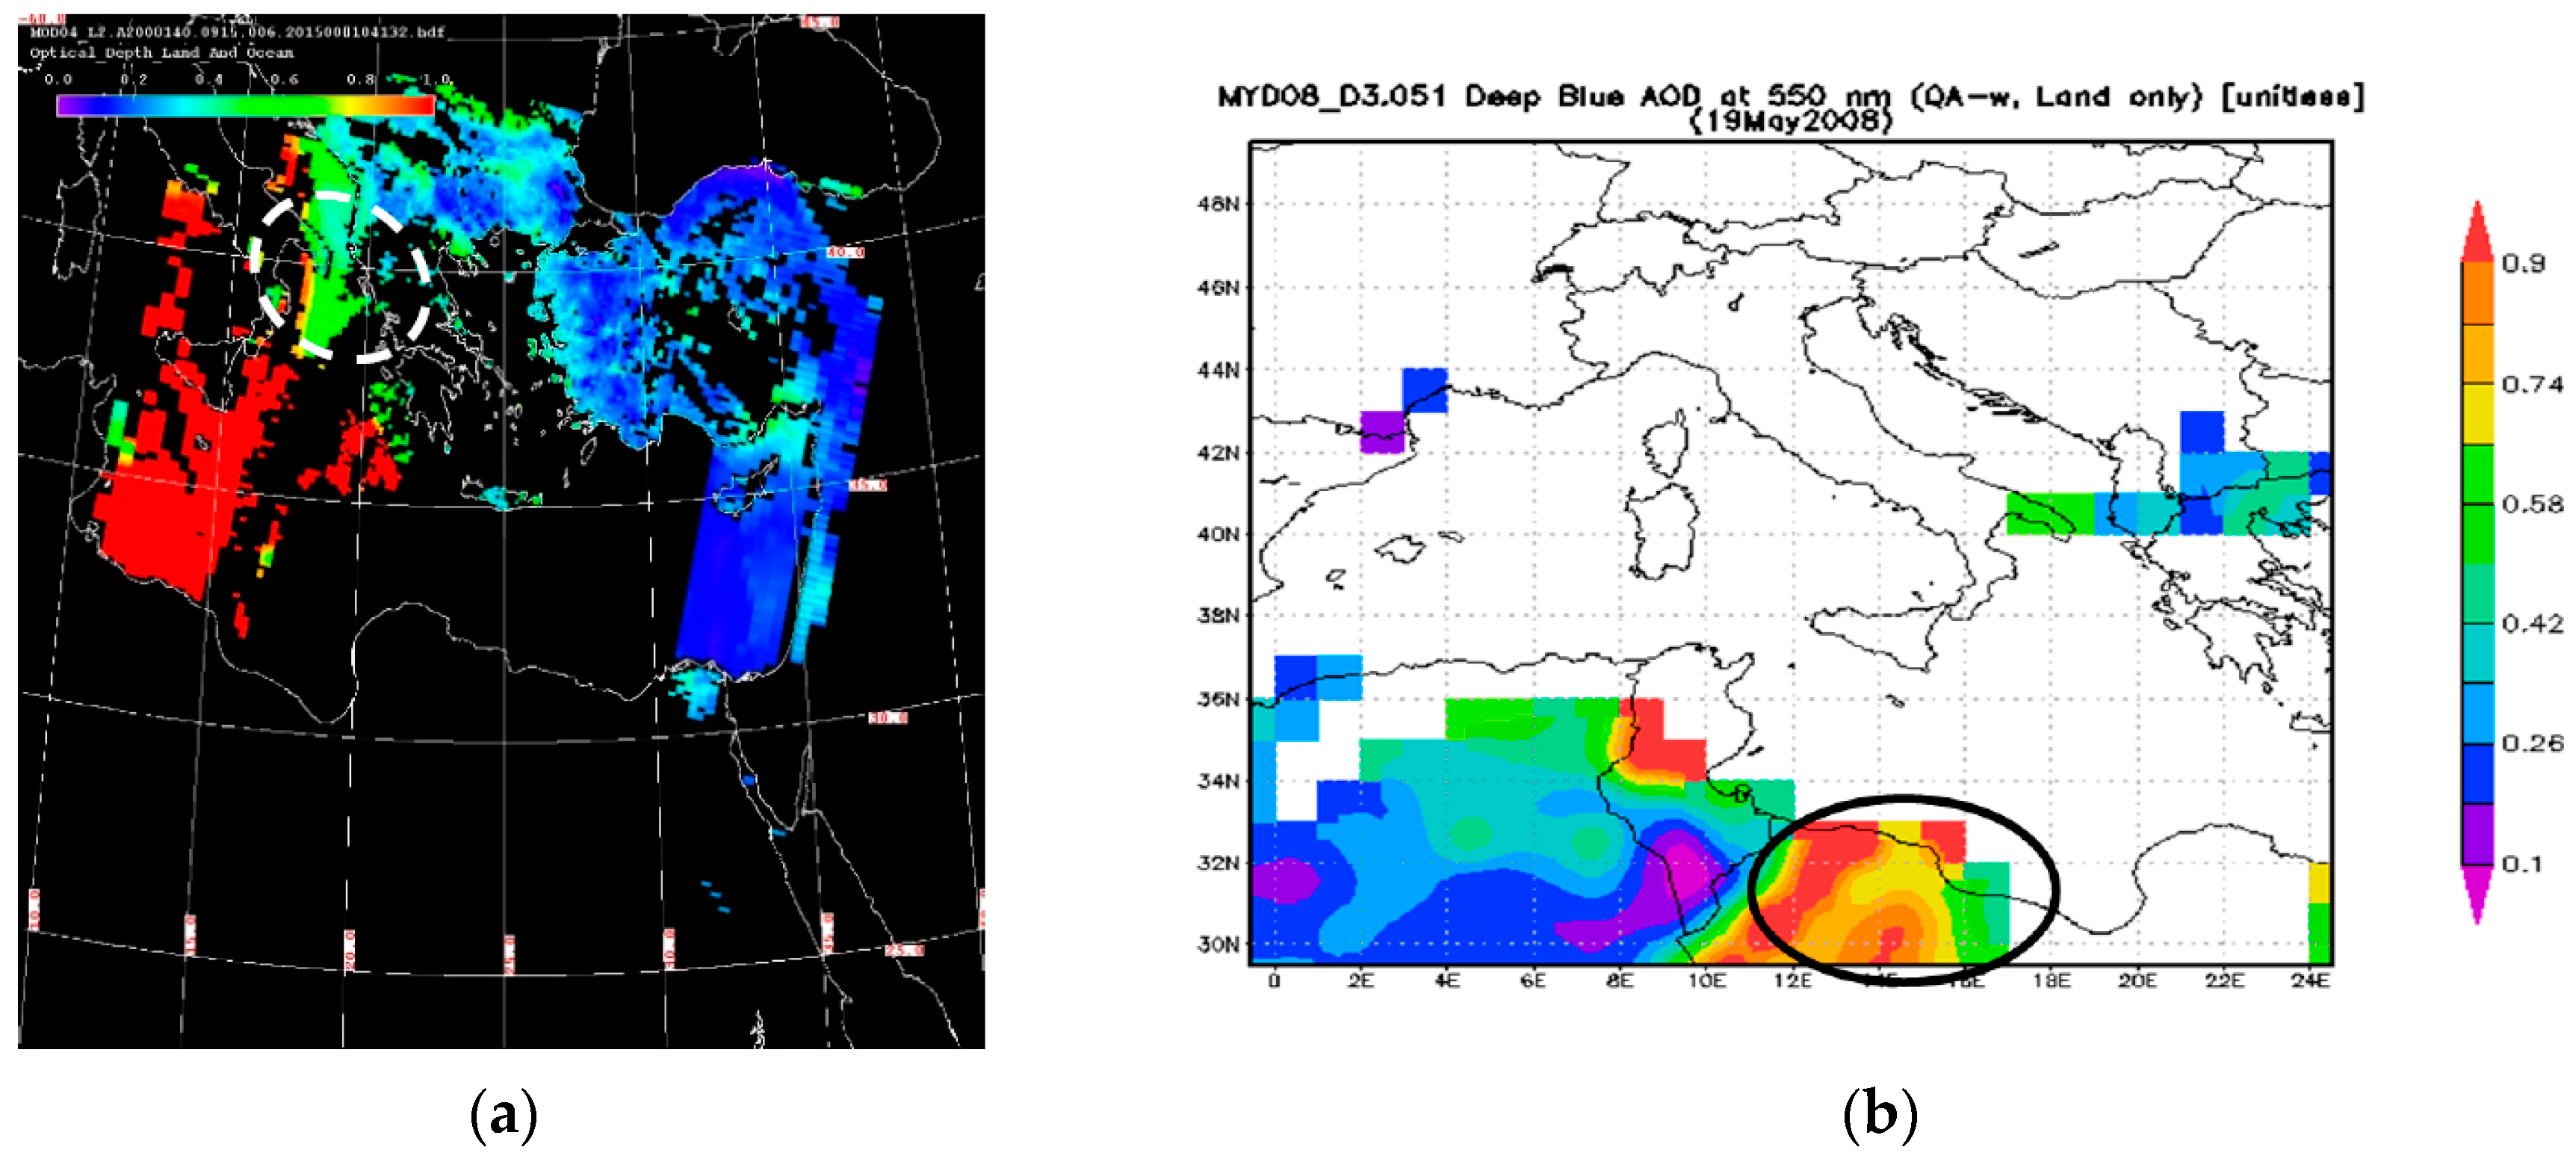
  • NASA Terra and Aqua-MODIS AOD at 550 nm products used here (referring to same time and hour of processed SEVIRI data) belong to the MOD04_L2 and MYD04_L2 datasets of the Level-1 & Atmosphere Archive and Distribution System (LAADS). These aerosol products, with a spatial resolution of 10 km × 10 km (at nadir), are based on MODIS radiances analysed by means of two different algorithms: one for the deep ocean areas [66] and the other for dark targets (e.g., vegetated regions; dark soils; [67,68]). Independent analyses showed that the expected error in MODIS AOD at 550 nm is in the order of ± (0.05τ + 0.03) over oceans and ± (0.15τ + 0.05) over land regions [69], where τ is the aerosol optical depth. Since the traditional MODIS algorithm generally fails in retrieving the AOD over bright land areas [70], the MODIS Deep Blue AOD daily products are commonly used over arid and semi-arid regions (e.g., [71]). These products, which are generated by using the MODIS blue channel radiances, where the contribution from the surface is relatively low, provide information about dust aerosols residing close to the ground [72]. In this study, we exploit information provided by the MODIS Deep Blue AOD daily maps (generated from Giovanni MODIS data system) belonging to collection 5.1 (having the same spatial resolution as above) to assess the identification of airborne dust over North Africa. However, it is important to stress that we do not use the aforementioned aerosol products to perform a quantitative pixel-by pixel assessment of dust detections from space. On the other hand, we only investigate the possible spatial agreement between dusty areas identified by our algorithm and regions characterized by significant values of AOD (which does not require the resampling of SEVIRI data to fit with the lower spatial resolution of analysed MODIS aerosol products).
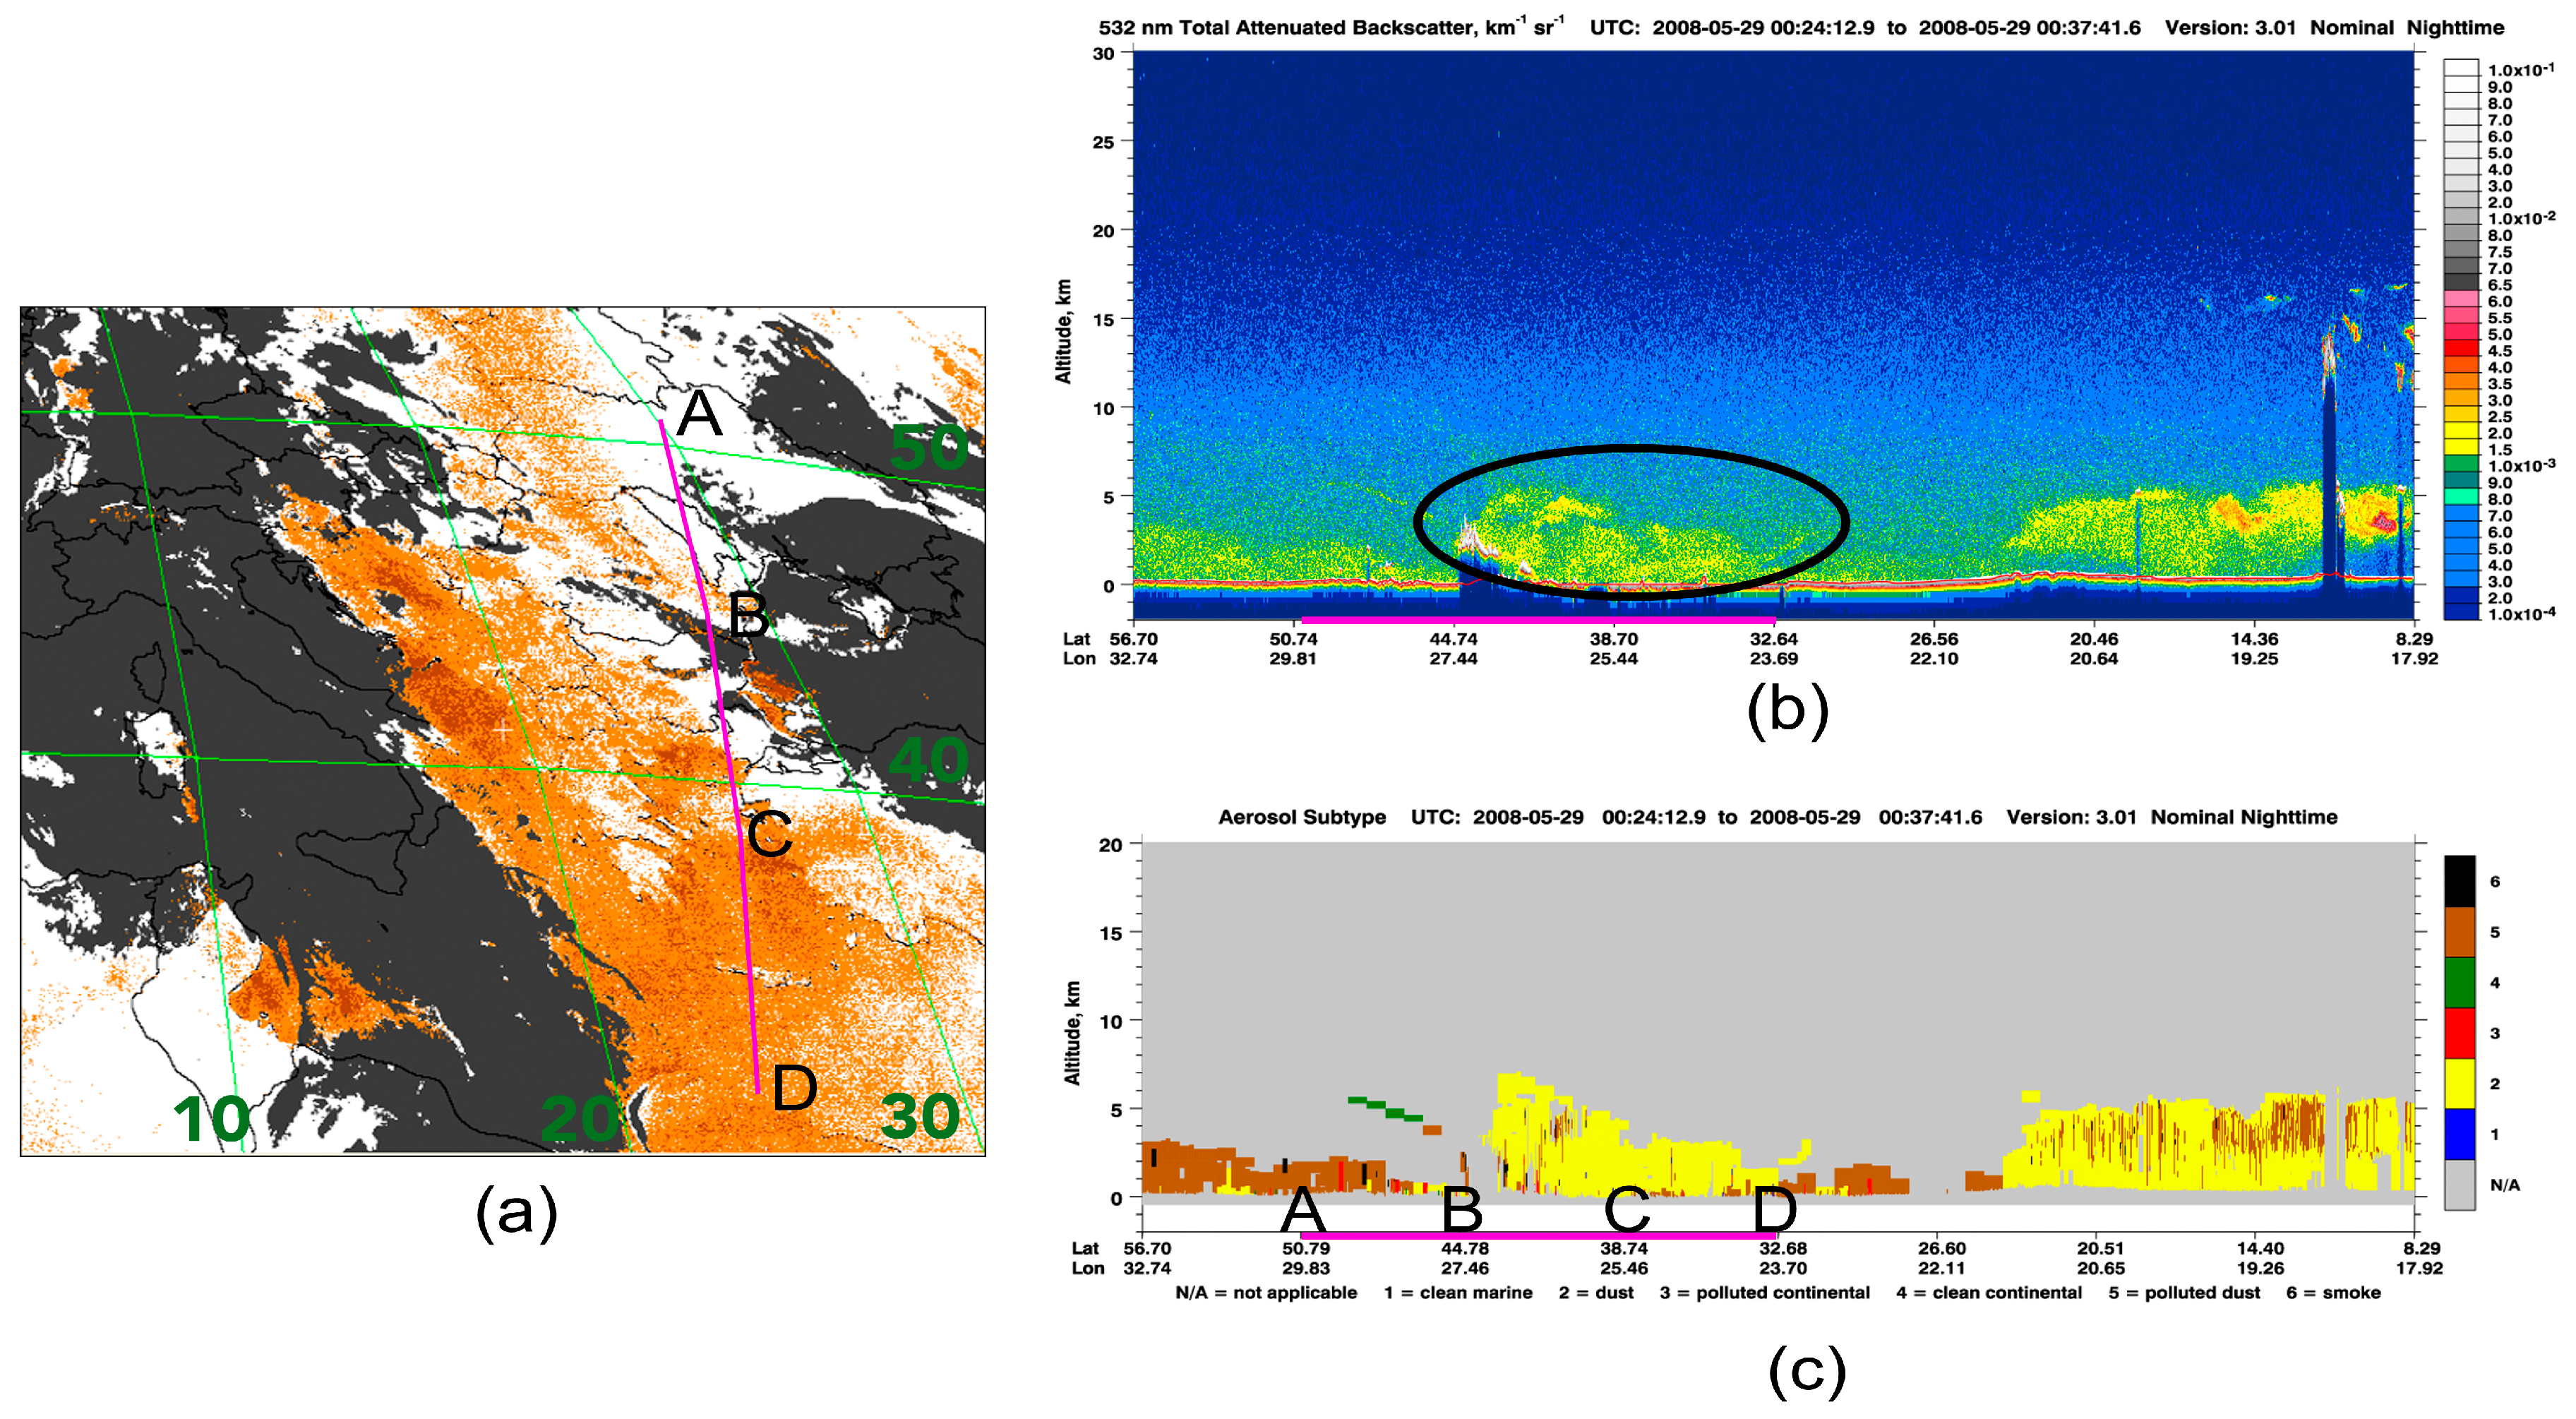
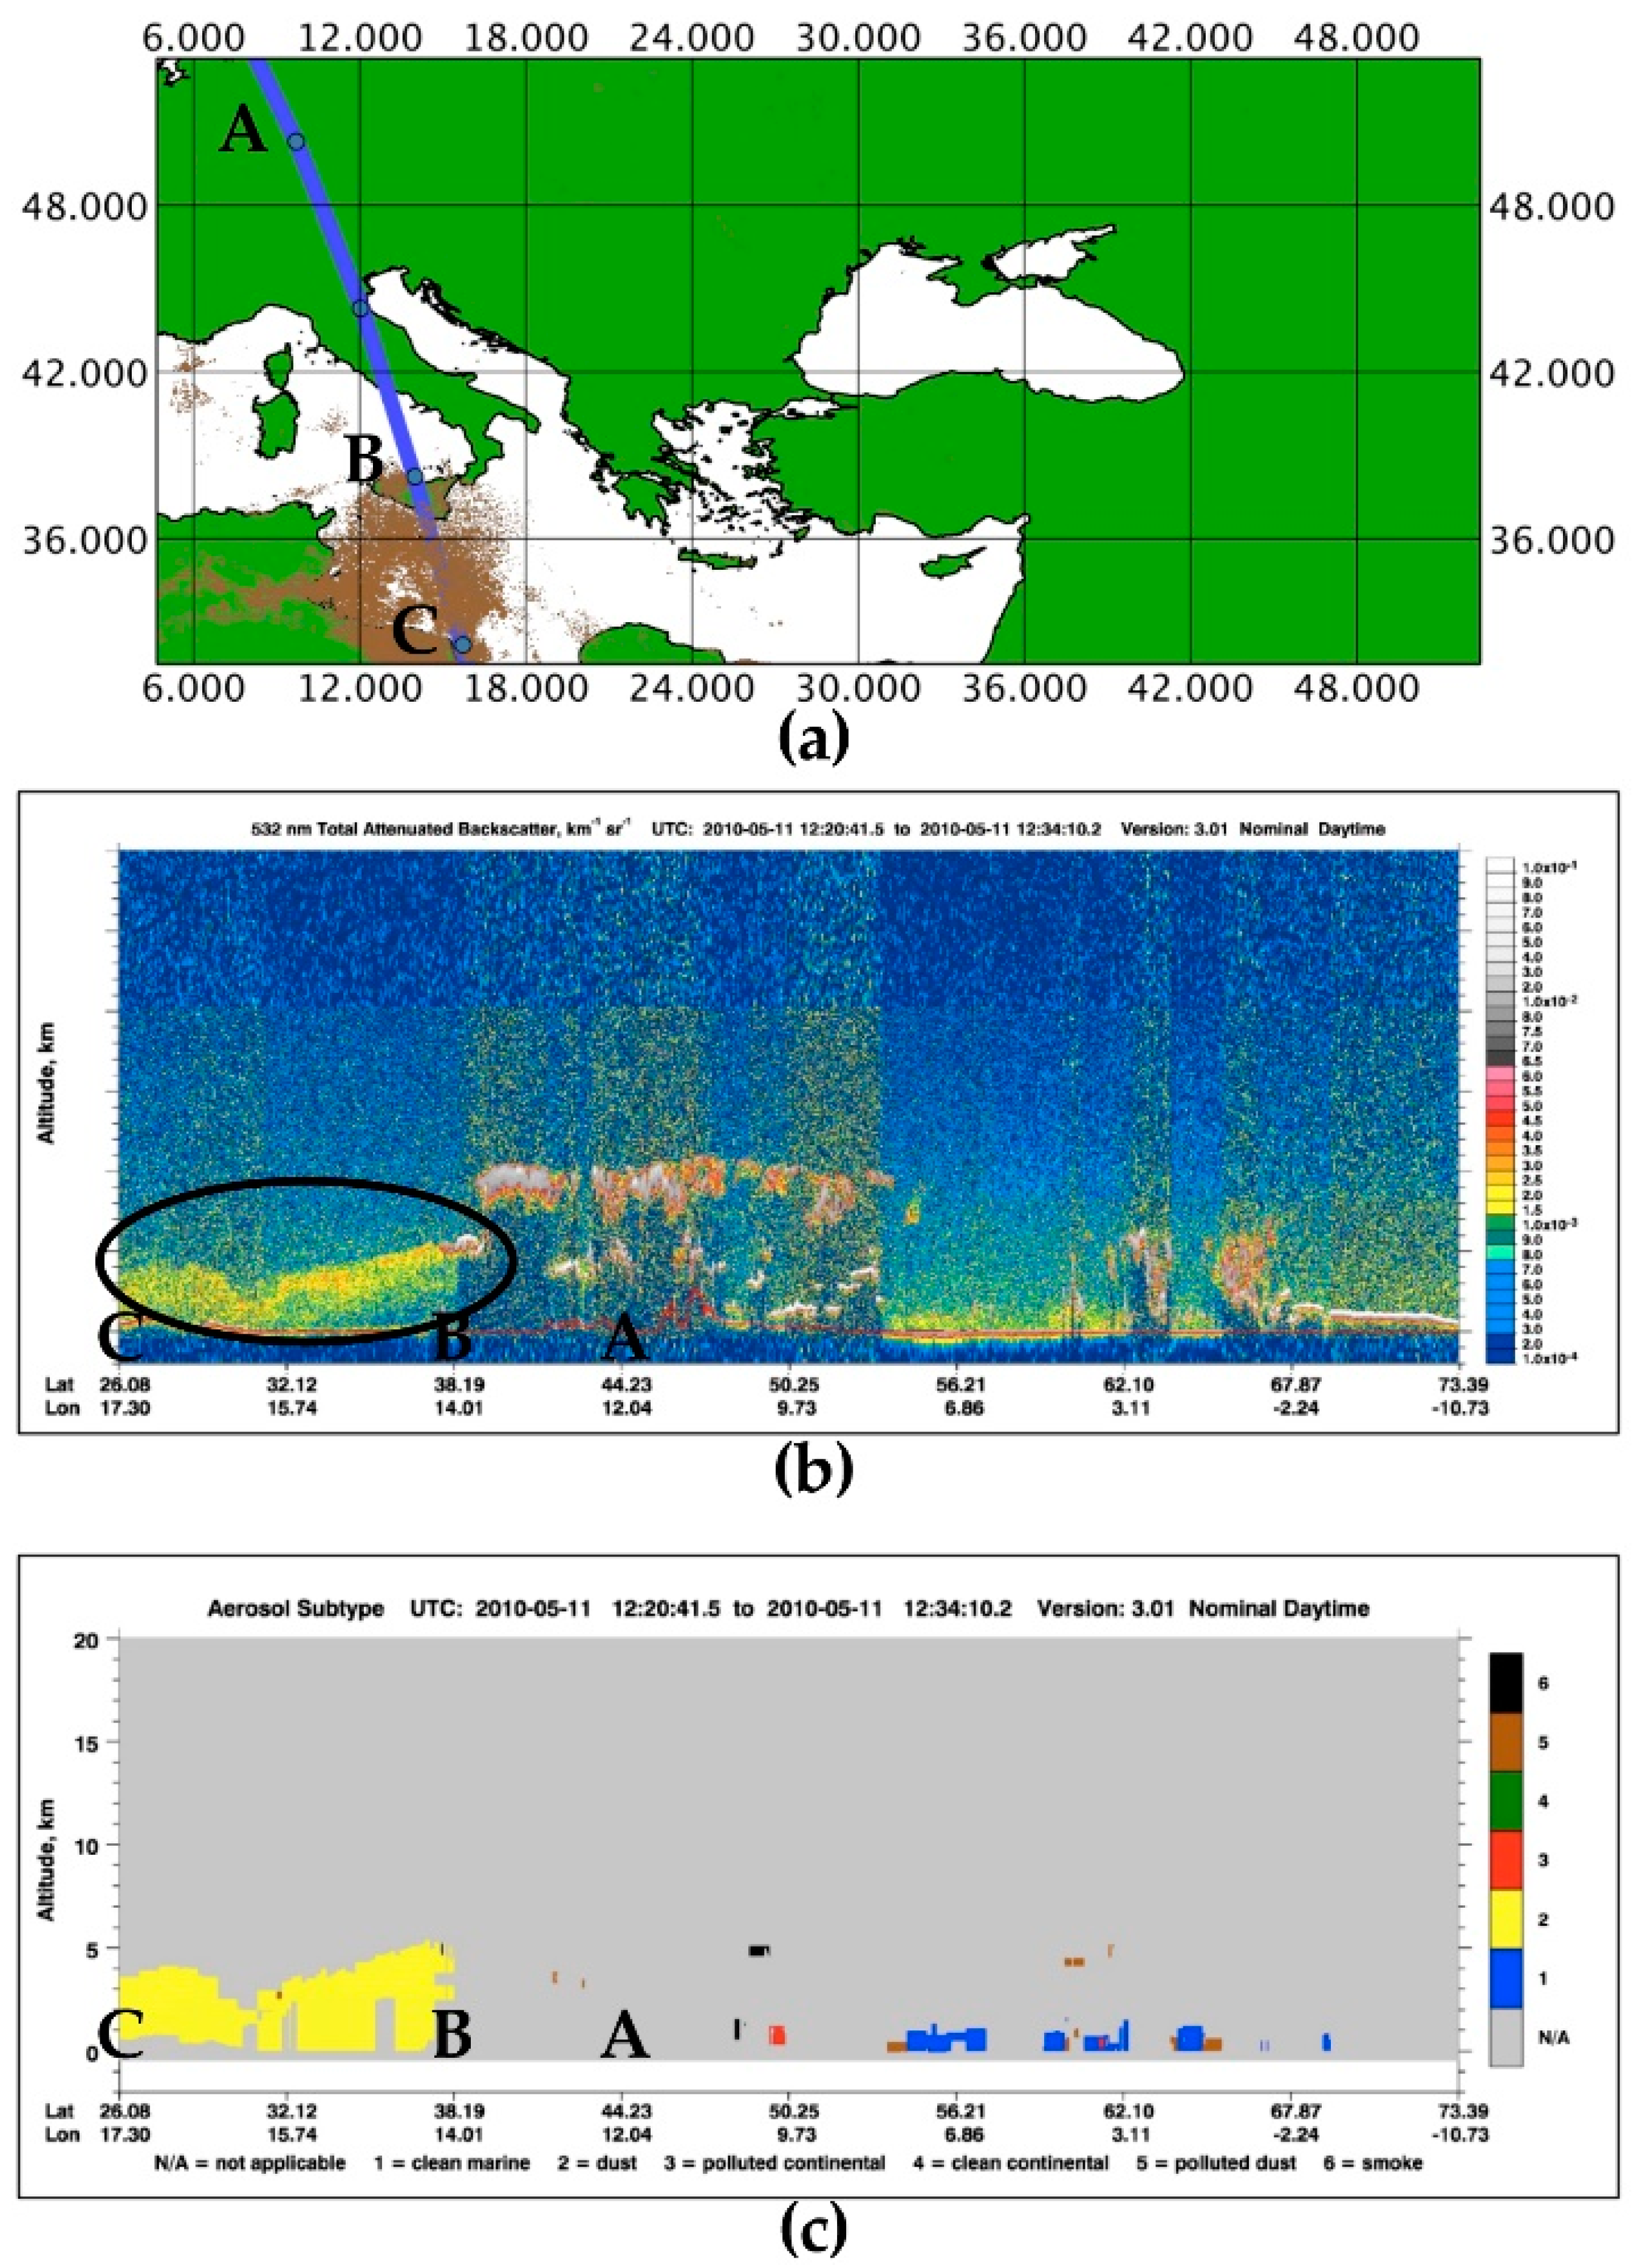
  • CALIOP is a two-wavelength polarization lidar providing high-resolution vertical profiles of clouds and aerosols in the troposphere and lower stratosphere [73,74]. This lidar is the primary instrument of CALIPSO (Cloud-Aerosol Lidar and Infrared Pathfinder Satellite Observations), which is part of the NASA “A-train” constellation [73,74,75]. The Level 1 CALIOP data products include calibrated and geo-located profiles of the total backscatter signal at 532 nm and 1064 nm, as well as of the perpendicular component of the 532 nm backscatter return [72]. The CALIOP Level 2 products analyse aerosol and cloud layers, respectively, classifying them into different types and the ice/water phase [74,76]. CALIOP observations have been widely exploited to assess the presence of desert dust aerosols inferred by AOD products at 532 nm and 1064 nm (e.g., [51,77]).
  • AERONET is a global network of ground-based sun photometers measuring the atmospheric aerosol properties and providing globally distributed observations of AOD (at 340, 380, 440, 500, 675, 870, 940, and 1020 nm) inversion products and precipitable water in different aerosol regimes [78]. AERONET observations were largely used to validate the satellite retrievals of desert dust (e.g., [26,68]). In this study, we analyse the temporal profiles of the Ångström exponent (α), made available online by the network, to assess the identification of airborne dust over specific locations of interest (see next section). The Ångström exponent gives qualitative information about the aerosol particle size (e.g., [79]). Specifically, values of α < 1 indicate a dominance of coarse mode aerosols (e.g., dust; sea salt particles), whereas values of α > 2 are associated with a size distribution dominated by fine mode aerosols (e.g., urban pollution and biomass-burning aerosols) (see [80] and reference herein).

5. Case Studies and Results

5.1. Saharan Dust Event of 18–23 May 2008

During 18–23 May 2008, a massive Saharan dust loading coming from Algeria and Tunisia moved towards Europe. On 18 May, the dust phenomenon mainly affected Italy and Central Europe. From 19 May, the dust plume dispersed over Eastern Europe, strongly affecting Greece (reaching an altitude of about 4–5 km above sea level) [81]. In the following hours, the dust concentration decreased, although desert dust aerosols remained in the troposphere for a long time [81].
Figure 2 shows the dust maps generated using the standard (Figure 2a) and enhanced (Figure 2b) RSTDUST algorithm, in reference to the SEVIRI data of 19 May 2008 at 09:15 UTC; the two colour codes indicate the regions characterized by a high (brown pixels) and medium-low (orange pixels) probability of dust presence in the atmosphere. The maps display the visible channel in the background for better emphasizing the cloudy areas (in bright tones). As can be seen from the figure, both RST algorithms flagged the presence of dust over the same portion of Mediterranean Sea. Nevertheless, according to the eRSTDUST map of Figure 2b, the dust phenomenon was more intense (see brown pixels) and spatially extended (especially over North Africa, Southern Italy, the Ionian Sea, and Eastern Europe) than that indicated by the standard RSTDUST technique (see Figure 2a).
To assess the identification of Saharan dust over the region of interest, Figure 3a displays the Terra-MODIS AOD at the 550 nm product of 19 May 2008 at 09:15 UTC. The latter shows that large AOD values (in red), indicating the presence of a high aerosol loading (e.g., [82]), affected the above-mentioned dusty region of the Mediterranean Sea. Moreover, values 0.4 < AOD < 0.6, compatible with the presence of a medium-dense dust layer (e.g., [83]), were independently retrieved over both the Puglia region (Southern Italy) and Ionian Sea (see region marked by the white circle in Figure 3a). Regarding the other dusty areas of Figure 2, a low aerosol loading affected southeastern Europe (e.g., Balkans; see Figure 3a), whereas the Terra-MODIS aerosol product did not provide any information over North Africa. It is worth mentioning that, according to a previous literature study, Saharan dust actually dispersed over eastern parts of Europe on 19 May 2008 [81]. Hence, it is realistic to assume that the dusty pixels flagged by eRSTDUST over the Balkans did not represent artefacts, but were rather associated with a thin dust layer.
To validate the dust detections over arid/semi-arid regions of North Africa, Figure 3b displays the Deep Blue MODIS AOD at the 550 nm daily product of 19 May 2008.
The map shows that medium-high values of AOD were retrieved over Libya, Tunisia, and Algeria, where eRSTDUST flagged several dusty pixels. Furthermore, where the algorithm considered the dust phenomenon as more intense (see region marked by the black ellipse in Figure 2b), the aerosol loading was particularly significant (see the high AOD values retrieved over same region in Figure 3b).
These investigations show that eRSTDUST is capable of performing better than the standard RSTDUST technique, particularly over land surfaces; including arid/semi-arid regions where we estimated (for the selected test case) an increase of sensitivity around 13%. Moreover, the algorithm proposed here seems to be more effective in discriminating dust from meteorological clouds (thanks to the use of ⊗TIR(x,y,t) index; see Section 3.2), as is evident when looking at artefacts reduction over cloudy regions of North Africa, Italy, and Central Europe (see Figure 2b).
Figure 4 displays the dust map of May 19 at 12:30 UTC (based on SEVIRI data acquired about three hours after that of Figure 2) and the Aqua-MODIS AOD at the 550 nm product of the same day and hour, confirming the efficiency of eRSTDUST detections. In particular, Figure 4a shows the persistence of the dust phenomenon over the Mediterranean Sea and part of the Puglia region, in good agreement with that indicated by the MODIS aerosol product of Figure 4b (see high AOD values retrieved over those areas). However, some dusty regions of Figure 4a (e.g., Southern Greece and Aegean Sea; see white ellipse in Figure 4b) were not quantified in terms of AOD (they were partially out of the MODIS scene or considered as overcast). Thus, to verify the presence of a dust layer over specific locations of interest, we investigated the temporal profiles of the Ångström exponent, made available online by the AERONET stations of Lecce-University (Puglia region; [84]) and Athens (Greece; [85]), indicated by green crosses in Figure 4a. Those profiles, which are not reported here, show that values of α (in the range 440–870 nm) derived at the Lecce-University measurement station on 19 May 2008 ranged from 0.3 to 0.4 (see [84]). With regards to Athens, α was still small assuming values between 0.3 and 0.75 (see [85]). Hence, although we cannot assess the identification of airborne dust over Southern Greece (e.g., Peloponnese) by means of the MODIS aerosol product of Figure 4b, it is realistic to suppose that a dust layer actually affected that area (as well as the Puglia region).
To investigate the space-time evolution of the monitored dust phenomenon in a retrospective way, Figure 5 displays dust maps of 00:00 UTC, 06:00 UTC, and 12:00 UTC, generated from the processed SEVIRI data of 18 May–23 May 2008. The maps report dusty pixels identified by eRSTDUST (see orange/brown pixels) and cloudy areas (in black) flagged by the EUMETSAT Cloud Mask (CLM) product, in order to emphasize the impact of meteorological clouds on the results of dust detection. As can be inferred from the figure, on 18 May, the dust plume affected North Africa and part of the Mediterranean Sea (see region between 30–40N; 10–20E), moving towards E-NE. The day after the dust coverage extended to the Balkans, affecting Greece. During 20–21 May, airborne dust dispersed over Eastern Europe, whereas, starting from 22 May (apart from the early morning of same day, when it seems that a dust layer affected North Africa once again), the dust event become progressively less intense (e.g., see the reduction of dusty pixels, particularly those depicted in brown).
It is worth noting that a diffuse cloud coverage affected the ROI during the investigated period (e.g., see 18–20 May). Hence, some regions of the dust plume probably remained undetected by satellite in the presence of overlying meteorological clouds (e.g., cirrus clouds). The panel of 19 May at 00:00 UTC shows, for instance, that the dust event was clearly underestimated over the Mediterranean Sea because of cloud coverage (e.g., see the dust map of the same day at 06:00 UTC for comparison). Moreover, eRSTDUST flagged a lower number of dusty pixels in night-time scenes, when compared to daytime scenes (e.g., see North Africa on panels of 18–19 May at 00:00 UTC for a comparison with those of 06:00 UTC). In addition, some possible artefacts were generated in areas located far from the dust front (i.e., also close to cloudy regions of Central Europe) that did not fit with the observed dust trajectory (e.g., see dusty pixels flagged on 20–21 May panels).
Despite the above-mentioned limitations, the dust episode of 18–23 May 2008 was, in general, well tracked from space. Information provided, for instance, over Southern Greece, seems to be consistent with the temporal trend of the Ångström exponent independently investigated over the Athens AERONET site, showing very small values of α (even lower than 0.5) during 19–21 May, along with the increase of the same parameter in the following days [81], when according to eRSTDUST, the dust phenomenon weakened.

5.2. Saharan Dust Event of 27–30 May 2008

During 27–30 May 2008, a heavy dust loading coming from the North of Sahara region (North-Eastern Algeria, Tunisia, and Libya) moved towards Europe, diffusing up to Scandinavia and the Norwegian Sea. Although low-pressure surface systems over the Western Mediterranean and Central Europe caused heavy rainfalls, they did not prevent the transport of large amounts of dust through the Alps towards Central and Northern Europe [86].
Figure 6a displays the eRSTDUST product of 29 May at 00:00 UTC, showing the presence of a dust plume (see orange/brown pixels) over a region extending from part of the Mediterranean Sea to part of the Balkans. To assess the presence of airborne dust over this region (where the plume was probably only partially detected by the satellite because of cloud coverage), Figure 6b displays the Total (parallel + perpendicular) attenuated backscattered profile measured by CALIOP, for the same day of the analysed SEVIRI data, at 00:24:12–00:37:41 UTC along the orbit track of CALIPSO (depicted in purple in Figure 6a). The figure shows that an aerosol layer affected the B-C-D region (see black ellipse) where eRSTDUST flagged the presence of airborne dust, reaching an altitude of about 7 km above sea level (a.s.l).
In more detail, eRSTDUST identified a few dusty pixels over the region where the polluted dust was dominant (i.e., along the A-B orbit track of CALIPSO), as indicated by the analysis of the aerosol sub-type profile of Figure 6c. On the other hand, the number of dust detections drastically increased in the presence of desert dust aerosols, apart from the locations clearly affected by meteorological clouds (see black pixels in Figure 6a).
To assess the performance of eRSTDUST in tracking the second dust episode of May 2008, we show, in Figure 7, some dust maps generated through the processing of SEVIRI data (of the same hours of Figure 5) acquired at the end of month. As can be seen from the figure, the dust plume coming from North Africa dispersed first over the Mediterranean Sea and Italy, affecting Eastern Europe from 28 May. Afterwards, an evident intensity reduction characterised the monitored dust event (see dust maps of 30–31 May), as revealed by the lower number of dusty pixels depicted in brown. It is worth mentioning that during the first phase of the event, eRSTDUST also flagged the presence of airborne dust over some cloudy regions, which were in spatial contiguity with dusty areas of North Africa (e.g., see panel of 27 May at 06:00 UTC). The identification of dusty pixels over those regions seems to indicate that the dust layer was probably higher in altitude than meteorological clouds.
Independent EARLINET (European Aerosol Research Lidar Network) measurements performed over Italian and German regions during the period of interest [87], as well as OMI (Ozone Monitoring Instrument) observations reported and discussed by other authors in a previous study [88], seem to confirm the results of Figure 7. In particular, AI (Aerosol Index) maps of 12:00 UTC obtained from OMI data, describing regions affected by UV absorbing aerosols, revealed, on 27 May, the presence of a dust plume over North Africa and nearby southeastern France, dispersing over Italy and Eastern Europe the day after. On 29 May, a smaller dust coverage was observed over the Mediterranean Sea, while on 30 May, the AI map showed the movement of the dust front towards the north of Europe [88].
Information provided by eRSTDUST is also consistent with that forecasted by the BSC-DREAM8b model (predicting the atmospheric life cycle of eroded desert dust over North Africa, the Middle East, and Europe, by solving the Euler-type equation for dust mass continuity [89,90]), whose products were independently assessed in previous literature studies (e.g., [91]). In detail, a comparison of the dust maps of Figure 7 with dust forecast products of Figure 8 shows that detected and predicted dust plumes were similar in terms of the shape, spatial extent, and direction, with the main differences characterizing regions where eRSTDUST did not detect dust because of cloud coverage (e.g., see panels of 27 May at 12:00 UTC). This is evident when looking at the dust maps of 27–29 May 2008, revealing the identification of several dusty pixels over areas (e.g., see North Africa and Italy) where the BSC-DREAM8b model forecasted, for the same day and hour, the presence of a significant dust loading. Moreover, the intensity reduction of the monitored dust phenomenon observed by satellite during 30–31 May is compatible with that foreseen by the model for the period of interest (see Figure 8).

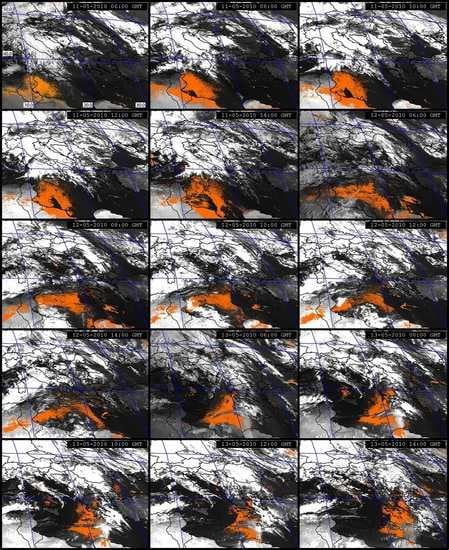
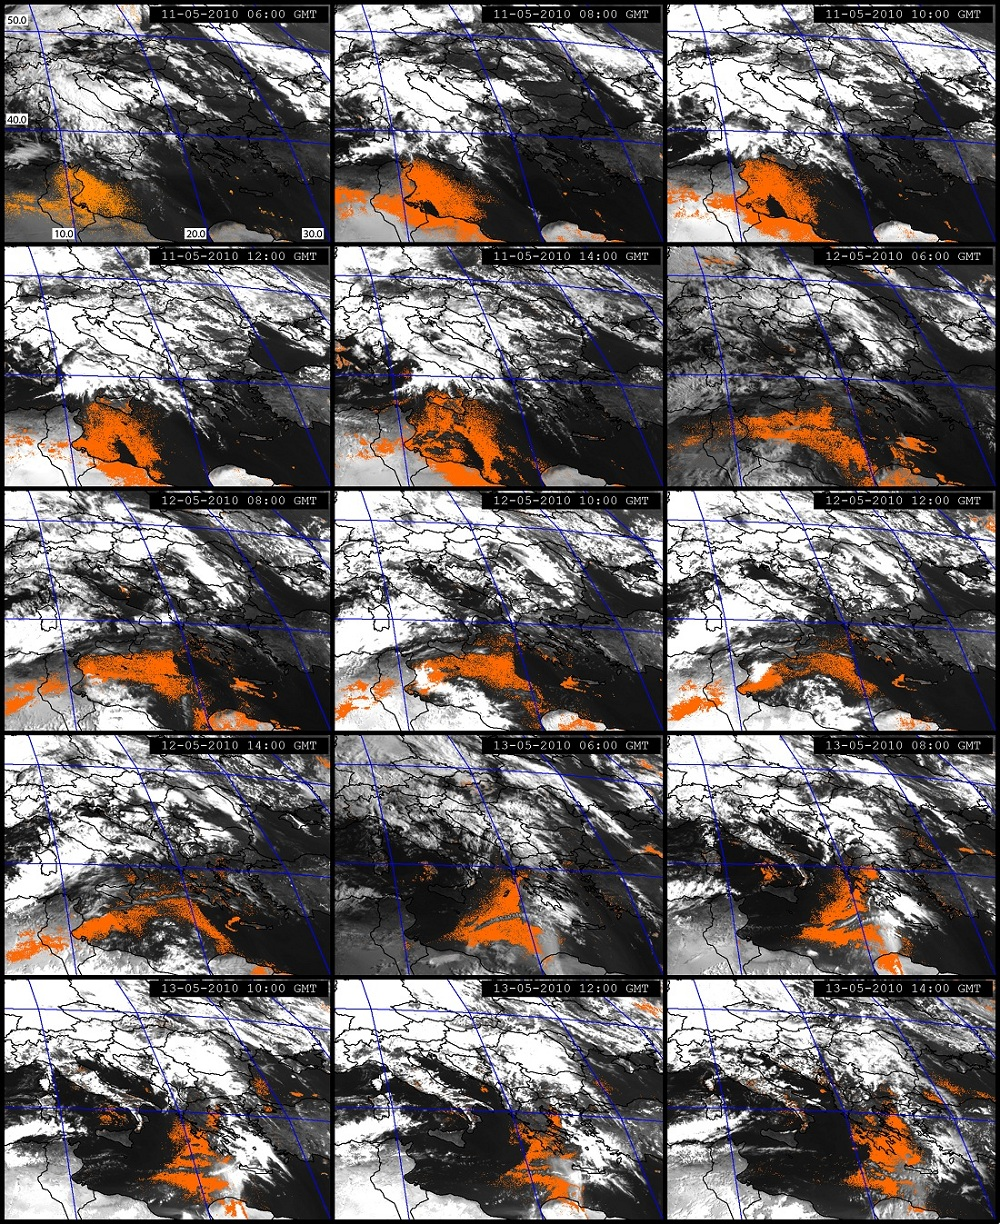
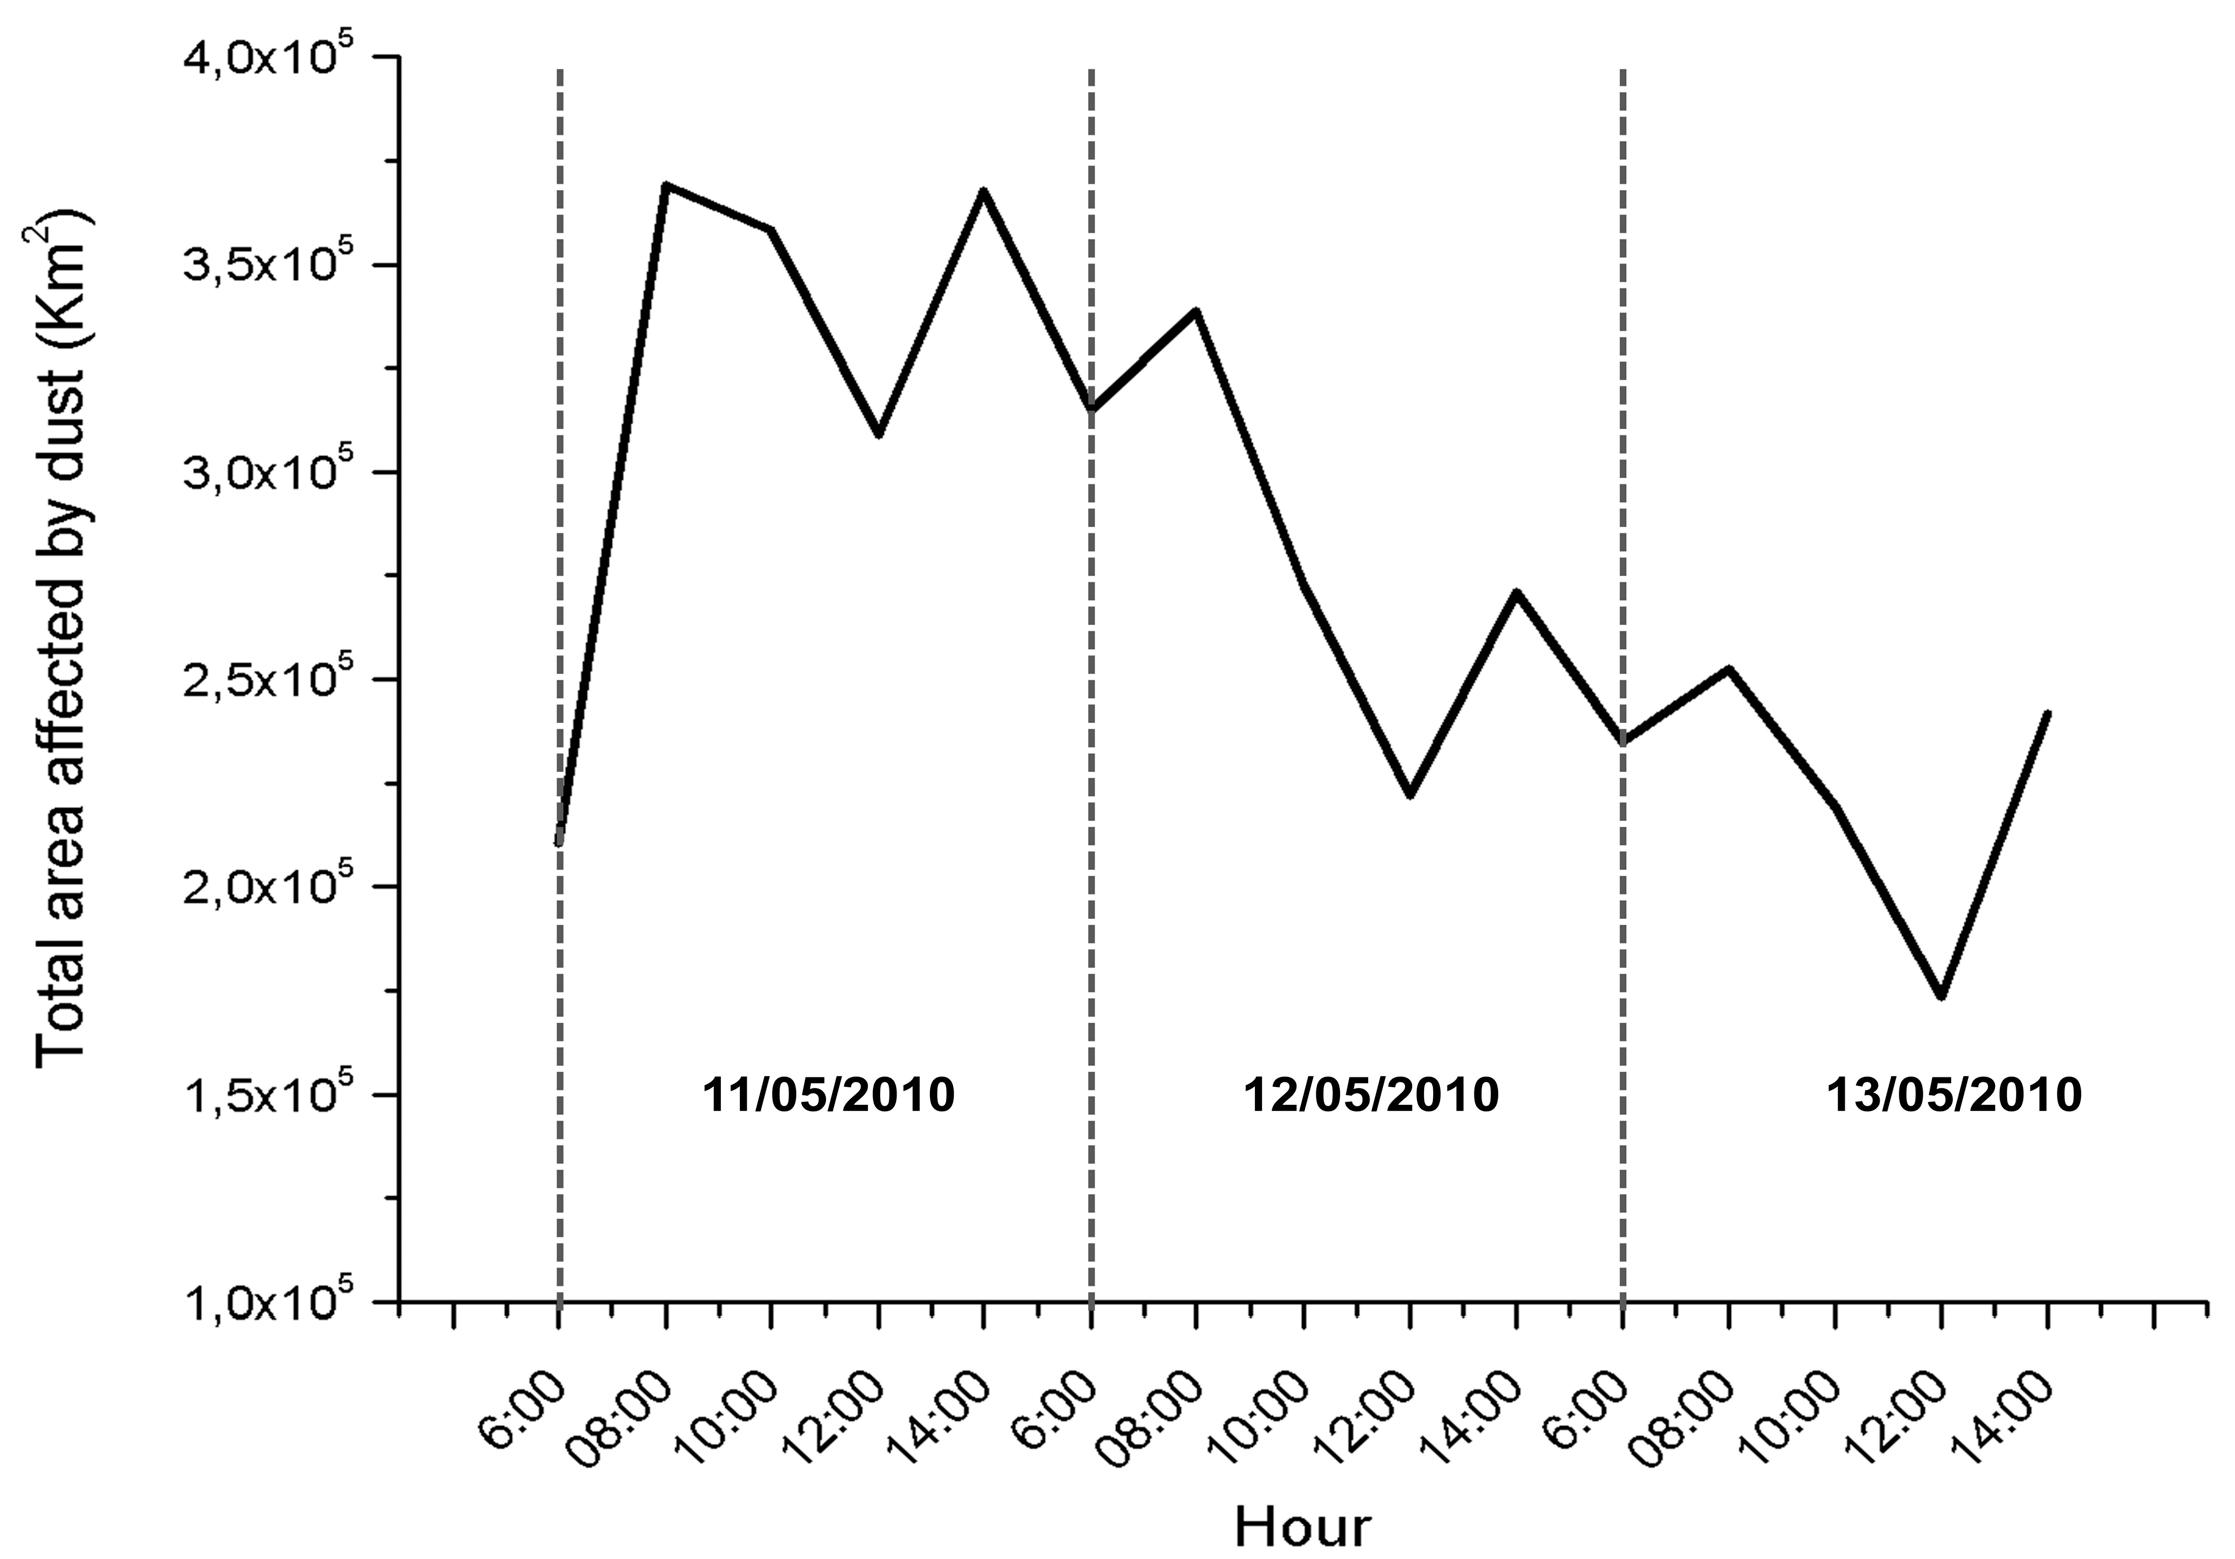
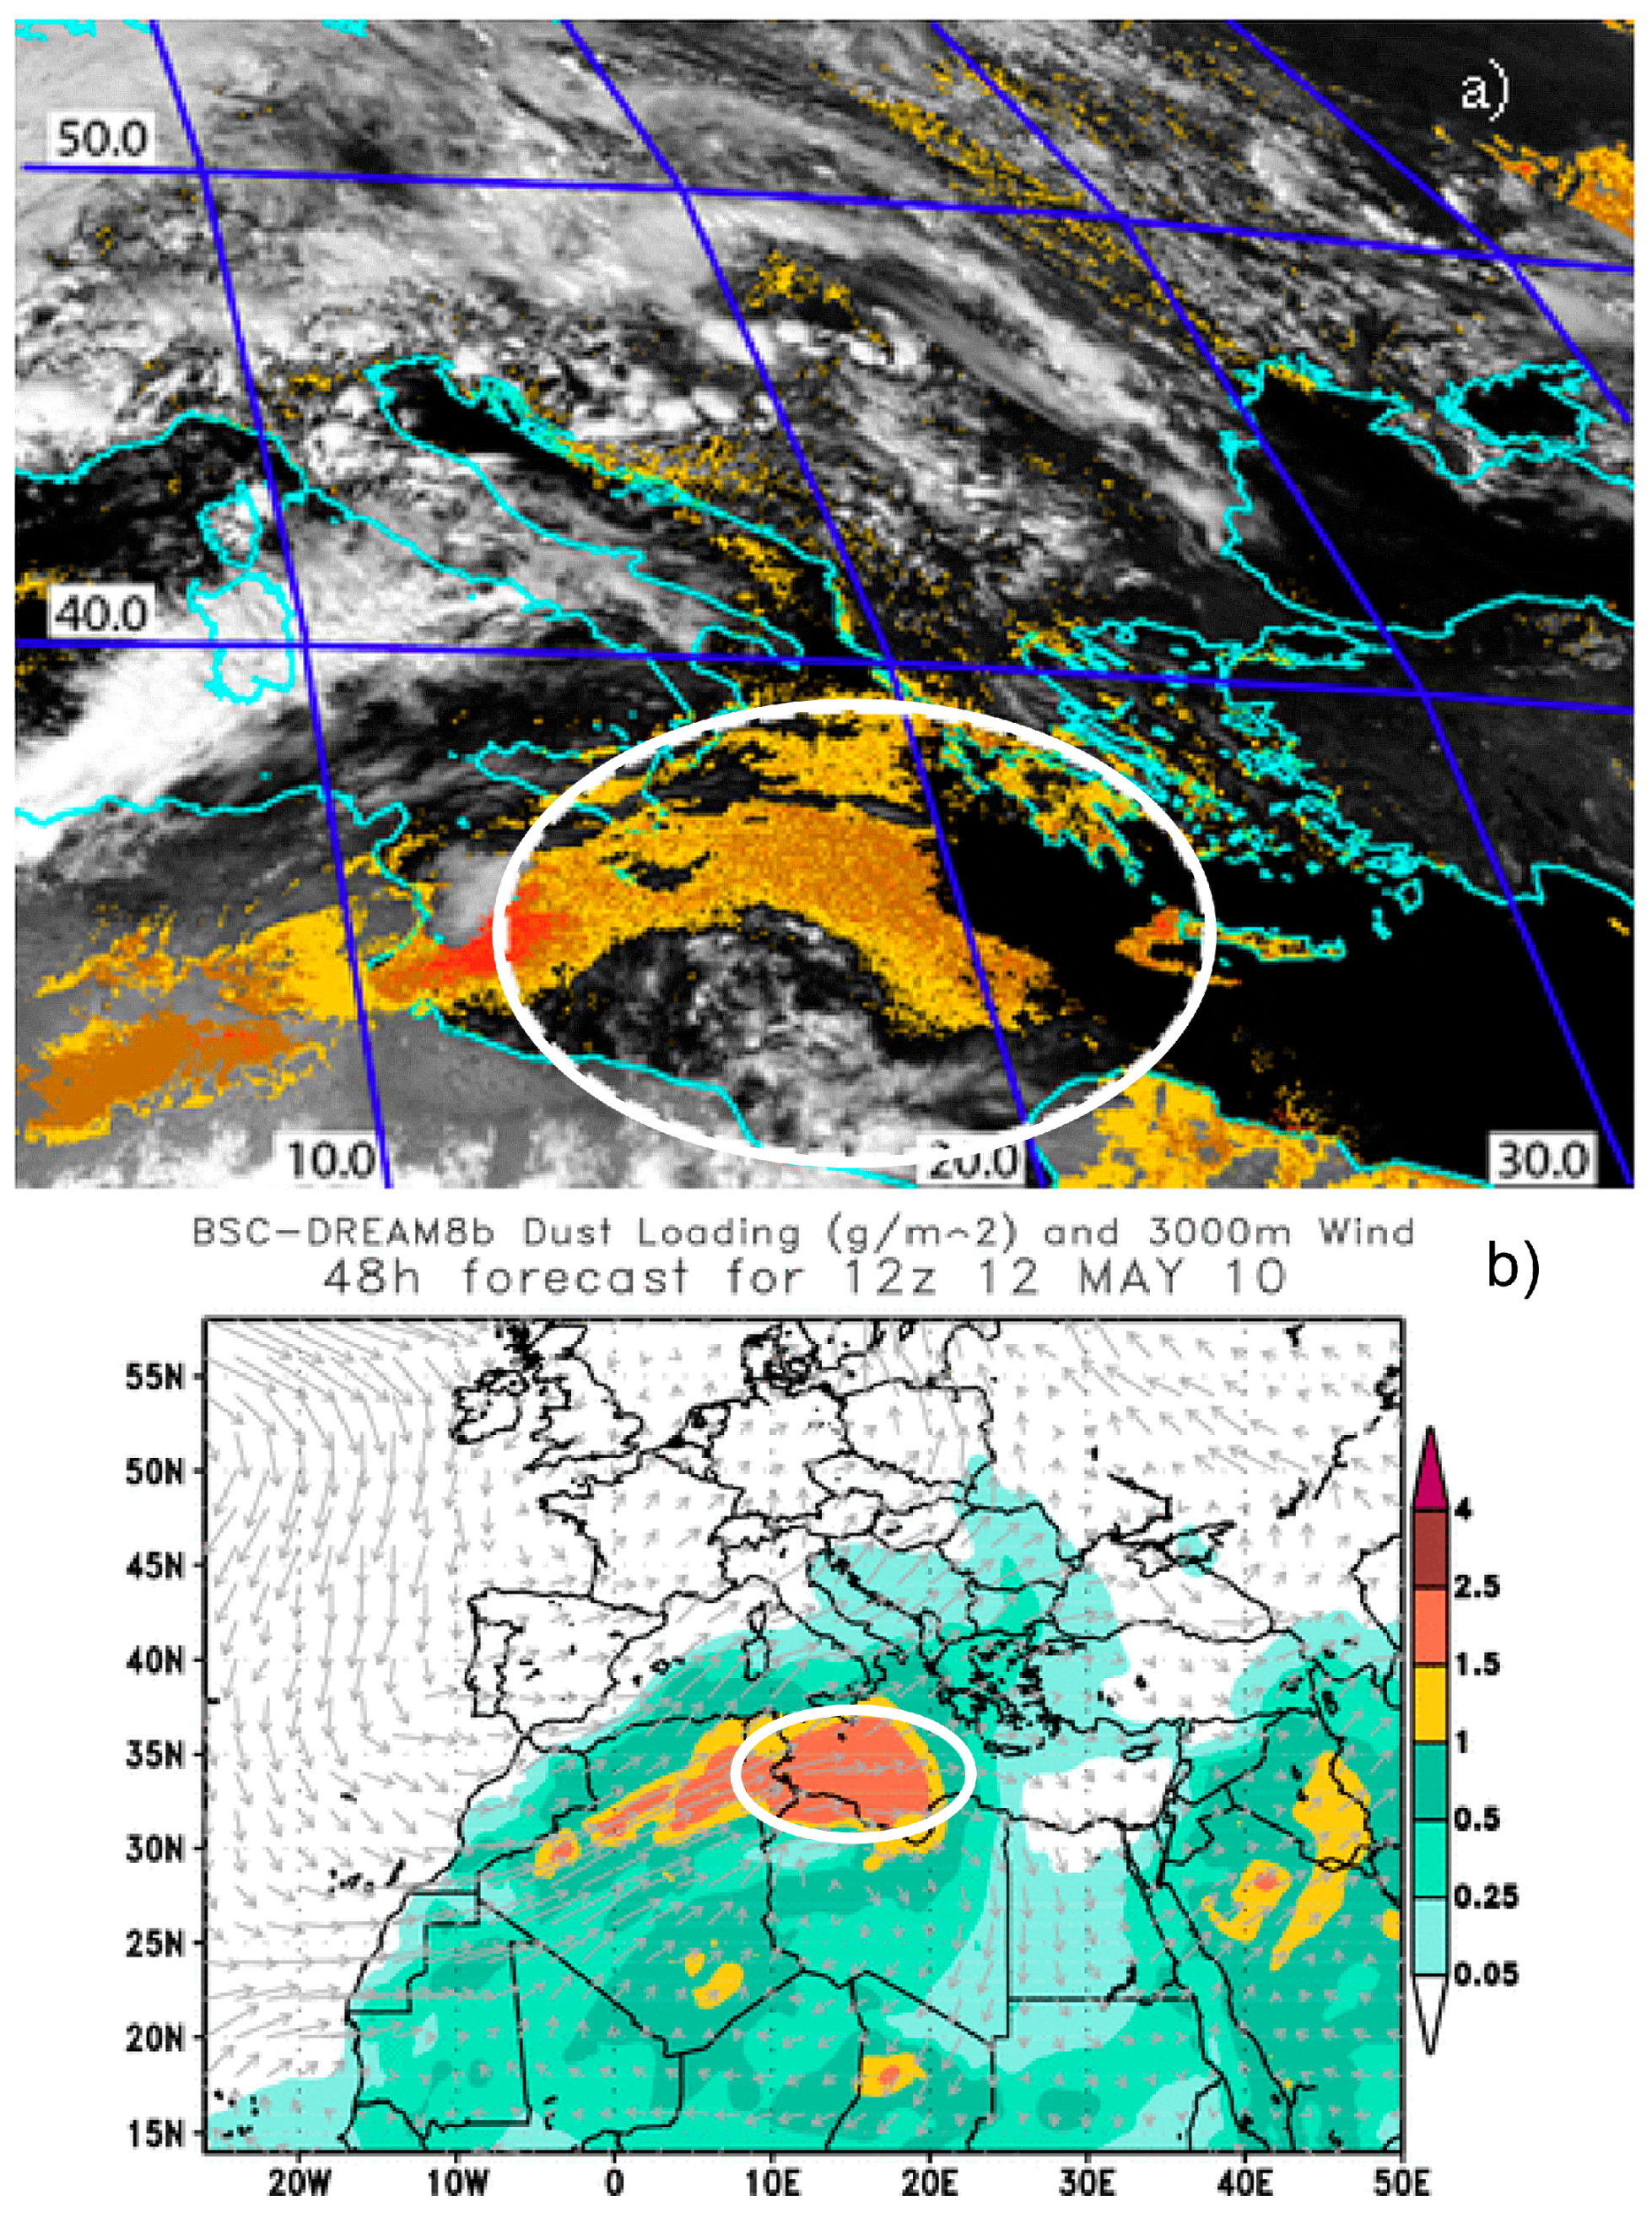
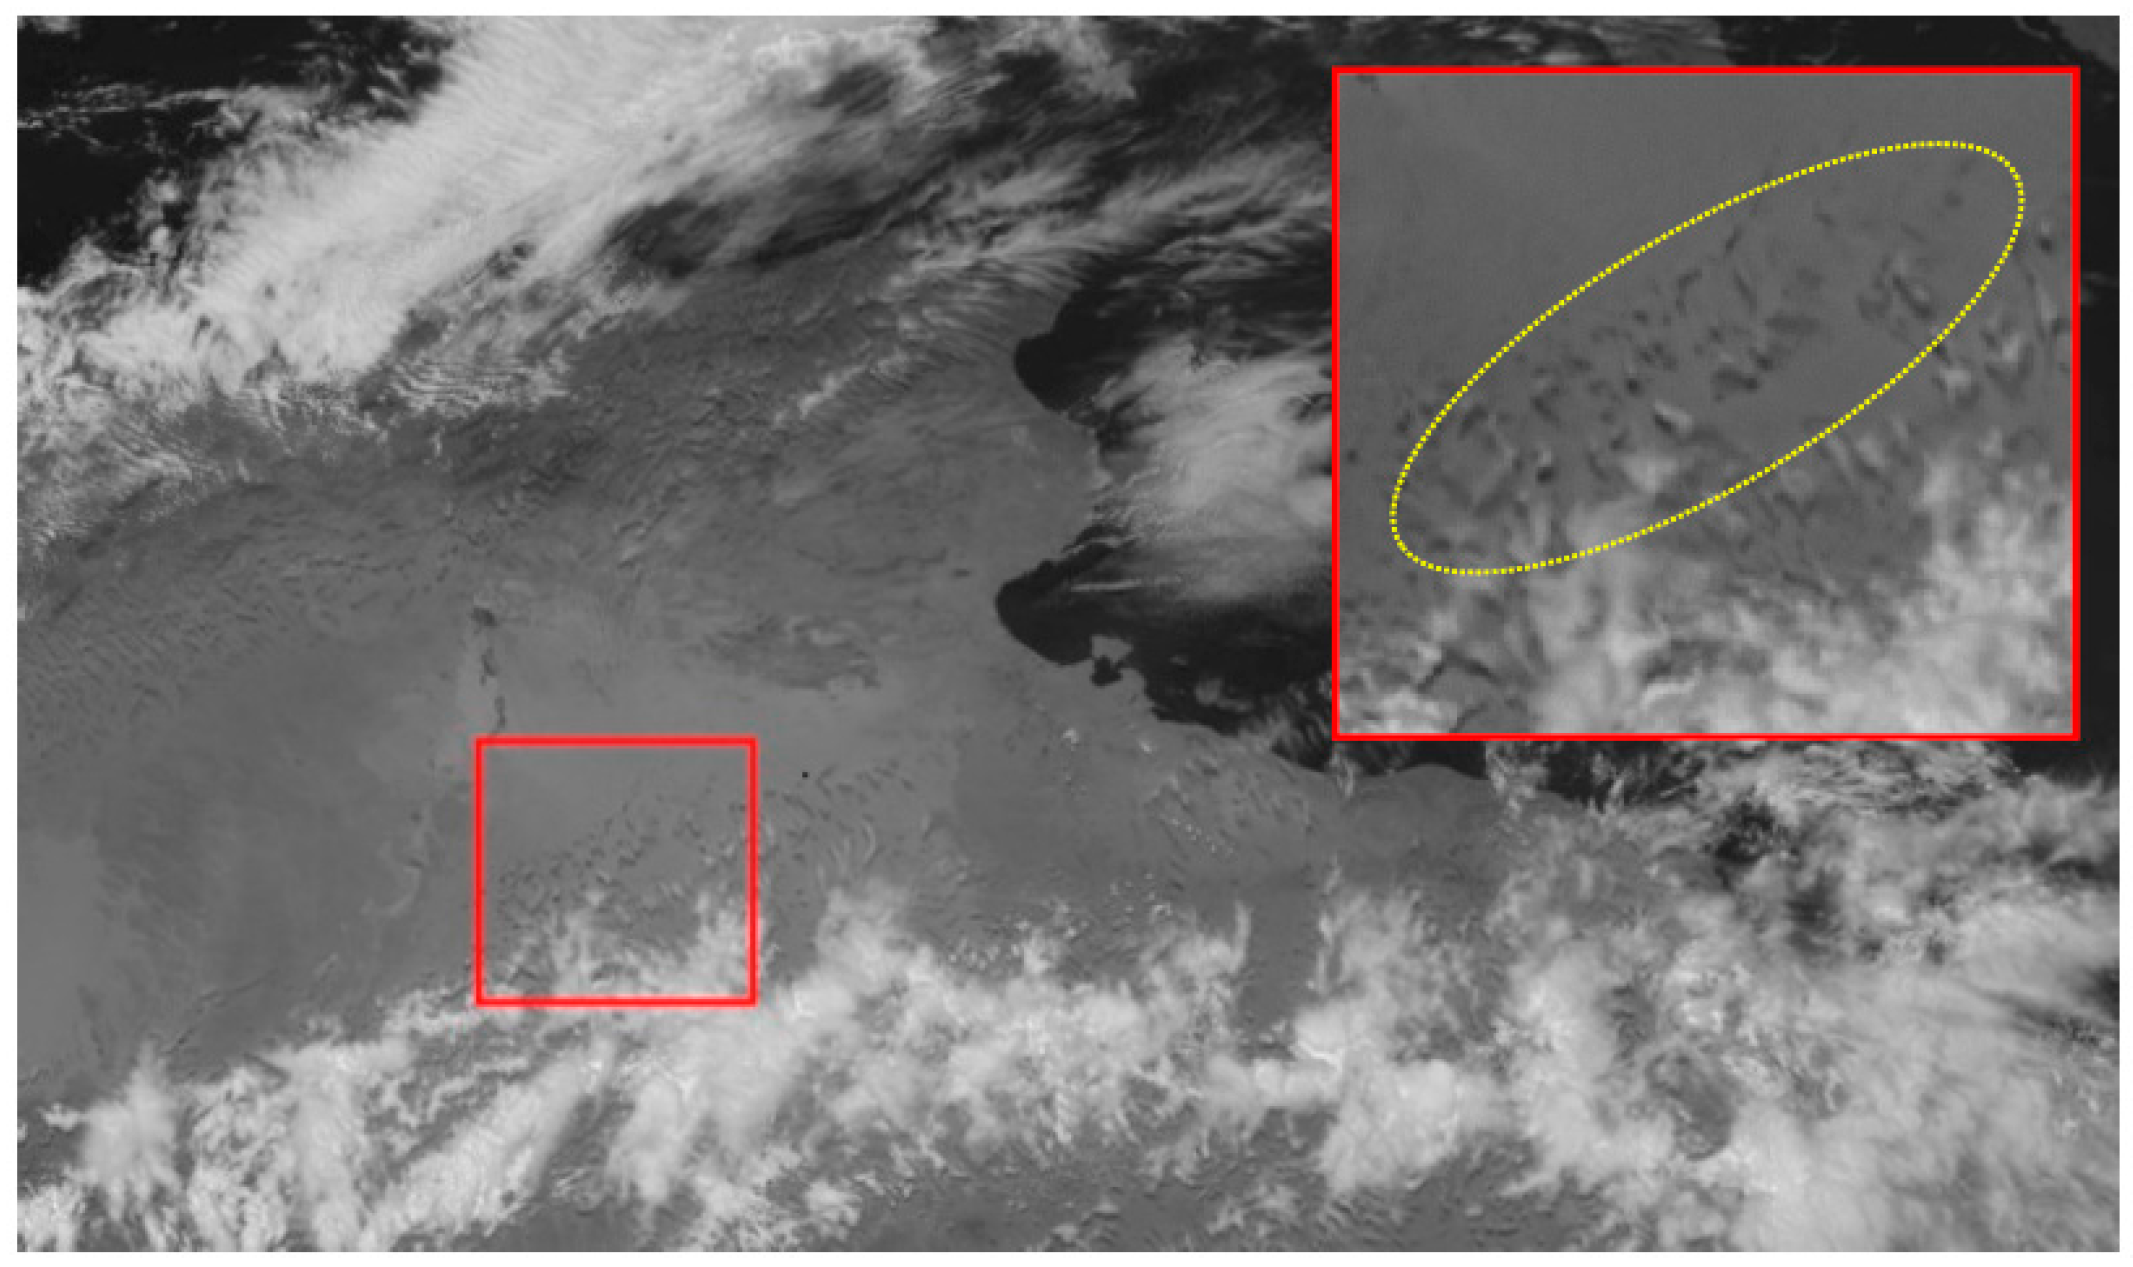
5.3. Saharan Dust Episode of May 2010

In mid-May 2010, a thick dust layer coming from the Sahara region affected the Mediterranean Sea and coasts of Libya. In the following days, airborne dust dispersed over the Peloponnese region [92]. During 13–14 May, a number of EARLINET stations observed the dust event in concomitance with volcanic ash emitted by the Eyjafjallajökull (Iceland) volcano [93,94].
Figure 9a displays the eRSTDUST map of 11 May at 12:30 UTC, showing the identification of a dust plume (depicted in brown) extending from Northeastern Libya to Sicily, dispersing over the region intersected by the orbit track of CALIPSO (in blue). In particular, the Total Attenuated Backscatter profile of Figure 9b, acquired on May 11 between 12:20 and 12:34 UTC, shows that an aerosol layer (reaching the altitude of ~5 km a.s.l.) affected the region marked by the black ellipse, where eRSTDUST flagged a significant number of dusty pixels (see B-C region in Figure 9a). In addition, the aerosol sub-type profile of Figure 9c classified that aerosol layer as desert dust, further corroborating the information provided by our algorithm.
It should be pointed out that only values of ⊗VIS(x,y,t) > 0 (L), 1 (S) ANDTIR(x,y,t) > −2 ANDΔTIR(x,y,t) < −1 were analysed in Figure 9a to identify dusty areas minimizing artefacts. Figure 10 displays the eRSTDUST products (with a two-hour time interval) of 11–13 May 2010 at 06:00–14:00 UTC, showing that when running the aforementioned daytime algorithm configuration, only a few pixels were erroneously flagged as dust (e.g., see artefacts generated over NE corner of image on panel of 12 May at 12:00 UTC). Figure 11 quantifies the total dusty area retrieved from Figure 10 (by counting the number of detected dusty pixels and assuming a mean SEVIRI pixel area of 15 km2). As can be seen from the plot, the dust coverage reached the maximum spatial extent in the morning of 11 May, when the Saharan dust dispersed over North Africa and the Mediterranean Sea. In the following days (i.e., when the plume moved towards SE affecting Greece), the total area affected by dust significantly decreased. It is worth noting, however, that despite the general decreasing trend characterizing the analysed parameter, a relative minimum in the total area affected by dust was systematically recorded at 12:00 UTC, indicating that eRSTDUST was probably less effective in detecting airborne dust on satellite imagery acquired at noon (i.e., at local early afternoon), regardless of the background surface.
Besides, whilst the use of the single (and most conservative) daytime algorithm arrangement minimized artefacts, it also reduced the algorithm performance over land areas.
This is evident when looking at Figure 12a, which shows that even pixels having values of ⊗VIS(x,y,t) > 0 ANDTIR(x,y,t) > −2 ANDΔTIR(x,y,t) < 0 had to be analysed to detect airborne dust over the coastal region of Tunisia for SEVIRI data of 12 May at 12:00 UTC. Over this region, a dust layer was presumably present, as indicated by the BSC-DREAM8b forecast product of Figure 12b.
The spatial profiles of eRSTDUST indices, retrieved along the A-B-C-D transect region (in yellow) of Figure 13a, better emphasize that discussed above. In detail, Figure 13b describes the spatial behavior of ⊗ΔTIR(x,y,t) (i.e., ALICE BTD; in red) and of the BTD signal (in black) along the same transect, showing that both indicators assumed negative values over the A-B transect portion, owing to the presence of Saharan dust. However, along the contiguous B-C dusty region, the BTD increased, becoming positive, while values of −1 < ⊗ΔTIR(x,y,t) < 0 were recorded. Regarding the C-D transect portion, intersecting part of the Mediterranean Sea (which was still affected by dust), the BTD decreased, remaining positive, whilst the ⊗ΔTIR(x,y,t) index assumed values even lower than −2. Thus, eRSTDUST was capable of detecting the plume, even where the dust BTD signature was weakened (i.e., along the B-D transect region), and common fixed threshold tests applied to the simple BTD signal (e.g., BTD < 0) would have failed in detecting airborne dust.
As a matter of fact, Figure 13c, displaying the spatial trend of the ⊗VIS(x,y,t) (i.e., ALICE VIS curve; in red) and ⊗TIR(x,y,t) indices (i.e., ALICE TIR curve; in black), shows that eRSTDUST did not detect dust only in correspondence of a few land locations indicated by green arrows. Over these locations, the ⊗VIS(x,y,t) index assumed negative values, preventing the possible identification of airborne dust. Since high values of the temporal mean typically characterize bright surfaces (e.g., desert regions, see Figure 1a), we can speculate that cloud shadows caused the abrupt reduction of the ⊗VIS(x,y,t) index recorded in Figure 13c. This hypothesis seems to be corroborated by Figure 14, displaying the HRV (High Resolution Visible) SEVIRI image of 12 May 2010 at 12:00 UTC at a 1 km2 spatial resolution.
It should also be noted that the ⊗VIS(x,y,t) index strongly increased in magnitude (in the presence of desert dust aerosols) when passing from land to sea areas (i.e., from B-C to C-D transect region of Figure 13c), because of the changes in the values of the spectral reference fields previously discussed in Section 3. Moreover, the ⊗VIS(x,y,t) index reached its peak over sea region where the lowest values of ⊗ΔTIR(x,y,t) index were retrieved (see Figure 13b), indicating that a significant dust layer probably affected that area (see red pixels in Figure 12a). Finally, the increase of both the BTD signal (up to positive values) and the ⊗ΔTIR(x,y,t) index recorded along the B-C transect region was possibly determined by differential changes in the surface emissivity, related to the presence of a different background (e.g., the transect of Figure 13a partially intersected the Chott el Jerid salt lake). Those emissivity variations affected the ⊗ΔTIR(x,y,t) index (remaining negative) in a less significant way than the simple BTD signal (see Figure 13b), confirming the low impact of site effects on the performance of the algorithm presented and tested in this work.

6. Discussion

The RSTDUST method, which uses the single ⊗ΔTIR(x,y,t) index to detect dust clouds, was investigated and produced good results for studying and monitoring dust outbreaks that have affected Australia, the Mediterranean basin, and the Arabian Peninsula in recent years, in spite of some limitations (e.g., reduction of sensitivity over desert regions, dependence on some meteorological clouds [28,58]). In this work, we have addressed these issues by assessing the performance of eRSTDUST, which is an optimized configuration of the above-mentioned multi-temporal technique. The algorithm proposed here uses up to three local variation indices in combination to identify Saharan dust from space, integrating information provided by single TIR and/or VIS channels of SEVIRI to that retrieved from the analysis of the BTD (i.e., BT11-BT12) signal.
The results presented in this study have shown that eRSTDUST is capable of performing better than the standard RSTDUST algorithm, increasing the trade-off between reliability and sensitivity; thanks to a more efficient identification of dusty pixels, especially over land surfaces (e.g., arid/semi-arid regions), coupled with an improved capacity to distinguish dust from meteorological clouds. Furthermore, eRSTDUST is capable of providing information even in regions where the dust BTD signature is weakened (e.g., in the presence of optically thin dust layers) and dust plumes are consequently more difficult to identify (see Section 5.3). Actually, eRSTDUST analysing relative rather than absolute signal variations is less affected (such as the standard RSTDUST algorithm) by site (e.g., seasonal variations of vegetation in semiarid regions causing changes in the surface emissivity) and atmospheric effects (e.g., rich-moisture environment; near-surface temperature inversion), generally affecting performance of satellite-based methods developed to detect airborne dust (e.g., [47,49,95]).
As the main limitations, eRSTDUST shows: (i) a reduction of sensitivity under specific illumination conditions; (ii) the underestimation of plume regions in the presence of meteorological clouds obscuring the BTD signal; and (iii) the generation of residual artefacts.
Sensitivity reductions particularly affect eRSTDUST in the night-time, when to guarantee a reliability level comparable to daylight conditions, values of −1 ≤ ⊗ΔTIR(x,y,t) < 0 are not investigated (see Section 3), with the consequent reduction in the algorithm performance, mainly over land surfaces. On the other hand, possible reductions of eRSTDUST sensitivity may also occur in the daytime (although in a less significant way than night-time conditions) because of cloud shadows (causing negative values of ⊗VIS(x,y,t) index; see Section 5.3) and probably due to the diurnal cycle of cloud cover [96]. This work has revealed a systematic reduction of dusty pixels on satellite imagery acquired at noon, owing to the increase of the cloudiness recorded over the ROI in the early afternoon, analysing the operational EUMETSAT CLM products. In addition, some investigations are currently in progress to assess the possible dependence of the ⊗ΔTIR(x,y,t) index also on dust cloud features (e.g., plume height).
With regards to artefacts, a single eRSTDUST configuration may be used in the daytime for further minimize their occurrence in areas strongly affected by meteorological clouds (see Section 5.3); however, this arrangement would reduce the sensitivity of our method over bright surfaces, probably influencing its performance close to dust emission sources. A spatial noise filter, aiming at removing sparsely distributed pixels that are generally not ascribable to dust, could be then implemented within the process, without reducing the sensitivity. In addition, the multi-temporal analysis of the BT8.6–BT11 signal (which is also sensitive to desert dust aerosols, as discussed in Section 2), could enhance the identification of dust outbreaks under different illumination conditions.
It is important to stress that eRSTDUST requires the availability of a sufficiently populated dataset of multiyear satellite records to be correctly applied (i.e., the longer the time series, the higher the efficiency of dust detections). This offline analysis, devoted to generate the library of spectral reference fields, may require the use of advanced computational systems (e.g., Graphics Processing Unit—GPU) to reduce processing times over broad areas. Nevertheless, once the setup activity is accomplished, the algorithm runs fast, generating dust products a few minutes after the sensing time (e.g., only five minutes are required to generate the dust maps over the region of interest investigated in this work). This means that eRSTDUST running on SEVIRI data enables the monitoring of dust outbreaks in quasi real time. In addition, the algorithm may be potentially used in any geographic area and period of the year, allowing us to investigate dust events related to sources (e.g., Gobi desert, which is one of main sources of Asian dust [97]) different from the Sahara region. Obviously, to assess eRSTDUST performance in other geographic areas and/or in the presence of dust plumes of different features (e.g., for chemical/microphysical composition), specific investigations are required (e.g., exploiting data provided by sensors like MODIS).
It is important to remark that our algorithm only provides qualitative information about dust outbreaks, although dusty pixels associated with a high confidence level of detection affected regions with high AOD values (retrieved by independent aerosol products), while those indicating a less intense dust phenomenon were in good spatial agreement with areas characterized by a lower aerosol loading. Nonetheless, eRSTDUST detections could represent the starting point to perform retrieval analyses aiming at characterizing dust outbreaks from a quantitative point of view, whose accuracy and/or time of elaboration processes could benefit from a more efficient identification of regions affected by dust. Some investigations are currently in progress to assess, for instance, if indirect information about dust clouds may be inferred from the numerator of Equation (2) (i.e., the difference of the BTD signal and its temporal mean value approximating a clear sky condition), once dusty pixels are identified.
Finally, geostationary satellite platforms like GOES-R and Meteosat Third Generation (MTG) thanks to an increased spatial, temporal, and spectral resolution, should further increase eRSTDUST performance, allowing us to better detect and track dust outbreaks. In this direction, satellite images acquired during a 30-day period or belonging to contiguous time slots could be processed to run our algorithm, even in the absence of a plurennial time series of satellite records, increasing the statistics; even if the performance of eRSTDUST (e.g., in terms of reliability) needs to be carefully assessed under this condition.

7. Conclusions

Three massive dust events affecting the Mediterranean basin and Europe in May, which, along with July, represents the month most frequently affected by desert dust aerosols coming from the Sahara region [98], have been analysed in this work, using information provided by some independent and well-established aerosol products to assess eRSTDUST detections.
The results encourage further experimentations of the proposed method in different geographic contexts and periods of the year, even for a comparison with other recent dust detection techniques, exploiting information provided by different satellite sensors (i.e., polar/geostationary ones). These investigations will allow us to evaluate, in a more accurate way, the advantages of using eRSTDUST in operational contexts, assessing its potential in supporting early warning and continuous monitoring systems, devoted to mitigating the effects of dust outbreaks on human health and economic activities.

Acknowledgments

Results presented in this study were achieved thanks to the financial support of following projects: NIBS (funded by P.O. FESR Basilicata Region 2007-2013); SMART BASILICATA (funded by the MIUR under the “Smart Cities and Communities and Social Innovation” Call, MIUR Announcement n.84/Ric 2012, PON 2007–2013 of 2nd March 2012); IAMICA (Codice: PONa3_00363; Codice CUP: B61D1100220007—CIG 5868083F44 funded by MIUR); EUNADICS-AV (funded by the European Union’s Horizon 2020 research programme for Societal challenges-smart, green and integrated transport, under grant agreement No. 723986). The Terra and Aqua-MODIS AOD at the 550 nm products belonging to the MOD04_L2 and MYD04_L2 datasets were acquired from the Level-1 & Atmosphere Archive and Distribution System (LAADS) Distributed Active Archive Center (DAAC), located in the Goddard Space Flight Center in Greenbelt, Maryland). Data and/or images from the BSC-DREAM8b (Dust REgional Atmospheric Model) model were operated by the Barcelona Supercomputing Center (http://www.bsc.es/projects/earthscience/BSC-DREAM/). Some analyses and visualizations also used here were produced with the Giovanni online data system (https://giovanni.gsfc.nasa.gov/giovanni/), developed and maintained by the NASA GES DISC. The aauthors thank the Project/PIs for their effort in establishing and maintaining the Lecce University and Athens AERONET sites.

Author Contributions

Francesco Marchese and Nicola Pergola wrote the majority of the paper. Valerio Tramutoli, Nicola Pergola, Carolina Filizzola, and Francesco Marchese designed the eRSTDUST algorithm. Filomena Sannazzaro and Alfredo Falconieri implemented and tested the algorithm.

Conflicts of Interest

The authors declare no conflict of interest.

References

  1. Middleton, N.J.; Goudie, A.S. Saharan dust: Sources and trajectories. Trans. Inst. Br. Geogr. 2001, 26, 165–181. [Google Scholar] [CrossRef]
  2. Jickells, T.D.; An, Z.S.; Andersen, K.K.; Baker, A.R.; Bergametti, G.; Brooks, N.; Cao, J.J.; Boyd, P.W.; Duce, R.A.; Hunter, K.A.; et al. Global Iron Connections between Desert Dust, Ocean Biogeochemistry, and Climate. Science 2005, 308, 67–71. [Google Scholar] [CrossRef] [PubMed]
  3. Caquineau, S.; Gaudichet, A.; Gomes, L.; Legrand, M. Mineralogy of Saharan dust transported over northwestern tropical Atlantic Ocean in relation to source regions. J. Geophys. Res. Atmos. 2002. [Google Scholar] [CrossRef]
  4. Zhu, A.; Ramanathan, V.; Li, F.; Kim, D. Dust plumes over the Pacific, Indian, and Atlantic Oceans: Climatology and radiative impact. J. Geophys. Res. 2007. [Google Scholar] [CrossRef]
  5. Alastuey, A.; Querol, X.; Castillo, S.; Escudero, M.; Avila, A.; Cuevas, E.; Torres, C.; Romero, P.M.; Exposito, F.; Garcia, O.; et al. Characterisation of TSP and PM2.5 at Izana and Sta. Cruz de Tenerife (Canary Islands, Spain) during a Saharan dust episode. Atmos. Environ. 2005, 39, 4715–4728. [Google Scholar] [CrossRef]
  6. Goudie, A.S. Dust storms: Recent developments. J. Environ. Manag. 2009, 90, 89–94. [Google Scholar] [CrossRef] [PubMed]
  7. Kumar, P.; Sokolik, I.N.; Nenes, A. Measurements of cloud condensation nuclei activity and droplet activation kinetics of fresh unprocessed regional dust samples and minerals. Atmos. Chem. Phys. 2011, 11, 3527–3541. [Google Scholar] [CrossRef]
  8. Karydis, V.A.; Kumar, P.; Barahona, D.; Sokolik, I.N.; Nenes, A. On the effect of dust articles on global cloud condensation nuclei and cloud droplet number. J. Geophys. Res. 2011. [Google Scholar] [CrossRef]
  9. Langmann, B. Volcanic Ash versus Mineral Dust: Atmospheric Processing and Environmental and Climate Impacts. ISRN Atmos. Sci. 2013. [Google Scholar] [CrossRef]
  10. Loye-Pilot, M.D.; Martin, J.M.; Morelli, J. Influence of Saharan dust on the rain acidity and atmospheric input to the Mediterranean. Nature 1986, 321, 427–428. [Google Scholar] [CrossRef]
  11. Hu, X.Q.; Lu, M.N.; Niu, T.; Zhang, P. Operational retrieval of Asian sand and dust storm from FY-2C geostationary meteorological satellite and its application to real time forecast in Asia. Atmos. Chem. Phys. 2008, 8, 1649–1659. [Google Scholar] [CrossRef]
  12. Kok, J.F.; Parteli, E.J.; Michaels, T.I.; Karam, D.B. The physics of wind-blown sand and dust. Rep. Prog. Phys. 2012, 5, 106901. [Google Scholar] [CrossRef] [PubMed]
  13. Griffin, D.W.; Kellogg, G.A. Dust storms and their impact on ocean and human health: Dust in earth’s atmosphere. EcoHealth 2004, 1, 284–295. [Google Scholar] [CrossRef]
  14. Delfino, R.; Sioutas, C.; Malik, S. Potential role of ultrafine particle in associations between airborne particle mass and cardiovascular health. Environ. Health Perspect. 2005, 113, 934–946. [Google Scholar] [CrossRef] [PubMed]
  15. Neophytou, A.M.; Yiallouros, P.; Coull, B.A.; Kleanthous, S.; Pavlou, P.; Pashiardis, S.; Dockery, D.W.; Koutrakis, P.; Laden, F. Particulate matter concentrations during desert dust outbreaks and daily mortality in Nicosia, Cyprus. J. Expo. Sci. Environ. Epidemiol. 2013, 23, 275–280. [Google Scholar] [CrossRef] [PubMed]
  16. Criado, C.; Dorta, P. An unusual ‘blood rain’over the Canary Islands (Spain). The storm of January 1999. J. Arid Environ. 2003, 55, 765–783. [Google Scholar] [CrossRef]
  17. Karimi, N.; Moridnejad, A.; Golian, S.; Vali Samani, J.M.; Karimi, D.; Javadi, S. Comparison of dust source identification techniques over land in the Middle East region using MODIS data. Can. J. Remote Sens. 2012, 38, 586–599. [Google Scholar] [CrossRef]
  18. Alam, K.; Trautmann, T.; Blaschke, T.; Subhan, F. Changes in aerosol optical properties due to dust storms in the Middle East and Southwest Asia. Remote Sens. Environ. 2014, 143, 216–227. [Google Scholar] [CrossRef]
  19. Griffin, D.W. Atmospheric movement of microorganisms in clouds of desert dust and implications for human health. Clin. Microbiol. Rev. 2007, 20, 459–477. [Google Scholar] [CrossRef] [PubMed]
  20. Monteil, M.A. Saharan dust clouds and human health in the English-speaking Caribbean: What we know and don’t know. Environ. Geochem. 2008, 30, 339–343. [Google Scholar] [CrossRef] [PubMed]
  21. Tanré, D.; Kaufman, Y.J.; Herman, M.; Mattoo, S. Remote sensing of aerosol properties over oceans using the MODIS/ EOS spectral radiance. J. Geophys. Res. 1997, 102, 16971–16988. [Google Scholar] [CrossRef]
  22. Gu, Y.; Rose, W.I.; Bluth, G.J.S. Retrieval of mass and sizes of particles in sandstorms using two MODIS IR bands: A case study of April 7, 2001 sandstorm in China. Geophys. Res. Lett. 2003, 30, 1805. [Google Scholar] [CrossRef]
  23. Darmenov, A.; Sokolik, I.N. Identifying the regional thermal-IR radiative signature of mineral dust with MODIS. Geophys. Res. Lett. 2005, 32, 1–5. [Google Scholar] [CrossRef]
  24. Pierangelo, C.; Mishchenko, M.; Balkanski, Y.; Chedin, A. Retrieving the effective radius of Saharan dust coarse mode from AIRS. Geophys. Res. Lett. 2005. [Google Scholar] [CrossRef]
  25. Brindley, H.E.; Ignatov, A. Retrieval of mineral aerosol optical depth and size information from Meteosat Second Generation SEVIRI solar reflectance bands. Remote Sens. Environ. 2006, 102, 344–363. [Google Scholar] [CrossRef]
  26. Zhao, T.X.P.; Ackerman, S.; Guo, W. Dust and Smoke Detection for Multi-Channel Imagers. Remote Sens. 2010, 2, 2347–2368. [Google Scholar] [CrossRef]
  27. Di, A.; Xue, Y.; Yang, X.; Leys, J.; Guang, J.; Mei, L.; Wang, J.; She, L.; Hu, Y.; He, X.; et al. Dust Aerosol Optical Depth Retrieval and Dust Storm Detection for Xinjiang Region Using Indian National Satellite Observations. Remote Sens. 2016, 8, 702. [Google Scholar] [CrossRef]
  28. Schepanski, K.; Tegen, I.; Todd, M.C.; Heinold, B.; Bönisch, G.; Laurent, B.; Macke, A. Meteorological processes forcing Saharan dust emission inferred from MSG-SEVIRI observations of subdaily dust source activation and numerical models. J. Geophys. Res. Atmos. 2009. [Google Scholar] [CrossRef]
  29. Banks, J.R.; Brindley, H.E.; Hobby, M.; Marsham, J.H. The daytime cycle in dust aerosol direct radiative effects observed in the central Sahara during the Fennec campaign in June 2011. J. Geophys. Res. Atmos. 2014. [Google Scholar] [CrossRef]
  30. Schepanski, K.; Tegen, I.; Laurent, B.; Heinold, B.; Macke, A. A new Saharan dust source activation frequency map derived from MSG-SEVIRI IR-channels. Geophys. Res. Lett. 2007, 34, 1–5. [Google Scholar] [CrossRef]
  31. Evan, A.T.; Fiedler, S.; Zhao, C.; Menut, L.; Schepanski, K.; Flamant, C.; Doherty, O. Derivation of an observation-based map of North African dust emission. Aeolian Res. 2015, 16, 153–162. [Google Scholar] [CrossRef]
  32. Tramutoli, V.; Filizzola, C.; Marchese, F.; Mazzeo, G.; Paciello, R.; Pergola, N.; Pietrapertosa, C.; Sannazzaro, F. A Robust Satellite Technique (RST) for Dust Storm Detection and Monitoring: The Case of 2009 Australian Event. In Proceedings of the IGARSS 2010, Honolulu, HI, USA, 25–30 July 2010. [Google Scholar]
  33. Sannazzaro, F.; Filizzola, C.; Marchese, F.; Corrado, R.; Mazzeo, G.; Paciello, R.; Pergola, N.; Tramutoli, V. Identification of dust outbreaks on infrared MSG-SEVIRI data by using a Robust Satellite Technique (RST). Acta Astronaut. 2014, 93, 64–70. [Google Scholar] [CrossRef]
  34. Griggs, M. Measurements of atmospheric optical thickness over water using ERTS-1 Data. J. Air Pollut. Control Assoc. 1975, 25, 622–626. [Google Scholar] [CrossRef] [PubMed]
  35. Carlson, T.N.; Wendling, P. Reflected Radiance Measured by NOAA 3 VHRR as a function of optical depth for Saharan Dust. J. Appl. Meteorol. 1977, 16, 1368–1371. [Google Scholar] [CrossRef]
  36. Carlson, T.N. Atmospheric turbidity in Saharan dust outbreaks as determined by analyses of satellite brightness data. Mon. Weather Rev. 1979, 107, 322–335. [Google Scholar] [CrossRef]
  37. Tanré, D.; Legrand, M. On the satellite retrieval of Saharan dust optical thickness over land: Two different approaches. J. Geophys. Res. 1991, 96, 5221–5227. [Google Scholar] [CrossRef]
  38. Shenk, W.E.; Curran, R.J. The detection of dust storms over land and water with satellite visible and infrared measurements. Mon. Weather Rev. 1974, 102, 830–837. [Google Scholar] [CrossRef]
  39. McClain, E.P. Global sea surface temperatures and cloud clearing for aerosol opticaldepth estimates. Int. J. Remote Sens. 1989, 10, 763–769. [Google Scholar] [CrossRef]
  40. Prata, A.J. Infrared radiative transfer calculations for volcanic ash clouds. Geophys. Res. Lett. 1989, 16, 1293–1296. [Google Scholar] [CrossRef]
  41. Ackerman, S.A. Using the radiative temperature difference at 3.7 and 11 μm to track dust outbreaks. Remote Sens. Environ. 1989, 27, 129–133. [Google Scholar] [CrossRef]
  42. Ackerman, S.A. Remote sensing aerosols using satellite infrared observations. J. Geophys. Res. 1997, 102, 17069–17080. [Google Scholar] [CrossRef]
  43. Wald, A.E.; Kaufman, Y.J.; Tanré, D.; Gao, B.C. Daytime and night-time detection of mineral dust over desert using infrared spectral contrast. J. Geophys. Res. 1998, 103, 32307–32313. [Google Scholar] [CrossRef]
  44. Miller, S.D. A consolidated technique for enhancing desert dust storms with MODIS. Geophys. Res. Lett. 2003. [Google Scholar] [CrossRef]
  45. Merchant, C.J.; Embury, O.; Le Borgne, P.; Bellec, B. Saharan dust in night-time thermal imagery: Detection and reduction of related biases in retrieved sea surface temperature. Remote Sens. Environ. 2006, 104, 15–30. [Google Scholar] [CrossRef]
  46. Kong, X.; Noyes, E.; Corlett, G.; Remedios, J.; Llewellyn-Jones, D.; Merchant, C.J.; Embury, O. Saharan Dust Corrections for the ENVISAT AATSR SST Product. In Proceedings of the ENVISAT Symposium, Montreux, Switzerland, 23–27 April 2007. [Google Scholar]
  47. Klüser, L.; Schepanski, K. Remote sensing of mineral dust over land with MSG infrared channels: A new Bitemporal Mineral Dust Index. Remote Sens. Environ. 2009, 113, 1853–1867. [Google Scholar] [CrossRef]
  48. Ashpole, I.; Washington, R. An automated dust detection using SEVIRI: A multiyear climatology of summertime dustiness in the Central and Western Sahara. J. Geophys. Res. 2012, 117, D08202. [Google Scholar] [CrossRef]
  49. Liu, Y.; Liu, R.; Cheng, X. Dust detection over desert surfaces with thermal infrared bands using dynamic reference brightness temperature differences. J. Geophys. Res. Atmos. 2013, 118, 8566–8584. [Google Scholar] [CrossRef]
  50. Park, S.S.; Kim, J.; Lee, J.; Lee, S.; Kim, J.S.; Chang, L.S.; Ou, S. Combined dust detection algorithm by using MODIS infrared channels over East Asia. Remote Sens. Environ. 2014, 141, 24–39. [Google Scholar] [CrossRef]
  51. Murray, J.E.; Brindley, H.E.; Bryant, R.G.; Russell, J.E.; Jenkins, K.F.; Washington, R. Enhancing weak transient signals in SEVIRI false color imagery: Application to dust source detection in southern Africa. J. Geophys. Res. Atmos. 2016. [Google Scholar] [CrossRef]
  52. Yue, H.; He, C.; Zhao, Y.; Ma, Q.; Zhang, Q. The brightness temperature adjusted dust index: An improved approach to detect dust storms using MODIS imagery. Int. J. Appl. Earth Obs. Geoinf. 2017, 57, 166–176. [Google Scholar] [CrossRef]
  53. El-Askary, H.; Gautam, R.; Singh, R.P.; Kafatos, M. Dust storms detection over the Indo-Gangetic basin using multi sensor data. Adv. Space Res. J. 2006, 37, 728–733. [Google Scholar] [CrossRef]
  54. Pierangelo, C.; Chédin, A.; Heilliette, S.; Jacquinet-Husson, N.; Armante, R. Dust altitude and infrared optical depth from AIRS. Atmos. Chem. Phys. Discuss. 2004, 4, 3333–3358. [Google Scholar] [CrossRef]
  55. Chaboureau, J.P.; Tulet, P.; Mari, C. Diurnal cycle of dust and cirrus over West Africa as seen from Meteosat Second Generation satellite and a regional forecast model. Geophys. Res. Lett. 2007, 34, L02822. [Google Scholar] [CrossRef]
  56. Tramutoli, V. Robust Satellite Techniques (RST) for Natural and Environmental Hazards Monitoring and Mitigation: Theory and Applications. In Proceedings of the Multitemp 2007, Leuven, Belgium, 18–20 July 2007; pp. 1–6. [Google Scholar]
  57. Marchese, F.; Ciampa, M.; Filizzola, C.; Lacava, T.; Mazzeo, G.; Pergola, N.; Tramutoli, V. On the exportability of robust satellite techniques (RST) for active volcano monitoring. Remote Sens. 2010, 2, 1575–1588. [Google Scholar] [CrossRef]
  58. Sannazzaro, F.; Pergola, N.; Corrado, R.; Filizzola, C.; Marchese, F.; Mazzeo, G.; Paciello, R.; Tramutoli, V. A New Approach for Detecting and Monitoring Saharan Dusts from Space. Geoinf. Geostat. Overv. 2014. [Google Scholar] [CrossRef]
  59. Qu, J.J.; Hao, X.; Kafatos, M.; Wang, L. Asian dust storm monitoring combining terra and aqua MODIS SRB measurements. IEEE Geosci. Remote Sens. Lett. 2006, 3, 484–486. [Google Scholar] [CrossRef]
  60. Srivastava, A.; Stroeve, J. Onboard detection of snow, ice, clouds and other geophysical processes using kernel methods. In Proceedings of the 2003 ICML Workshop on Machine Learning Technologies for Autonomous Space Applications, Washington, DC, USA, 21–24 August 2003. [Google Scholar]
  61. EUMETSAT. A Planned Change to the MSG Level 1.5 Image Product Radiance Definition; EUMETSAT: Darmstadt, Germany, 2007. [Google Scholar]
  62. EUMETSAT. MSG Level 1.5 Image Data Format Description; EUMETSAT: Darmstadt, Germany, 2007. [Google Scholar]
  63. EUMETSAT. Cloud Detection for MSG-Algorithm Theoretical Basis Document; EUMETSAT: Darmstadt, Germany, 2007. [Google Scholar]
  64. Cuomo, V.; Filizzola, C.; Pergola, N.; Pietrapertosa, C.; Tramutoli, V. A self-sufficient approach for GERB cloudy radiance detection. Atmos. Res. 2004, 72, 1–4. [Google Scholar] [CrossRef]
  65. Lacava, T.; Marchese, F.; Arcomano, G.; Coviello, I.; Falconieri, A.; Faruolo, M.; Pergola, N.; Tramutoli, V. Thermal monitoring of Eyjafjöll volcano eruptions by means of infrared MODIS data. IEEE J. Sel. Top. Appl. Earth Obs. Remote Sens. 2014, 7, 3393–3401. [Google Scholar] [CrossRef]
  66. Remer, L.A.; Kaufman, Y.J.; Tanré, D.; Mattoo, S.; Chu, D.A.; Martins, J.V.; Li, R.R.; Ichoku, C.; Levy, R.C.; Kleidman, R.G.; et al. The MODIS aerosol algorithm, products and validation. J. Atmos. Sci. 2005, 62, 947–973. [Google Scholar] [CrossRef]
  67. Kauffman, Y.J.; Tanré, D.; Remer, L.A.; Vermote, E.; Chu, A.; Holben, B.N. Operational remote sensing of tropospheric aerosol over land from EOS Moderate Resolution Imaging Spectroradiometer. J. Geophys. Res. 1997, 102, 17051–17067. [Google Scholar] [CrossRef]
  68. Levy, R.; Remer, L.; Mattoo, S.; Vermote, E.; Kaufman, Y.J. Second-generation operational algorithm: Retrieval of aerosol properties over land from inversion of Moderate Resolution Imaging Spectroradiometer spectral reflectance. J. Geophys. Res. Atmos. 2007. [Google Scholar] [CrossRef]
  69. Chu, D.A.; Kaufman, Y.J.; Ichoku, C.; Remer, L.A.; Tanre, D.; Holben, B.N. Validation of MODIS aerosol optical depth retrieval over land. Geophys. Res. Lett. 2002. [Google Scholar] [CrossRef]
  70. Levy, R.; Remer, L.; Kleidman, R.; Mattoo, S.; Ichoku, C.; Kahn, R.; Eck, T.F. Global evaluation of the Collection5 MODIS dark-target aerosol products overland. Atmos. Chem. Phys. 2010, 10, 10399–10420. [Google Scholar] [CrossRef]
  71. Hsu, N.C.; Tsay, S.C.; King, M.D.; Herman, J.R. Aerosol properties over bright-reflecting source regions. IEEE Trans. Geosci. Remote Sens. 2004, 42, 557–569. [Google Scholar] [CrossRef]
  72. Shi, Y.; Zhang, J.; Reid, J.S.; Hyer, E.J.; Eck, T.F.; Holben, B.N.; Kahn, R.A. A critical examination of spatial biases between MODIS and MISR aerosol products—Application for Potential AERONET deployment. Atmos. Meas. Tech. 2011, 4, 2823–2836. [Google Scholar] [CrossRef]
  73. Winker, D.M.; Hunt, W.H.; Hostetler, C.A. Status and performance of the CALIOP lidar. Proc. SPIE 2004. [Google Scholar] [CrossRef]
  74. Winker, D.M.; Hunt, W.H.; McGill, M.J. Initial performance assessment of CALIOP. Geophys. Res. Lett. 2007. [Google Scholar] [CrossRef]
  75. Winker, D.M.; Vaughan, M.A.; Omar, A.; Hu, Y.; Powell, K.A.; Liu, Z.; Young, S.A. Overview of the CALIPSO mission and CALIOP data processing algorithms. J. Atmos. Ocean. Technol. 2009, 26, 2310–2323. [Google Scholar] [CrossRef]
  76. Vaughan, M.A.; Young, S.A.; Winker, D.M.; Powell, K.A.; Omar, A.H.; Liu, Z.; Hu, Y.; Hostetler, C.A. Fully automated analysis of space-based lidar data: An overview of the CALIPSO retrieval algorithms and data products. Proc. SPIE 2004. [Google Scholar] [CrossRef]
  77. Mehta Prachi, S.; Kunte Pravin, D. Detection and monitoring of two dust storm events by multispectral MODIS images. J. Environ. Res. Dev. 2014, 8, 974–982. [Google Scholar]
  78. Holben, B.N.; Eck, T.F.; Slutsker, I.; Tanre, D.; Buis, J.P.; Setzer, A.; Vermote, E.; Reagan, J.A.; Kaufman, Y.J.; Nakajima, T.; et al. AERONET-A federated instrument network and data archive for aerosol characterization. Remote Sens. Environ. 1998, 66, 1–16. [Google Scholar] [CrossRef]
  79. Kaskaoutis, D.G.; Kambezidis, H.D.; Hatzianastassiou, N.; Kosmopoulos, P.G.; Badarinath, K.V.S. Aerosol climatology: Dependence of the Angstrom exponent on wavelength over four AERONET sites. Atmos. Chem. Phys. Discuss. 2007, 7, 7347–7397. [Google Scholar] [CrossRef]
  80. Schuster, G.L.; Dubovik, O.; Holben, B.N. Angstrom exponent and bimodal aerosol size distributions. J. Geophys. Res. Atmos. 2006. [Google Scholar] [CrossRef]
  81. Amiridis, V.; Kafatos, M.; Perez, C.; Kazadzis, S.; Gerasopoulos, E.; Mamouri, R.E.; Papayannis, A.; Kokkalis, P.; Giannakaki, E.; Basart, S.; et al. The potential of the synergistic use of passive and active remote sensing measurements for the validation of a regional dust model. Ann. Geophys. 2009, 27, 3155–3164. [Google Scholar] [CrossRef]
  82. Barnaba, F.; Gobbi, G.P. Aerosol seasonal variability over the Mediterranean region and relative impact of maritime, continental and Saharan dust particles over the basin from MODIS data in the year 2001. Atmos. Chem. Phys. 2004, 4, 2367–2391. [Google Scholar] [CrossRef]
  83. Romano, F.; Ricciardelli, E.; Cimini, D.; Di Paola, F.; Viggiano, M. Dust detection and optical depth retrieval using MSG-SEVIRI data. Atmosphere 2013, 4, 35–47. [Google Scholar] [CrossRef]
  84. Aerosol Robotic Network (AERONET)–Lecce University. Available online: https://aeronet.gsfc.nasa.gov/cgi-bin/type_one_station_opera_v2_new?site=Lecce_University&nachal=0&year=16&month=4&day=18&aero_water=2&level=3&if_day=0&if_err=0&place_code=10&year_or_month=0 (accessed on 26 May 2017).
  85. Aerosol Robotic Network (AERONET)–Athens-NOA. Available online: https://aeronet.gsfc.nasa.gov/cgi-bin/type_one_station_opera_v2_new?site=ATHENS-NOA&nachal=0&year=16&month=4&day=18&aero_water=2&level=3&if_day=0&if_err=0&place_code=10&year_or_month=0 (accessed on 26 May 2017).
  86. Klein, H.; Nickovic, S.; Haunold, W.; Bundke, U.; Nillius, B.; Ebert, M.; Weinbruch, S.; Schuetz, L.; Levin, Z.; Barrie, L.A.; et al. Saharan dust and ice nuclei over Central Europe. Atmos. Chem. Phys. Discuss. 2010, 10, 14993–15022. [Google Scholar] [CrossRef]
  87. Pappalardo, G.; Wandinger, U.; Mona, L.; Hiebsch, A.; Mattis, I.; Amodeo, A.; Ansmann, A.; Seifert, P.; Linne, H.; Apituley, A.; et al. EARLINET correlative measurements for CALIPSO: First intercomparison results. J. Geophys. Res. 2010, 115, D00H19. [Google Scholar] [CrossRef]
  88. Bègue, N.; Tulet, P.; Chaboureau, J.-P.; Roberts, G.; Gomes, L.; Mallet, M. Long-range transport of Saharan dust over northwestern Europe during EUCAARI 2008 campaign: Evolution of dust optical properties by scavenging. J. Geophys. Res. 2012, 117, D17201. [Google Scholar] [CrossRef]
  89. Nickovic, S.; Kallos, G.; Papadopoulos, A.; Kakaliagou, O. A model for prediction of desert dust cycle in the atmosphere. J. Geophys. Res. 2001, 106, 18113–18129. [Google Scholar] [CrossRef]
  90. Pérez, C.; Nickovic, S.; Baldasano, J.M.; Sicard, M.; Rocadenbosch, F.; Cachorro, V.E. A long Saharan dust event over the western Mediterranean: Lidar, Sun photometer observations, and regional dust modeling. J. Geophys. Res. Atmos. 2006. [Google Scholar] [CrossRef]
  91. Papanastasiou, D.K.; Poupkou, A.; Katragkou, E.; Amiridis, V.; Melas, D.; Mihalopoulos, N.; Basart, S.; Pérez, C.; Baldasano, J.M. An Assessment of the Efficiency of Dust Regional Modelling to Predict Saharan Dust Transport Episodes. Adv. Meteorol. 2010. [Google Scholar] [CrossRef]
  92. National Aeronautics and Space Administration (NASA). Earth Observatory. Available online: http://earthobservatory.nasa.gov/NaturalHazards/view.php?id=43954 (accessed on 6 April 2017).
  93. Papayannis, A.; Mamouri, R.E.; Amiridis, V.; Giannakaki, E.; Veselovskii, I.; Kokkalis, P.; Tsaknakis, G.; Balis, D.; Kristiansen, N.I.; Stohl, A.; et al. Optical properties and vertical extension of aged ash layers over the Eastern Mediterranean as observed by Raman lidars during the Eyjafjallajökull eruption in May 2010. Atmos. Environ. 2012, 48, 56–65. [Google Scholar] [CrossRef]
  94. Mona, L.; Amodeo, A.; D’Amico, G.; Giunta, A.; Madonna, F.; Pappalardo, G. Multi-wavelength Raman lidar observations of the Eyjafjallajökull volcanic cloud over Potenza, southern Italy. Atmos. Chem. Phys. 2012, 12, 2229–2244. [Google Scholar] [CrossRef]
  95. Sohn, B.J.; Chun, H.W.; Song, H.J.; Noh, Y.C.; Lee, S.M.; Lee, S.S.; Chun, Y. Physical explanation of the weakened brightness temperature difference signal over the yellow sea during a dust event: Case study for March 15–16, 2009. Asia-Pac. J. Atmos. Sci. 2013, 49, 41–48. [Google Scholar] [CrossRef]
  96. Pfeifroth, U.; Hollmann, R.; Ahrens, B. Cloud cover diurnal cycles in satellite data and regional climate model simulations. Meteorol. Z. 2012, 21, 551–560. [Google Scholar] [CrossRef]
  97. Yamaguchi, N.; Ichijo, T.; Sakotani, A.; Baba, T.; Nasu, M. Global dispersion of bacterial cells on Asian dust. Sci. Rep. 2012. [Google Scholar] [CrossRef] [PubMed]
  98. Meloni, D.; Di Sarra, A.; Biavati, G.; DeLuisi, J.J.; Monteleone, F.; Pace, G.; Piacentino, S.; Sferlazzo, D.M. Seasonal behavior of Saharan dust events at the Mediterranean island of Lampedusa in the period 1999–2005. Atmos. Environ. 2007, 41, 3041–3056. [Google Scholar] [CrossRef]
Figure 1. Spectral reference fields of temporal mean (left panels) and standard deviation (right panels) generated processing MSG-SEVIRI data at 06:00 UTC (725 × 533 pixels in size) acquired in May; (a) VIS channel (i.e., radiance measured at 0.6 μm wavelength); (b) TIR channel (BT at 11 μm wavelength); (c) BTD (BT11-BT12).
Remotesensing 09 00537 g001
Figure 2. SEVIRI data of 19 May 2008 at 09:15 UTC (in satellite projection) with the visible channel reported in background; (a) standard RSTDUST algorithm, with ⊗ΔTIR(x,y,t) < −2 (orange pixels) and ⊗ΔTIR(x,y,t) < −3 (brown pixels); (b) eRSTDUST with ⊗VIS(x,y,t) > 0 (L), 1 (S) ANDTIR(x,y,t) > −2 ANDΔTIR(x,y,t) < −1 (orange pixels) and ⊗VIS(x,y,t) > 0 (L), 1 (S) ANDTIR(x,y,t) > −2 ANDΔTIR(x,y,t) < 0 (brown pixels). The white circle and black ellipse indicate two different regions (i.e., Southern Italy and Libya) where, according to eRSTDUST, the dust phenomenon was particularly intense.
Remotesensing 09 00537 g002
Figure 3. (a) Terra-MODIS AOD at the 550 nm product (Level-2) of 19 May 2008 at 09:15 UTC; (b) Deep Blue MODIS AOD at the 550 nm product of the same day. The white ellipse in the left panel and black ellipse in the right panel indicate two different regions characterized by medium-high values of AOD, which were considered as affected by dust in Figure 2b.
Remotesensing 09 00537 g003
Figure 4. (a) eRSTDUST map of 19 May 2008 at 12:30 UTC with the indication of regions characterized by a high (brown pixels) and medium-low (orange pixels) probability of dust presence in the atmosphere; (b) Aqua-MODIS AOD at the 550 nm product (Level-2) of the same day and hour. The white ellipse indicates a dusty region detected by eRSTDUST that was not quantified in terms of AOD. Green crosses indicate location of Lecce-University (Southern Italy) and Athens (Greece) AERONET stations (see text).
Remotesensing 09 00537 g004
Figure 5. eRSTDUST maps of 18–23 May 2008 generated the processed SEVIRI data of 00:00 UTC, 06:00 UTC, and 12:00 UTC. On daytime scenes, orange and brown pixels have the same meaning of Figure 2b. On night-time scenes, pixels with ⊗TIR(x,y,t) > −2 ANDΔTIR(x,y,t) < −2 are depicted in brown, while pixels with ⊗TIR(x,y,t) > −2 ANDΔTIR(x,y,t) < −1 are depicted in orange. In black, cloudy areas flagged by the EUMETSAT cloud mask product.
Remotesensing 09 00537 g005
Figure 6. (a) Dusty pixels identified by eRSTDUST on SEVIRI data of 29 May at 00:00 UTC; (b) Total (parallel + perpendicular) attenuated backscattered profile along the orbit track of CALIPSO (purple line in (a) acquired on 29 May 2008 between 00:24:12 and 00:37:41 UTC; (c) CALIOP aerosol sub-type profile of same day and hour.
Remotesensing 09 00537 g006
Figure 7. Time sequence, at a six hour interval, of eRSTDUST maps generated between 27 May 2008 at 00:00 UTC and 31 May 2008 at 12:00 UTC, displaying regions characterized by a higher (brown pixels) and lower (orange pixels) probability of dust presence in the atmosphere. Note that the dust map of 28 May was not generated because of missing data.
Remotesensing 09 00537 g007
Figure 8. Example of the BSC-DREAM8b forecast products generated for the period 27–31 May 2008.
Remotesensing 09 00537 g008
Figure 9. (a) Orbit track of CALIPSO (in blue) intersecting a number of dusty pixels (in brown) detected by eRSTDUST (i.e., ⊗VIS(x,y,t) > 0 (L), 1 (S) ANDTIR(x,y,t) > −2 ANDΔTIR(x,y,t) < −1) on 11 May 2010 at 12:30 UTC; (b) Total Attenuated Backscatter profile acquired the same day between 12:20 and 12:34 UTC; (c) CALIOP aerosol sub-type profile.
Remotesensing 09 00537 g009
Figure 10. eRSTDUST maps (at two hours) generated by the processing of the daytime SEVIRI data of 11 May 2010 at 06:00 UTC–13 May at 14:00 UTC (visible channel is displayed in background) showing, in orange, the detected dusty pixels (with ⊗VIS(x,y,t) > 0 (L), 1 (S) ANDTIR(x,y,t) > −2 ANDΔTIR(x,y,t) < −1).
Remotesensing 09 00537 g010
Figure 11. Temporal trend of the total area affected by dust determined by counting the number of dusty pixels in Figure 10 and assuming a mean SEVIRI pixel area of 15 km2. Note the general decreasing trend characterizing the analysed parameter after 11 May, along with the relative minimum systematically recorded at 12:00 UTC, indicating a slight reduction in the algorithm performance at that hour of the day.
Remotesensing 09 00537 g011
Figure 12. (a) Daytime eRSTDUST product of 12 May 2010 at 12:00 UTC displaying dusty pixels characterized by different values of ⊗ΔTIR(x,y,t) index; i.e., ⊗ΔTIR(x,y,t) < 0 (orange pixels); < −1 (brown pixels); < −2 (red pixels); (b) BSC-DREAM forecast products for 12 May 2010 at 12:00 UTC. See the good spatial agreement characterizing the detected and predicted dust plume, apart for regions strongly affected by meteorological clouds (see region marked by white ellipse).
Remotesensing 09 00537 g012
Figure 13. (a) BTD SEVIRI image of 12 May 2010 at 12:00 UTC and the A-B-C-D transect (in yellow) intersecting dust plume of Figure 12; (b) spatial profile of BTD signal (in black) and of ⊗ΔTIR(x,y,t) index (in red); (c) spatial profile of ⊗VIS(x,y,t) (in red) and ⊗TIR(x,y,t) (in black) indices, with indication of land locations (green arrows) where eRSTDUST did not detect airborne dust.
Remotesensing 09 00537 g013
Figure 14. HRV SEVIRI image of 12 May 2010 at 12:00 UTC showing that less reflective clouds and cloud shadows affected the region indicated by the yellow ellipse (within the red box) intersected by the A-B transect of Figure 13a.
Remotesensing 09 00537 g014

