Article

A Remote Sensing Approach for Regional-Scale Mapping of Agricultural Land-Use Systems Based on NDVI Time Series

by
Beatriz Bellón
1,*,
Agnès Bégué
1,
Danny Lo Seen
1,
Claudio Aparecido De Almeida
2 and
Margareth Simões
3,4
1
Cirad, UMR TETIS (Land, Environment, Remote Sensing and Spatial Information), Maison de la Télédétection, Rue Jean-François Breton, 34090 Montpellier, France
2
National Institute for Space Research (INPE), Av. dos Astronautas, 1758, São José dos Campos, SP 12227-010, Brazil
3
Embrapa Solos, Rua Jardim Botânico, 1024, Rio de Janeiro, RJ 22460-000, Brazil
4
Department of Computer Engineering, Rio de Janeiro State University (UERJ/FEN/DESC/PPGMA), Rua São Francisco Xavier, 524, 5031 D, Maracanã, Rio de Janeiro, RJ 20550-900, Brazil
*
Author to whom correspondence should be addressed.
Remote Sens. 2017, 9(6), 600; https://doi.org/10.3390/rs9060600
Submission received: 2 May 2017 / Revised: 2 June 2017 / Accepted: 10 June 2017 / Published: 13 June 2017

Abstract

:
In response to the need for generic remote sensing tools to support large-scale agricultural monitoring, we present a new approach for regional-scale mapping of agricultural land-use systems (ALUS) based on object-based Normalized Difference Vegetation Index (NDVI) time series analysis. The approach consists of two main steps. First, to obtain relatively homogeneous land units in terms of phenological patterns, a principal component analysis (PCA) is applied to an annual MODIS NDVI time series, and an automatic segmentation is performed on the resulting high-order principal component images. Second, the resulting land units are classified into the crop agriculture domain or the livestock domain based on their land-cover characteristics. The crop agriculture domain land units are further classified into different cropping systems based on the correspondence of their NDVI temporal profiles with the phenological patterns associated with the cropping systems of the study area. A map of the main ALUS of the Brazilian state of Tocantins was produced for the 2013–2014 growing season with the new approach, and a significant coherence was observed between the spatial distribution of the cropping systems in the final ALUS map and in a reference map extracted from the official agricultural statistics of the Brazilian Institute of Geography and Statistics (IBGE). This study shows the potential of remote sensing techniques to provide valuable baseline spatial information for supporting agricultural monitoring and for large-scale land-use systems analysis.

Graphical Abstract

1. Introduction

Ensuring food security through sustainable agricultural development sets a double challenge to agricultural systems: Food production must substantially increase to satisfy the demand of a continuously growing population while improving the stewardship of natural resources and minimizing environmental impacts [1]. This transition towards sustainability is further challenged by the consequences of climate change and an increased competition for land, generating an urgent need for repetitive spatial information to help monitor the dynamics of the agricultural land-use systems at the regional and global scales.
Land use is defined as “the sequence of operations carried out with the purpose to obtain goods and services from the land” [2]. Land-use systems (LUS) can thus be considered as coupled human–environment systems that can be characterized by two main aspects: land resources and management practices [3]. LUS mapping originally consisted in the delineation of relatively homogeneous areas of land (referred to as land units), which are directly linked to a specific type of land use [4,5]. Regional-scale agricultural land-use systems (ALUS) maps typically represent the major agricultural zones for a given region, each agricultural zone (land unit) being directly linked to a particular agricultural system. The land units of a regional-scale ALUS map are naturally composed of multiple agricultural fields which are spatially “concentrated” and representative of a particular agricultural system, but also contain a mosaic of other land-cover types, e.g., patches of natural vegetation among the agricultural fields, due to their extent. The plotting of the land units’ boundaries is, however, challenged by limited access to spatially explicit and detailed land-use information over large areas, which may account for the general lack of LUS maps.
The few existing large-area LUS mapping approaches, such as the one developed by FAO [2], are usually based on a subjective choice of socio-economic and environmental variables. These are derived from heterogeneous sources which are empirically categorized and combined to map the different land-use systems. The resulting LUS maps are subject to error propagation due to the disparity of spatial resolution, production date, and quality of the original data. In addition, access to the data is not always guaranteed, which limits the reproducibility of the LUS maps in time and across regions. As a result, the description and location of the different agricultural land-use systems remain highly unclear for most world regions.
Earth observation satellite systems can significantly contribute to LUS mapping since they provide timely and detailed land-use information over large areas due to their synoptic coverage and high revisiting frequency. In particular, remote sensing-derived time series of vegetation indices allow monitoring of the phenology (seasonal vegetation variation) and the intra-seasonal variations of the agricultural land cover (i.e., cropland, pastures, and rangelands), from which the agricultural land use (including some management practices) can be determined [6,7,8,9]. Furthermore, the geographic object-based image analysis (GEOBIA) [10] segmentation techniques, which automatically delineate homogeneous objects at multiple scales, seem particularly adapted for the extraction of land units. Bisquert et al. [11] introduced an innovative approach based on GEOBIA of spectral and textural variables derived from coarse-resolution vegetation index images that produced a spatial segmentation of the French territory in broad-scale land units. The resulting land units proved to be consistent in terms of land cover [12], but remained unclassified, and the variables used are not descriptive enough for effective delineation of agricultural land-use systems since they do not account for the intra-seasonal variations that characterize agricultural land-use practices.
The aim of this work is to provide a simple and reproducible approach for regional-scale mapping of ALUS based on GEOBIA and vegetation index time series analysis. The presented approach involves the extraction of temporal variations of the vegetation cover in relation to agricultural land use from a vegetation index time series, by performing a principal components analysis and selecting the principal component images that capture the seasonal and intra-seasonal variability of the vegetation index time series. Segmentation and classification of the selected principal components images follow, finally producing an ALUS map. The approach was applied to an annual Moderate Resolution Imaging Spectroradiometer Normalized Difference Vegetation Index (MODIS NDVI) dataset and tested on a new agricultural expansion region of Brazil. The spatial distribution of the cropping systems in the final ALUS map was evaluated with the annual crop estimates of the Municipal Agricultural Production database (PAM) of the Brazilian Institute of Geography and Statistics (IBGE).

2. Materials

2.1. Study Area

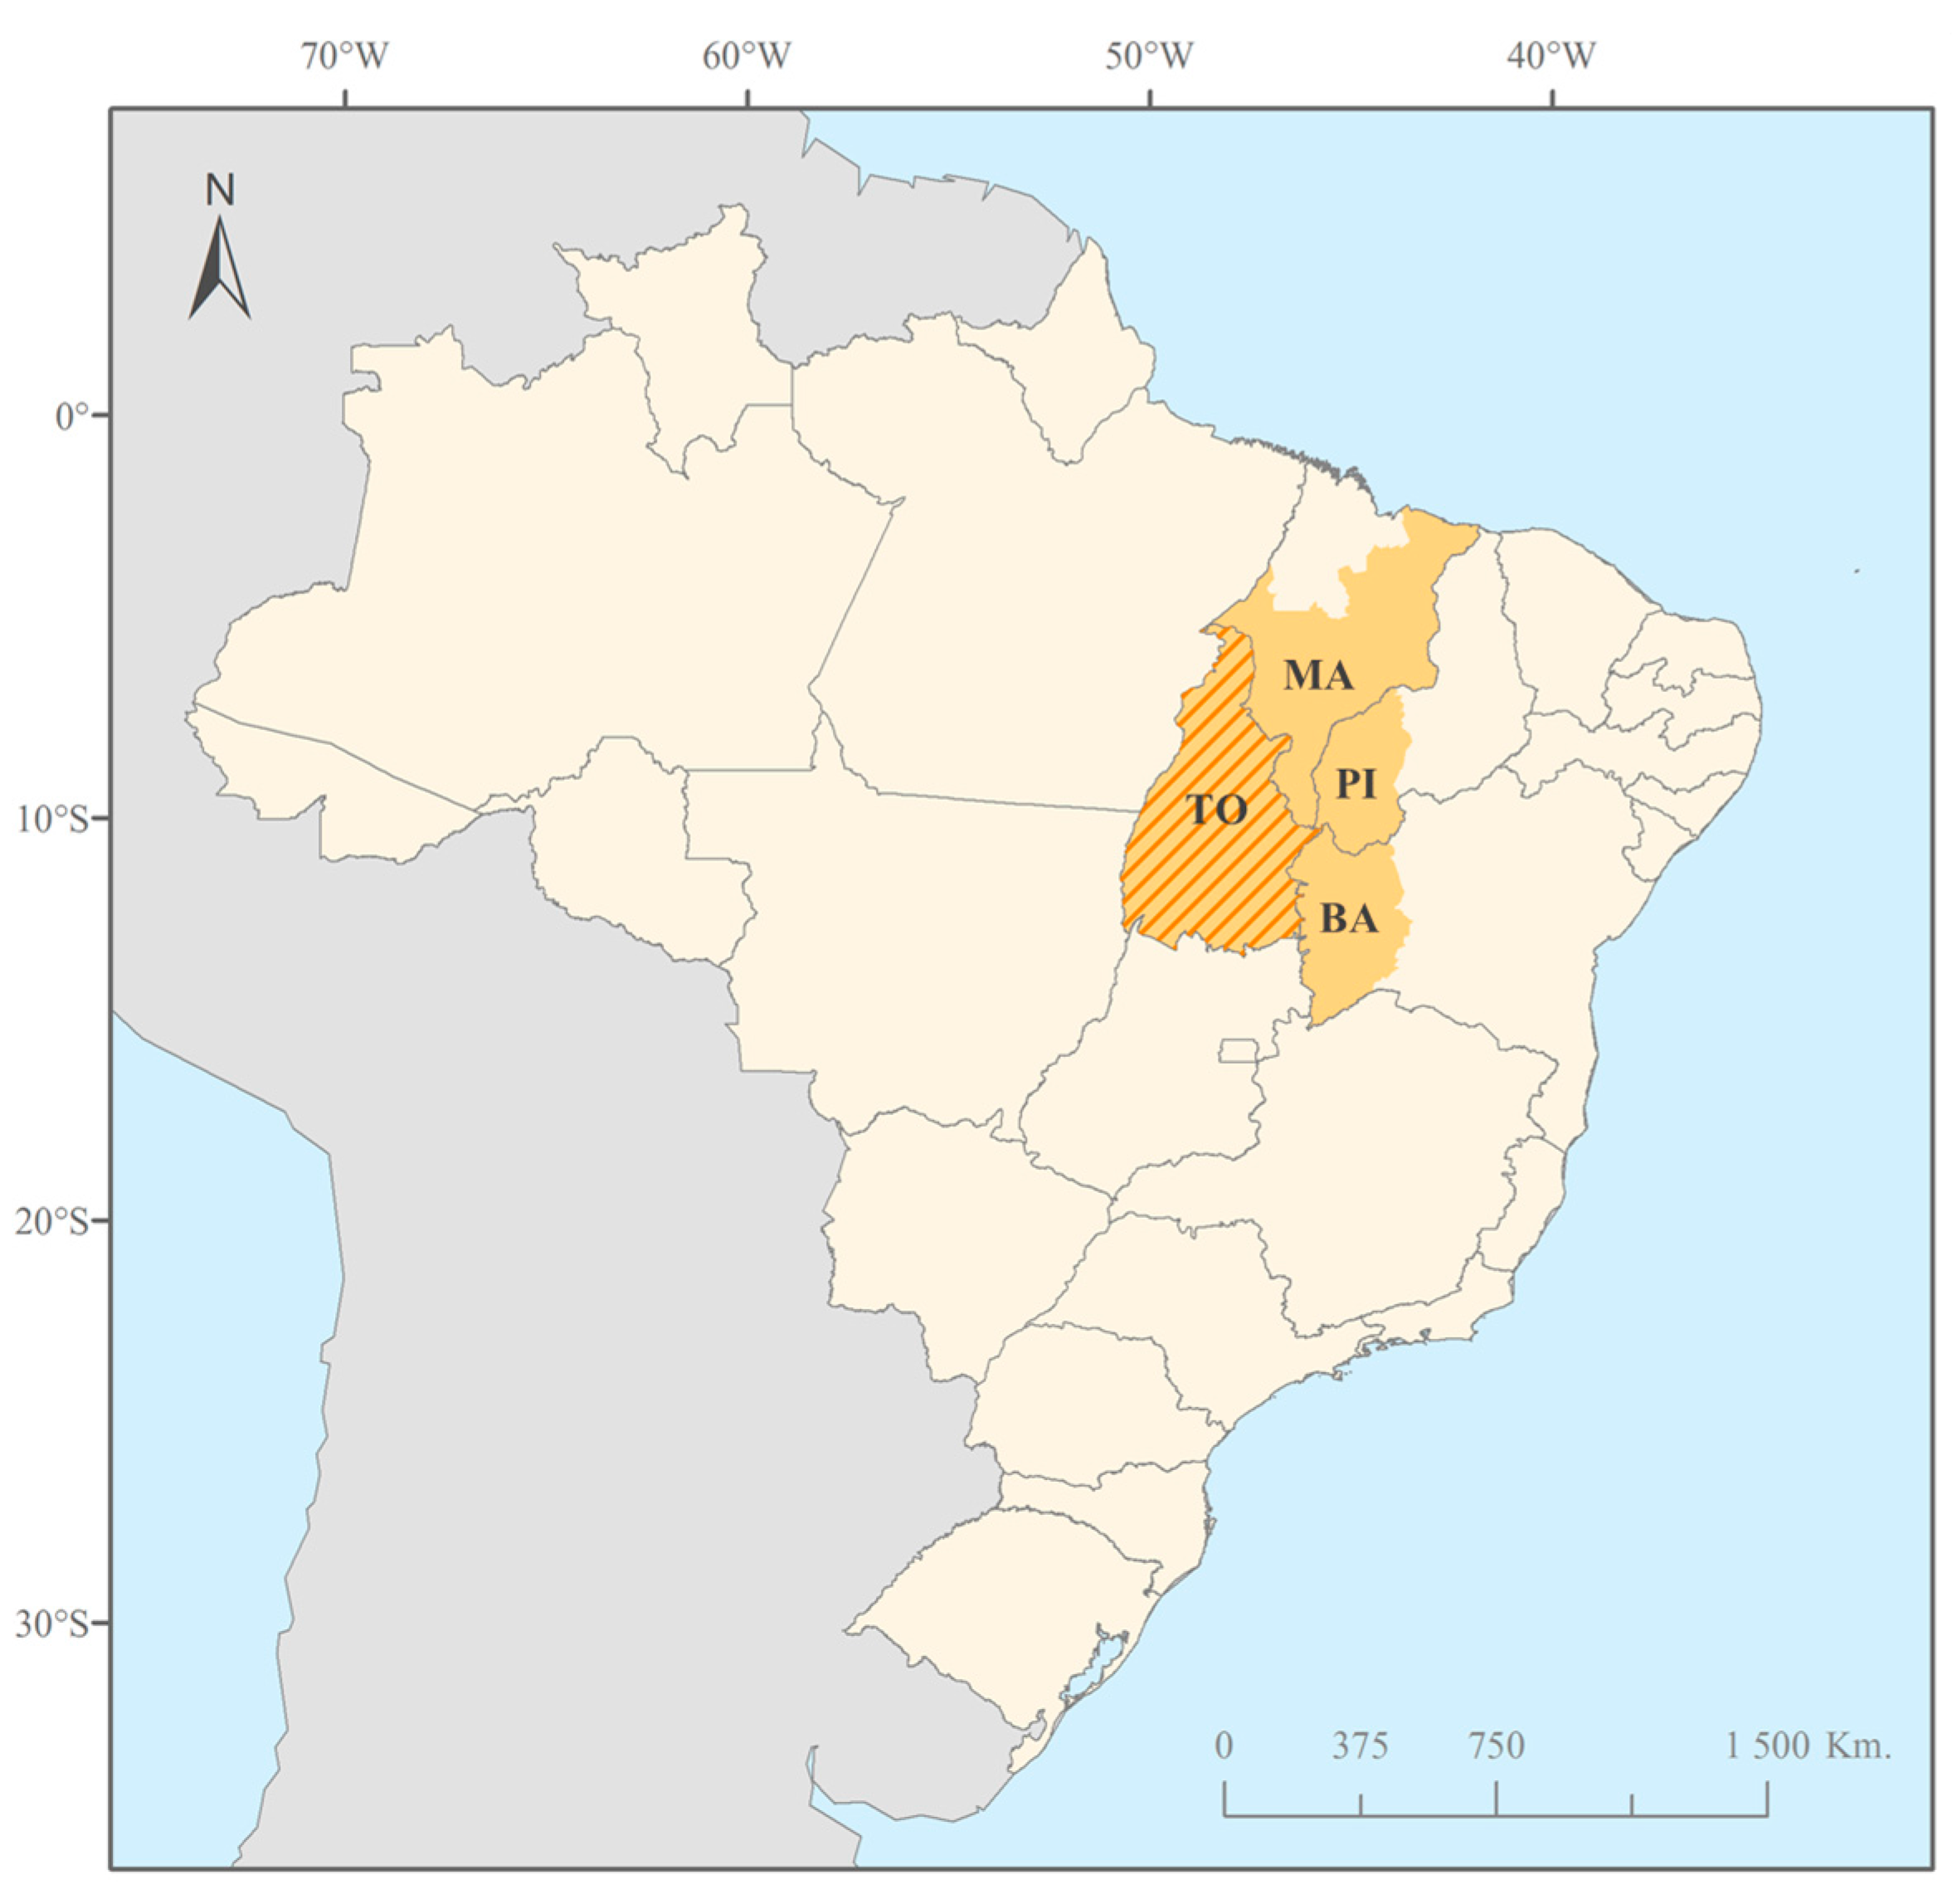
The study area corresponds to the Brazilian State Tocantins, a region that spans 50°W to 45°W and 5°S to 13°S, covering 277,621 km2 between the Amazon and the Cerrado biomes (Figure 1). The geographical location between two biomes provides this region with a rich diversity of environmental conditions, which have led to a diversification of human activities and thus a variety of agricultural landscapes [13].
While livestock production on extensive rangelands still dominates most of the land outside of the protected area’s limits, this region has experienced rapid agricultural expansion within the last decade. This trend is mainly characterized by an expansion of the soybean-cultivated area, which is mostly produced for export (with an increase of 804,800 hectares in the last 15 years [14]). Sequential cropping systems (mainly soybean-based double-cropping systems, where soybean is preceded or succeeded by a cereal) are widespread, since the cultural season benefits from a 7-month rainy season (from October to April) and agriculture is mostly mechanized, with field sizes around 100 hectares.

2.2. TerraClass Land-Cover Map

Among the efforts to produce datasets which will effectively help monitor the recent land-use transitions in Brazil, the National Institute for Space Research (INPE) (in partnership with Brazilian Agricultural Research Corporation (EMBRAPA)) has contributed to the TerraClass project [15]. TerraClass products include land-cover maps of the Amazon biome for every two years since 2004, together with a first version of the Cerrado biome that was recently released for the year 2013 [16,17].
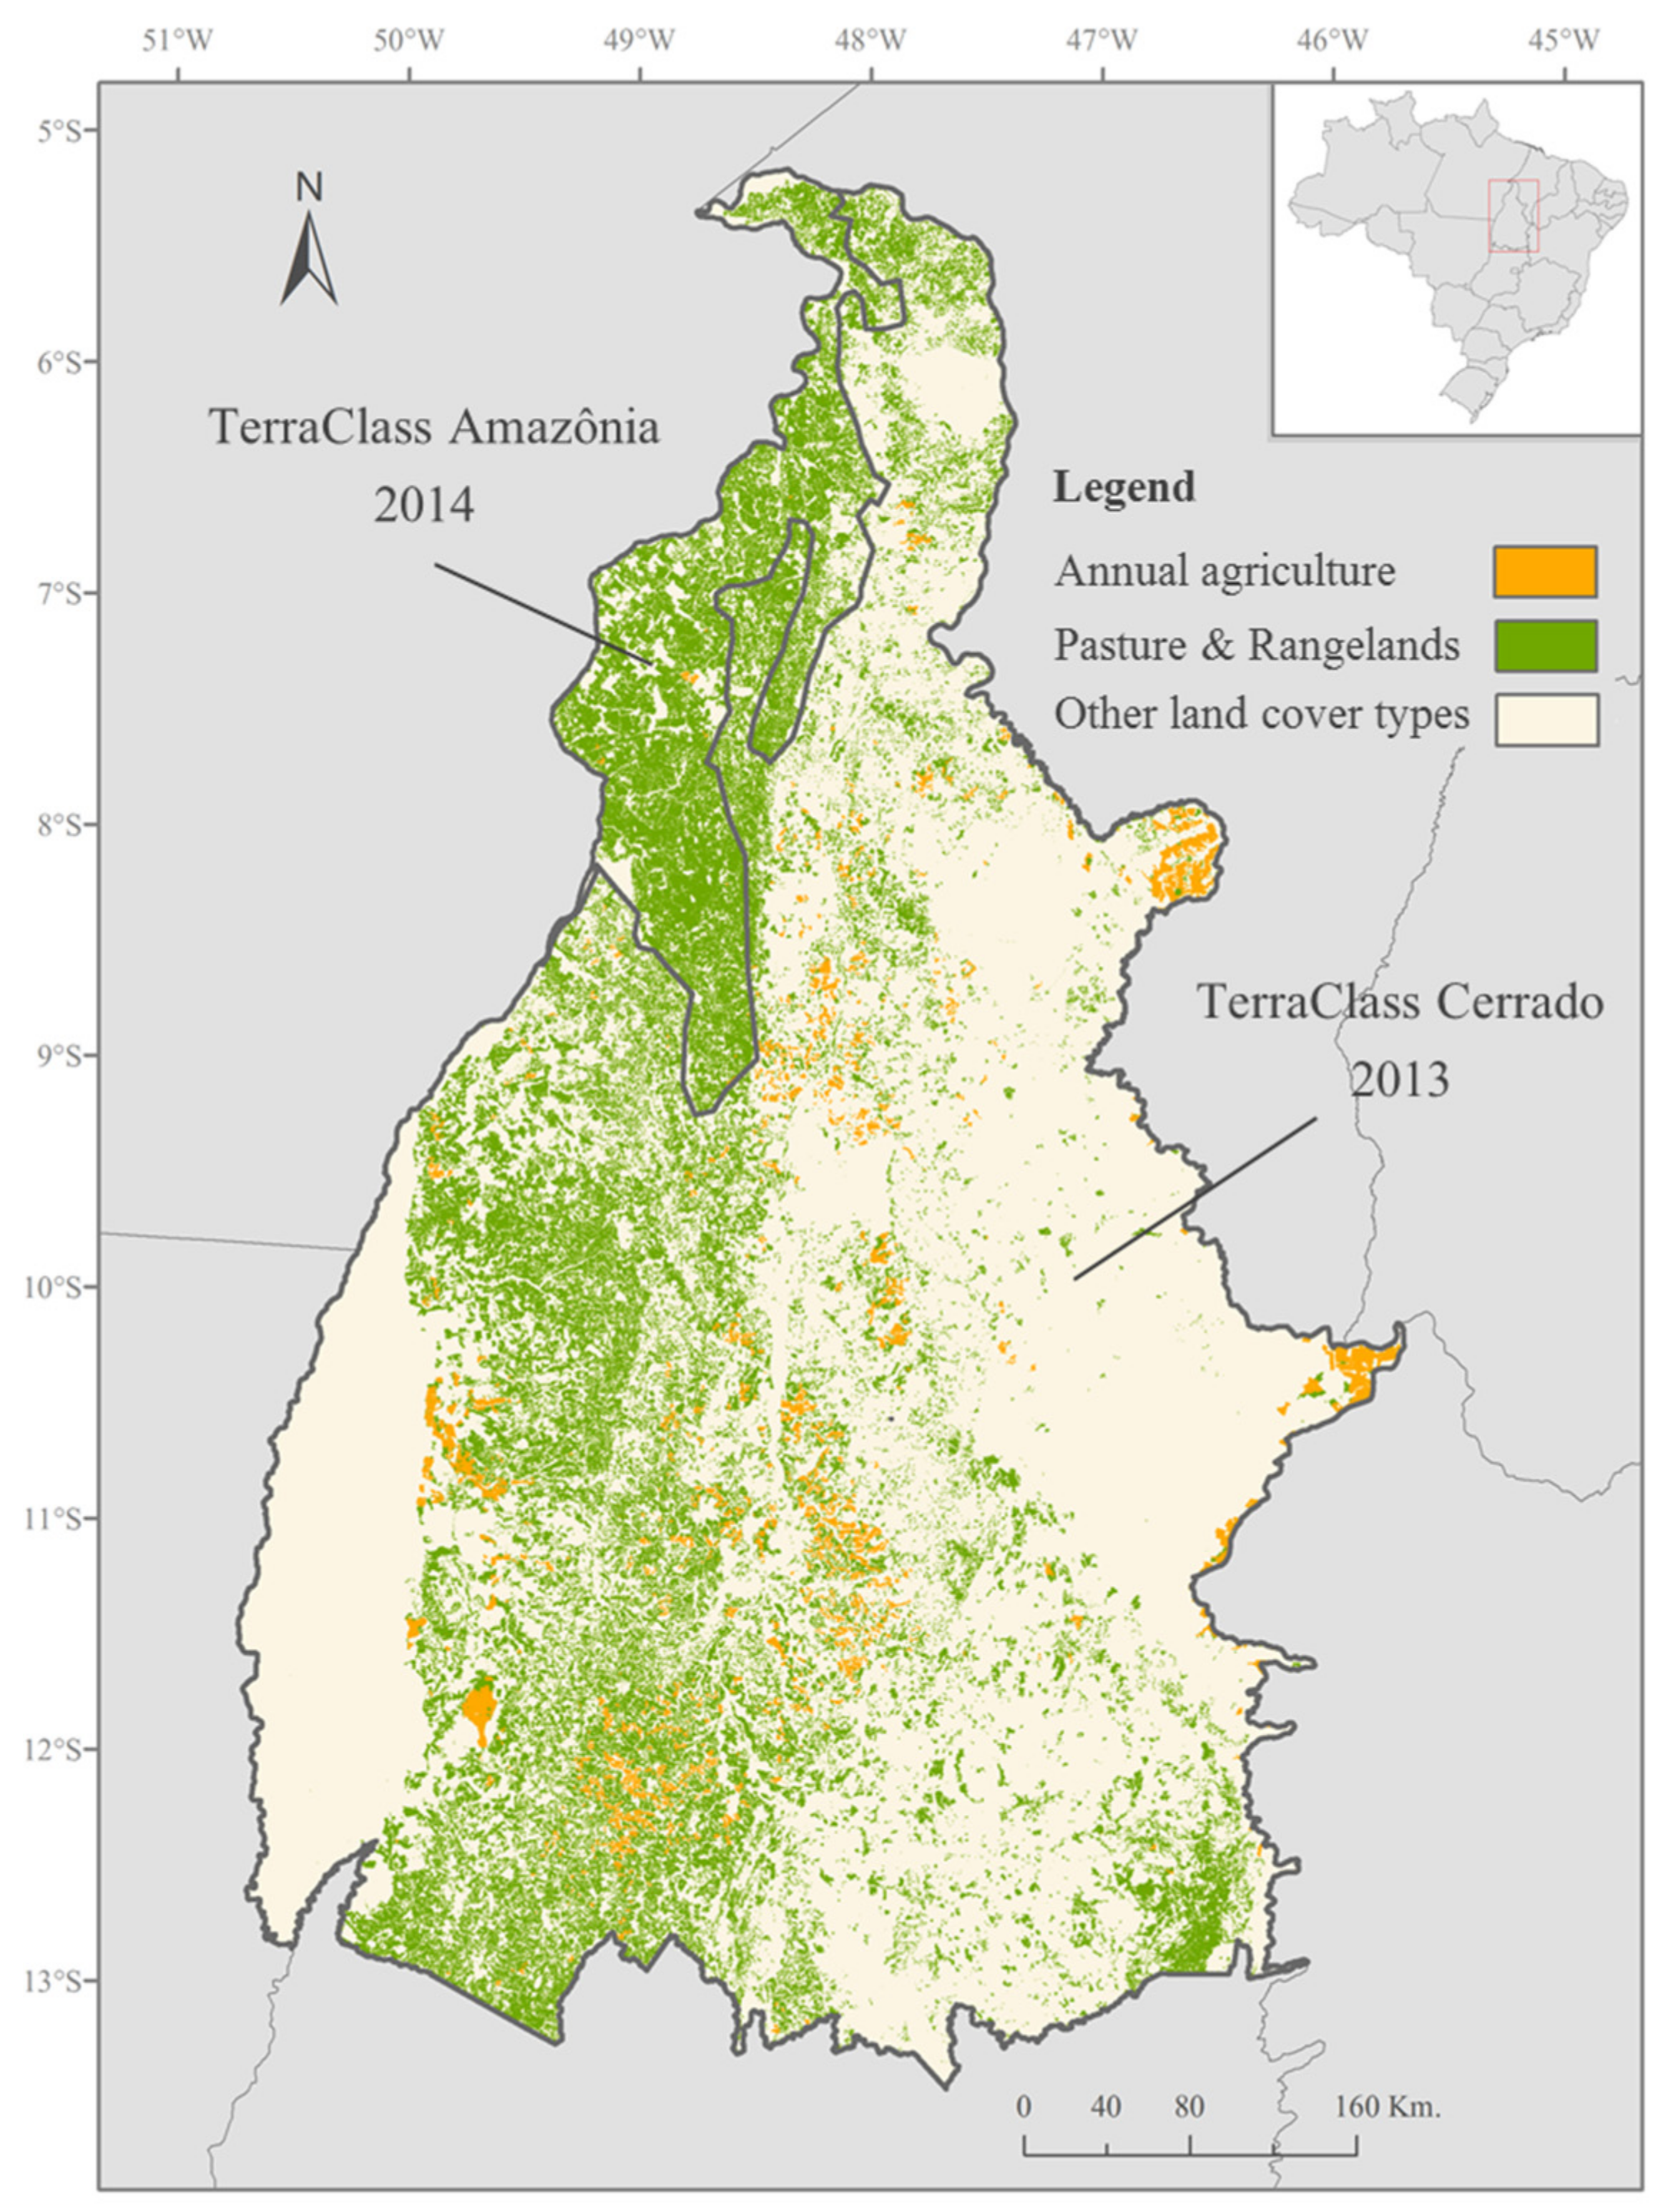
For this study, we combined the results of the latest TerraClass products (TerraClass Amazônia 2014 and TerraClass Cerrado 2013) to generate a land-cover map at 30 m spatial resolution covering the full extent of the Tocantins state. The combined product is used to extract an agricultural land-cover map, composed of the land-cover classes’ pasture and rangelands, and annual agriculture (Figure 2).

2.3. Agricultural Statistics

The official agricultural statistics at the Brazilian municipality administrative level were acquired from the Municipal Agricultural Production database (PAM) of the Brazilian Institute of Geography and Statistics (IBGE) [18]. This database provides annual estimates of planted and harvested area, average yield, average income, and production of the different crops since 1973.
For our study, we collected the harvested area estimates of the 2014 annual crops of the municipalities of Tocantins. The collected data were processed and used as the reference for the spatial distribution of the main cropping systems of Tocantins, against which our results were evaluated.

2.4. MODIS NDVI Time Series

Although the NDVI is known to be affected by background, aerosol effects, and saturation in high biomass regions [19], it is highly sensitive to small increases in the amount of photosynthetic vegetation [20] and is therefore well adapted to capture the vegetation dynamics of the agricultural land-use systems.
A time series of 23 16-day composited NDVI images from October (start of the growing season) 2013 to October 2014 (of the MOD13Q1 v5 product at a 250 m spatial resolution) is used in this study. The dataset was retrieved from the NASA Land Processes Distributed Active Archive Center (LP DAAC) through the processing R package MODIStsp Version 1.3.2 [21]. Two MOD13Q1 tiles (h13v09 and h13v10) are needed for covering the entire state of Tocantins.

3. Methods

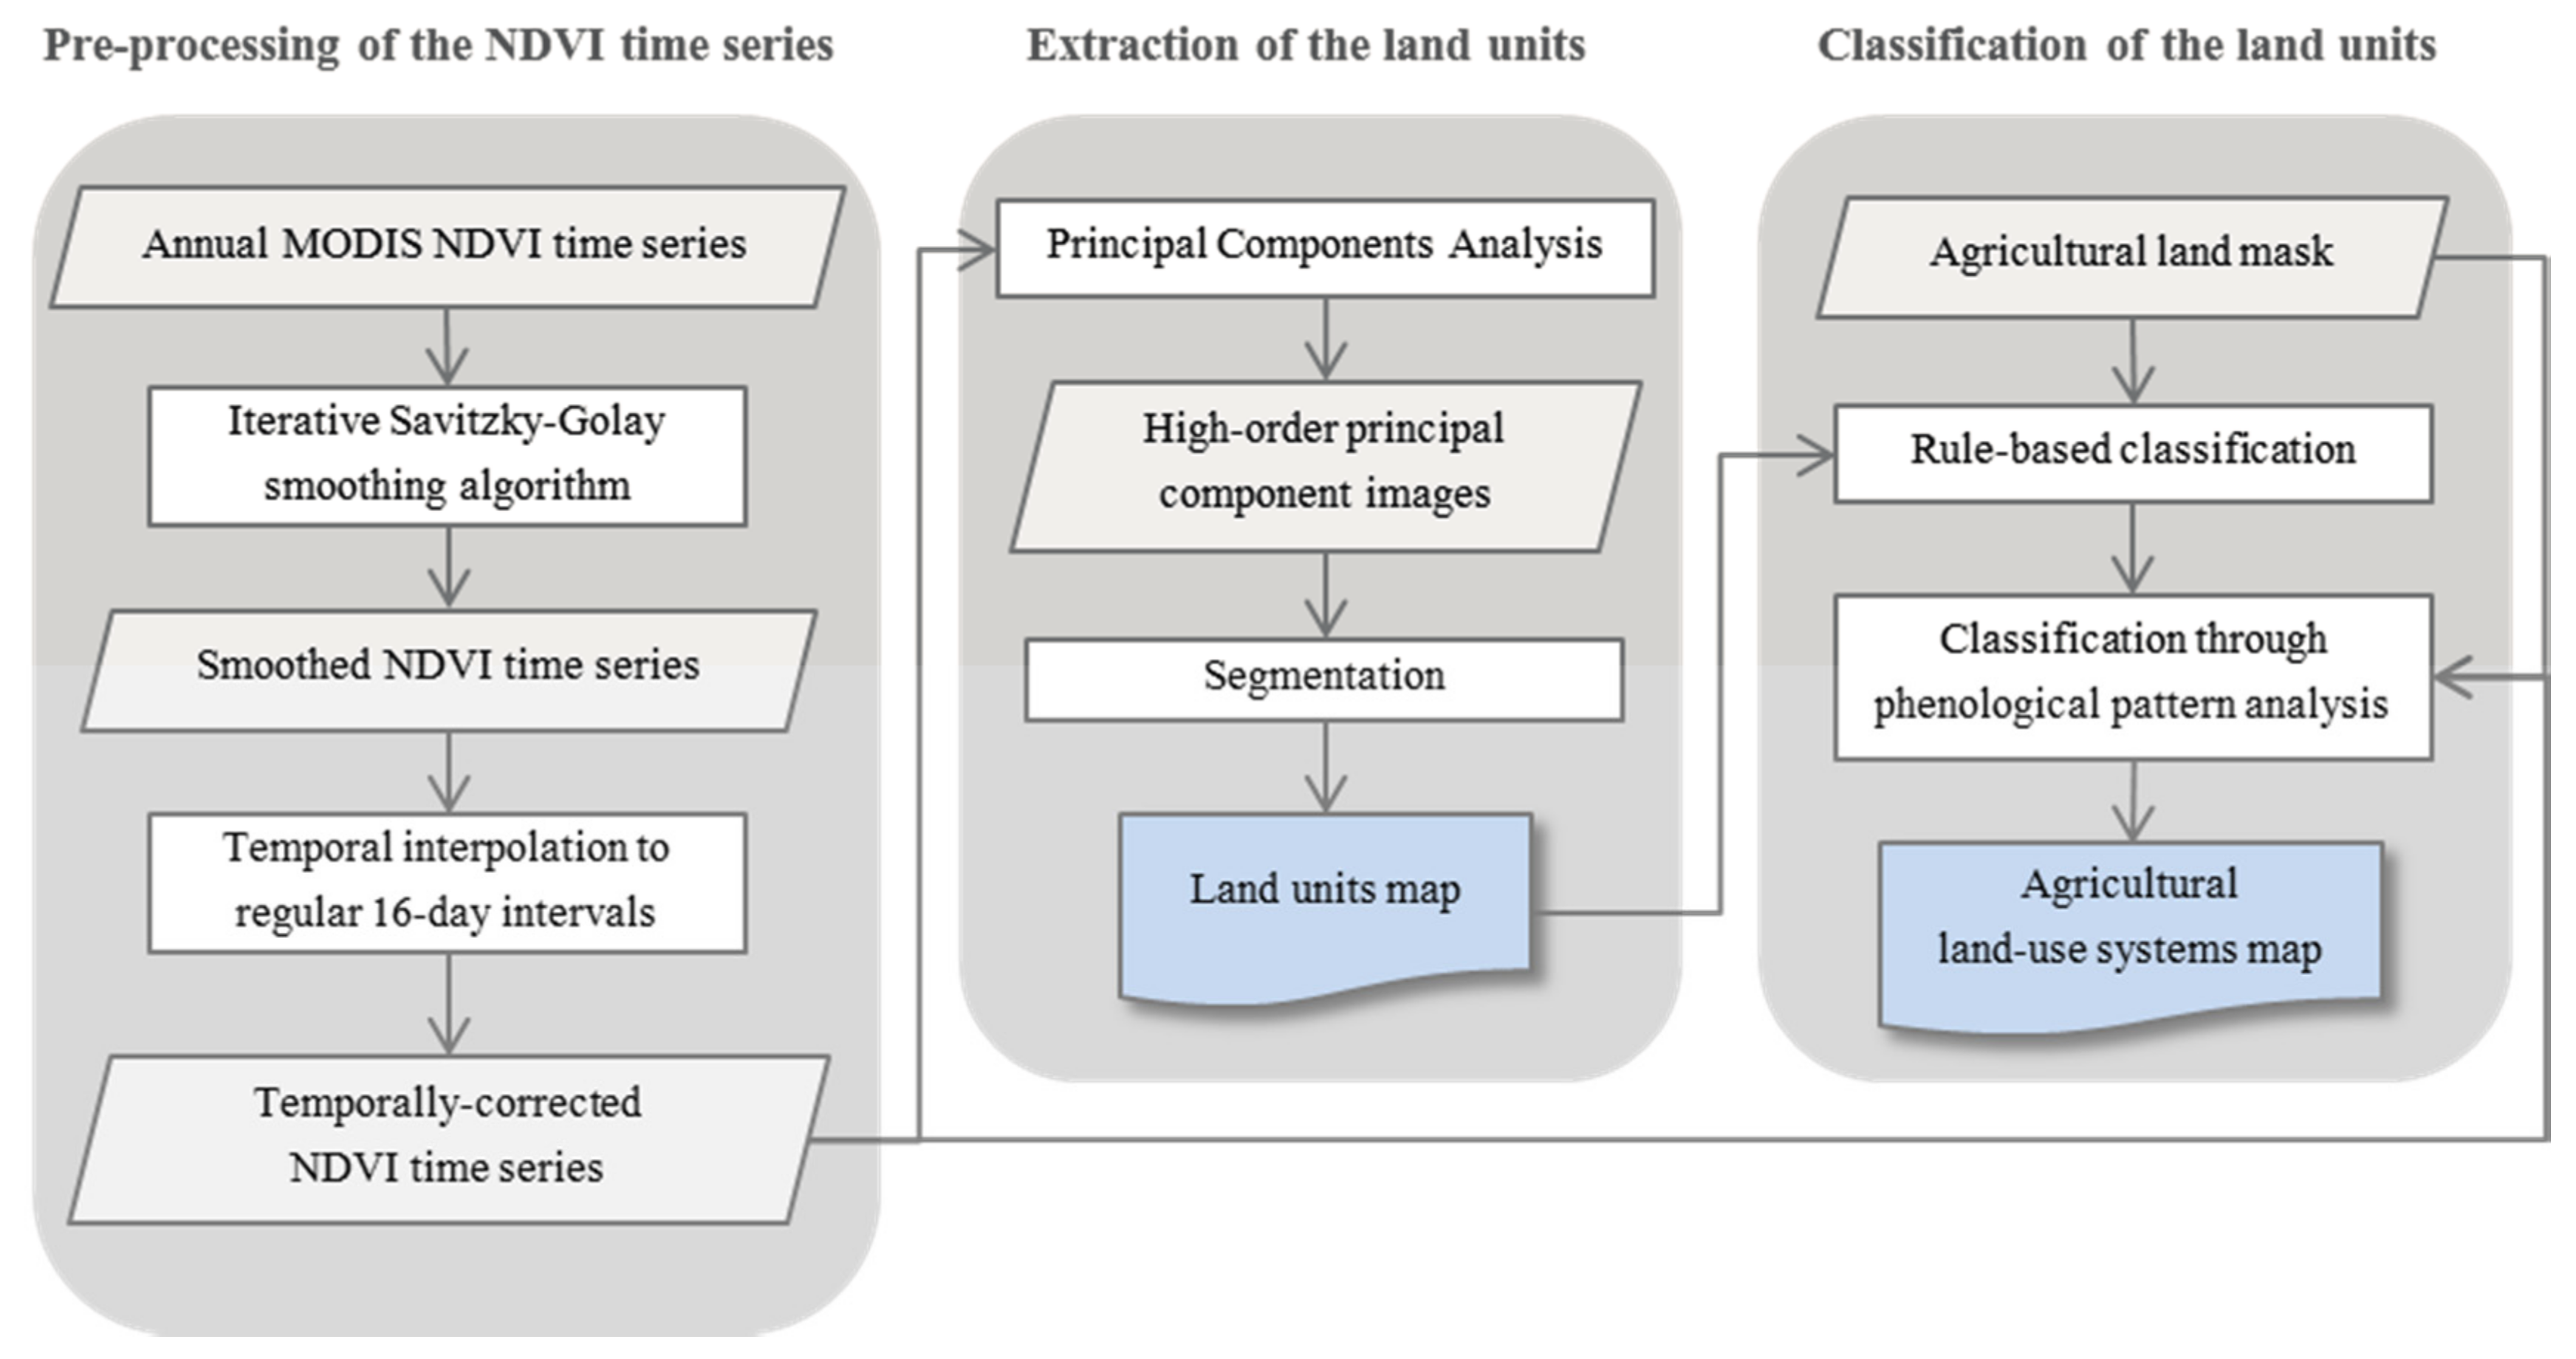
The methods applied in this study follow a typical GEOBIA approach [10] through automatic image partition into meaningful image objects (the land units), and subsequent classification of the resulting objects by an assessment of their characteristics to generate new geographic information (the agricultural land-use systems (ALUS) map). The methodological framework is presented in Figure 3 and described in the following three sub-sections: Pre-processing of the NDVI time series (Section 3.1); Extraction of the land units (Section 3.2); Classification of the land units (Section 3.3). A final sub-section presents the unsupervised evaluation approach that was used to evaluate the cropping systems’ classification results of the ALUS map (see Section 3.4. Unsupervised Evaluation of the Classification Results).

3.1. Pre-Processing of the NDVI Time Series

The compositing process of the MOD13Q1 product uses the Constrained View angle-Maximum Value Composite (CV-MVC) algorithm, which involves selecting (pixel-wise) the observation with the highest NDVI value and the smallest view angle out of all the observations made during a 16-day cycle [22]. However, remaining effects such as cloudiness or bi-directional effects are still present in the dataset.
In order to generate a noise-reduced time series, an adapted version of the function-fitting smoothing method introduced by Chen et al. [23] was applied. This noise-reduction algorithm is based on a linear interpolation of cloudy pixels, followed by the use of the Savitzky–Golay (SG) filter through an iteration process until the upper envelope of the original NDVI profile is best approached [23,24].
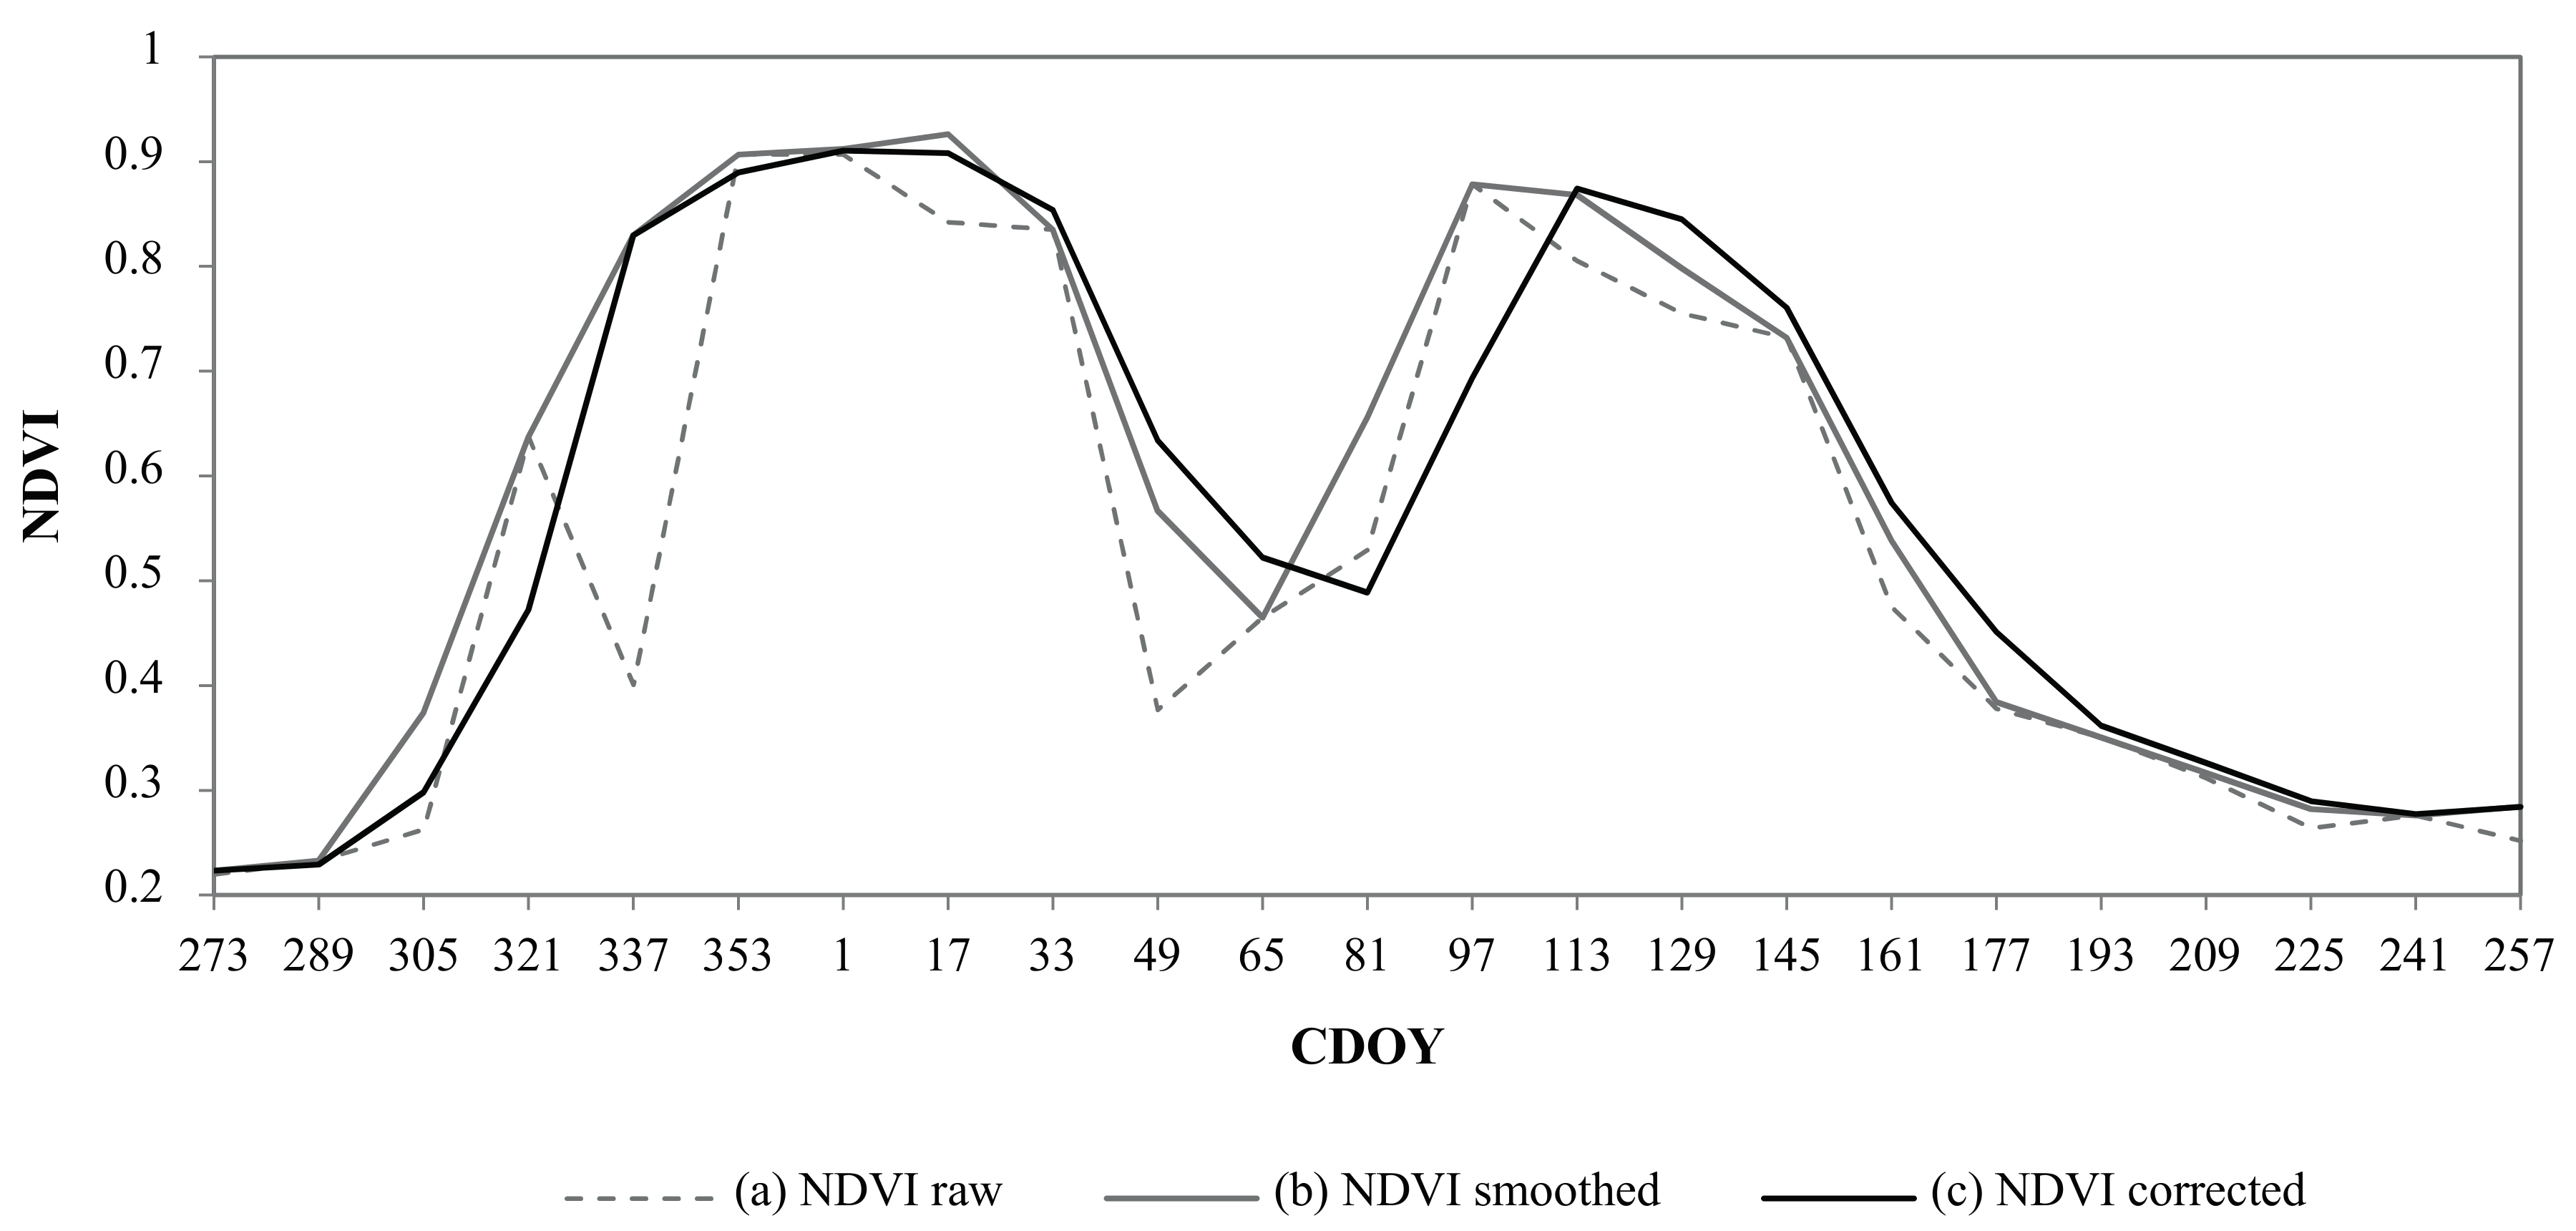
The cloud flag data supplied with the MOD13Q1 product (Pixel Reliability layer) showed systematic overestimations of clouds in the cropland areas, which are particularly evident during the harvest stages in the crop calendar. Consequently, only the pixels followed by an unnatural NDVI increase (greater than 0.4 between two composited images) were considered as cloudy dates and linearly interpolated. In order to reduce the noise of other residual effects such as consecutive cloudiness, the iterative SG filter was applied. After several tests, the parameters d (degree of the smoothing polynomial) and m (half-width of the smoothing window) of the SG filter (for the long-term change curve and for the fitting iteration) were set to d = 2, m = 2, and d = 6, m = 4, respectively. This smoothing method effectively improved the quality of the time series, reducing signal noise while preserving the detail of the NDVI temporal profiles (Figure 4).
To avoid the temporal discontinuities generated by the compositing process (which affect the shape of the NDVI profiles), the values of the smoothed time series were linearly interpolated. This was done using their actual acquisition dates provided in the “Composite Day of Year (CDOY)” layer of the MOD13Q1 product, to place them at 16-day regular intervals.

3.2. Extraction of the Land Units

The extraction of the land units is developed in two steps which are described in the following sub-sections: Principal Components Analysis (Section 3.2.1) and Delineation of the Land Units (Section 3.2.2).

3.2.1. Principal Components Analysis

A principal components analysis (PCA) transformation was applied to the corrected NDVI time series. Originally formulated by Pearson (1901), the PCA technique consists of a linear orthogonal transformation (or rotation) of the original variables into a set of uncorrelated variables known as the principal components (PC). When applied to remote sensing time series, PCA computes new values for each pixel of the original time series’ images to produce a set of PC images (also known as eigenchannels). The resulting PC images are uncorrelated with one another and ordered according to the amount of variance retained within the total variance of the original time series dataset (from most to least). Low-order PC images (PC1, PC2) concentrate most of the variance and therefore inevitably capture the information redundancy among the original images, while the higher-order PC images capture less redundant information (associated with specific localized change events).
PCA has proven to be particularly effective (when applied to NDVI time series) at identifying seasonal changes of the land cover and revealing their relationship to different factors—mainly climate variability and human activities factors [25,26,27,28,29,30]. The type of information captured by each PC image will vary according to the characteristics of the input NDVI time series (temporal resolution and length of the time series, spatial resolution and extent) and the PCA method used (either unstandardized if the PC images are calculated using the covariance matrix, or standardized if the correlation matrix is used instead). However, some common outcomes are observed when the area under analysis is large enough to include different types of land cover: The first PC image captures the major element of variability in the NDVI time series (which for large areas corresponds to the spatial variability of the NDVI values, and is correlated to the integrated NDVI over all seasons), whilst the other PC images capture the seasonal and intra-seasonal variability of NDVI, each related to a particular factor or a combination of factors [25,26,27,28,29,30].
We expect the phenological patterns of different agricultural land-use systems (configured by seasonal development of the vegetation and intra-seasonal variability and short-term fluctuations induced by the agricultural practices), to be detectable in these latter PC images. Therefore, after performing a PCA on the corrected NDVI time series of 23 images, we retained the last 22 PC images (the high-order PC images) out of the 23 resulting PC images for further analysis, which contain 27% of the total variance. The first PC image was deliberately discarded after verification that the temporal variability of NDVI was not significantly captured, and that (as expected) the 73% of the total variance captured by the first PC image is mostly related to the spatial variability of the NDVI values, as shown in other studies (e.g., [27,28]).
The PCA was performed by means of the rasterPCA tool in the processing R package RStoolbox Version 0.1.8 [31] and was based on the covariance matrix (unstandardized PCA). Unstandardized PCA is preferred since sudden changes in the magnitude of the NDVI related to land use (such as a rapid NDVI decrease due to crop harvest) will contribute significantly to the development of the new component images. Conversely, normalizing the input images through standardized PCA would weaken the contribution of these sudden change events by forcing all the original input images to have equal weight in the derivation of the PC images.

3.2.2. Delineation of the Land Units

The segmentation of the high-order PC images was performed using the iterative region-growing algorithm based on the Baatz and Schäpe criterion, implemented in the Multiresolution Segmentation tool of the object-orientated image analysis software eCognition® Developer 9.0 [32]. This algorithm starts with each pixel of the image forming an image object. At each iteration, neighboring objects are merged based on their similar characteristics described by a homogeneity criterion, until a user-defined threshold (known as the scale parameter) is reached. The multiresolution segmentation algorithm ensures a regular growth of the image objects over the whole scene, and so the resulting objects have a similar size, which is determined by the scale parameter threshold. In this way, a low scale parameter will lead to many objects of small size and, conversely, a high scale parameter will allow the growth of few large objects. The influence of the radiometry versus the shape in the definition of the homogeneity criterion is determined by the weight assigned to the color and shape parameters [33].
The objective of the segmentation being the delineation of land units with relatively homogeneous phenological patterns, the shape of the objects in the definition of the homogeneity criterion becomes irrelevant and, therefore, we assign the total weight to the color by setting the color parameter to 1 and the shape parameter to 0. In practice, setting the color parameter to 1 means that the relative homogeneity of the resulting image objects (land units) will be entirely based on the pixel values of the PC images and their implicit information related to the temporal variability of the vegetation cover. Besides, each of the 22 PC images is made to contribute equally to the segmentation by setting the weight of each input PC image to 1.
A scale (according to Benz et al. [34]) is defined as the level of aggregation and abstraction at which an object can be clearly described. Since our geographic objects of interest (the land units) do not relate to an inherent scale but can rather be described at different scales of analysis, we consider that there is no optimal segmentation scale and that different scale parameters should be tested in each particular case to approach adequately sized, thematically meaningful land units. We assume that the multiresolution segmentation algorithm based on homogeneity criterion delineates relatively homogeneous objects regardless of the scale parameter used. However, some simple guiding principles were followed in this study to choose among different scale parameters aiming at meaningful land units (in terms of relatively homogeneous phenological patterns): Objects should be larger than the minimum mapping unit of an agricultural land-use system (i.e., the field) and there should be a sensible trade-off between the number of objects for further analysis and their degree of heterogeneity. After testing several segmentation levels, the scale parameter threshold was empirically set to 850 (unitless).

3.3. Classification of the Land Units

The classification of the land units is developed in two steps which are described in the following sub-sections: Rule-based Classification (Section 3.3.1) and Classification through Phenological Pattern Analysis (Section 3.3.2).

3.3.1. Rule-Based Classification

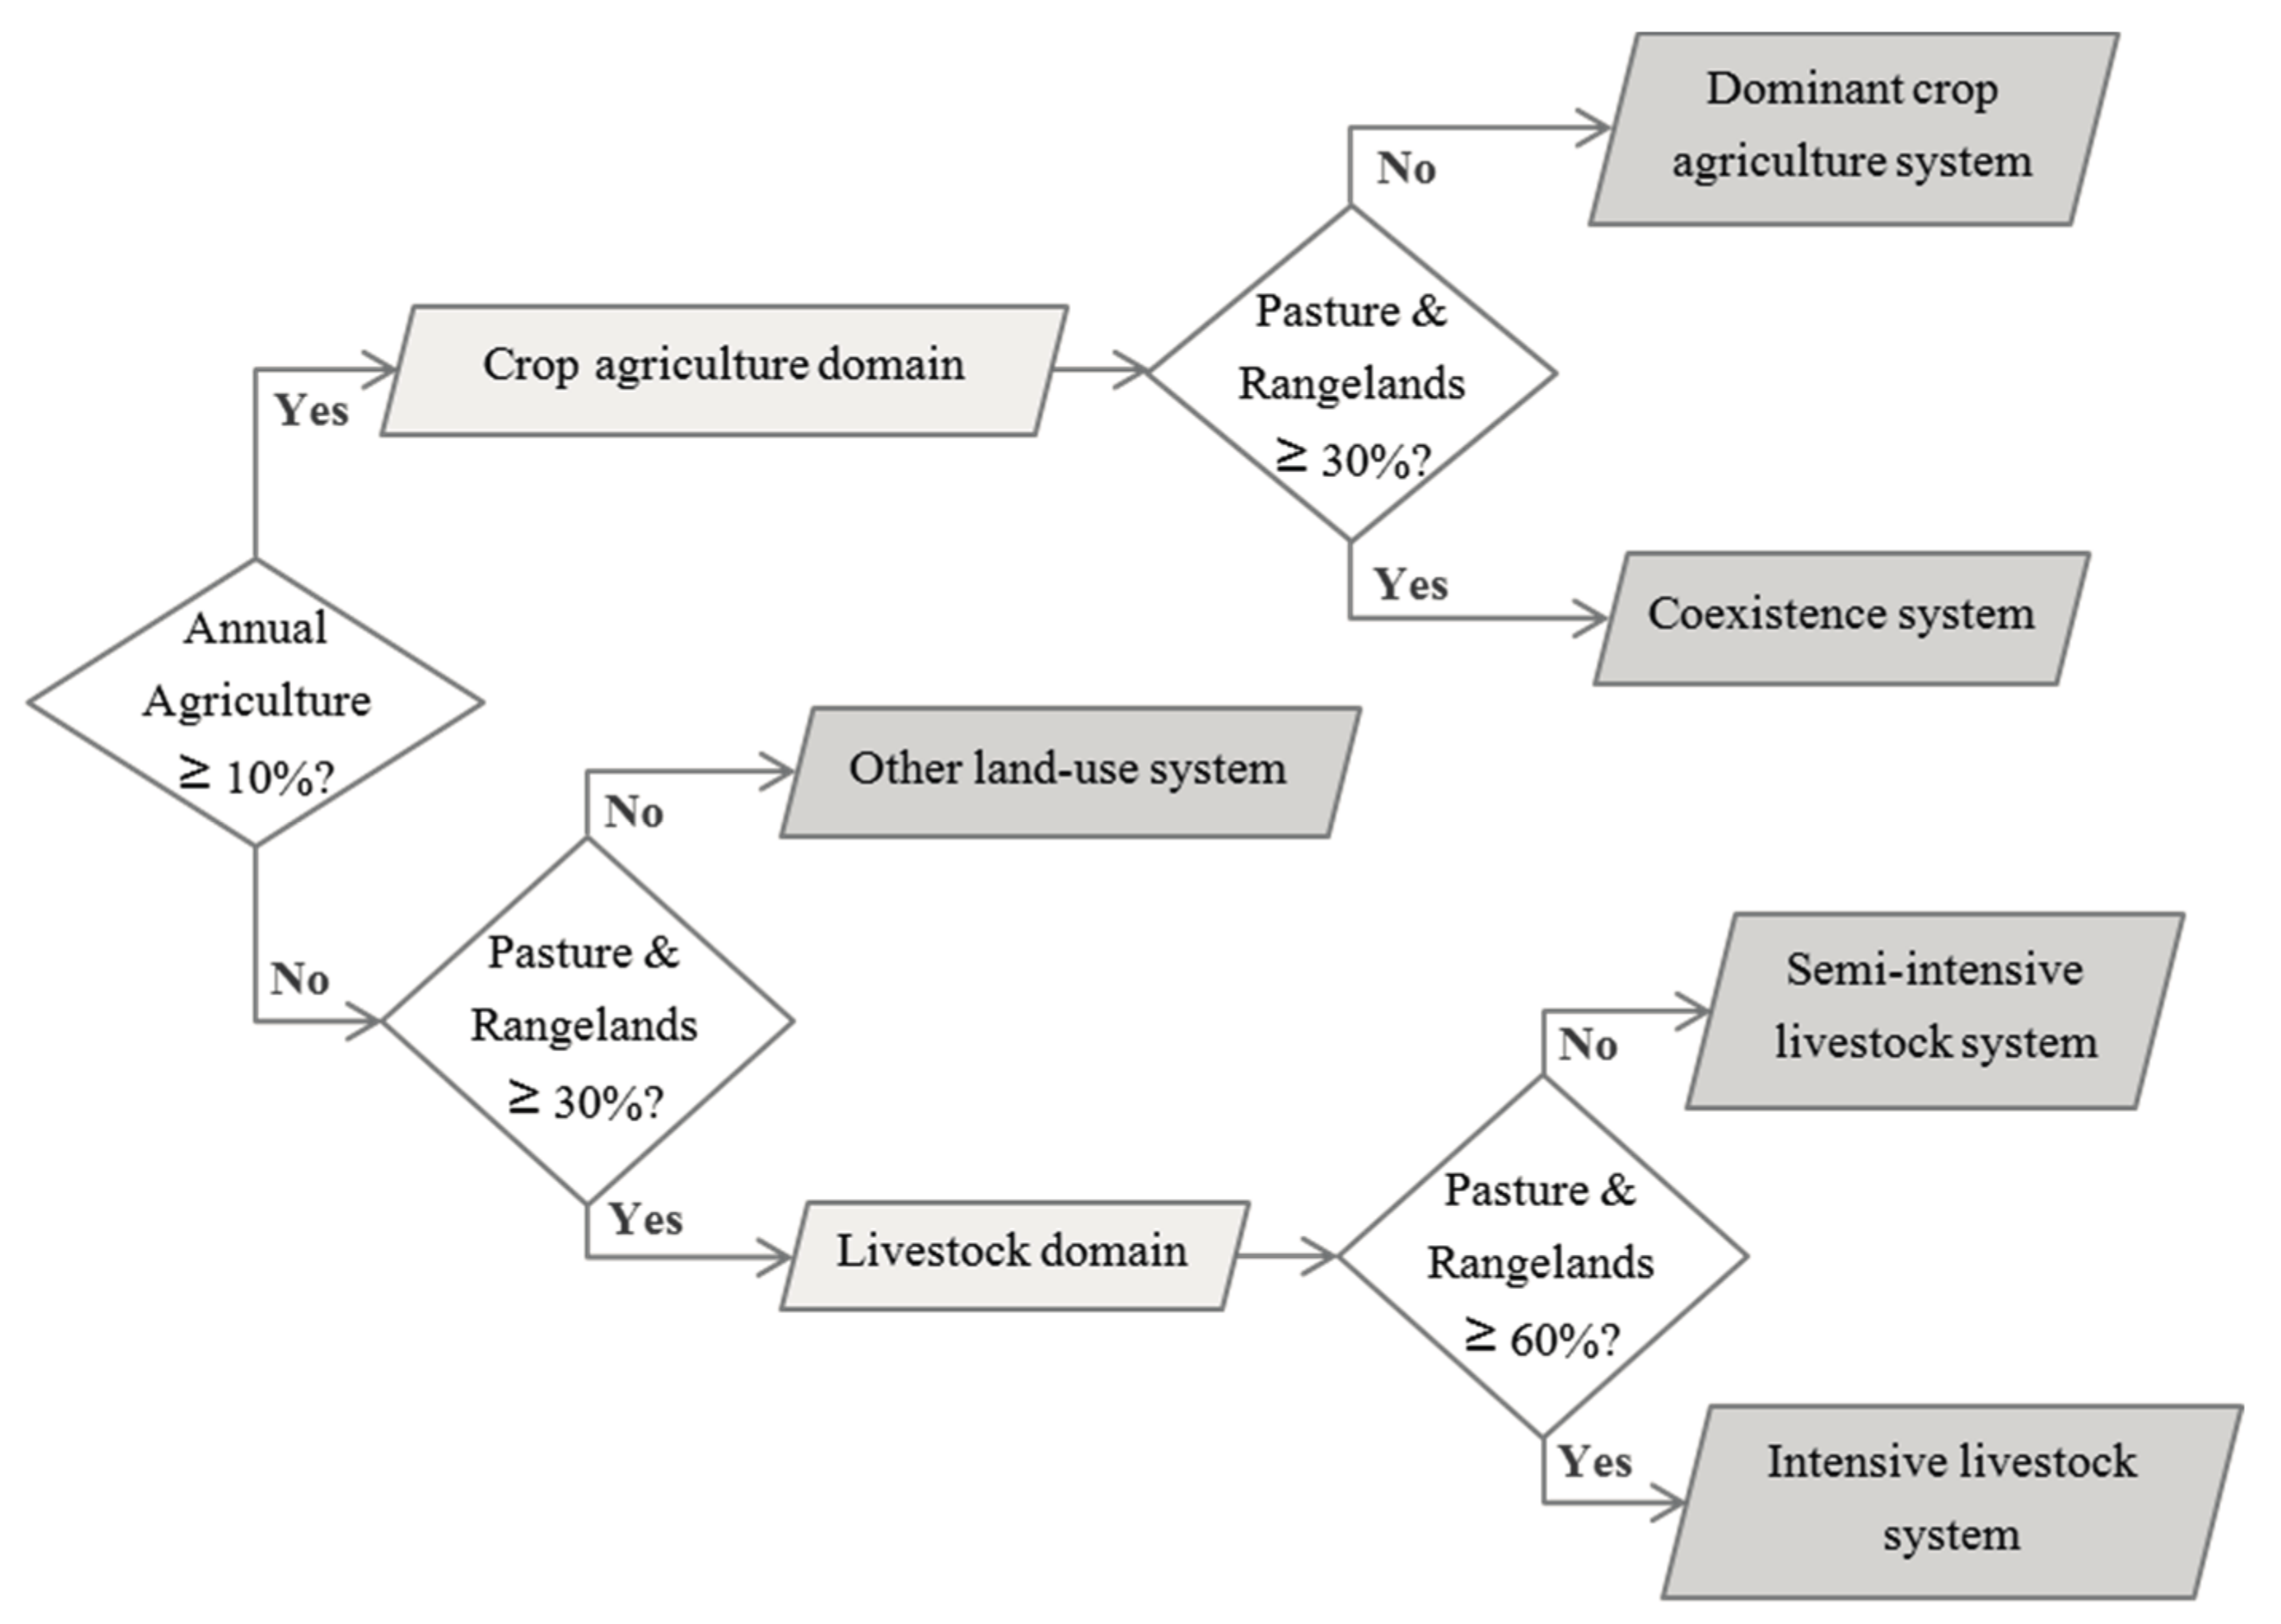
The agricultural land-cover map extracted from the TerraClass product was used for the classification of the land units belonging to the agricultural domain (either to the crop agriculture domain or to the livestock domain) into four major ALUS: Dominant crop agriculture system, coexistence (crop-livestock) system, semi-intensive livestock system, and intensive livestock system. This preliminary classification of the ALUS was performed following the decision tree ruleset developed by Almeida et al. [35] for the localization of agricultural production systems in the Brazilian State Rondônia at the municipal level, presented in Figure 5. This ruleset seems well adapted for the classification of the ALUS in the Tocantins state, owing to its closeness to the Rondônia state (in terms of land-cover and land-use systems’ characteristics).

3.3.2. Classification through Phenological Pattern Analysis

The land units belonging to the crop agriculture domain were further classified into different cropping systems based on the analysis of their phenological patterns. The mean temporal NDVI profile of the cropland cover inside each land unit was extracted from the MODIS NDVI time series using the TerraClass annual agriculture class as a mask. The general NDVI variations over the growing season were analyzed through visual interpretation of the shape of the resulting mean temporal NDVI profiles, which revealed the principal crop development stages of the cropland cover inside each land unit. The NDVI profiles with visually equivalent shapes were grouped together and were finally classified into different cropping systems by correspondence with the crop calendar of the main cropping systems of Tocantins.

3.4. Unsupervised Evaluation of the Classification Results

Since there are no available thematically-equivalent maps with which to validate the accuracy of the classification of the ALUS, an unsupervised evaluation was carried out with a reference map extracted from the official agricultural statistics (area estimates of the annual crops in the municipalities of Tocantins for the year 2014). The evaluation was only carried out for the cropping systems’ results since no official statistics were available on the pasture and rangelands with which to evaluate the livestock systems’ classification results.
In order to produce a synthetic reference map out of the detailed agricultural statistics dataset that could be compared to the cropping systems in the ALUS map, we first calculated the proportion of area occupied by each crop type in the municipalities with more than 2000 hectares of cultivated area. The predominant crop types (accounting for most of the cultivated area) were differentiated from minor crops and were used to characterize the main cropping system related to each municipality.
The ALUS map was finally evaluated based on the spatial agreement between the classified cropping systems and the cropping systems in the reference map.

4. Results

4.1. Land Units

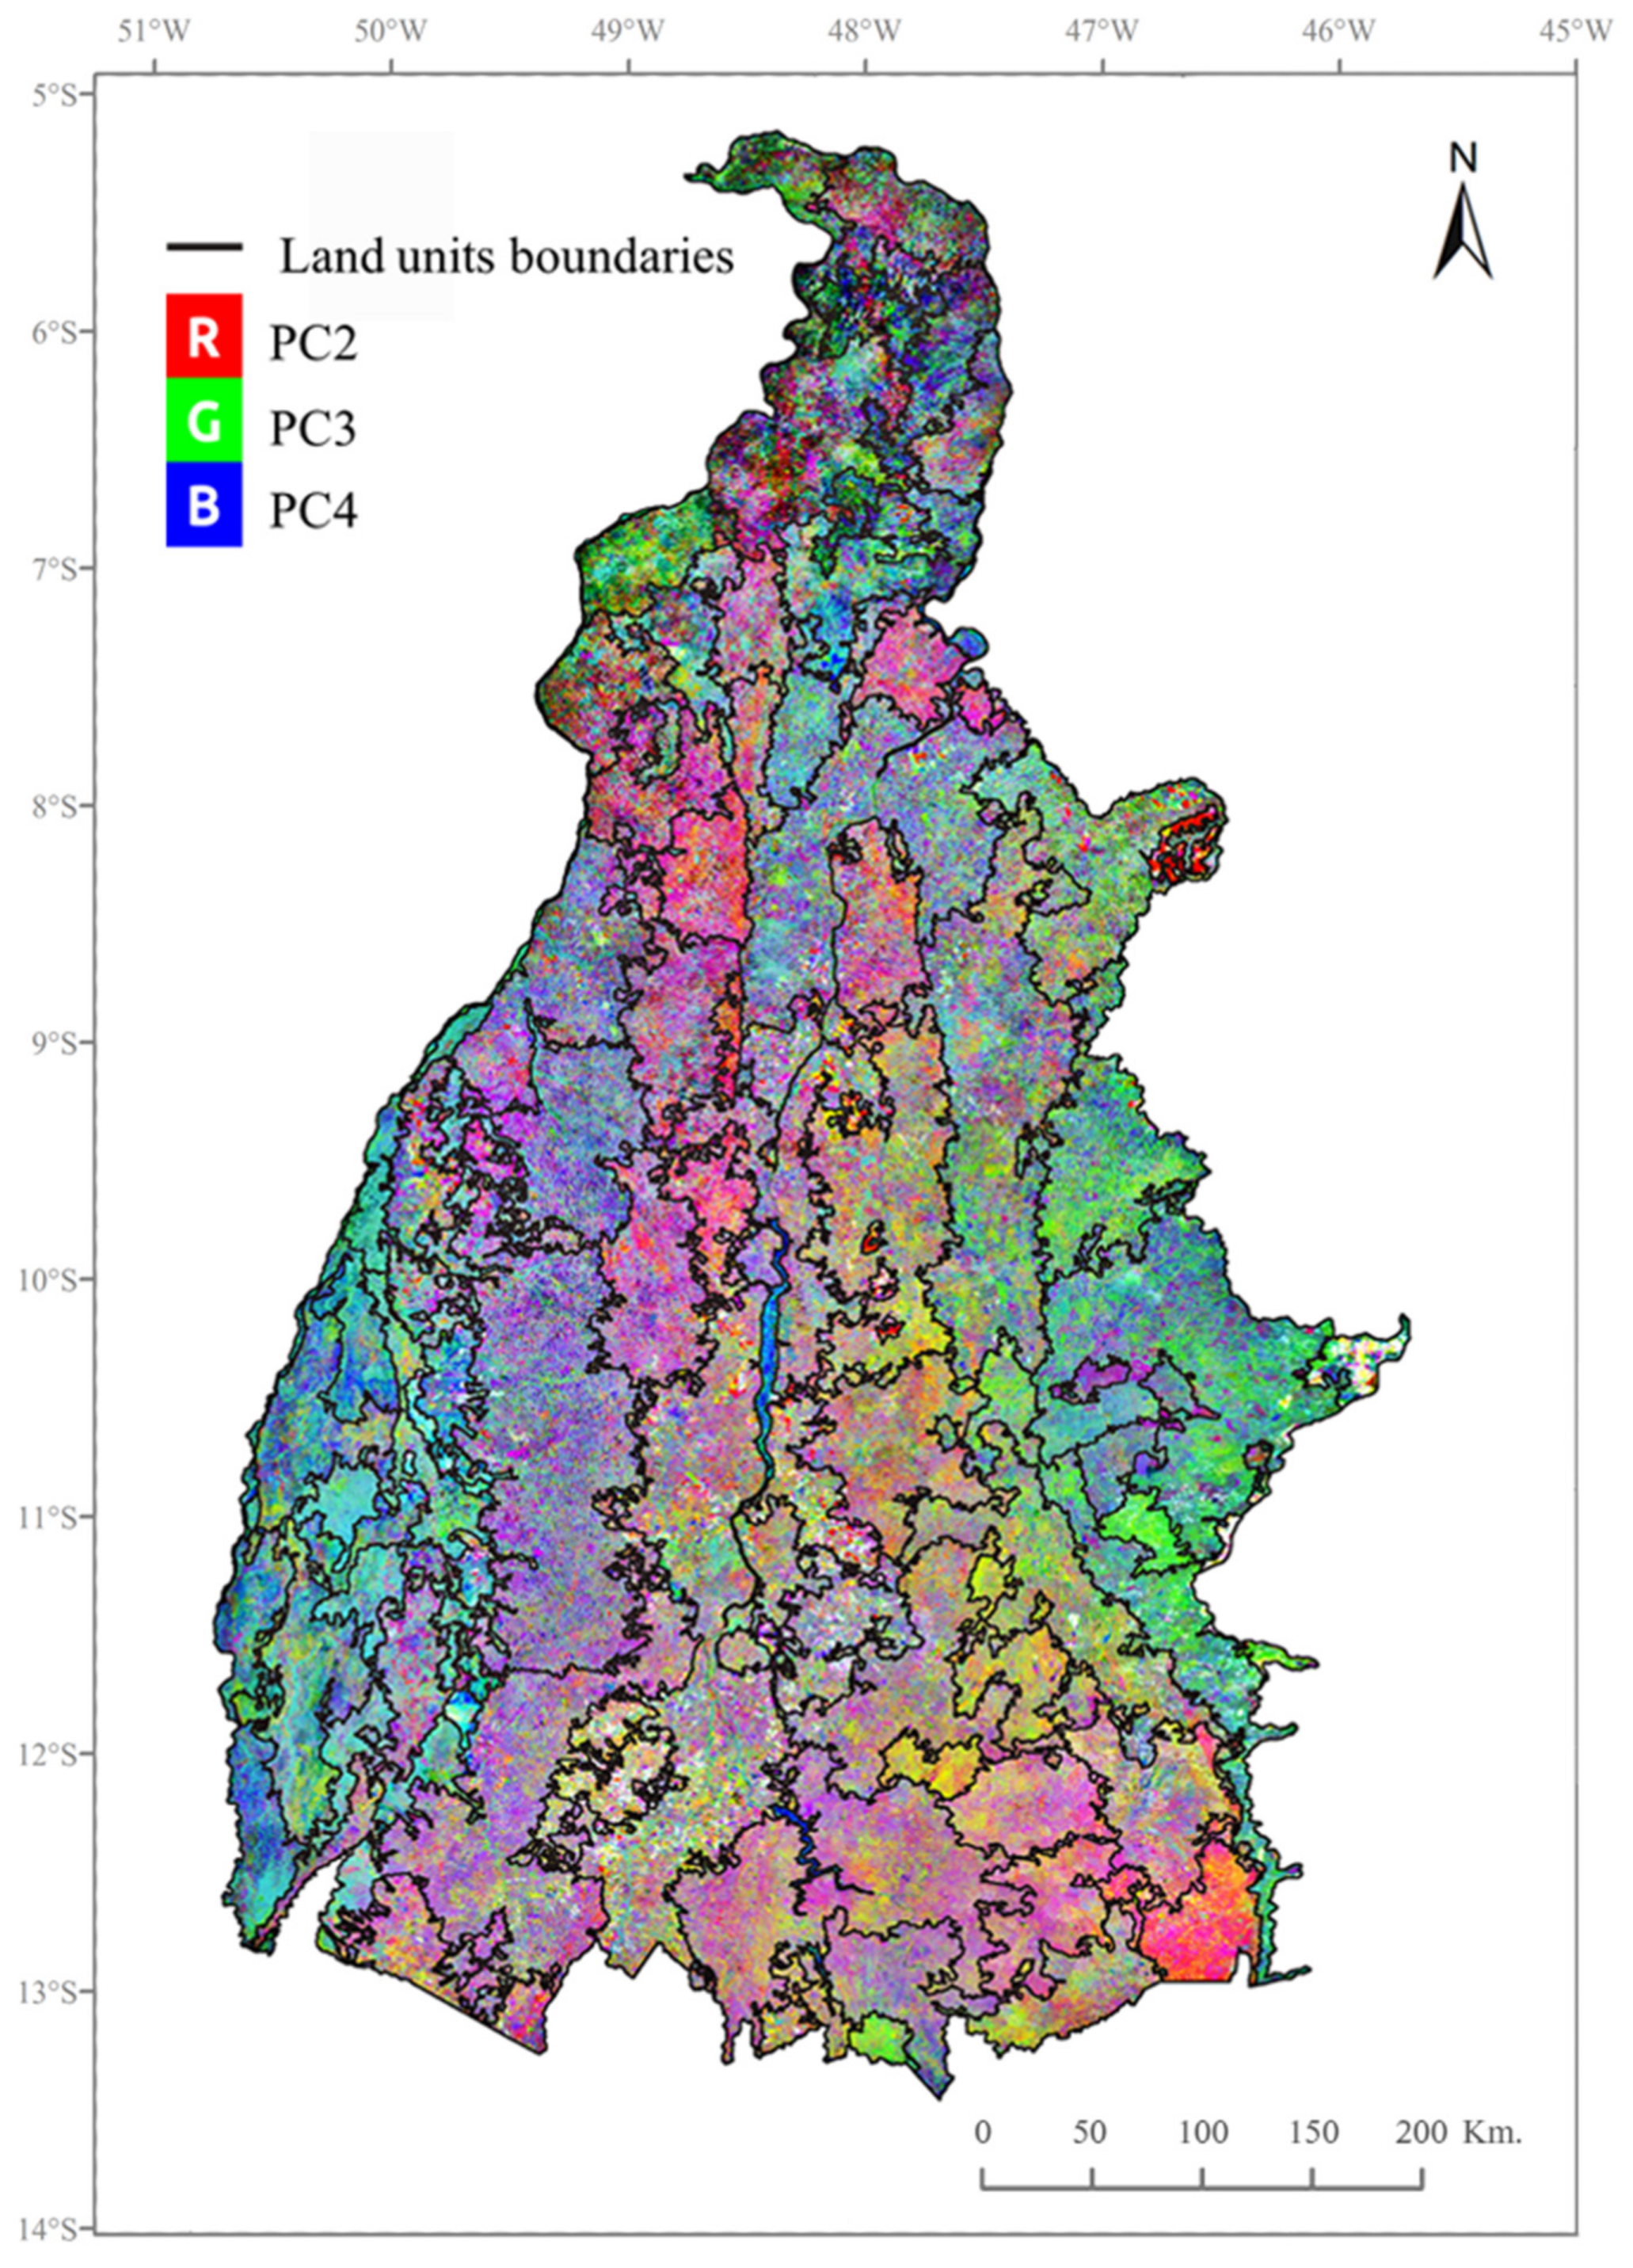
The segmentation of the high-order principal component images produced a total of 90 land units (Figure 6), with an average size of 3090 km2, 44 km2 for the smallest one, and 15,069 km2 for the largest one.

4.2. Agricultural Land-Use Systems

The decision tree ruleset based on the agricultural land-cover map extracted from the TerraClass product identified a total of 44 land units belonging to the agricultural domain (114,114 km2) among the 90 automatically delineated land units. Out of the 44 land units, 21 were classed as dominant crop agriculture systems (11,193 km2), 15 as semi-intensive livestock systems (82,576 km2), 7 as intensive livestock systems (18,329 km2) and 1 was classed as a coexistence system (2016 km2) (the latter corresponding to an area where both a crop agriculture system and a livestock system are present).
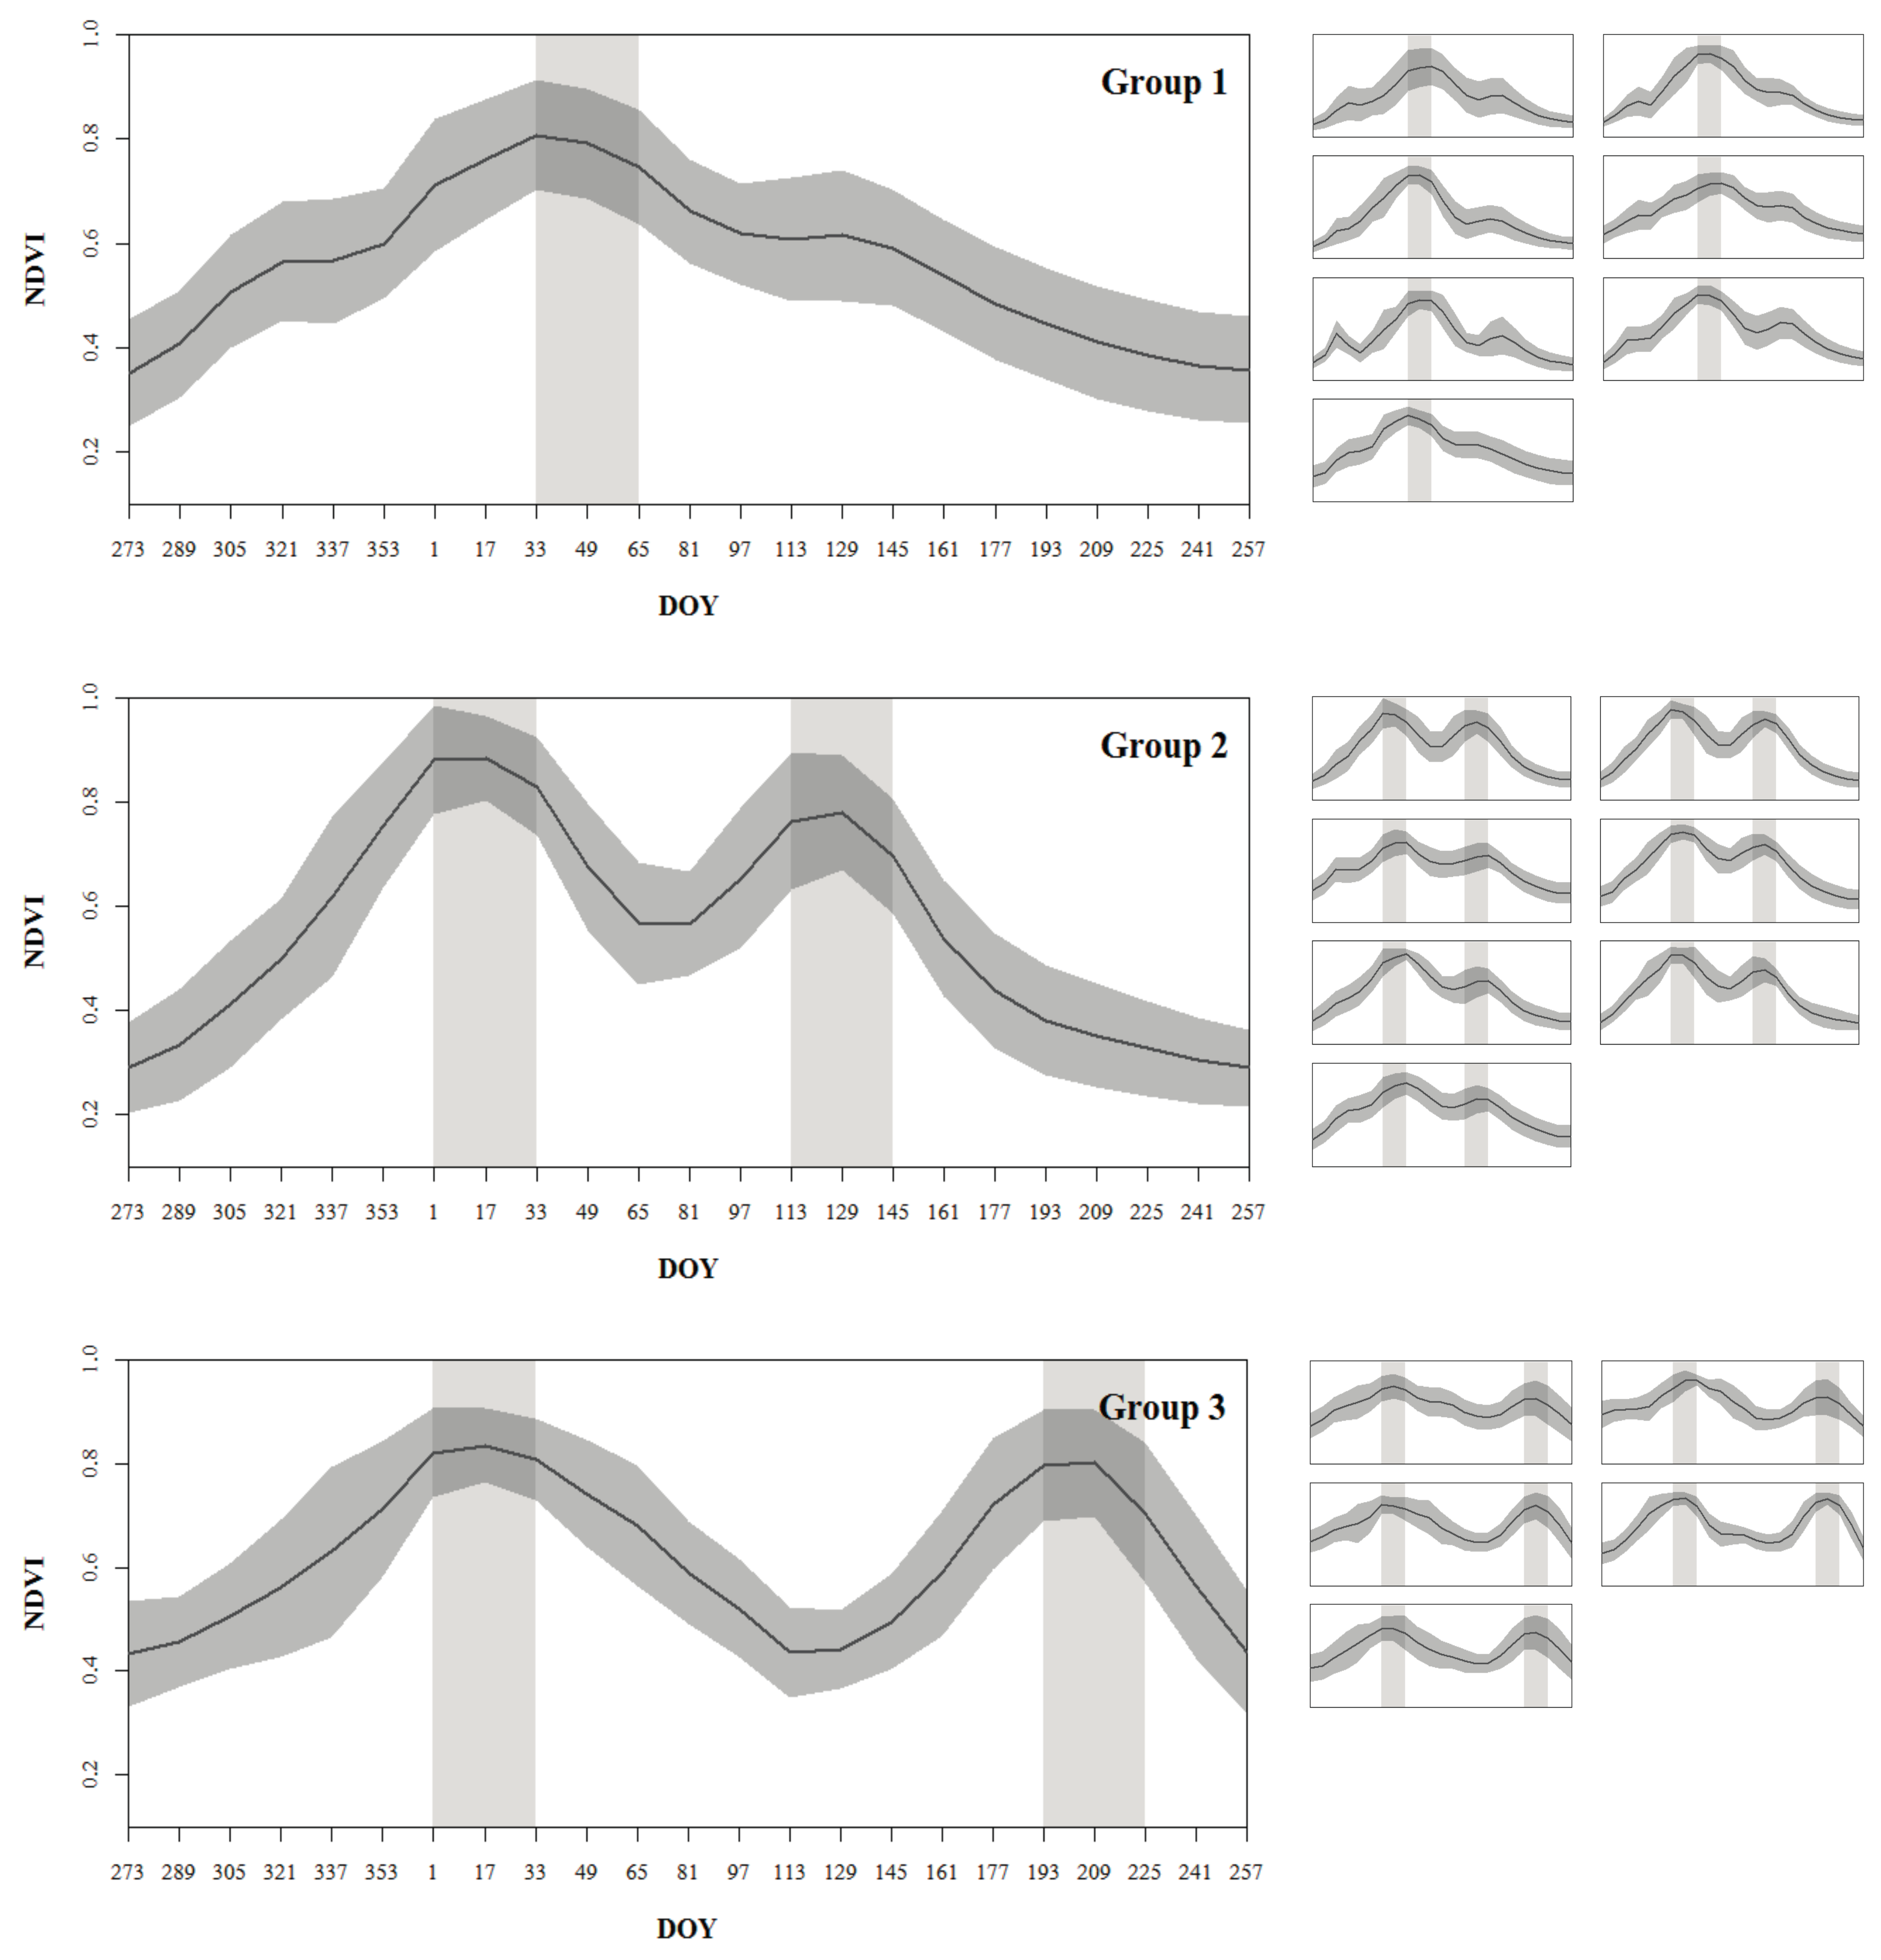
Three distinct phenological patterns were identified from the analysis of the shape of the temporal NDVI profiles of the 22 land units belonging to the crop agriculture domain. The plots of the 22 temporal NDVI profiles are presented in Figure 7 in three groups of phenological patterns.
In the first group a major single crop cycle prevails, with a peak NDVI period around February (from day 33 to day 65) (Figure 7). Since only minor increases of NDVI appear before and after the main growing cycle, we can consider that there is no secondary meaningful development cycle of the vegetation cover, and that, therefore, the land units belonging to the first group are mainly related to a single cropping system. Since the soybean crop is the dominant crop of Tocantins, the first group of land units seems distinctive of the soybean single cropping system.
The second and the third groups of land units both show a characteristic double NDVI peak representing separate crop cycles (Figure 7). Although the first cycle of both groups has a common peak NDVI period around January (from day 1 to day 33), these two groups are easily dissociable by their temporal NDVI profile shapes, for their second cycle appears with more than a month difference between the two groups. The phenological pattern of the second group is distinctive of the soybean–maize double cropping system, which is characterized by a summer soybean crop during the rainy season followed by a winter maize crop. This phenological pattern exhibits low NDVI values around Mars (from day 65 to day 81) as a result of the soybean harvest, after which the winter maize is usually immediately sown and subsequently harvested during June and July (shown by the low NDVI values after day 161).
The phenological pattern of the third group is distinctive of the rice–soybean double cropping system, which is the characteristic cropping system of the lowlands located in the southwest of Tocantins in the Formoso river basin. This particular cropping system is characterized by a flood-irrigated rice crop during the rainy season followed by a sub-irrigated soybean crop from May to September (mostly for seed production). The low NDVI values around May (from day 113 to day 145), followed by an increase until the second peak NDVI period is reached around July (from day 193 to day 225—shown in Figure 7), evidences the late second soybean crop cycle, which is unique to the rice–soybean double cropping system.
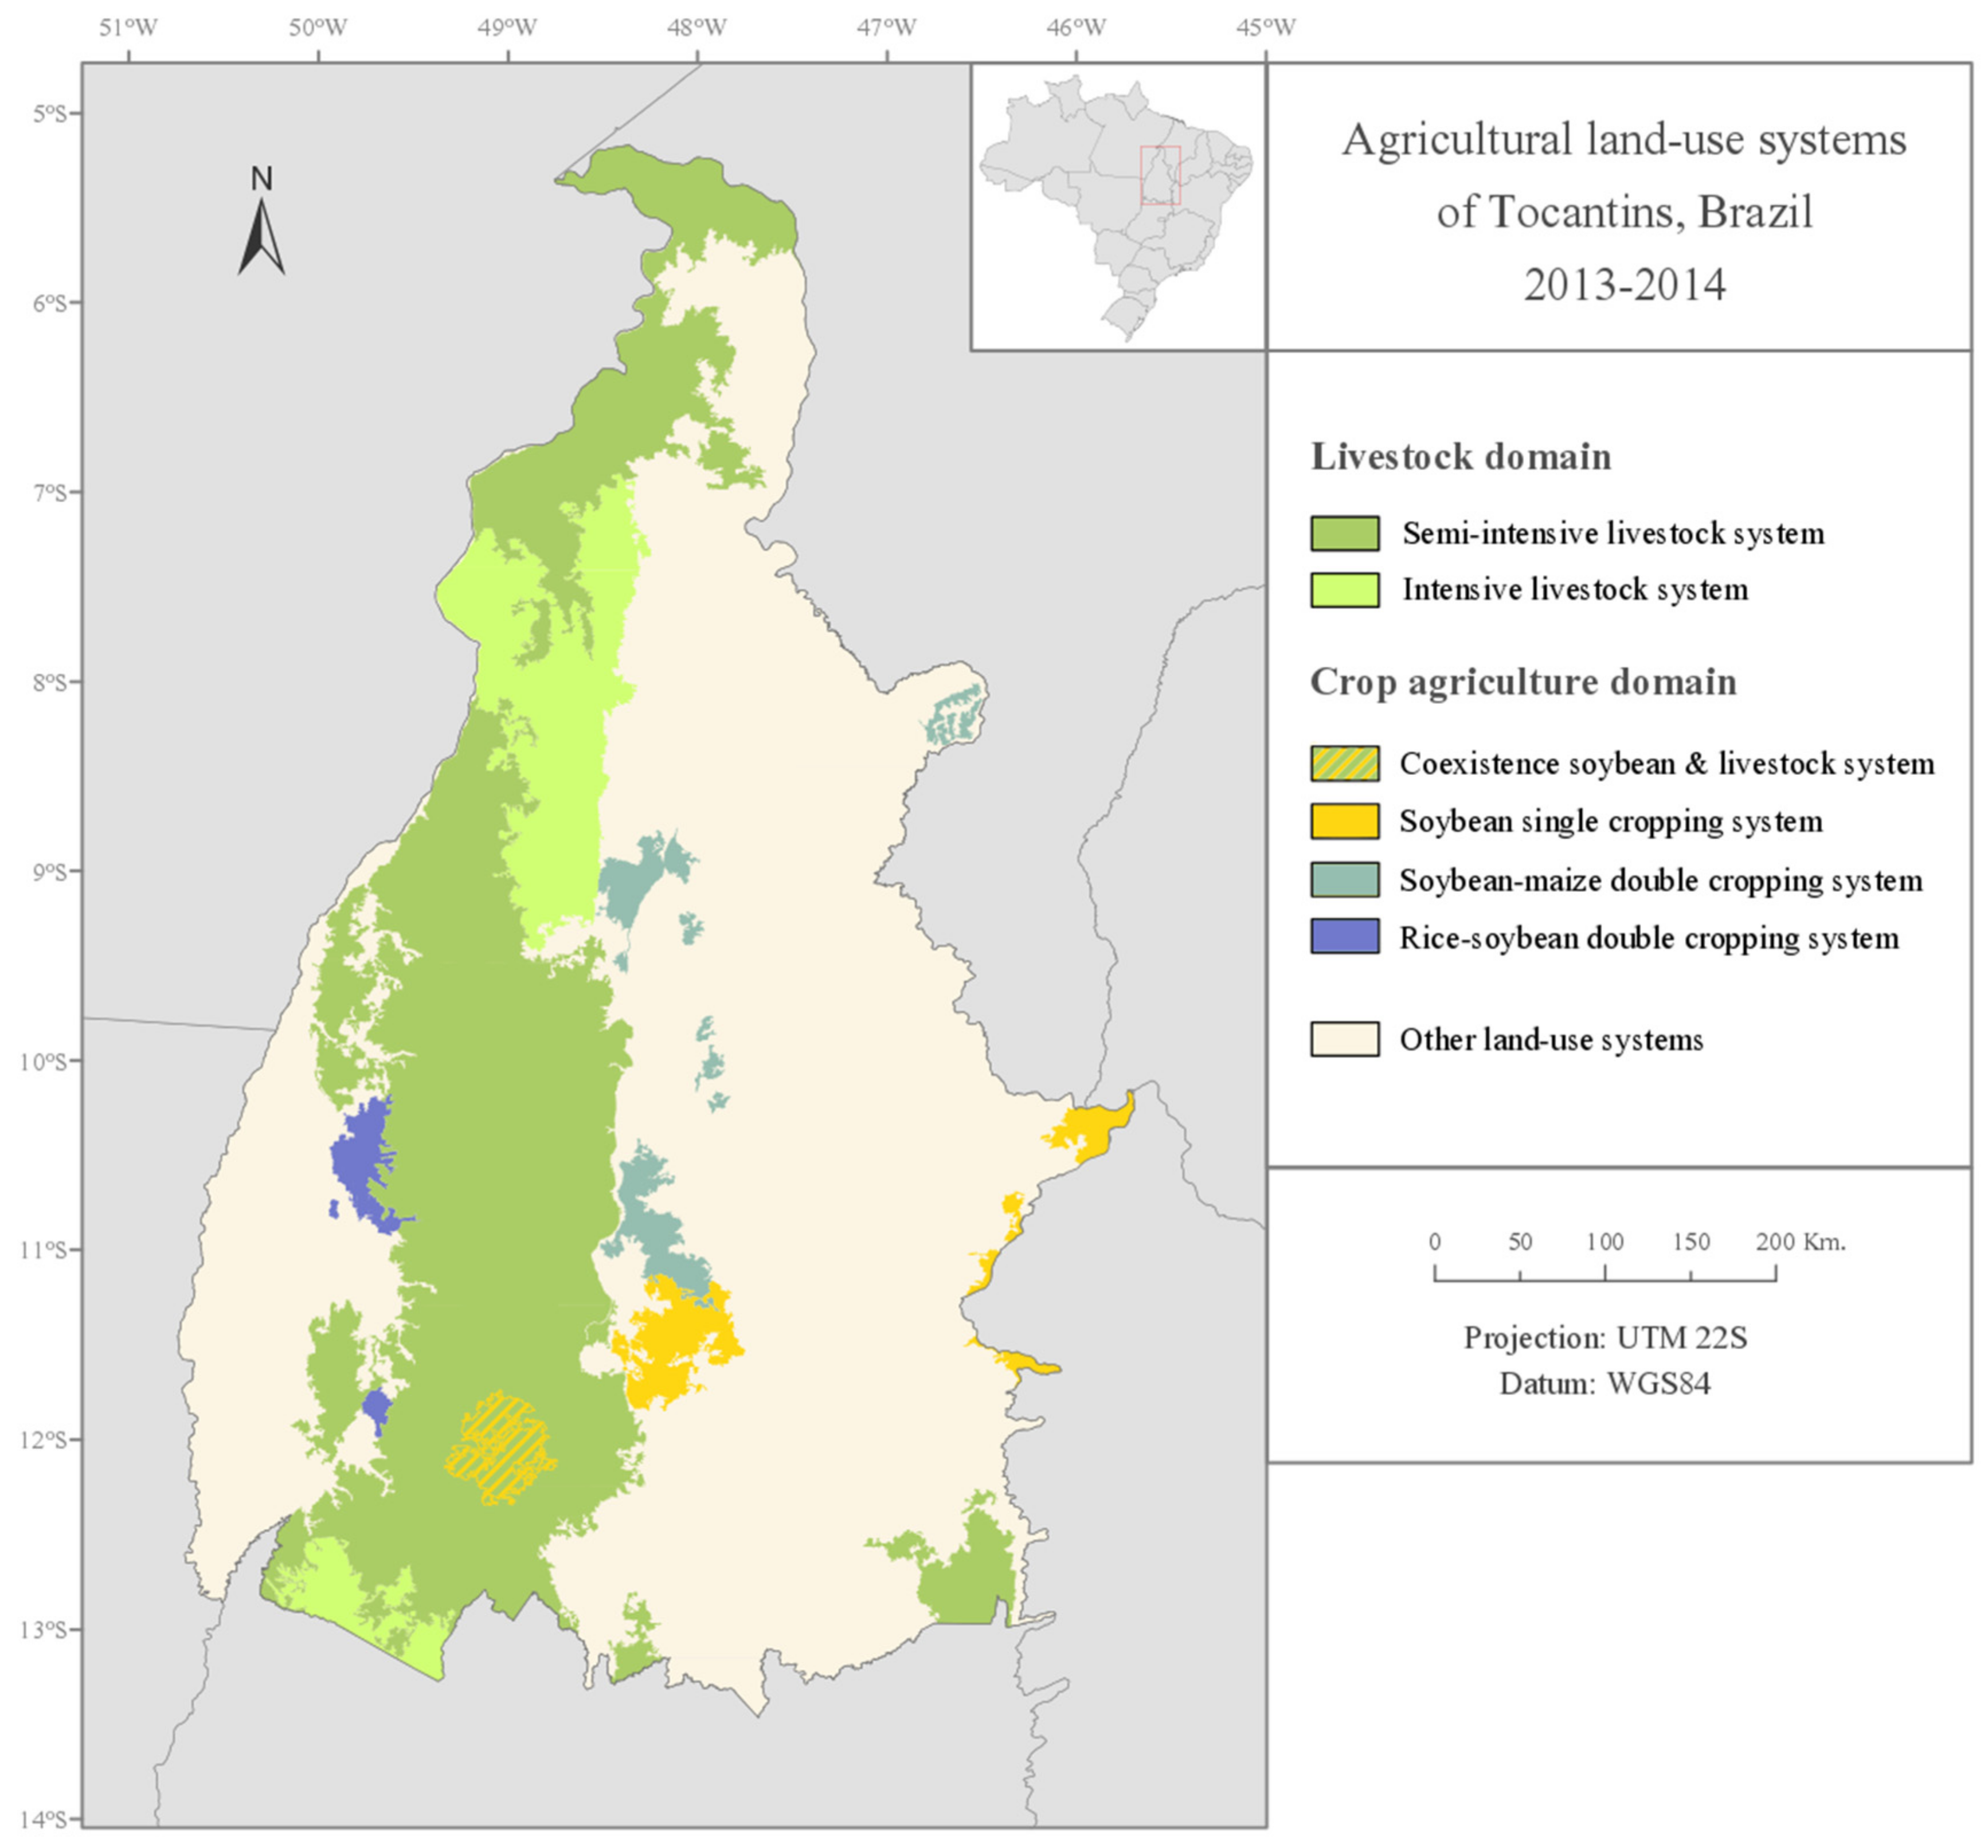
The crop agriculture domain land units were therefore sub-classified into the three main cropping systems of Tocantins according to the correspondence of their phenological patterns with the characteristic cropping pattern of each cropping system. The map of the main ALUS of Tocantins with the final classification is presented in Figure 8.
As shown in Figure 8, the livestock systems occupy a larger area (about eight times larger) than the cropping systems, and are mainly distributed along a longitudinal transect located in the center-west of the state. The cropping systems are concentrated in specific locations that are sparsely distributed over most of the state—except for the northern third of the state, where the livestock systems are predominant. The livestock systems and the cropping systems are mostly separated, except for the only coexistence area located in the southern region of the livestock-dominant longitudinal transect.

4.3. Unsupervised Evaluation of the Classification Results

The agricultural statistics at the municipal level revealed three predominant crops accounting for more than 94% of the total cultivated area: Soybean (75%), rice (11.1%), and winter maize (8.6%). All of the municipalities with more than 2000 hectares of cultivated area present a high proportion of the soybean crop, with 29–100% of their cultivated area dedicated to its production (which confirms the dominance of this crop type in Tocantins). However, three distinct classes of municipalities were observed. A first class (composed of 15 municipalities)—where the cultivated area is almost exclusively covered by soybean—was related to the soybean single cropping system. A second class (composed of 7 municipalities)—where the proportion of winter maize is considerable—was related to the soybean–maize double cropping system. Finally, a third class (composed of 3 municipalities)—where the proportion of rice is nearly equivalent to the proportion of soybean—was related to the rice–soybean double cropping system. The average proportion of the different crop types for each class of municipalities is presented in Figure 9.
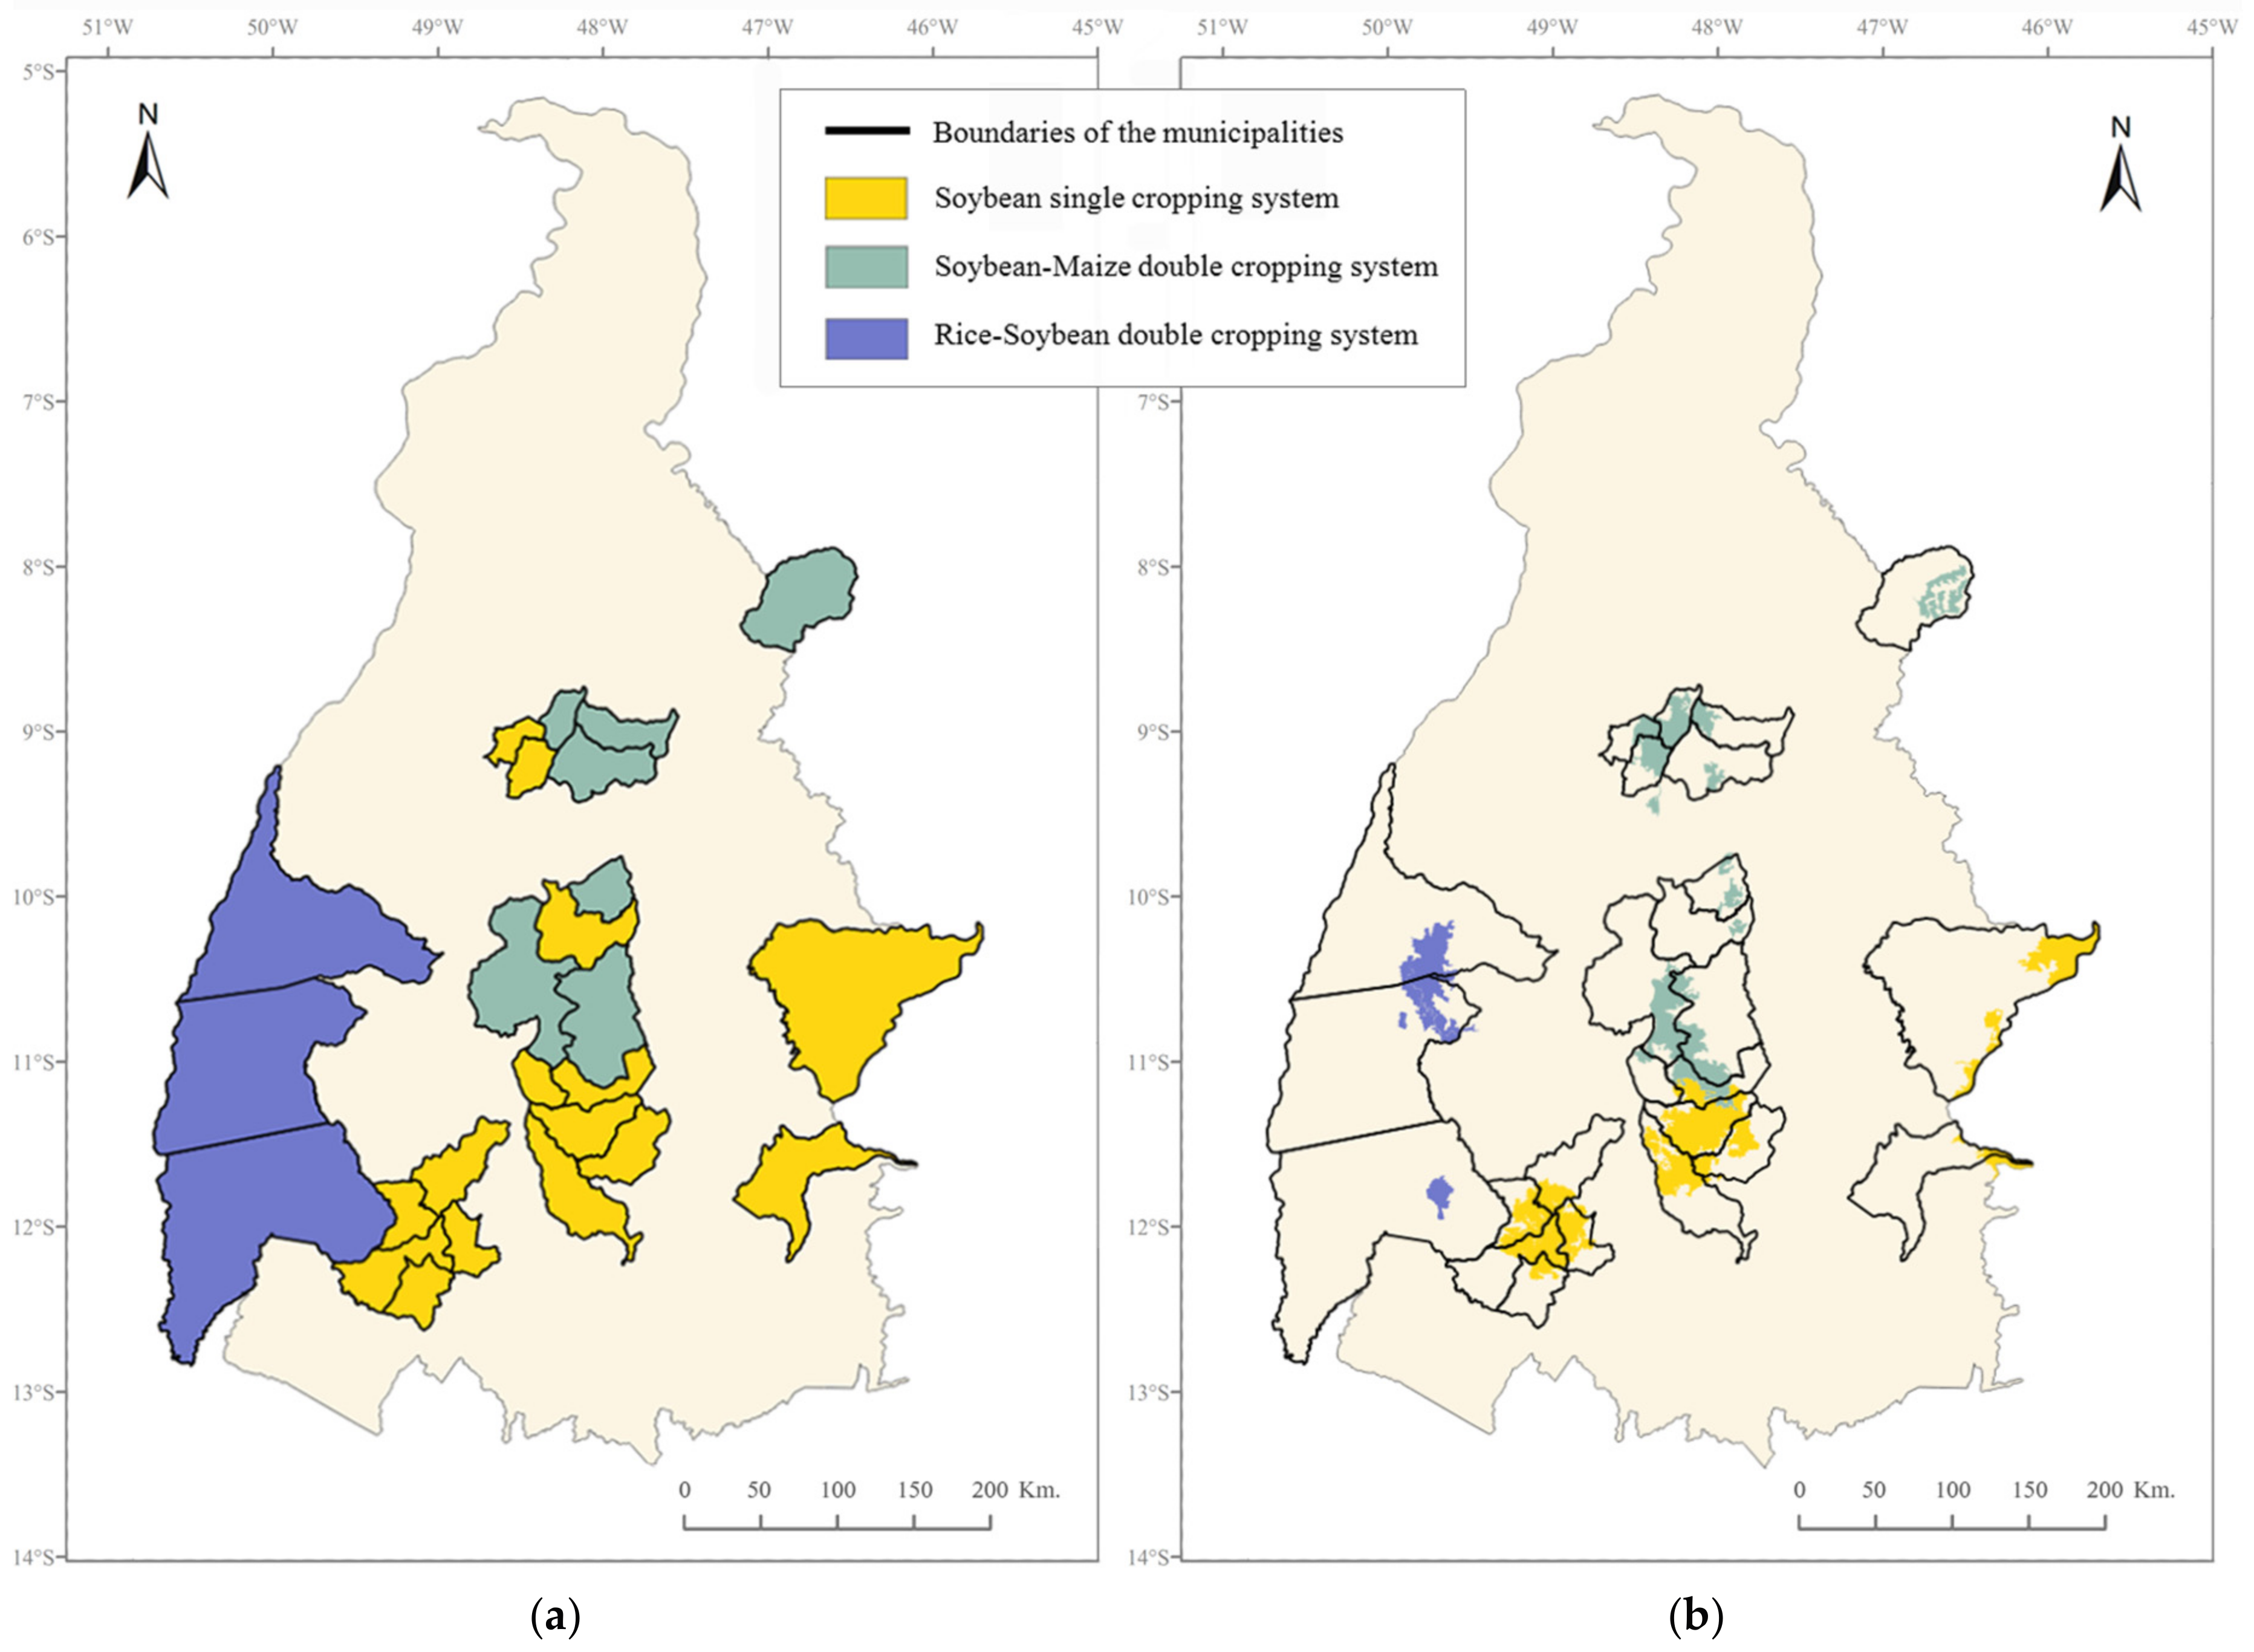
The resulting classification of the municipalities is represented on a map together with the classification of the cropping systems in the ALUS remote sensing-based map (Figure 10).
Although the reference map and the ALUS map are produced at different scales, an apparent coherence between both maps can be recognized for the spatial distribution of the soybean single cropping system and the rice–soybean double cropping system (Figure 10). The spatial distribution of the soybean–maize double cropping system shows general coherence between both maps but seems overestimated locally for some regions, covering some municipalities which are classified as being dominated by the soybean single cropping system in the reference map.

5. Discussion

The study area was partitioned into relatively homogeneous land units that were linked to a specific type of agricultural land use, resulting in a regional level agricultural land-use systems’ map. Two livestock systems could be differentiated by the proportion of pasture and rangelands in the land units, and the three main cropping systems of the study area could be differentiated through the proportion of annual cropland in the land units and through their specific phenological patterns (Figure 7); this allowed not only to characterize the land units in terms of the crop type but also in terms of the cropping pattern.
The results showed a general agreement between the location of the three main cropping systems in the final agricultural land-use systems map and the reference map, except for some localized overestimations of the presence of the soybean–maize double cropping system over some of the reference soybean single cropping system municipalities. This overestimation might be due to the non-inclusion of the non-commercial summer grass cover crops such as millet, sorghum, or brachiaria in the agricultural statistics and, therefore, in the reference map. Cover crops are sometimes sown after the winter soybean harvest instead of maize, as part of the widely adopted no-tillage system in the study area. These cover crops might contribute to the second peak of NDVI that is apparent in the NDVI temporal profiles of the land units, which partially intersect municipalities where only the soybean surface area has been officially censused.
The reference map that was used for the evaluation of the classification results shows that land-use systems’ maps can be produced from the agricultural statistics. However, the thematic resolution of this type of map is limited by the data available in the statistics, thus not accounting for certain systems (e.g., the livestock systems). Furthermore, the spatial accuracy is greatly limited by the data aggregation level (e.g., the municipal level)—the administrative boundaries not being representative of the actual spatial distribution of the land-use systems. The presented remote sensing approach produces a land-use systems’ map which overcomes these limitations, by automatically delineating boundaries which are representative of the actual physical differences between zones related to the temporal variations of the vegetation cover.
While the ability of principal components analysis to uncover significant intra-annual change events out of vegetation index time series has been widely proven (e.g., [25,26,27,28,29,30]), studies mainly focus on the low-order principal component (PC) images—generally the first three—which capture most of the variance. We decided to include the higher-order PC images in our analysis, since they are highly sensitive to subtle changes in the data and therefore capture change events which are localized both spatially and in time, such as the intra-seasonal variations and rapid changes induced by the agricultural practices. Overall, the results confirm that the high-order PC images do capture the information related to the temporal variability of the vegetation cover, which was the essential portion of information of the NDVI time series (represented by 27% of the total variance in the time series) needed for the segmentation of the study site in land units with relatively homogeneous phenological patterns. Furthermore, the phenological patterns shown in Figure 7 reflected the intra-seasonal variations which were linked to cropping practices such as the approximate planting and harvesting dates of different crops.
The automatic extraction of relatively homogeneous land units in terms of phenological patterns, through a principal components analysis and an automatic segmentation, is a simple and innovative approach that can be reproduced in other regions. This approach overcomes the potential error propagation of the expert-based land units’ border delineation and the subjective choice and use of variables in the traditional land-use systems’ mapping approaches. Furthermore, the presented approach is scale-independent and therefore allows multi-scale analysis, which might help improve the understanding of the land-use systems by characterizing them at different organizational levels.
In addition, the decision tree ruleset used for the classification of four major agricultural land-use systems (presented in the Figure 5—adapted from Almeida, et al. [35]), is conceived with simple threshold rules based on the percentage cover of agricultural land, which can be easily adapted or directly applied, to other agricultural regions. This classification is, however, dependent on a land-cover map. Even if land-cover maps are now produced and available for many regions, their accuracy will condition the agricultural land-use systems’ classification results, and they may be rarely updated. Consequently, the rule-based classification step would largely benefit from the inclusion of an automatic remote sensing-based classification method to produce timely and accurate regional-scale agricultural land-cover maps at the field level. Some studies have shown that partitioning the study region into sub-regions improves the accuracy of regional-scale land-cover classifications [36,37]. Hence, the presented land units’ extraction approach could therefore also be used as a preliminary step for automatic remote sensing-based classifications, producing regional-scale land-cover and land-use maps at the field level.

6. Conclusions

Remote sensing-derived time series of NDVI represent an important source of spectral and temporal information related to agricultural land use and, when combined with GEOBIA techniques in the present study, allowed the discrimination of different land-use systems (in particular, cropping systems) at a regional scale. Remote sensing-based approaches, therefore, present a significant potential for agricultural land-use system mapping over large areas and benefit from the spatial and temporal continuity of the satellite data and technological advances such as the new high temporal and spatial resolution Sentinel-2 satellite systems of the Copernicus program.
The presented approach can be potentially reproduced in other regions with minimal adaptation to specific context, thus contributing to the development of generic and simple tools for the location and characterization of the agricultural land-use systems across regions. This baseline-detailed spatial information is highly valuable for further large-scale agronomic and environmental assessments. If reproduced periodically, this type of approach can help with long-term analysis of the dynamics of the major agricultural land-use systems, which can help monitor large-scale land-use change processes such as cropland expansion or intensification (being particularly useful in changing regions such as the MATOPIBA region, for effective land-use planning leading to sustainable use of the resources).
Acknowledgments

Beatriz Bellón received a fellowship from CIRAD (French Agricultural Research Centre for International Development) and from the FP7 SIGMA (Stimulating Innovation for Global Monitoring of Agriculture) project. This work was also supported by the French Space Agency (CNES) through the funding of the TOSCA AGRIZONE project and by the CAPES/COFECUB program through the funding of the GeoABC Project (Methodologies and technological innovation for satellite monitoring of low carbon agriculture in support to Brazil’s ABC Plan), project No. 845/15. The authors would like to gratefully acknowledge the members of the NTSA (Thematic Unit on Agricultural Systems) of EMBRAPA (Brazilian Agricultural Research Corporation) Fisheries and Aquaculture for their valuable contribution to this work.

Author Contributions

Beatriz Bellón, Agnès Bégué and Danny Lo Seen conceived and designed the experiments; Beatriz Bellón processed the data and performed the proposed methods; Beatriz Bellón, Agnès Bégué and Danny Lo Seen analyzed the results; Beatriz Bellón wrote the paper; and Agnès Bégué, Danny Lo Seen, Claudio Aparecido De Almeida and Margareth Simões supervised the research and contributed to the editing and review of the paper.

Conflicts of Interest

The authors declare no conflict of interest.

References

  1. FAO. How to feed the world in 2050. In Proceedings of the Expert Meeting on How to Feed the World in 2050, Rome, Italy, 24–26 June 2009. [Google Scholar]
  2. Nachtergaele, F.; Petri, M. Mapping Land Use Systems at Global and Regional Scales for Land Degradation Assessment Analysis; FAO: Rome, Italy, 2013. [Google Scholar]
  3. Bégué, A.; Arvor, D.; Lelong, C.; Vintrou, E.; Simoes, M. Agricultural systems studies using remote sensing. In Land Resources Monitoring, Modeling, and Mapping with Remote Sensing; CRC Press: Boca Raton, FL, USA, 2015; pp. 113–130. [Google Scholar]
  4. Driessen, P.M.; Konijn, N.T. Land-Use Systems Analysis; Wageningen Agricultural University: Wageningen, The Netherlands, 1992. [Google Scholar]
  5. FAO. Guidelines for Land-Use Planning; FAO: Rome, Italy, 1993. [Google Scholar]
  6. Arvor, D.; Jonathan, M.; Meirelles, M.S.P.; Dubreuil, V.; Durieux, L. Classification of MODIS EVI time series for crop mapping in the state of Mato Grosso, Brazil. Int. J. Remote Sens. 2011, 32, 7847–7871. [Google Scholar] [CrossRef]
  7. Cheema, M.J.M.; Bastiaanssen, W.G.M. Land use and land cover classification in the irrigated Indus Basin using growth phenology information from satellite data to support water management analysis. Agr. Water Manag. 2010, 97, 1541–1552. [Google Scholar] [CrossRef]
  8. Kiptala, J.K.; Mohamed, Y.; Mul, M.L.; Cheema, M.J.M.; Van Der Zaag, P. Land use and land cover classification using phenological variability from MODIS vegetation in the Upper Pangani River Basin, Eastern Africa. Phys. Chem. Earth 2013, 66, 112–122. [Google Scholar] [CrossRef]
  9. Wardlow, B.D.; Egbert, S.L. Large-area crop mapping using time-series MODIS 250m NDVI data: An assessment for the U.S. Central Great Plains. Remote Sens. Environ. 2008, 112, 1096–1116. [Google Scholar] [CrossRef]
  10. Hay, G.J.; Castilla, G. Geographic Object-Based Image Analysis (GEOBIA): A new name for a new discipline. In Object-Based Image Analysis; Blaschke, T., Lang, S., Hay, G.J., Eds.; Springer: Berlin/Heidelberg, Germany, 2008; pp. 75–89. [Google Scholar]
  11. Bisquert, M.; Bégué, A.; Deshayes, M. Object-based delineation of homogeneous landscape units at regional scale based on MODIS time series. Int. J. Appl. Earth Obs. 2015, 37, 72–82. [Google Scholar] [CrossRef]
  12. Bisquert, M.; Bégué, A.; Deshayes, M.; Ducrot, D. Environmental evaluation of MODIS-derived land units. GIsci. Remote Sens. 2016, 54, 64–77. [Google Scholar] [CrossRef]
  13. Silva, L.A.G.C. Biomas Presentes no Estado do Tocantins; Consultoria Legislativa da Câmara dos Deputados: Brasília, Brazil, 2007. [Google Scholar]
  14. CONAB. Soja: Série Histórica de Produtividade (Safras 2000/01 a 2015/16). Available online: http://www.conab.gov.br/ (accessed on 15 April 2017).
  15. Almeida, C.A.; Coutinho, A.C.; Esquerdo, J.C.D.M.; Adami, M.; Venturieri, A.; Diniz, C.G.; Dessay, N.; Durieux, L.; Gomes, A.R. High spatial resolution land use and land cover mapping of the Brazilian Legal Amazon in 2008 using Landsat-5/TM and MODIS data. Acta Amaz. 2016, 46, 291–302. [Google Scholar] [CrossRef]
  16. INPE. Projeto Terraclass Cerrado: Mapeamento do uso e Cobertura Vegetal do Cerrado. Available online: http://www.dpi.inpe.br/tccerrado/ (accessed on 22 March 2017).
  17. INPE. Projeto Terraclass Amazônia: Mapeamento do uso e Cobertura da Terra na Amazônia Legal Brasileira. Available online: http://www.inpe.br/cra/projetos_pesquisas/dados_terraclass.php (accessed on 22 March 2017).
  18. IBGE, Instituto Brasileiro de Geografia e Estatística. Produção Agrícola Municipal (PAM) 2014. Available online: http://www.ibge.gov.br/home/estatistica/economia/pam/2014/ (accessed on 15 April 2017).
  19. Huete, A.; Didan, K.; Miura, T.; Rodriguez, E.P.; Gao, X.; Ferreira, L.G. Overview of the radiometric and biophysical performance of the MODIS vegetation indices. Remote Sens. Environ. 2002, 83, 195–213. [Google Scholar] [CrossRef]
  20. Soudani, K.; le Maire, G.; Dufrêne, E.; François, C.; Delpierre, N.; Ulrich, E.; Cecchini, S. Evaluation of the onset of green-up in temperate deciduous broadleaf forests derived from Moderate Resolution Imaging Spectroradiometer (MODIS) data. Remote Sens. Environ. 2008, 112, 2643–2655. [Google Scholar] [CrossRef]
  21. Busetto, L.; Ranghetti, L. MODIStsp: An R Package for Preprocessing of MODIS Time Series. R Package Version 1.3.2. 2017. Available online: https://cran.rstudio.com/web/packages/MODIStsp/index.html (accessed on 15 April 2017).
  22. Solano, R.; Didan, K.; Jacobson, A.; Huete, A. MODIS Vegetation Index User’s Guide (MOD13 Series); Vegetation Index and Phenology Lab, University of Arizona: Tucson, AZ, USA, 2010. [Google Scholar]
  23. Chen, J.; Jönsson, P.; Tamura, M.; Gu, Z.; Matsushita, B.; Eklundh, L. A simple method for reconstructing a high-quality NDVI time-series data set based on the Savitzky–Golay filter. Remote Sens. Environ. 2004, 91, 332–344. [Google Scholar] [CrossRef]
  24. Savitzky, A.; Golay, M.J.E. Smoothing and differentiation of data by simplified least squares procedures. Anal. Chem. 1964, 36, 1627–1639. [Google Scholar] [CrossRef]
  25. Eastman, J.R.; Fulk, M. Long sequence time series evaluation using standardized principal components. Photogramm. Eng. Remote Sens. 1993, 59, 991–996. [Google Scholar]
  26. Gurgel, H.C.; Ferreira, N.J. Annual and interannual variability of NDVI in Brazil and its connections with climate. Int. J. Remote Sens. 2003, 24, 3595–3609. [Google Scholar] [CrossRef]
  27. Hall-Beyer, M. Comparison of single-year and multiyear NDVI time series principal components in cold temperate biomes. IEEE Trans. Geosci. Remote Sens. 2003, 41, 2568–2574. [Google Scholar] [CrossRef]
  28. Hirosawa, Y.; Marsh, S.E.; Kliman, D.H. Application of standardized principal component analysis of land-cover characterization using multitemporal AVHRR data. Remote Sens. Environ. 1996, 58, 267–281. [Google Scholar] [CrossRef]
  29. Wang, T.; Kou, X.; Xiong, Y.; Mou, P.; Wu, J.; Ge, J. Temporal and spatial patterns of NDVI and their relationship to precipitation in the Loess Plateau of China. Int. J. Remote Sens. 2010, 31, 1943–1958. [Google Scholar] [CrossRef]
  30. Young, S.S.; Anyamba, A. Comparison of NOAA/NASA PAL and NOAA GVI data for vegetation change studies over China. Photogramm. Eng. Remote Sens. 1999, 65, 679–696. [Google Scholar]
  31. Leutner, B.; Horning, N. Rstoolbox: Tools for Remote Sensing Data Analysis. R Package Version 0.1.8. 2017. Available online: https://cran.r-project.org/web/packages/RStoolbox/index.html (accessed on 15 April 2017).
  32. Trimble. Ecognition Developer© 9.0 User Guide; Trimble Germany GmbH: Munich, Germany, 2014. [Google Scholar]
  33. Baatz, M.; Schäpe, A. Multiresolution segmentation: An Optimization Approach for High Quality Multi-Scale Image Segmentation. In Angewandte Geographische Informations-Verarbeitung, XII; Wichmann Verlag: Karlsruhe, Germany, 2000; pp. 12–23. [Google Scholar]
  34. Benz, U.C.; Hofmann, P.; Willhauck, G.; Lingenfelder, I.; Heynen, M. Multi-resolution, object-oriented fuzzy analysis of remote sensing data for GIS-ready information. ISPRS J. Photogramm. 2004, 58, 239–258. [Google Scholar] [CrossRef]
  35. Almeida, C.A.; Mourão, M.; Dessay, N.; Lacques, A.-E.; Monteiro, A.; Durieux, L.; Venturieri, A.; Seyler, F. Typologies and spatialization of agricultural production systems in Rondônia, Brazil: Linking land use, socioeconomics and territorial configuration. Land 2016, 5, 18. [Google Scholar] [CrossRef]
  36. Cai, H.; Zhang, S.; Bu, K.; Yang, J.; Chang, L. Integrating geographical data and phenological characteristics derived from MODIS data for improving land cover mapping. J. Geogr. Sci. 2011, 21, 705–718. [Google Scholar] [CrossRef]
  37. Cano, E.; Denux, J.-P.; Bisquert, M.; Hubert-Moy, L.; Chéret, V. Improved forest-cover mapping based on MODIS time series and landscape stratification. Int. J. Remote Sens. 2017, 38, 1865–1888. [Google Scholar] [CrossRef]
Figure 1. The study area corresponds to the Tocantins state (TO, red-striped), located in the center-north of Brazil, which is part of the MATOPIBA region (color-coded orange). This region is the latest agricultural frontier of Brazil, composed of parts of the states of Maranhão (MA), Piauí (PI), Bahia (BA), and the full extent of Tocantins.
Remotesensing 09 00600 g001
Figure 2. Agricultural land-cover map extracted from the combination of the TerraClass Amazônia 2014 map (covering the North East of the State of Tocantins) and the TerraClass Cerrado 2013 map (covering the rest of the State of Tocantins) [16,17].
Remotesensing 09 00600 g002
Figure 3. Representation of the methodological framework used in this study.
Remotesensing 09 00600 g003
Figure 4. Sample Normalized Difference Vegetation Index (NDVI) time series profile of (a) the raw data; (b) the filtered and smoothed data; and (c) the final temporally-corrected data.
Remotesensing 09 00600 g004
Figure 5. Decision tree ruleset used for the classification of the land units into four major agricultural land-use systems adapted from Almeida et al. [35].
Remotesensing 09 00600 g005
Figure 6. Land units’ boundaries over a color composition of the first three principal component (PC) images (RGB PC2, PC3, PC4) of the 22 PC images used as the segmentation variables.
Remotesensing 09 00600 g006
Figure 7. The temporal NDVI profiles’ plots of the 22 crop agriculture domain land units. The plots show the mean (solid black curve) and the standard deviation (shaded dark grey curve) of the NDVI pixel values inside the annual agriculture TerraClass class for each land unit against the day of the year (DOY). A representative land-unit profile for each of the three phenological pattern groups is shown in detail at the left and the profiles of the other land units belonging to each group are represented assembled at their right side. The “monthly” (32-day) periods (at which the NDVI profiles peak) are represented by shaded light grey vertical bands, and are consistent between the plots of each group.
Remotesensing 09 00600 g007
Figure 8. Map of the main agricultural land-use systems of the Tocantins state in the 2013–2014 growing season.
Remotesensing 09 00600 g008
Figure 9. The average proportion of the crops of the municipalities belonging to the first class (left), the second class (center), and the third class (right), related to the soybean single cropping system, to the soybean–maize double cropping system, and to the rice–soybean double cropping system, respectively.
Remotesensing 09 00600 g009
Figure 10. The spatial distribution of the three main cropping systems (a) in the reference map at the municipal level, extracted from the agricultural statistics, and (b) in the agricultural land-use systems remote sensing-based map. The boundaries of the municipalities are included in both maps to facilitate their comparison.
Remotesensing 09 00600 g010