
Suitability Assessment of Satellite-Derived Drought Indices for Mongolian Grassland


1
Key Laboratory of Digital Earth Science, Institute of Remote Sensing and Digital Earth(RADI), Chinese Academy of Sciences, Olympic Village Science Park, W. Beichen Road, Beijing 100101, China
2
National Remote Sensing Center, Information and Research Institute of Meteorology, Hydrology and Environment (IRIMHE), Ulaanbaatar 15160, Mongolia
*
Author to whom correspondence should be addressed.
Remote Sens. 2017, 9(7), 650; https://doi.org/10.3390/rs9070650
Submission received: 14 February 2017
/
Revised: 12 May 2017
/
Accepted: 5 June 2017
/
Published: 26 June 2017
(This article belongs to the Special Issue Earth Observations for a Better Future Earth)
Abstract
:In Mongolia, drought is a major natural disaster that can influence and devastate large regions, reduce livestock production, cause economic damage, and accelerate desertification in association with destructive human activities. The objective of this article is to determine the optimal satellite-derived drought indices for accurate and real-time expression of grassland drought in Mongolia. Firstly, an adaptability analysis was performed by comparing nine remote sensing-derived drought indices with reference indicators obtained from field observations using several methods (correlation, consistency percentage (CP), and time-space analysis). The reference information included environmental data, vegetation growth status, and region drought-affected (RDA) information at diverse scales (pixel, county, and region) for three types of land cover (forest steppe, steppe, and desert steppe). Second, a meteorological index (PED), a normalized biomass (NorBio) reference indicator, and the RDA-based drought CP method were adopted for describing Mongolian drought. Our results show that in forest steppe regions the normalized difference water index (NDWI) is most sensitive to NorBio (maximum correlation coefficient (MAX_R): up to 0.92) and RDA (maximum CP is 87%), and is most consistent with RDA spatial distribution. The vegetation health index (VHI) and temperature condition index (TCI) are most correlated with the PED index (MAX_R: 0.75) and soil moisture (MAX_R: 0.58), respectively. In steppe regions, the NDWI is most closely related to soil moisture (MAX_R: 0.69) and the VHI is most related to the PED (MAX_R: 0.76), NorBio (MCC: 0.95), and RDA data (maximum CP is 89%), exhibiting the most consistency with RDA spatial distribution. In desert steppe areas, the vegetation condition index (VCI) correlates best with NorBio (MAX_R: 0.92), soil moisture (MAX_R: 0.61), and RDA spatial distribution, while TCI correlates best with the PED (MAX_R: 0.75) and the RDA data (maximum CP is 79%). The VHI is a combination of constructed VCI and TCI, and can be used instead of them. Finally, the mode method was adopted to identify appropriate drought indices. The best two indices (VHI and NDWI) can be utilized to develop a combination drought model for accurately monitoring and quantifying drought in the future. Additionally, the new framework can be adopted to investigate and analyze the suitability of satellite-derived drought indices and determine the most appropriate index/indices for other countries or areas.
1. Introduction
Higher temperatures and lower rainfall amounts may result in drought, is a common weather phenomenon and costly natural hazard. Drought is a recurrent climate process that occurs in association with temporally and spatially uneven rainfall over broad areas and extended periods [1]. The regional temperatures of Southern Mongolia have increased by 0.1–3.7 °C over the past 60 years, spring precipitation has decreased by 17%, and summer precipitation has increased by 11% [2]. These changes in temperature and precipitation are likely to intensify the occurrence of drought, especially during the onset of vegetation green-up. Moreover, the frequency of drought in the spring and summer has been reported to increase as much as four times every five years in the Gobi region [3]. Drought has a disturbing effect not only on agricultural productivity and hydrological resources but also on natural vegetation; therefore, it may accelerate the desertification processes associated with destructive human activities (that is, overgrazing) in semi-arid grassland areas in Mongolia.
Many drought indices derived from remote sensing (RS-derived) data have been developed and used to effectively detect drought conditions all over the world. Because drought causes stress to vegetation, the extent of a drought can be reflected by changes in the vegetation index. The normalized difference vegetation index (NDVI) is the normalized difference between near-infrared (NIR) and red reflectance and is simple and effective and is now the most widely used index for detecting drought [4,5,6]. Many vegetation indices based on the NDVI have been proposed for diverse regions. To measure the impacts of weather and ecosystem components on vegetation and reduce their deviations, a vegetation condition index (VCI) was developed by Kogan [7]. Water stress in plants results in reduced chlorophyll absorption in the blue and red bands [8], so the blue band can be viewed as the band least sensitive to vegetation moisture variation. Zhang et al. [9] proposed the visible and shortwave infrared drought index (VSDI) by combining the blue, red, and SWIR optical spectral bands; this index is suitable for drought monitoring throughout the America growing season. Shortwave infrared reflectance (SWIR) is sensitive to leaf liquid water content, and a combination of NIR and SWIR data has been used to derive water-sensitive indices for monitoring drought occurrences. Based on NIR and SWIR, the normalized difference water index (NDWI) [10] is sensitive to changes in soil moisture that are strongly related to vegetation drought conditions in the grass and crop land of the Oklahoma Mesonet. Analysis has revealed that combining information from multiple near infrared and short-wave infrared channels into the normalized multi-band drought index (NMDI) [11] enhances its sensitivity to drought severity, a method that is suited to estimate both soil and vegetation moisture. Gu et al. [12] found that the NDWI responds more quickly to drought than the NDVI, and they then developed the drought indicator known as the normalized difference drought index (NDDI), which also has been adopted by Mongolia’s National Remote Sensing Center for monitoring grassland drought [13]. Land surface temperature (LST) derived from thermal radiance bands is a good indicator of the energy balance of the earth’s surface, because temperatures can rise quickly under water stress. Gutman [14] showed that thermal data might be useful for detecting inter-annual changes in surface moisture. Kogan [7] developed the temperature condition index (TCI), which is an initial indicator of water stress and drought.
A combination of different indices representing vegetation stress, water deficit, and soil moisture status can describe the severity of and changes in drought better than each index in isolation. Previously, Carlson [15] constructed the vegetation supply water index (VSWI) using the NDVI and LST to assess summer drought, because the ratio of LST to NDVI is shown to increase during drought. VSWI describes the soil moisture changes in agricultural land well and is a rapid and cost-effective method for monitoring drought conditions [16]. Sandholt et al. [17] found that the scatter of LST and NDVI data occupies a triangular space, the NDVI–LST spectral space, and that an index based on this relationship (the temperature vegetation dryness index, TVDI) can be used to better monitor regional drought. A similar indicator, the vegetation temperature condition index (VTCI), was applied to drought monitoring by Wang et al. [18]. The VTCI had better performance than NDVI in classifying relative drought occurrence levels and in studying the distribution of drought occurrences. A typical drought indicator, the vegetation health index (VHI), was proposed by Kogan [7,19] and was based on the combination of vegetation greenness (VCI) and temperature (TCI) indices. AVHRR-based drought indices (VCI, TCI, and VHI) were also proposed by Kogan [19] for monitoring grass conditions in Mongolia; that study found that these indices coherently indicated intensive drought in poor grass.
Several researchers are currently monitoring drought conditions in Mongolian grassland using satellite-derived indices [1,19,20], and meaningful results have been obtained. As detailed above, other drought indices have performed well in other countries and climate zones. Which of them can best describe Mongolia’s drought conditions, for prevention and mitigation use by researchers, government departments, or stakeholders, remains unclear. Therefore, this paper’s objectives are as follows: (1) to adopt new reference indicators and comprehensive methods for evaluate Mongolian drought in several scales; (2) to build an integrated and novel adaptability analysis framework to determine the optimal satellite-derived drought indices for the accurate and real-time expression of grassland drought in Mongolia.
2. Study Region and Data
2.1. Study Region
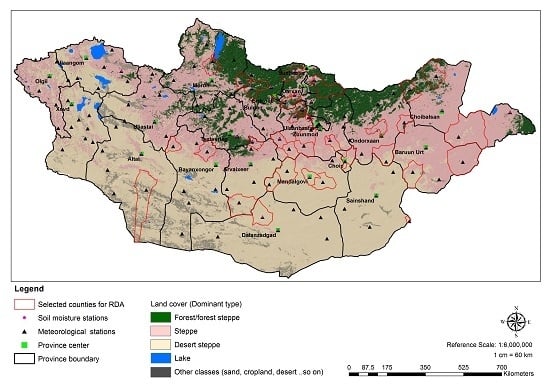
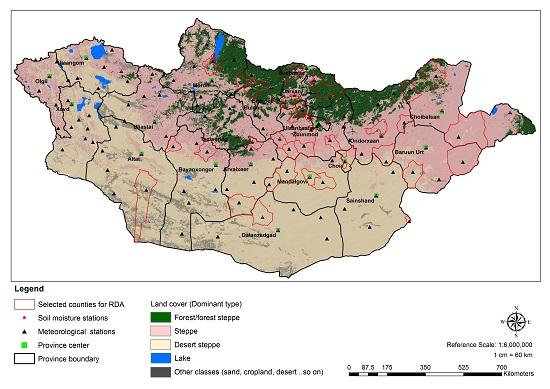
The study region covers grassland throughout Mongolia, located in the central part of the Asiatic continent between latitudes 41°35′N and 52°09′N and longitudes 87°44′E and 119°56′E. Mongolia has a total area of 1,565,000 km2, approximately 80% of which is covered by grass. The extensive grass and shrub steppe grazing lands have the capacity to support a large number of grazing herbivores [21], along with desert, desert steppe, steppe, and forest steppe zones (Figure 1). The national ecosystem is fragile, and Mongolia has one of the highest disaster risks worldwide. The frequency and magnitude of natural disasters (drought, dzud, and fire) are increasing because of global climate change. Mongolia is characterized by harsh weather, and precipitation is unequally distributed temporally and spatially. Approximately 80% of precipitation occurs in the three months of summer (June, July, and August) [22]. In northern Mongolia, precipitation levels reach 400 mm a year, whereas in the southern areas’ levels, which feature semi-arid and desert conditions, are less than 50 mm. Mongolia also experiences extreme daily and annual temperature fluctuations.
2.2. Data
2.2.1. Station Data
Automatic weather stations (AWSs) built by the Information and Research Institute of Meteorology, Hydrology, and Environment (IRIMHE) are distributed across Mongolia, and each AWS is equipped with instruments that measure micro-meteorological variables. Air temperature at two meters and rainfall data were obtained from 86 meteorological stations covering Mongolia’s grassland. The average air temperature and accumulated precipitation values were calculated every 10 days from 2000 to 2014. Biomass (the total aboveground biomass) was collected in small plots (1 × 1 m [23], in three repeated samplings) at each meteorological station. Plant samples were heated to above 100 °C and oven dried at 80 °C until they reached a constant weight in the laboratory. The final dry weight of each sample was divided by the sampling area and the result was converted to kg/ha. Soil moisture was measured using an earth-boring auger (EBA) at 39 meteorological stations once each 10-day period from 2000 to 2011. The EBA equipment was used to collect soil samples at different depths (for example, 5 cm and 10 cm), those samples were placed into an iron box. Soil moisture content was calculated based on the difference in weight between fresh soil and dried soil. The distribution of the observation stations is illustrated in Figure 1.
Meteorological station data must be pre-processed and checked. Verification and temporal stability analyses were performed for the standard data. The data were checked using the range of values, and if data were missing, or their validity could not be determined, they were then excluded from the validation.
2.2.2. Region Drought-Affected Data
To select the optimal drought indices for Mongolia, the conventional field drought assessment data were referred to as the drought-affected region data (RDA data, also referred to as summer condition data by some researchers). RDA value are obtained at IRIMHE every 10-day period according to an evaluation of the vegetation conditions of the growing season of Mongolia based on plant growth, growth stage, and grassland productivity. Also every 10 days, meteorological observers ask local herders and environmental officers about summer conditions. After that they will get assessment values by summary evaluation from the community in the county center. For each county, there is one RDA value. Appraisal RDA values from the IRIMHE range from 1 to 6: 1 = extreme drought, 2 = serious drought, 3 = moderate drought, 4 = slight drought, 5 = no drought (normal conditions), and 6 = good conditions.
2.2.3. RS Data
Daily level 1B clear sky data from the Moderate Resolution Imaging Spectroradiometer (MODIS) were derived from the MODIS sensor aboard the TERRA satellite, which views entire earth’s surface in one to two days and was launched in December 1999. These data (MOD02 and MOD03, at 1 km resolution) were downloaded from the Atmosphere Archive and Distribution System (LAADS) of the National Aeronautics and Space Administration’s (NASA) website. The downloaded data covered all of Mongolia from 2000 to 2015 (from May to September). Data projection and resampling were conducted with the MRTSWATH tool (downloaded from the MODIS site). Next, cloud mask, atmospheric correction, NDVI, and LST retrievals were performed through our own codes, developed based on existing literature. Reflectance or thermal radiance bands of these data were calculated by internal calibration parameters and functions. Bands 1–3, 5, 6, 20, 22, 26, 27, 31, and 35 were used for cloud detection with reflectance and brightness temperature thresholds [24]. Aerosol optical depth was retrieved using the dark dense vegetation (DDV) method [25]; then atmospheric corrections were performed based on the 6S model [26]. The NDVI was calculated using reflectivity data based on MODIS bands 1 and 2 after atmospheric correction. The surface albedo was computed from a linear combination of the first seven reflectance bands. Using radiance data based on MODIS bands 31 and 32, and after atmospheric correction, daytime LST were calculated via the split-window algorithm [27].
2.2.4. Base Data
Land cover data was used to divide the study area into three steppe regions: forest steppe, steppe, and desert steppe. Land cover data was obtained from Mongolia’s Land Cover Map 2010, produced by the Mongolian National Remote Sensing Center (NRSC) [28]. The original land cover data included 19 types, which was combined into five types. Administrative data at the province and county levels were obtained from the IRIMHE.
Table 1 describes all data types, including satellite-derived data (1 km resolution MODIS1B data) which were used to calculate the drought indices, including meteorological station observation data (such as soil moisture, biomass, precipitation, and air temperature) and RDA, which were used in our adaptability analysis and for validation of the drought indices. Other auxiliary data were land cover and administrative boundaries.
3. Methodology
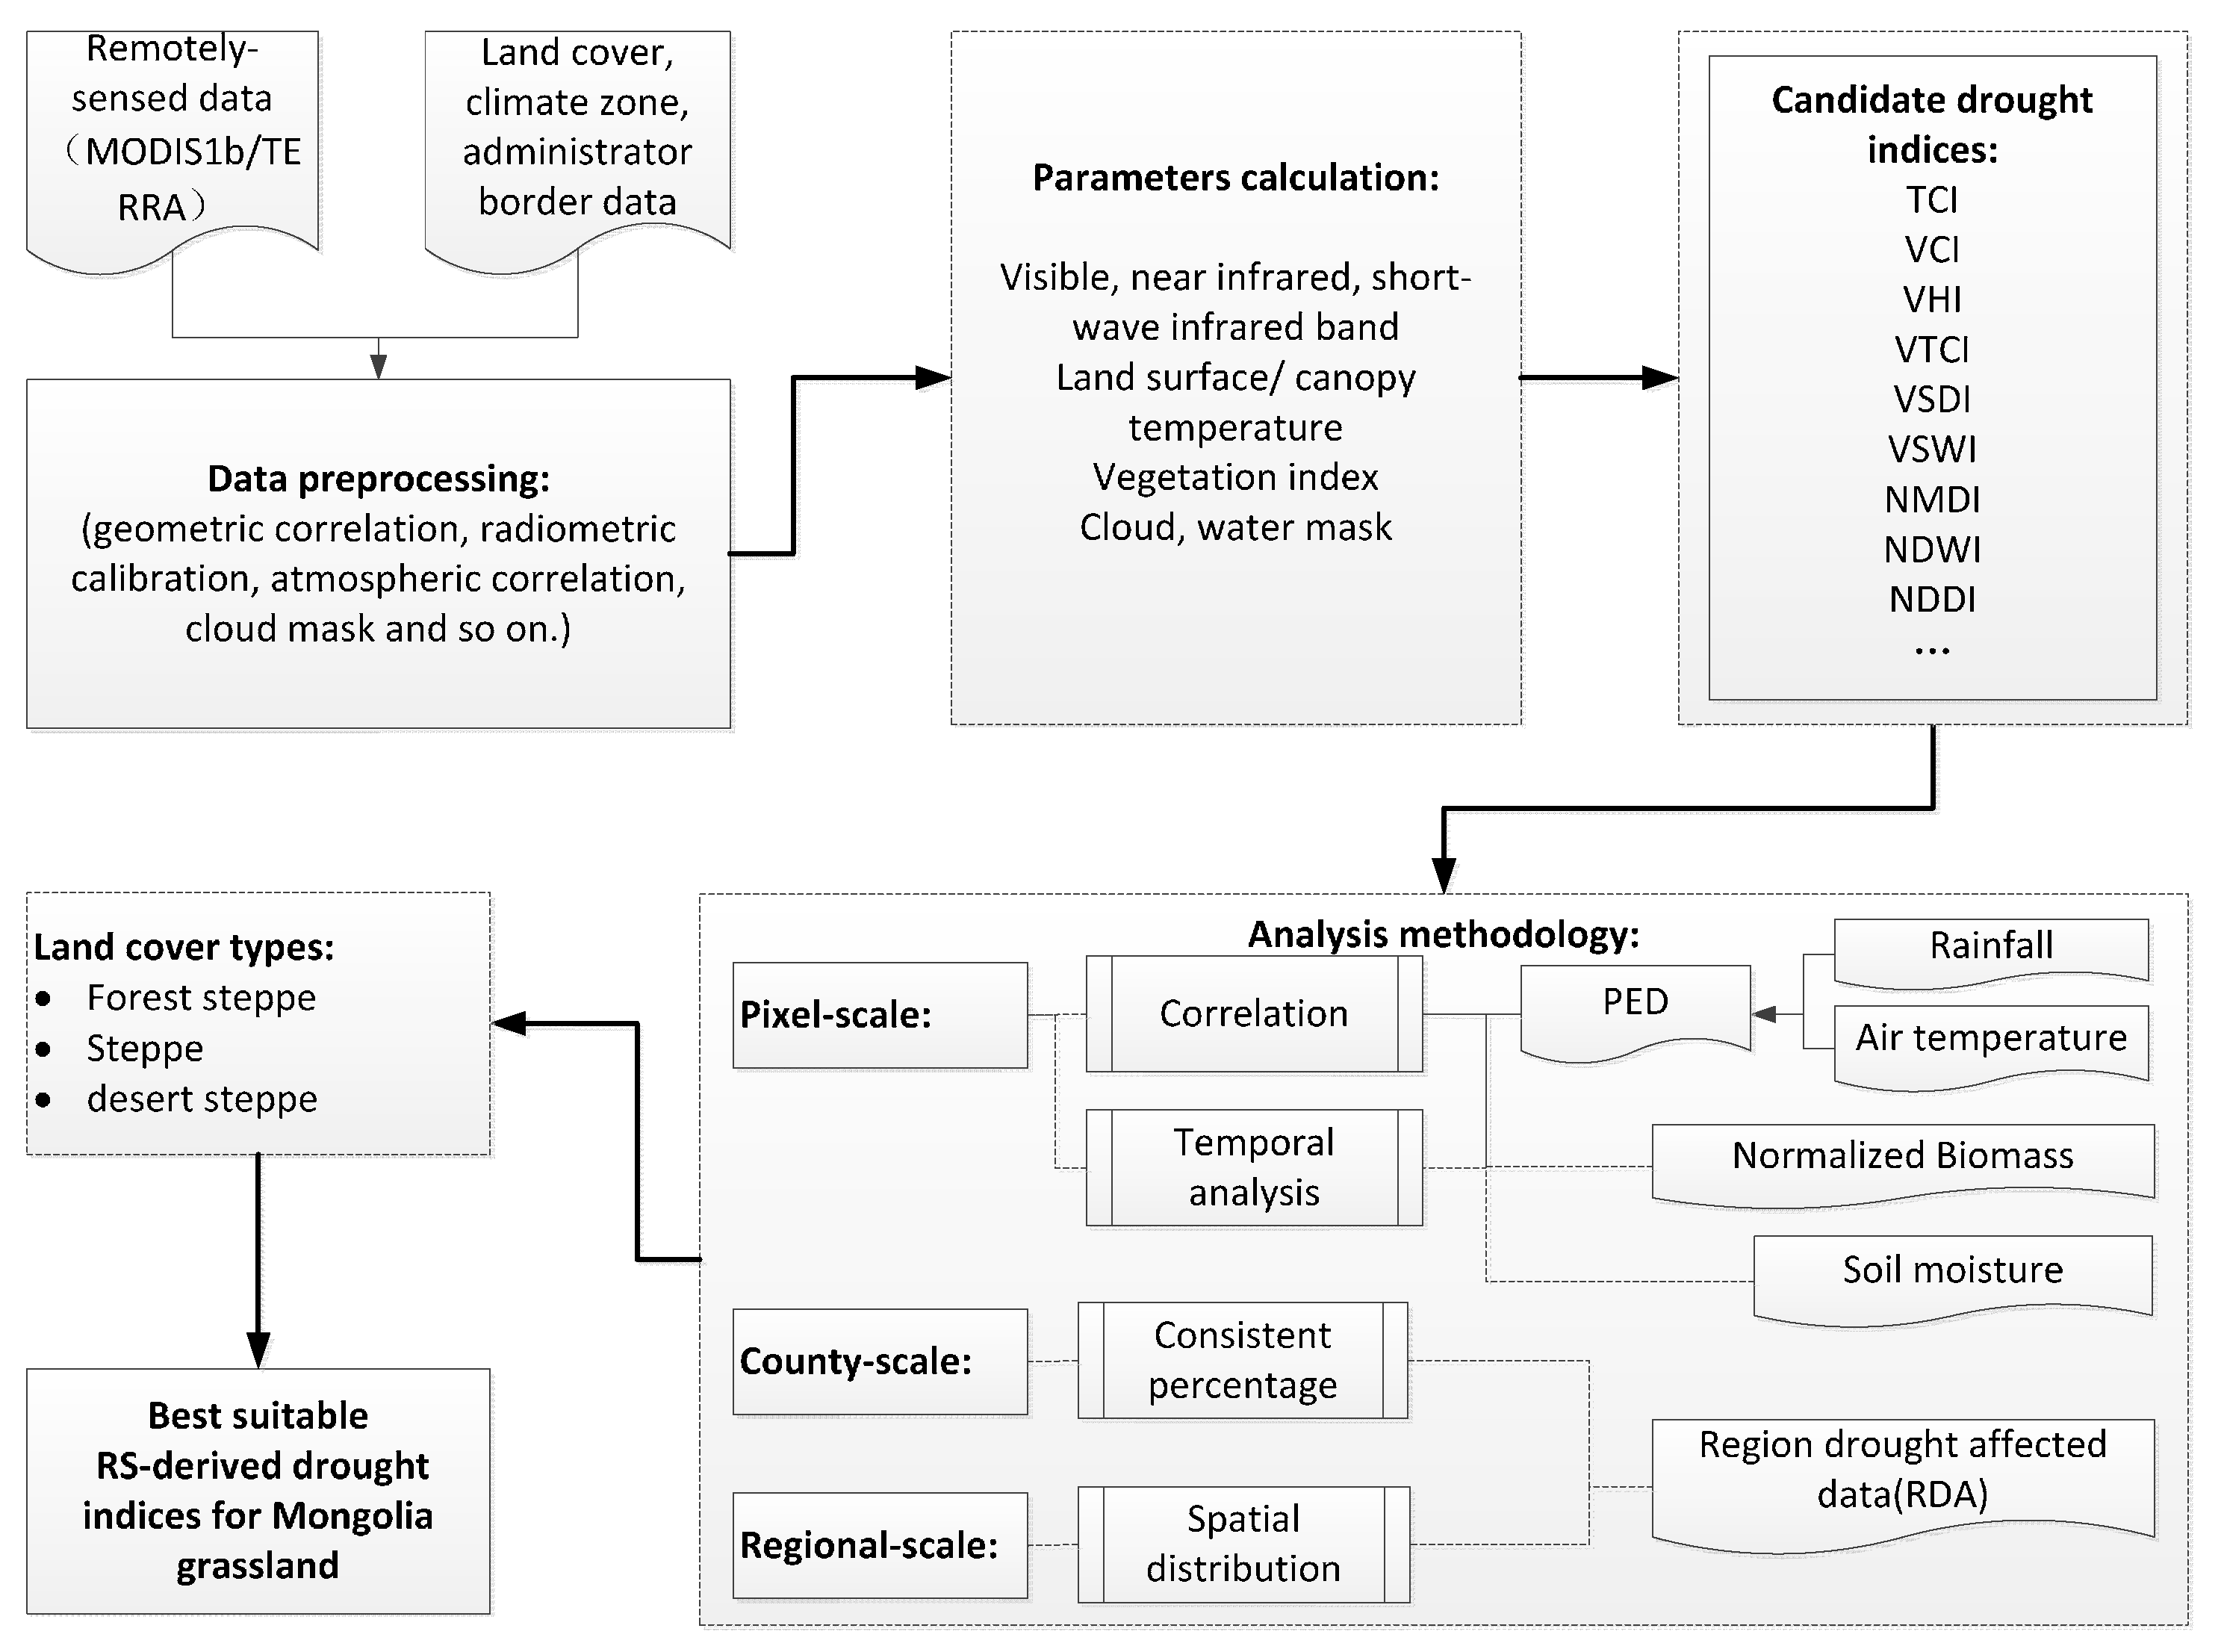
For Mongolian grassland, it is important to determine the most suitable and stable index based purely on RS data in different steppe types. Visible, NIR, and SWIR bands and land surface temperature-derived thermal infrared data were used for drought monitoring and determination of the optimal index in Mongolia. Feasible satellite-derived indices based on climate, drought characteristics, and other information on the conditions in Mongolia were considered during the fact-finding stage. Moreover, universality, comparability, and practicability for operational use needed to be considered when selecting the index. Most important is the analysis described in our introduction: VCI, TCI, VHI, and NDDI have been used in Mongolia, NDWI is sensitive to drought change in America, NMDI and VSDI enhance measurement of drought severity by introducing short wave infrared and blue channels, and VSWI and VTCI generated using NDVI and LST may reflect water and vegetation stress well. Therefore, in assessing the arid to semi-arid natural zones of Mongolia, the following nine indices derived from MODIS satellite data were selected for testing and determination of optimal indices: TCI, VCI, VHI, NDWI, NDDI, VSWI, VTCI, VSDI, and NMDI. These nine candidate indices for detailed analysis and investigation of their suitability for different natural zones were calculated for the growing seasons of 2000–2014. The process of the proposed method is summarized in Figure 2.
3.1. Satellite-Derived Indices
MODIS 1B data between June and August during 2000–2014 were pre-processed as described in Section 2.2.3. Data for the blue, red, NIR, and SWIR bands, as well as the NDVI and LST of each day were produced and retrieved. Any remaining cloud-contaminated pixels were removed. Next, the daily band data, NDVI data, and LST data were combined into a 10-day average, NDVI, and LST. Nine indices (TCI, VCI, VHI, NDWI, NDDI, VSWI, VTCI, VSDI, and NMDI) were selected and calculated according to the formulas listed in Table 2.
3.1.1. Pixel Levels
RS-derived drought indices can be calculated using the above equations in Table 2 at the pixel scale, based on drought classification criteria in each formula from the literature cited as shown in Table 2. The pixel value range of RS-derived drought indices was converted into numeric values from 1–5: 1 = extreme, 2 = severe, 3 = moderate, 4 = slight drought, and 5 = normal. RS-derived pixel values were used for correlation and temporal analysis with field data from selected stations. These pixel values can also be used for producing drought severity category (DSC).
3.1.2. County Level
The percentages of drought acreage (PDA) is calculated by dividing the drought area by the total grass area in each county using the RS-derived data. Then, based on a similar method described in Reference [29], we developed the drought severity level (DSL) indicator using the RS-derived drought indices and the following formula to represent drought severity in every county as follows
where is the output of DSL in a county, and and are the PDAs of extreme, severe, moderate, and slight drought rankings, respectively, from the RS-derived drought indices.
To ensure that the satellite-derived drought statistics indicator () is compatible with the RDA data, was classified into a drought severity category () indicator in accordance with the Mongolia local experiential rule: DSC = 1 when DSL ≥ 0.2, DSC = 2 when 0.1 ≤ DSL < 0.2, DSC = 3 when 0.05 ≤ DSL < 0.1, DSC = 4 when 0 < DSL < 0.05, and DSC = 5 when DSL = 0. The DSC range is 1–5: 1 = extreme, 2 = severe, 3 = moderate, 4 = slight drought, and 5 = normal.
3.2. Ground Data-Derived Indices
3.2.1. Station Level
Ped [30] originally established the PED index to detect the long-term intensity of meteorological drought using corresponding environmental parameters, including air temperature and precipitation, which were monitored at stations over a long period.
The PED drought index was used to determine temperature anomalies and precipitation deficits, and it reflects the effects of these two combined parameters on drought. Mongolia experiences particularly extreme annual temperature fluctuations in response to global climate change, and high temperatures may cause water stress and drought [31]. According to the records of 48 meteorological stations distributed over the territory of Mongolia, the annual mean temperature of Mongolia increased by 2.14 °C during the last 70 years, and the number of hot days in the summer season is increasing [32]. In addition, the PED is very effective at monitoring drought in Russia [30] and the Bulgarian low regions [33]; therefore, the PED meteorological index was used in this paper.
Drought had a substantial influence on maximum measured aboveground biomass production [34,35]. Since absolute biomass data had shortcomings of spatial and temporal comparability, we developed a normalized biomass (NorBio) for the assessment of grassland drought along similar lines to the development of the VCI equation as a normalized calculation using long-term data. Station biomass data was correlated with the eight RS-derived drought indices. NorBio can be calculated by using the equation
where is the normalized biomass for period i and station n, is the biomass for period i and station n in a certain year, is the multi-year maximum biomass for period i and station n, and is the multi-year minimum biomass for period i and station n.
Soil moisture is a good indicator of drought caused by water reduction, and changes in soil moisture can reflect drought change trends. High correlations have been observed between RS-derived drought indices and soil moisture at different depths [36]. The correlation between soil moisture based on ground measurements and RS-derived drought indices was used to evaluate drought severity and validate the accuracy of the RS-derived drought indices.
3.2.2. County Level
The RDA is considered as qualified assessment for consequences that include are values intended to measure consequences of drought, including vegetation growth rate, vegetation damage, and vegetation adequacy for feeding livestock. RDA data are field-derived regional, manual, and experiential observations based on plant growth, growth stage, and grassland productivity information, and provide a very suitable and exact description of drought severity. Here we recommended this reference data for evaluating the drought results of satellite-based data in county scale.
Meanwhile, for compatibility with RS-derived values, we combined the RDA values of 5 and 6 into the single value, which gave the average of 5 (which means no drought). In addition, RDA data was used for constructing a consistence percentage (CP) indicator for consistent evaluation of county-based drought based on field-derived and RS-derived values.
3.3. Suitability Analysis
An evaluation was performed to assess the quality of the data derived from the model [37]. The index accuracy was then assessed over a widely distributed set of locations and long time periods via ground-truth data. However, for the drought indices, obtaining real drought values in a field campaign is difficult; thus, we assessed drought using other reference data. Normally, soil moisture was correlated with agricultural or vegetation drought [34]. Soil moisture in the field can reflect crop or vegetation drought, which also represent an effective method of evaluating grassland drought. Vegetation affected by drought experiences a sharp decrease in biomass; therefore, the field-based biomass index (NorBio) data is an effective method of assessing grassland drought. Field-based RDA are regional data from drought-affected areas and can directly describe the drought status in a region. Because grass drought is related to meteorological conditions and caused by extreme weather [7], the meteorological index (PED) is recommended in this paper.
For correlation analyses at the pixel scale, the consistent and spatial distribution comparisons of drought results were analyzed to identify the most suitable and accurate drought indices for different land cover types to accurately describe drought occurrence and severity in Mongolia.
3.3.1. Correlation
When regional ground-truth data values are difficult to obtain or cannot be collected, in situ point data are important for evaluating RS-derived drought indices.
Pearson’s correlation coefficient (R) usually indicates the correlation between two variables as
where is the correlation coefficient, and are variables, and are the mean values of the variables, and n is the number of samples.
3.3.2. Consistence Percentage
Field drought distribution and statistical data such as county-level RDA can be easily obtained, and represent important drought evaluation information. At the county scale, CP reflects goodness of fit between field-based RDA and drought severity categories determined using satellite-derived drought indices. Higher CP values indicate greater consistency: 100% indicates that the same drought severity was obtained from the RS and field data.
Next, CP was used to describe the relationship between field-derived vegetation conditions and RS-derived drought indicators in three land cover types. CP can be calculated by RDA data and DSC via the equation
For each unit, CN is the number of consistent drought severity rankings between and , and TN is the number of RDA drought severity rankings.
3.3.3. Spatial Analysis
If regional-scale data can be obtained from field measurements, the spatial distribution of drought based on field observation data and RS-derived drought indices can be analyzed and used to validate the drought indices. An ideal result corresponds to regional true-field data in the form of raster data with a certain resolution. In practice, however, the available data are obtained from different data sources and present various spatial attributes, extents, and resolutions. For this study, field drought distribution maps based on field-derived RDA were created and compared to RS-derived drought index maps to evaluate the spatial distribution differences and temporal change consistencies between them. The inverse distance weighted (IDW) method was used by IRIMHE to convert the in situ RDA into a 1 km raster format in order to create field drought spatial distribution maps [38]. The distribution maps of RS-derived drought indices were produced using ArcGIS 10.0 software and were used to determine whether these indices and RDA data exhibit consistent spatial distributions and temporal fluctuations.
4. Results
4.1. Comparisons with the PED
Eighty-six meteorological stations in Mongolian grassland areas were available from 2000 to 2014, and data from these stations was used for analysis and validation. The land cover of these stations can be divided into three types: forest steppe (18), steppe (41), and desert steppe (27). The effects of meteorological variations on vegetation were observed, and lags in vegetation response (drought or normal growth) were identified. Therefore, we calculated the one-month PED using data from the current 10-day and last two 10-day periods. Long-term analyses of PED meteorological index were performed on the grass-growing periods (June–August) from 2000 to 2014.
The NDDI, NMDI, VSWI, and PED indices are positively correlated, whereas the other six indices are negatively correlated (refer to these equations in Table 1). The correlations between the satellite-based drought indices and the PED are shown in Table 3, which shows maximum, minimum, average, and standard deviation values of the correlation coefficients (MAX_R, MIN_R, AVE_R, and STDE_R) for all stations. The results indicate that VHI, TCI, and VSWI were highly correlated with satellite-based drought indices throughout the growing period in the steppe zone, with an average correlation of more than 0.52 at the 99% confidence level (this confidence level also applies to the following). The VHI had the highest average correlation (0.66) with a maximum value of 0.76. VHI and TCI exhibited the highest correlation values for forest steppe and desert steppe areas; the MAX_R of VHI was 0.75 (VHI and TCI averages were 0.61 and 0.56, respectively). The results indicate that VHI, TCI, and VSWI are significantly correlated with PED for the three steppe types, and that correlation between VHI and PED is higher than between TCI and VSWI. Additionally, STDE_R for the three land cover zones varied from 0.07 to 0.24. In forest steppe zones, TCI exhibited the lowest STDE_R, and there was less variability figure across stations. TCI is a stable and reliable index for this zone. Similar results were produced for VHI in the steppe zone and TCI and NDWI in the desert steppe zone. NMDI had the largest STDE_R for all three steppe zones, which demonstrates that this index cannot accurately reflect drought in Mongolia as a whole.
Stations Erdenet, Erdenesant, and Saikhan were selected for the forest steppe, steppe, and desert steppe zones, respectively. Figure 3a–i are composed of time series plots based on nine RS-derived drought indices and the meteorological index (PED) from these three stations over the first 10 days of July from 2000 to 2014. The curves of the RS-derived drought indices were extracted using a 3 × 3 km window over the 86 meteorological stations. All nine RS-derived drought indices present obvious changes relative to the PED. The TCI, VCI, VHI, NDWI, VTCI, and VSDI are negatively correlated with the PED, whereas the NMDI, NDDI, and VSWI are positively correlated. Like the TCI, VCI, and VHI for Erdenet (forest steppe) exhibit less consistent changes than other indices. Moreover, the VSDI is not sensitive to the PED and shows a small value range. The Erdenet station is known to have experienced severe drought in the serious drought year of 2002. The lowest values in the time series occurred for the indices TCI, VCI, VHI, NDWI, VTCI, VSDI, and NMDI, and they corresponded to the largest PED values. The overall trend for the VHI, TCI, and VSWI curves are more consistent with the PED curve than for other curves for Erdenesant station (Figure 3d–f). The values of the VHI, VCI, TCI, and NDWI decrease rapidly with increases in the PED, and increase rapidly with decreases in the PED. In the desert steppe station (Saikhan), less vegetation resulted in lower sensitivity of the VCI and NDWI to drought. The VHI is obviously the best index for describing grassland drought, because it combines vegetation changes and temperature anomalies, and the PED also reflects water and thermal conditions. The highest correlation between the RS-derived drought indices and the PED is the VHI.
4.2. Comparisons with Soil Moisture
For this study, soil moisture observation data were obtained at depths of 5 cm and 10 cm for each 10 day period from 2000 to 2011 from 39 soil moisture sites (9 forest steppe sites, 23 steppe, and 7 desert steppe). We found that soil moisture at 10 cm was better associated with grass growth and drought conditions than that at 5 cm; therefore, the 10 cm depth soil moisture values were adopted for the analysis in this paper. To account for spatial consistency between soil moisture measurements and RS-derived drought indices, we selected the corresponding nearest pixel for each of the 39 soil moisture site locations and extracted each pixel’s value. Thus we created a dataset that included 39 pairs of site-based soil moisture and RS-derived drought index values for each drought index in every 10-day period.
The Rs were determined from satellite-derived drought indices and ground soil moisture data; the results indicate that the TCI, NDWI, and VHI have higher Rs. For each steppe type, the MAX_R, MIN_R, AVE_R, and STDE_R were produced by many stations. In the forest zone, TCI presented the largest maximum and average R, as can be seen in Table 4, though larger STDE_R values occurred elsewhere. The correlation between ground-observed soil moisture at 10 cm and the NDWI in the steppe zone was the highest of the indices (0.69, which was significant at p < 0.01), followed by the VHI (0.67). However, in the desert steppe zone, VHI featured the highest correlation coefficient (0.61) among the indices. Lower STDE_R and higher VHI averages in the desert steppe zone show that these values are stable across stations.
Point-derived data (such as soil moisture) only reflect information from a small region, while the drought extent determined by satellite data over large areas and long time periods are pixel values. Errors and uncertainties may occur in both data sets because of the difference in spatial scale.
4.3. Comparisons with the NorBio
To test the regional effectiveness of RS drought indices and determine the best index during the grass growing period for different land cover types (across 18 forest steppe stations, 41 steppe, and 27 desert steppe), we compared the RS drought indices with the NorBio index.
Generally, the grass-growing period in Mongolia is from May to September. In May, the grass is short. July and August are critical grass-growing periods, and grass biomass data is available from field observations. Therefore, we selected observed biomass data from late July for correlation analysis with the RS-derived drought indices. Using Formula (3), we calculated the NorBio values and constructed a correlation graph for July using the nine RS-derived drought indices and station-based biomass data observed over 15 years (2000–2014). For each steppe type, the maximum, average, minimum, and STDE_R correlation values were produced by many stations (seen in Table 5). The results show high R values for some indices, with maximum values up to and above 0.90. For the forest steppe areas, the NDWI, VHI, VCI, and VSWI have better correlations than the other indices, with AVE_R values of 0.70, 0.62, 0.64, and 0.59, respectively, and MAX_R values of 0.92, 0.87, 0.83, and 0.78, respectively. For the steppe regions, the VHI, NDWI, VCI, and VSWI have higher correlations with the ground-based NorBio values than the other indices, with averages of 0.60, 0.61, 0.57, and 0.59, respectively, and MAX_R values of 0.94, 0.95, 0.94, and 0.88, respectively. VCI, VSWI, VHI, and NDWI have AVE_R values of 0.67, 0.60, 0.59, and 0.48, respectively, and MAX_R values of 0.92, 0.83, 0.82, and 0.86, respectively, in the desert steppe areas. The NDWI coefficient varies greatly among the stations with high STDE_R values, with a MAX_R value of 0.86 and MIN_R value of 0.08. The signs of the VSDI and NMDI correlation coefficients vary: some stations have positive correlations, whereas others have negative correlations.
Figure 4a–i show the time series plots of nine RS-derived drought indices and the NorBio values at three stations (representing the three types of steppes) for the last 10-day period of July from 2000 to 2014. The dynamic trend of the NorBio is similar to that of the RS-derived drought indices throughout the studied period. The TCI, VCI, and VHI also showed fluctuation trends consistent with the NorBio. Generally, the TCI, VCI, VHI, NDWI, VSDI, and VTCI had positive relationships with the NorBio, and these values were also substantially lower in the severe drought year of 2002 than in a weak drought year (2003) for the three representative stations, except for the VCI at the Erdenet station (forest steppe, Figure 4a). The TCI, VCI, and VHI values increased more than the NDWI, VSDI, and VTCI values during the severe summer drought of 2003, which suggests that the former are more sensitive than the latter to drought conditions. The relationship between NMDI and NorBio was negative, although opposite results were observed in certain years, as shown in Figure 4b,e,h, indicating that this index is not suitable for detecting drought in Mongolia. When the NDDI was compared with the NorBio, the change trends in certain years (such as 2001, 2004, and 2012–2014 at the Erdenet station) were inconsistent; the VSWI and NorBio curves showed greater consistency.
4.4. Comparisons with the RDA in County
The RDA have a specific characterization area due to their nature as field observations, and are used to evaluate vegetation conditions at the county level. The DSC based on RS-derived drought indices represents drought status at the county scale. We adopted CPs (explained in Section 3.3.2) to describe the abilities of the RS-derived indices to monitor summer drought using RDA as field-derived reference data. We calculated the DSC, RDA, and CP for 37 counties and analyzed the results.
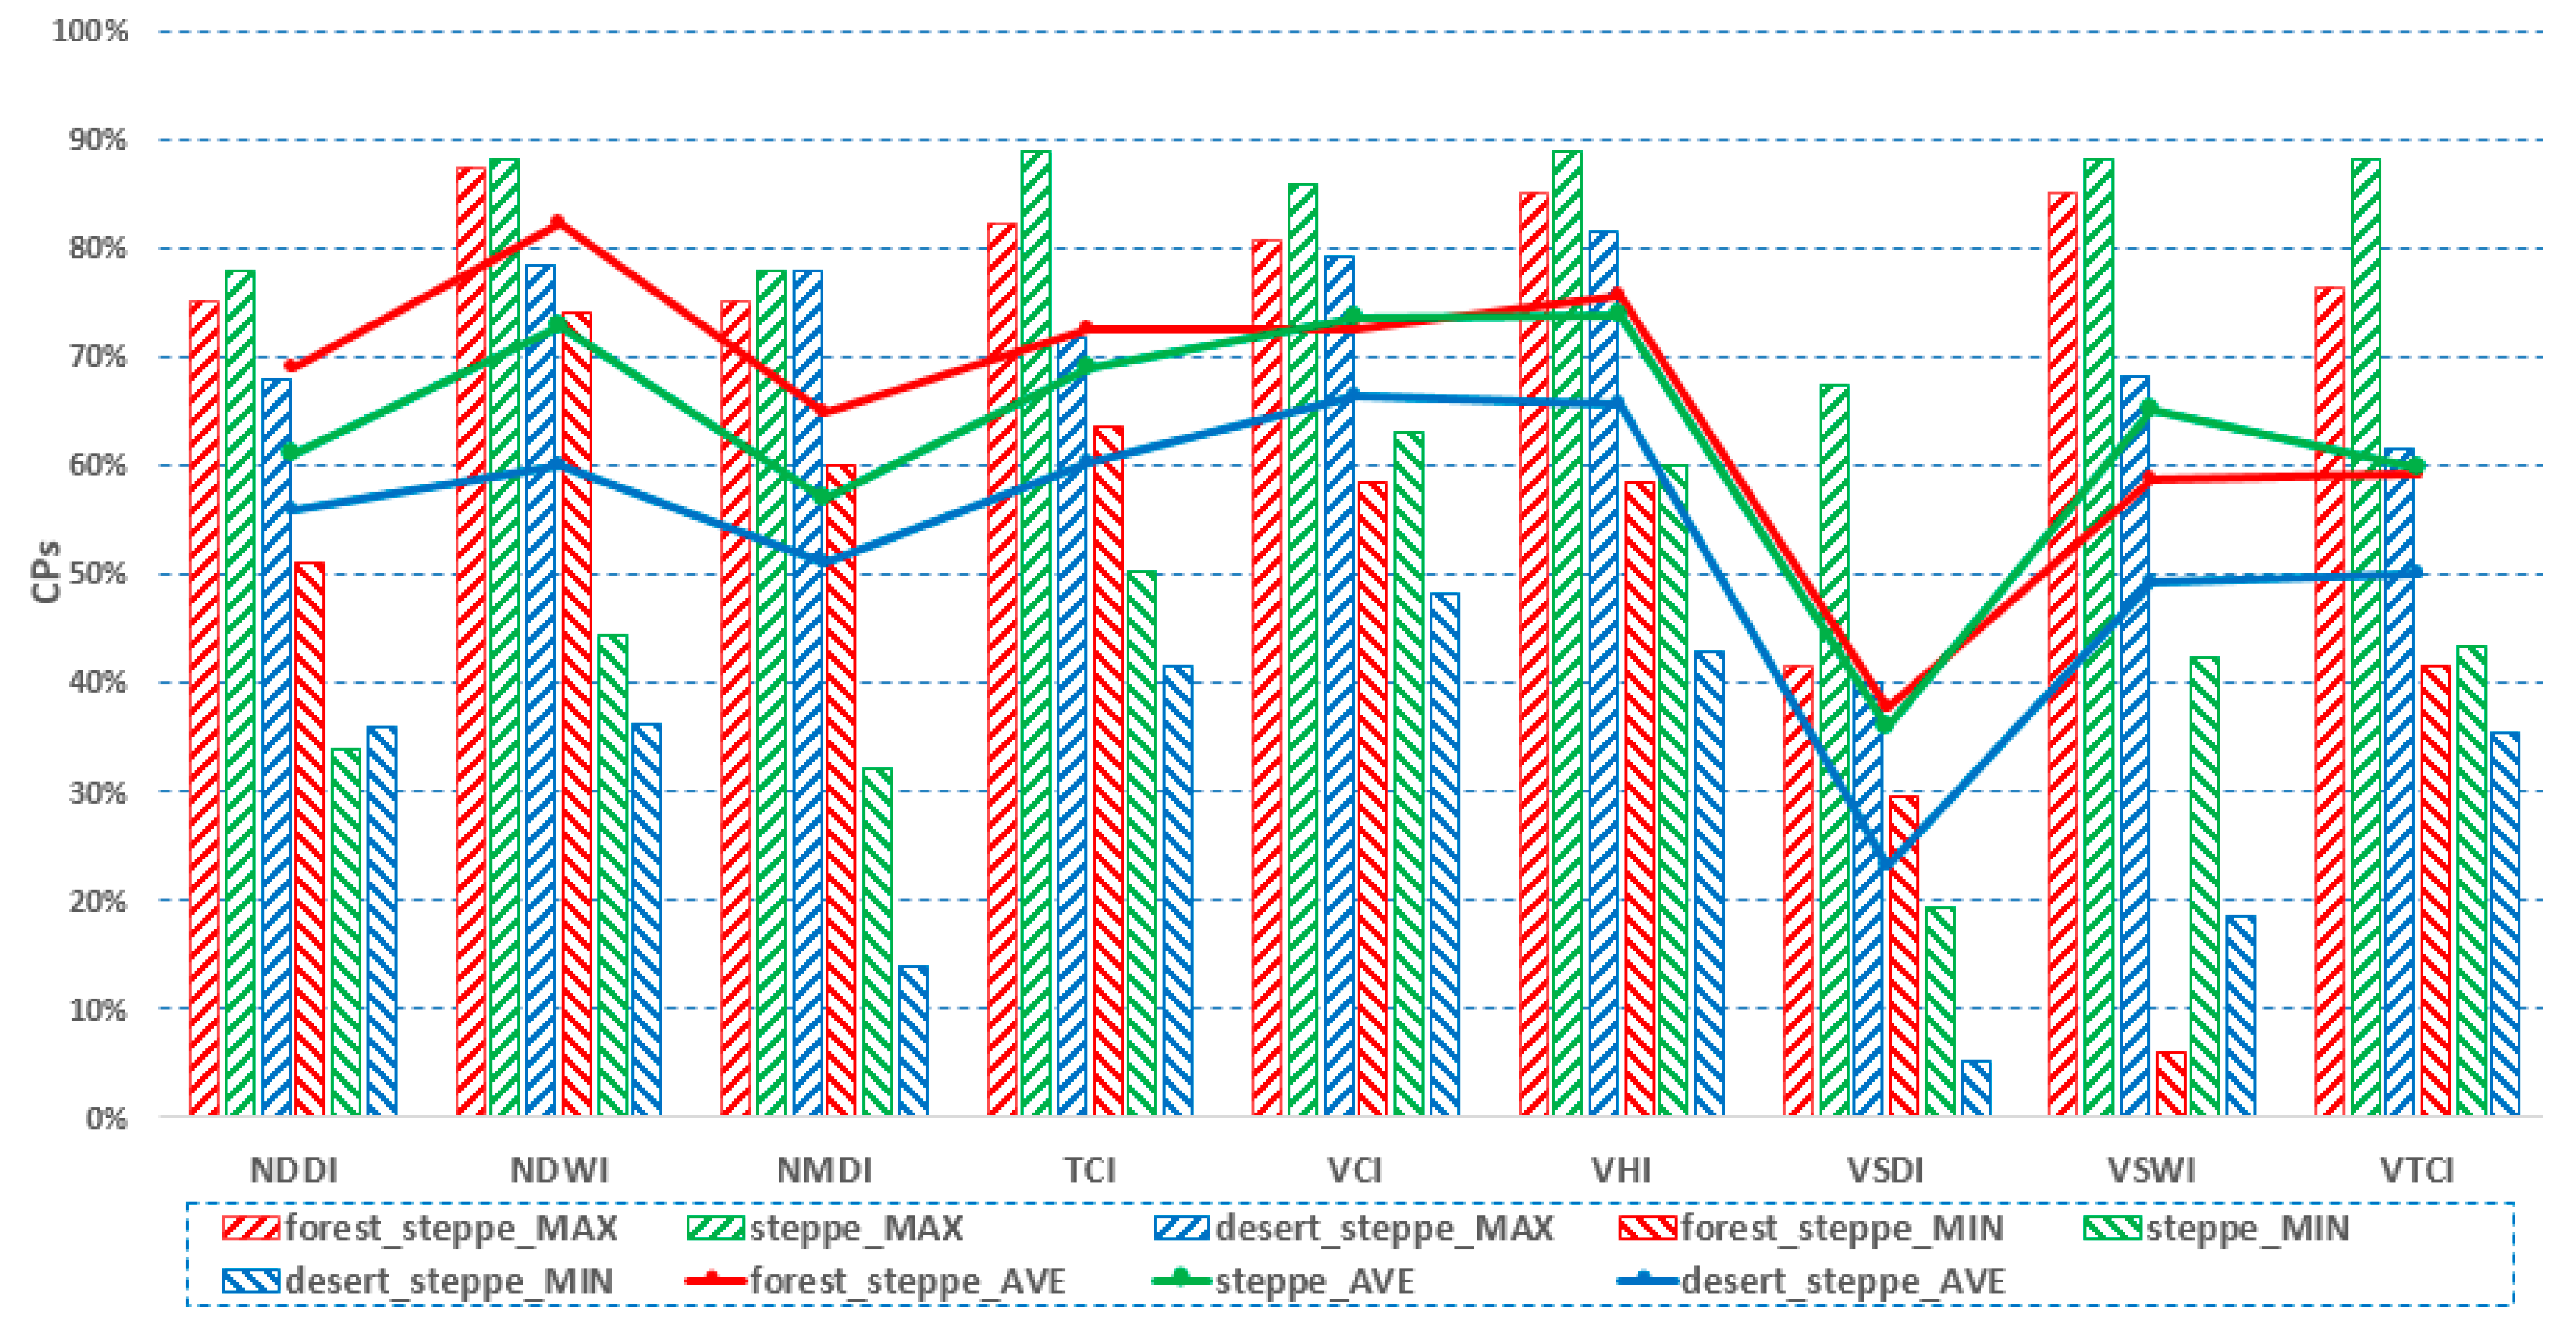
The CP values for the three land cover types are shown in Figure 5. The CPs of the VHI, VCI, TCI, and NDWI relative to the RDA were higher than those of the other indices. In the forest steppe regions, the highest average CP values were from the VHI, VCI, TCI, and NDWI at 74, 73, 73, and 71%, respectively. The maximum values for these indices were 84, 74, 81, and 87%, respectively. VHI, VCI, TCI, and NDWI predicted the same level of drought severity as RDA for approximately two-thirds of all 10-day intervals during summers from 2000 to 2014. For the steppe areas, the drought CPs between the VHI, VCI, and RDA were higher than those of the other indices, at 74%, although the average CP between the NDWI and the RDA was 73%. The maximum CP values for VHI, VCI, and NDWI were 89, 89, and 88%, respectively. The highest average drought CP (67%) was between VCI and RDA in the desert steppe zone (maximum value of 79%), and an average value of 66% was observed between VHI and RDA across all stations (maximum value of 81%).
These results show good consistencies between RS-derived drought indices and the field-derived RDA. The VCI, TCI, VHI, and NDWI are more sensitive to grassland drought and had stronger relationships with the RDA. These indices can accurately describe changes in drought in Mongolia at different temporal and spatial scales. In addition, the CP value for steppe is generally higher than for the other two land cover types, and the lowest CP is found in the desert steppe zone.
4.5. Spatial Consistence Comparsions
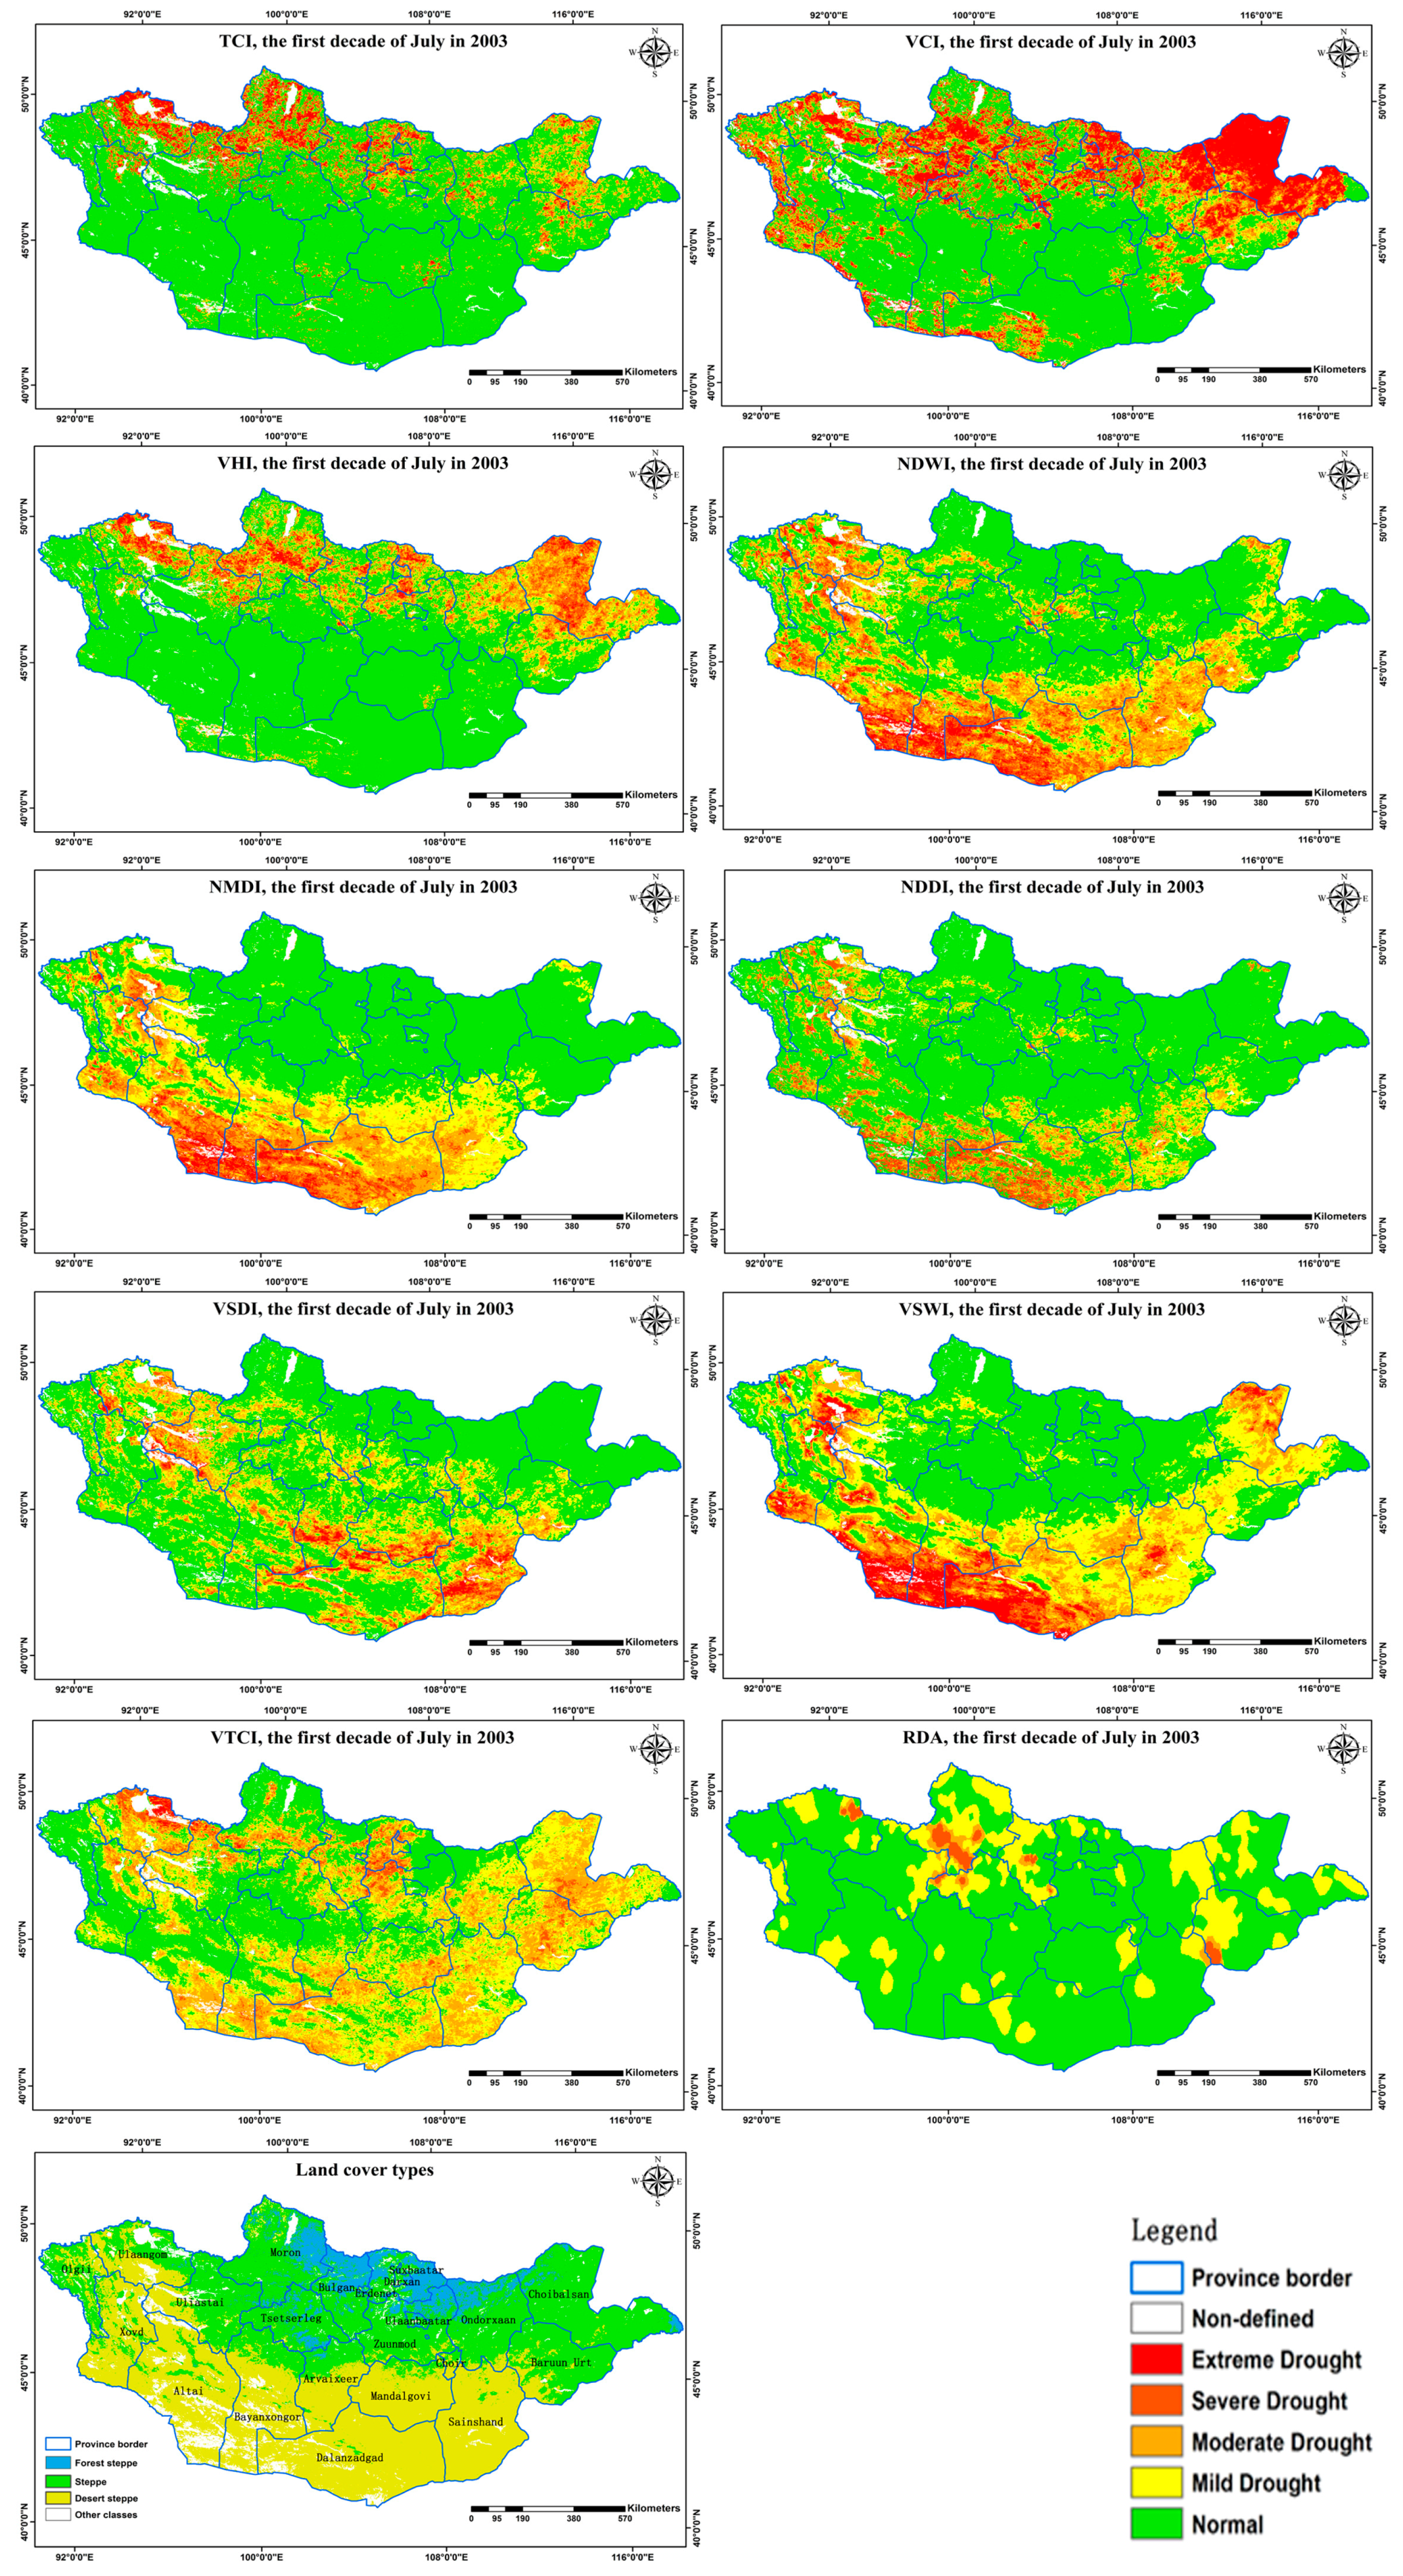
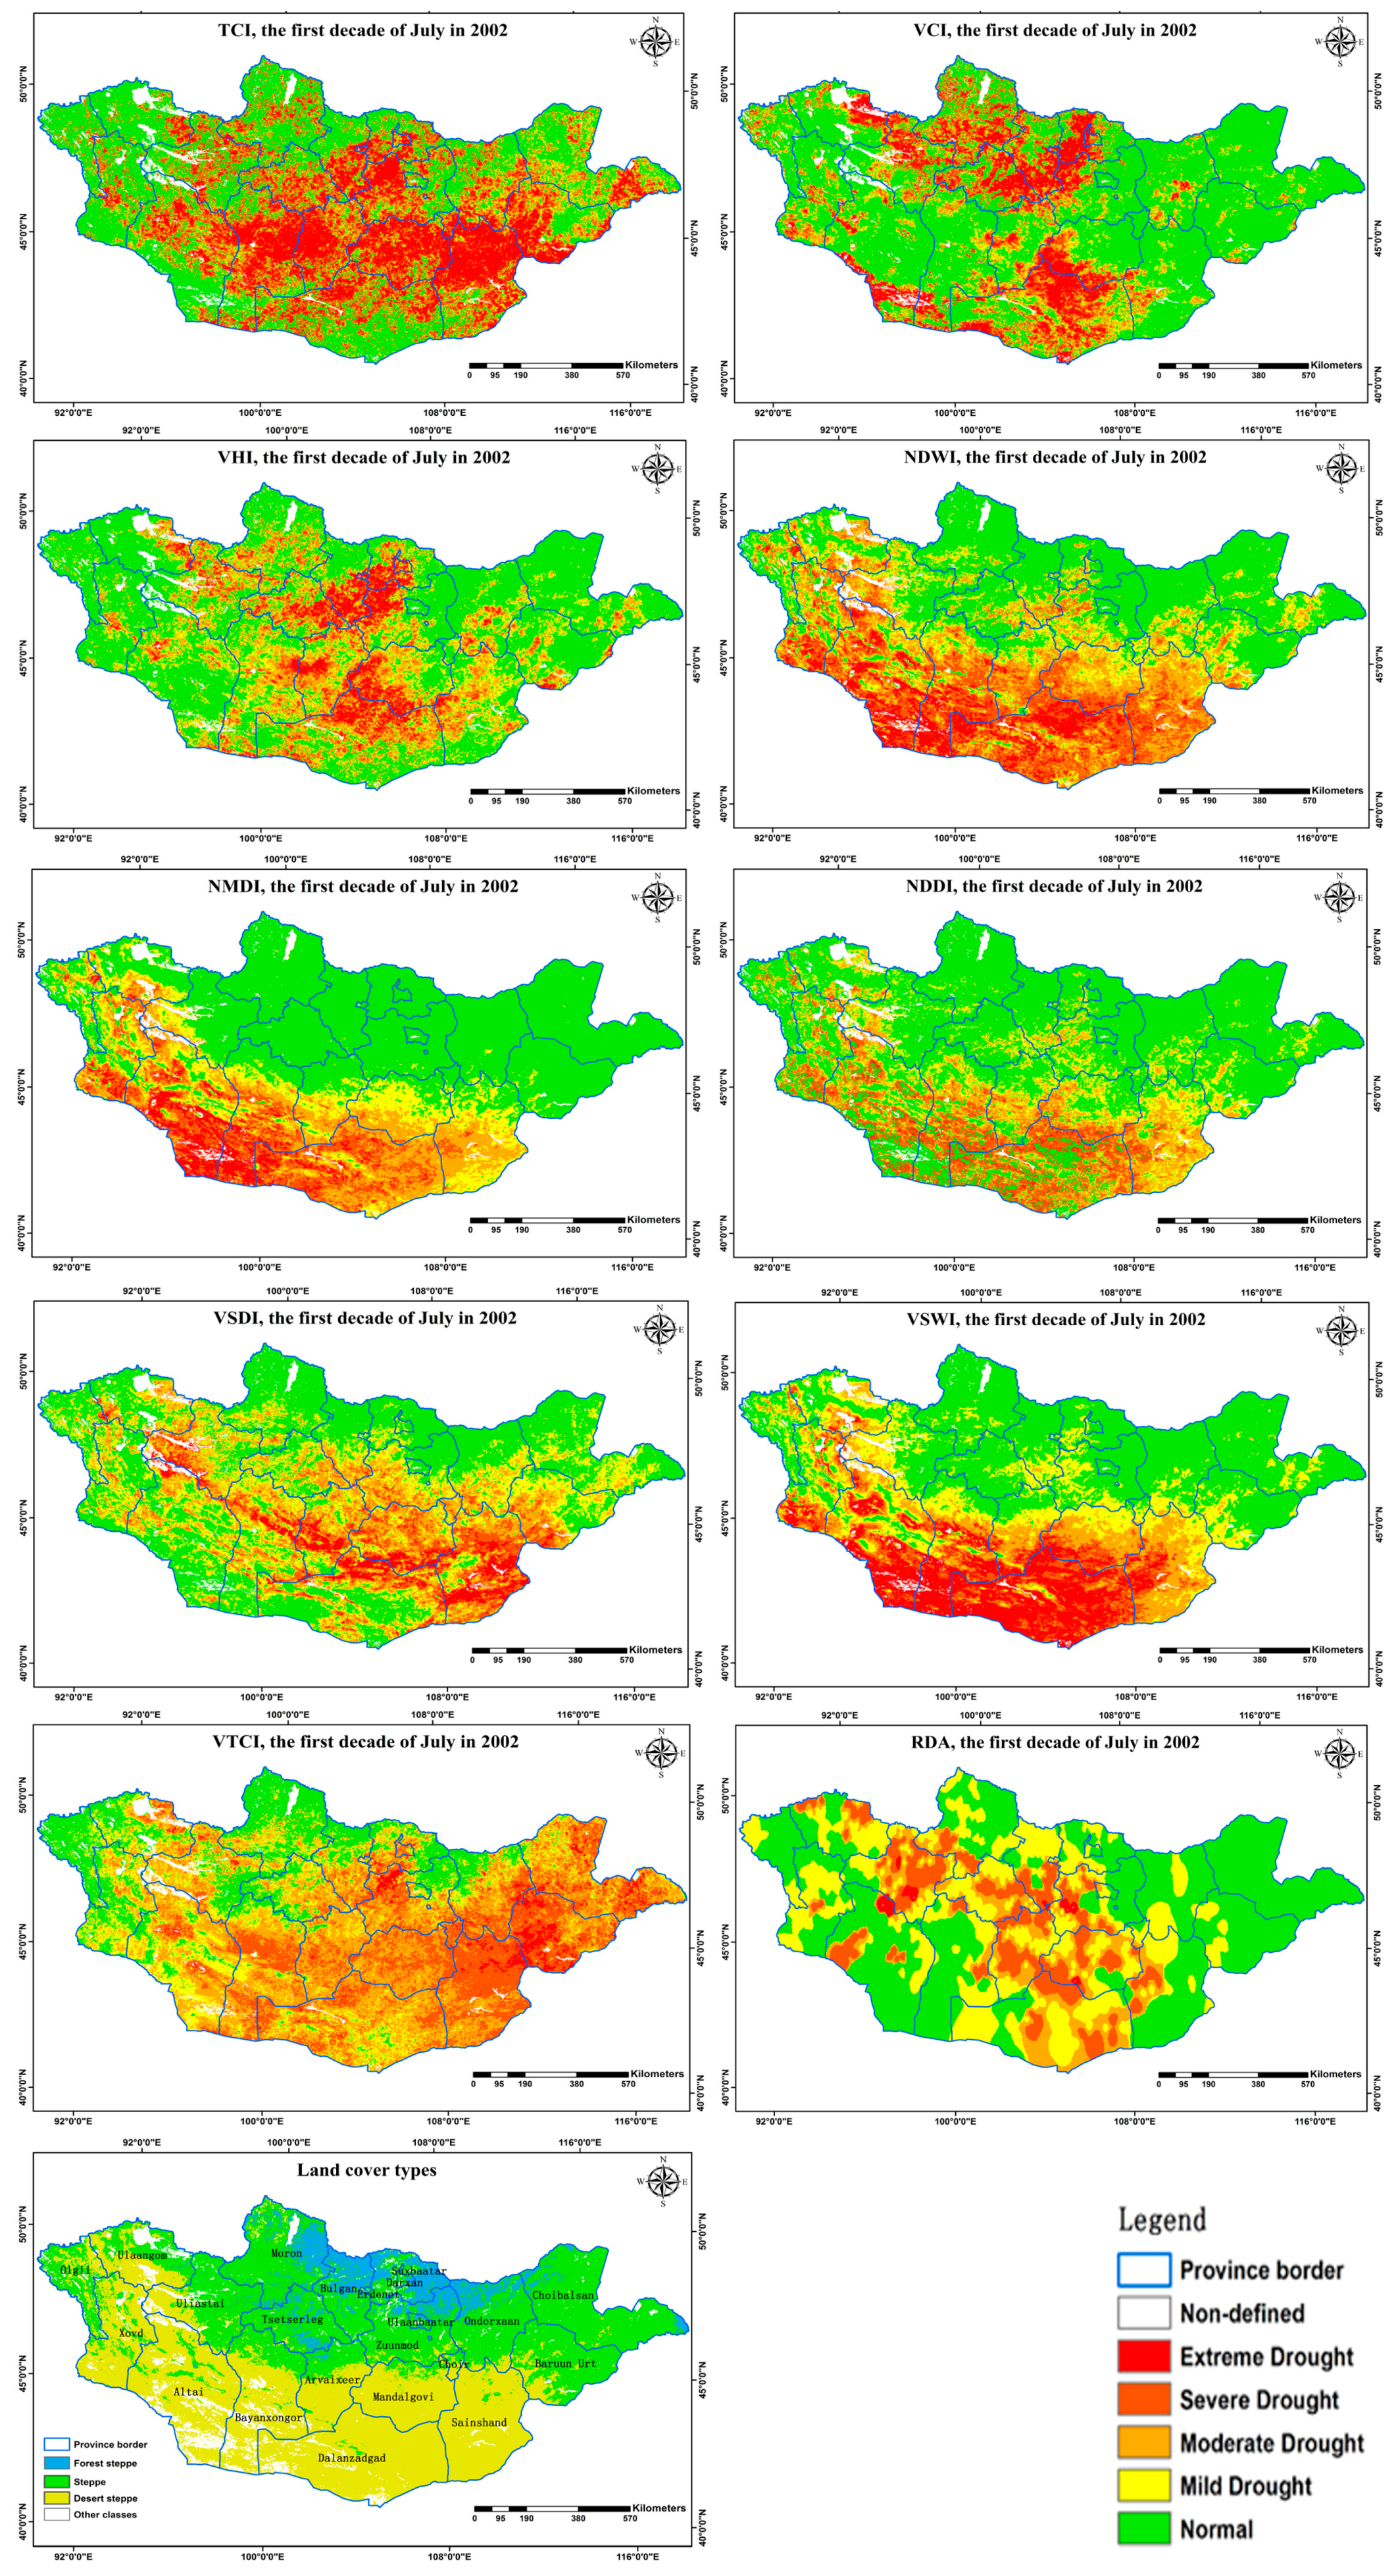
Mongolia experienced heavy drought conditions in 2002 and slight drought conditions in 2003. Two typical years (the first 10 days of July in 2002 and 2003) of drought monitoring results (Figure 6 and Figure 7) were selected for the visual comparison of the spatial monitoring characteristics of the nine RS-derived drought indices with the reference RDA data. In 2002, drought occurred throughout most of Mongolia except for eastern Mongolia and a few other areas. The VHI and VCI maps showed similar distributions as the reference RDA map in central and southern Mongolia (mainly steppe and desert steppe areas), whereas the NDWI and NDDI maps exhibit good correlations in the northern forest steppe region. The VTCI and VSWI maps showed strong drought conditions, and the NMDI map showed drought in only the southern and western regions. Similar maps were generated for the slight drought year of 2003. The VHI and TCI maps were consistent with the distributions in reference to the RDA map in the central and southern Mongolia. The NDDI and VSWI maps showed heavier drought in the south but slight or no drought in the north or central Mongolia, which was completely inconsistent with the results in the RDA map. In comparison to the RDA and the VHI, TCI, and VCI map, the VTCI showed drought distribution over a larger area, whereas the VSDI showed less drought distribution. In the north forest steppe region, the NDWI and NDDI maps showed only the approximations of the drought distribution. Thus, for the weak drought year of 2003, we find that the VHI, TCI, and NDWI maps were more consistent with the reference RDA map than those of the other indices.
To clarify the annual variations, we focused on the temporal fluctuations from 2002 to 2003. The NDWI, NMDI, NDDI, VSWI, VSDI, and VTCI maps had features of the same drought pattern in 2002 and 2003, with less drought extent and severity in 2003. The VHI, VCI, and TCI results indicated decreasing drought extent and severity, consistent with the RDA map and local drought characteristics. Furthermore, the NDWI and NDDI maps showed distribution features in the northern forest steppe region that were consistent with significantly decreasing trends as on the RDA map. Figure 6 and Figure 7 illustrate the advantages of the VHI, VCI, TCI, and NDWI for drought monitoring large areas of Mongolia.
4.6. Comprehensive Results
A suitability analysis was conducted by comparing the RS-derived drought indices to the ground-derived results of the PED, soil moisture, NorBio, and RDA for the forest steppe, steppe, and desert steppe areas during the study period at the pixel, county, and regional scales. The output is shown in Table 6. For each area, two levels (best and second best) were used to express sensitivity to reference indicators. The primary results were VHI/NDWI/TCI for forest steppe, VHI/VCI/NDWI for steppe, and VHI/VCI/VSWI for desert steppe. As the VHI index consists of both the VCI and TCI, the VHI can represent those two indices.
In terms of statistical distribution, there is an obvious trend point that represents the general level of data, known as the mode. The mode is the value that is repeated most often in a data set. Here, we propose using the mode to select the best indices for grassland drought monitoring. Based on the mode, the best indices are VHI and NDWI. Therefore, we find that these two RS-derived drought indices (VHI and NDWI) accurately describe Mongolian drought in the growing stage.
5. Discussion
This paper proposes a comprehensive suitability analysis method for monitoring drought in Mongolia. The selected RS-derived drought indices (TCI, VCI, VHI, NDDI, VSWI, VTCI, VSDI, and NMDI) and were derived from multi-band data (visible, NIR, SWIR, and thermal infrared). The new method does not depend on only one reference data for evaluation; it takes full advantage of multiple sources of field data (environmental conditions, grass condition, and drought-affected information) to describe drought status at different scales for different aspects.
Drought had a substantial influence on maximum measured aboveground biomass production [34,35]. However, biomass data reflect vegetation conditions in different areas at different times, and are limited in terms of spatial and temporal comparability with drought indices. To reduce these shortcomings, the NorBio was implemented to capture regional climate differences and the effects of short-term weather-related fluctuations on vegetation. Additionally, an AVHRR-based VHI was successfully used as a proxy for biomass in Mongolia [28], because the VHI has high correlations with biomass anomalies and estimates of crop yield and grassland biomass in other parts of the world [39,40,41]. The biomass production of a barley crop changes in response to drought depending on the timing and duration of the drought [35]. Drought stress may influence the water supply to vegetation and reduce accumulated biomass and production of crops or grasses. Hence biomass data can reflect the extent and severity of drought; we successfully used biomass index to express drought status in different regions over many years.
VHI and NDWI are the best indices for Mongolian drought, based on comparisons with field RDA. Because RDA is regional data, we analyzed the temporal and spatial distributions of RDA and satellite-derived drought indices for the severe drought in 2002 and the slight drought in 2003. The VHI and NDWI had more consistent spatial–temporal drought variability than the other indices. The spatial distribution data was able to express the general drought status, changes, and development better than the pixel- or point-based data.
Considering all the multi-aspect and multi-reference comparison results, the VHI and NDWI are the optimal selection. Kogan [28] previously applied the VHI for drought detection and derivation of pastoral biomass in Mongolia and found that VHI could reflect grassland health conditions and water- and temperature-related vegetation stress during drought. Hence the results of this paper are consistent with the findings of pioneering researchers. This index was also used for monitoring drought in other areas. Initially, VHI was used to evaluate the impact of drought on regional agricultural production in South America, Africa, Asia, North America, and Europe [7,39,40], and a very strong correlation was observed between VHI and crop yield, particularly during critical periods of crop growth. In China, VHI has been evaluated for drought monitoring by several researchers [42,43,44], who found that it was a stable and reasonable RS index for monitoring agricultural drought in different agro-meteorological zones of China.
Our research has found that the NDWI can also accurately express Mongolian grassland drought over long periods. The NDWI was derived from the NIR and SWIR channels, and it responded to changes in both water content (absorption of SWIR radiation) and spongy mesophyll (reflectance of NIR radiation) in vegetated areas [10]. The NDWI has further been used to monitor the moisture conditions of vegetation canopies over large areas in several investigations [45,46]. Soil moisture is a critical component in interactions between the land surface and the atmosphere, and prolonged soil moisture deficits often lead to drought-induced vegetation stress [47]. We evaluated the performances of the NDWI for drought monitoring, and found that it is more sensitive to Mongolian grassland drought than other possible indices, especially for forest steppe (seen in Table 4). The spatial distribution of NDWI values can best express RDA spatial distribution in forest steppe areas. Additionally, high correlation coefficients between NDWI and NorBio exist for forest steppe and steppe regions. Therefore, the NDWI is a very effective and simple index for monitoring grassland drought.
However, certain weaknesses in the proposed RS-derived drought products (VHI and NDWI) and ground data must be mentioned. These differences were caused by several error sources, including the selection of field stations, the distance between repeated points, differences in soil structures, and inconsistencies between the footprint of RS data and the point-based nature of the measured parameter indicators (soil moisture, NorBio, and PED). Soil moisture is a good indicator for vegetative drought; however, it is derived from in situ data, and it is difficult to obtain high correlations between in situ data and the spatial data of drought indices. Future experiments should focus on measurements of regional soil moisture to determine changes in drought. Normally, the PED index requires data over long time periods; however, the currently available dataset only covers approximately 15 years. The RDA is treated as regional field observation data, the data is actually collected by different observers without standardized instruments or equipment, possibly resulting in somewhat subjective results.
The VHI may feature additional errors for high-latitude regions, according to A. Karnieli [48]. The relationship between NDVI and LST is positive, but the VHI-based drought index hypothesizes that increasing temperatures act negatively on vegetation vigor and consequently cause water stress and drought. However, in high-latitude or equatorial humid regions, higher temperatures accelerate vegetation growth, and vegetation development is mainly limited by the available energy. Consequently, the VHI may not be the best index for drought monitoring in high-latitude regions. Indeed, this paper has shown that, in forest steppe areas, VHI is not always the best indicator for describing drought (Table 4). Our comparison analysis of NorBio and RDA spatial distribution showed that NDWI was better than VHI. This result is consistent with previous findings [49,50]. In this paper, we adopted the VHI equation used by Kogan’s papers [7,28]. In this equation, the coefficients of TCI and VCI are the same, that is, to 0.5, which is not strictly accurate because the NDVI and the LST exert varying influences on drought in different regions or ecosystems. In the future, focus should be on these shortcomings to find the optimal coefficients for various regions. This will enable the construction of a comprehensive drought monitoring model for the entirety of Mongolia based on the VHI (with various coefficient of TCI and VCI), and NDWI.
6. Conclusions
To identify the optimal index or indices for monitoring pasture drought in Mongolia, a new adaptability analysis framework was adopted for evaluating the performances of satellite-derived drought indices. Methods based on comparison to a meteorological index (PED), normalized biomass (NorBio) reference indicator, and RDA-based drought consistent percentage (CP) were proposed. Due to valuations at diverse scales (pixel, county, and region) for three land cover types (forest steppe, steppe, and desert steppe), Pearson’s correlation, CPs, and spatial consistency analysis methods were adopted, and an integrated assessment was developed to fully describe drought status. The mode method of statistical significance was used to identify comprehensive results among the comparisons of satellite-derived drought indices and five different reference indicators (PED, soil moisture, NorBio, RDA, and RDA spatial distribution).
The VHI and NDWI were found to be appropriate for the assessment of drought characteristics and for monitoring drought conditions in Mongolian grassland. These indices were able to detect the timing of drought onset and processes, and provided realistic quantification of drought severity in the study areas. These two indices can therefore be used to develop a combination drought model for accurately monitoring drought in the future. A comprehensive and novel adaptability analysis framework was built to identify the most appropriate satellite-derived drought indices for the accurate and near real-time detection of droughts in other countries or regions.
Acknowledgments
This work was funded by the National Key Research and Development Program (2016YFA0600304), the Mongolia Drought Monitoring System project, which is part of the CAS-TWAS Centre of Excellence on Space Technology for Disaster Mitigation ‘Joint Program on Space Technology for Disaster Mitigation in Asia’, and Impact of Agricultural Development on Food Security and Water Vulnerability Under Climate Change in the Zambezi Basin (41561144013). This work was also supported by the United Nations Economic and Social Commission for Asia and the Pacific (UN-ESCAP) project of Mongolia Drought Monitoring and Early Warning. Great help was provided by the Information and Research Institute of Meteorology, Hydrology, and Environment (IRIMHE), Mongolia. The MODIS/Terra Land Surface Temperature/Emissivity daily product MODIS1B data were provided by the NASA Goddard Space Flight Center (GSFC) Distributed Active Archive Center (GDAAC), and can be downloaded from their website: reverb.echo.nasa.gov/reverb. Thanks to cooperative experts from the IRIMHE of Mongolia, including S. Khudulmur, Odbayar Mishigdorj, Gantsetseg Batdelger, Ganbat Bavuudorj, and Barkhas Badam. They provided considerable meteorological data and field observation data. Keran Wang (division head of UN-ESCAP), Yejin Ha, Guoxiang Wu, and Kelly Hayden from UN-ESCAP provided help with project implementation and valuable advice, and our thanks are extended to all of them for their contributions. In addition, we thank Olipa Nyazambe Lungu for English language editing of this paper.
Author Contributions
Sheng Chang designed and performed the study. Nana Yan performed the pre-processing of field data. Bulgan Davdai and Elbegjargal Nasanbat collected and pre-processed the field data. Bingfang Wu supervised the research. All of the co-authors helped to revise the manuscript.
Conflicts of Interest
The authors declare no conflicts of interest.
References
- Bayarjargal, Y.; Karnieli, A.; Bayasgalan, M.; Khudulmur, S.; Gandush, C.; Tucker, C.J. A comparative study of NOAA–AVHRR derived drought indices using change vector analysis. Remote Sens. Environ. 2006, 105, 9–22. [Google Scholar] [CrossRef]
- Natsagdorj, L. Climate Change. In Climate Change and Its Impacts on Mongolia; Batima, P., Dagvadorj, D., Eds.; JEMR Press: Ulaanbaatar, Mongolia, 2000; pp. 14–43. [Google Scholar]
- Batima, P.; Dagvadorj, D. Climate Change Its Impacts in Mongolia; JEMR Publishing: Ulaanbaatar, Mongolia, 2000; pp. 97–199. [Google Scholar]
- Tucker, C.J. Red and photographic infrared linear combinations for monitoring vegetation. Remote Sens. Environ. 1979, 8, 127–150. [Google Scholar] [CrossRef]
- Ji, L.; Peters, A. Assessing vegetation response to drought in the northern Great Plains using vegetation and drought indices. Remote Sens. Environ. 2003, 87, 85–98. [Google Scholar] [CrossRef]
- Karnieli, A.; Agam, N.; Pinker, R.T.; Anderson, M.; Imhoff, M.L.; Gutman, G.G.; Panov, N.; Goldberg, A. Use of NDVI and land surface temperature for drought assessment: Merits and limitations. J. Clim. 2010, 23, 618–633. [Google Scholar] [CrossRef]
- Kogan, F.N. Application of Vegetation Index and Brightness Temperature for Drought Detection. Adv. Space Res. 1995, 15, 91–100. [Google Scholar] [CrossRef]
- Ceccato, P.; Flasse, S.; Gre’goire, J. Designing a spectral index to estimate vegetation water content from remote sensing data Part 2. Validation and applications. Remote Sens. Environ. 2002, 82, 198–207. [Google Scholar] [CrossRef]
- Zhang, N.; Hong, Y.; Qin, Q.; Liu, L. VSDI: A visible and shortwave infrared drought index for monitoring soil and vegetation moisture based on optical remote sensing. Int. J. Remote Sens. 2013, 34, 4585–4609. [Google Scholar] [CrossRef]
- Gao, B.C. NDWI-A Normalized Difference Water Index for remote sensing of vegetation liquid water from space. Remote Sens. Environ. 1996, 58, 257–266. [Google Scholar] [CrossRef]
- Wang, L.; Qu, J.J. NMDI: A normalized multi-band drought index for monitoring soil and vegetation moisture with satellite remote sensing. Geophys. Res. Lett. 2007, 34, 117–131. [Google Scholar] [CrossRef]
- Maki, M.; Ishiahra, M.; Tamura, M. Estimation of leaf water status to monitor the risk of forest fires by using remotely sensed data. Remote Sens. Environ. 2004, 90, 441–450. [Google Scholar] [CrossRef]
- Gu, Y.; Brown, J.F.; Verdin, J.P.; Wardlow, B. A five-year analysis of MODIS NDVI and NDWI for grassland drought assessment over the central Great Plains of the United States. Geophys. Res. Lett. 2007, 34, L06407. [Google Scholar] [CrossRef]
- Gutman, C.G. Towards drought monitoring from space. J. Clim. 1990, 3, 282–295. [Google Scholar] [CrossRef]
- Carlson, T.N.; Perry, E.M.; Schmugge, T.J. Remote estimation of soil moisture availability and fractional vegetation cover for agricultural fields. Agric. For. Meteorol. 1990, 52, 45–69. [Google Scholar] [CrossRef]
- McVicar, T.R.; Bierwirth, P.N. Rapidly assessing the 1997 drought in Papua New Guinea using composite AVHRR imagery. Int. J. Remote Sens. 2001, 22, 2109–2128. [Google Scholar] [CrossRef]
- Sandholt, I.; Rasmussen, K.; Anderson, J. A simple interpretation of the surface temperature/vegetation index space for assessment of the surface moisture status. Remote Sens. Environ. 2002, 79, 213–224. [Google Scholar] [CrossRef]
- Wang, P.-X.; Li, X.-W.; Gong, J.-Y.; Song, C.-H. Vegetation temperature condition index and its application for drought monitoring. In Proceedings of the International Geoscience and Remote Sensing Symposium, Sydney, Australia, 9–14 July 2001; pp. 141–143. [Google Scholar]
- Kogan, F.N.; Stark, R.; Gitelson, A.; Jargalsaikhan, L.; Dugrajav, C.; Tsooj, S. Derivation of pasture biomass in Mongolia from AVHRR-based vegetation health indices. Int. J. Remote Sens. 2004, 25, 2889–2896. [Google Scholar] [CrossRef]
- Dorjsuren, M.; Liou, Y.; Cheng, C. Time series and in-situ data analysis for Mongolia drought. Remote Sens. 2016, 8, 509. [Google Scholar] [CrossRef]
- Price, J.C. Thermal inertia mapping: A new view of the earth. Geophys. Res. 1977, 82, 25–82. [Google Scholar] [CrossRef]
- Idso, S.B.; Jackson, R.D.; Pinter, P.J.J. Normalizing the stress degree day for environmental variability. Agric. Meteorol. 1981, 24, 45–55. [Google Scholar] [CrossRef]
- Li, F.; Chen, W.; Zeng, Y.; Zhao, Q.; Wu, B. Improving Estimates of Grassland Fractional Vegetation Cover Based on a Pixel Dichotomy Model: A Case Study in Inner Mongolia, China. Remote Sens. 2014, 6, 4705–4722. [Google Scholar] [CrossRef]
- Ackerman, S.; Strablal, K.; Menzel, P.; Frey, R.; Moeller, C.; Gumley, L.; Baum, B.; Seeman, S.W.; Zhang, H. Discriminating Clear-Sky from Cloud with MODIS Algorithm Theoretical Basis Document (Mod35), 4th ed.; Goddard Space Flight Center: Greenbelt, MD, USA, 2002.
- Kaufman, Y.J.; Wald, A.E.; Remer, L.A. The MODIS 2.1 mm channel correlation with visible reflectance for use in remote sensing of aerosol. IEEE Trans. Geosci. Remote Sens. 1997, 35, 1286–1298. [Google Scholar] [CrossRef]
- Vermote, E.F.; Tanre, D.; Deuze, J.J. Second simulation of the satellite signal in the solar spectrum: An overview. IEEE Trans. Geosci. Remote Sens. 1997, 35, 675–686. [Google Scholar] [CrossRef]
- Jiang, L.P.; Qin, Z.H.; Xie, W. Program splits window algorithm to retrieve land surface temperature for MODIS data using IDL. Geomat. Spat. Inf. Technol. 2006, 29, 114–117. [Google Scholar]
- Khudulmur, S.; Elbegjargal, N.; Tsogtbaatar, J.; Dash, D.; Mandakh, N. Desertification Atlas of Mongolia; Institute of Geoecology, Mongolian Academy of Sciences: Ulaanbaatar, Mongolia, 2014; pp. 38–41. [Google Scholar]
- Ped, D.A. On indicators of droughts and wet conditions (in Russian). Proc. USSR Hydrometeorol. Cent. 1975, 156, 19–39. [Google Scholar]
- Zhang, W.; Qing, Z.; Lin, L. Quantitative analysis of the impact of agricultural drought on national food securit. J. Nat. Disasters 2010, 19, 111–118. (In Chinese) [Google Scholar]
- Natsagdorj, L.; Bayasgalan, G.; Gomboluudev, P. The Issue of Present Climate Change over Mongolia. MAS Inf. 2005, 178, 23–44. [Google Scholar]
- Dagvadorj, D.; Natsagdorj, L.; Dorjpurev, J.; Namkhainyam, B. Nature and Tourism; Mongolia Assessment Report on Climate Change; Ministry of Environment: Ulaanbaatar, Mongolia, 2009.
- Koleva, E.; Alexandrov, V. Drought in the Bulgarian low regions during the 20th century. Theor. Appl. Climatol. 2008, 92, 113–120. [Google Scholar] [CrossRef]
- Day, W.; Legg, B.J.; Johnston, A.E.; Lawlor, D.W.; Jeffers, W.; De, C. A drought experiment using mobile shelters: The effect of drought on barley yield, water use and nutrient uptake. J. Agric. Sci. 1978, 91, 599–623. [Google Scholar] [CrossRef]
- Jamieson, P.D.; Martin, R.J.; Francis, G.S.; Wilson, D.R. Drought effects on biomass production and radiation-use efficiency in barley. Field Crops Res. 1995, 43, 77–86. [Google Scholar] [CrossRef]
- Xia, Y.; Sheffield, J.; Ek, M.B.; Dong, J.; Chaney, N.; Wei, H.; Meng, J.; Wood, E.F. Evaluation of multi-model simulated soil moisture in NLDAS-2. J. Hydrol. 2014, 512, 107–125. [Google Scholar] [CrossRef]
- Yu, T.; Tian, G. The change of soil surface moisture by thermal inertia method. J. Remote Sens. 1997, 1, 24–31. [Google Scholar]
- National Remote Sensing Center & Environmental Information Center of IRIMHE in Mongolia. Available online: http://www.icc.mn/index.php?content=58 (accessed on 14 February 2017).
- Kogan, F.N. Operational space technology for global vegetation assessment. Bull. Am. Meteorol. Soc. 2001, 82, 1949–1964. [Google Scholar] [CrossRef]
- Kogan, F.N. World Droughts in the new millennium from AVHRR-based vegetation health indices. Eos Trans. Am. Geophys. Union 2002, 83, 557–564. [Google Scholar] [CrossRef]
- Kogan, F.; Gitelson, A.; Zakarin, E.; Spivak, L.; Lebed, L. AVHRR-based spectral vegetation indices for quantitative assessment of vegetation state and productivity: Calibration and validation. Photogramm. Eng. Remote Sens. 2003, 69, 899–906. [Google Scholar] [CrossRef]
- Mou, L. Drought Monitoring Based on the Remote Sensing Data; Institute of Remote Sensing Applications Chinese, Academy of Sciences: Beijing, China, 2006. [Google Scholar]
- Yan, N. Drought Monitoring Based on the Remote Sensed Indices; Institute of Remote Sensing Applications Chinese, Academy of Sciences: Beijing, China, 2005. [Google Scholar]
- Yan, N.N.; Wu, B.F.; Boken, V.J.; Chang, S.; Yang, L.D. A drought monitoring operational system for China using satellite data design and evaluation. Geomat. Nat. Hazards Risk 2014. [Google Scholar] [CrossRef]
- Jackson, J.T.; Chen, D.; Cosh, M.; Li, F.; Anderson, M.; Walthall, C.; Doriaswamy, P.; Hunt, E.R. Vegetation water content mapping using Landsat data derived normalized difference water index for corn and soybeans. Remote Sens. Environ. 2004, 92, 475–482. [Google Scholar] [CrossRef]
- Chen, D.; Huang, J.; Jackson, T.J. Vegetation water content estimation for corn and soybeans using spectral indices derived from MODIS near- and short-wave infrared bands. Remote Sens. Environ. 2005, 98, 225–236. [Google Scholar] [CrossRef]
- Brubaker, K.L.; Entekhabi, D. Analysis of feedback mechanisms in land-atmosphere interaction. Water Resour. Res. 1996, 5, 1343–1357. [Google Scholar] [CrossRef]
- Karnieli, A.; Bayasgalan, M.; Bayarjargal, Y.; Agam, N.; Khudulmur, S.; Tucker, C.J. Comments on the use of the vegetation health index over Mongolia. Int. J. Remote Sens. 2006, 27, 2017–2024. [Google Scholar] [CrossRef]
- Lambin, E.F.; Ehrlich, D. The surface temperature-vegetation index space for land cover and land-cover change analysis. Int. J. Remote Sens. 1996, 17, 463–487. [Google Scholar] [CrossRef]
- Tateishi, R.; Ebata, M. Analysis of phonological change patterns using 1982–2000 Advanced Very High Resolution Radiometer (AVHRR) data. Int. J. Remote Sens. 2004, 25, 2287–2300. [Google Scholar] [CrossRef]
Figure 1.
Study area and field stations distribution.
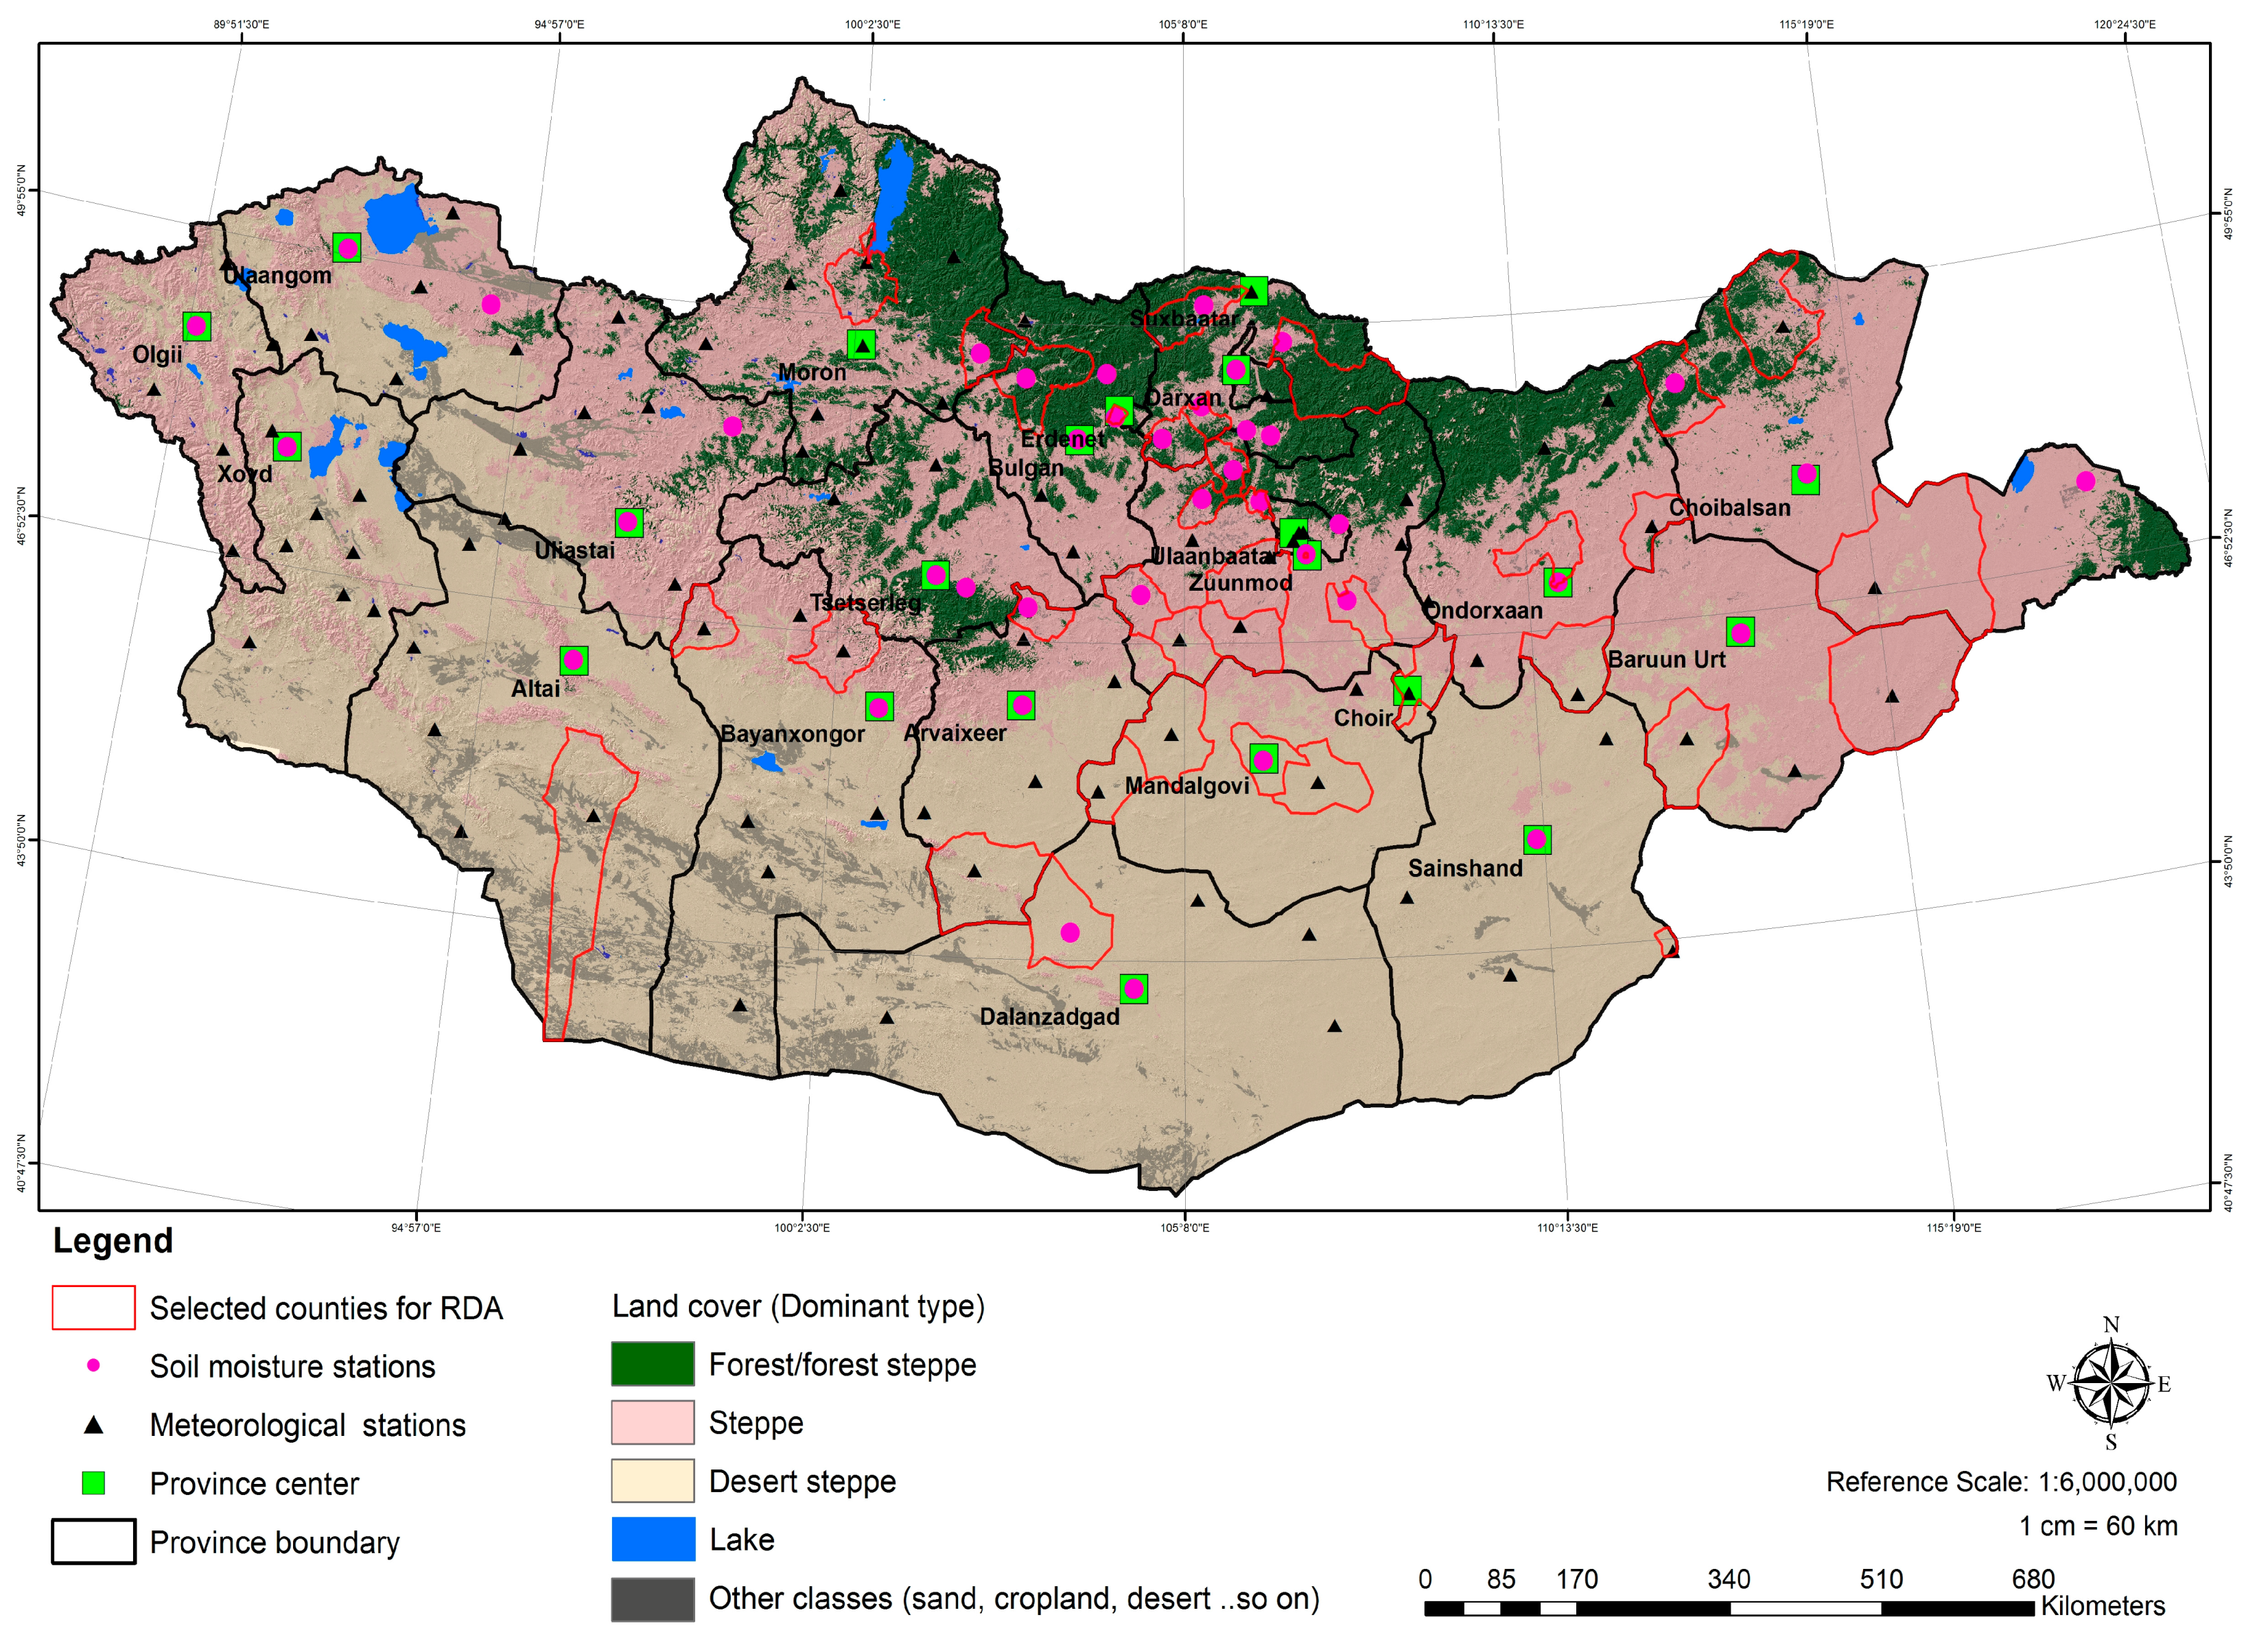
Figure 2.
Adaptability analysis framework of the RS-derived drought indices in this paper.

Figure 3.
Time series plots of nine RS-derived drought indices and the PED in first 10 days of July from 2000 to 2014 for the following three classes: (a–c) forest steppe; (d–f) steppe; (g–i) desert steppe.
Figure 3.
Time series plots of nine RS-derived drought indices and the PED in first 10 days of July from 2000 to 2014 for the following three classes: (a–c) forest steppe; (d–f) steppe; (g–i) desert steppe.
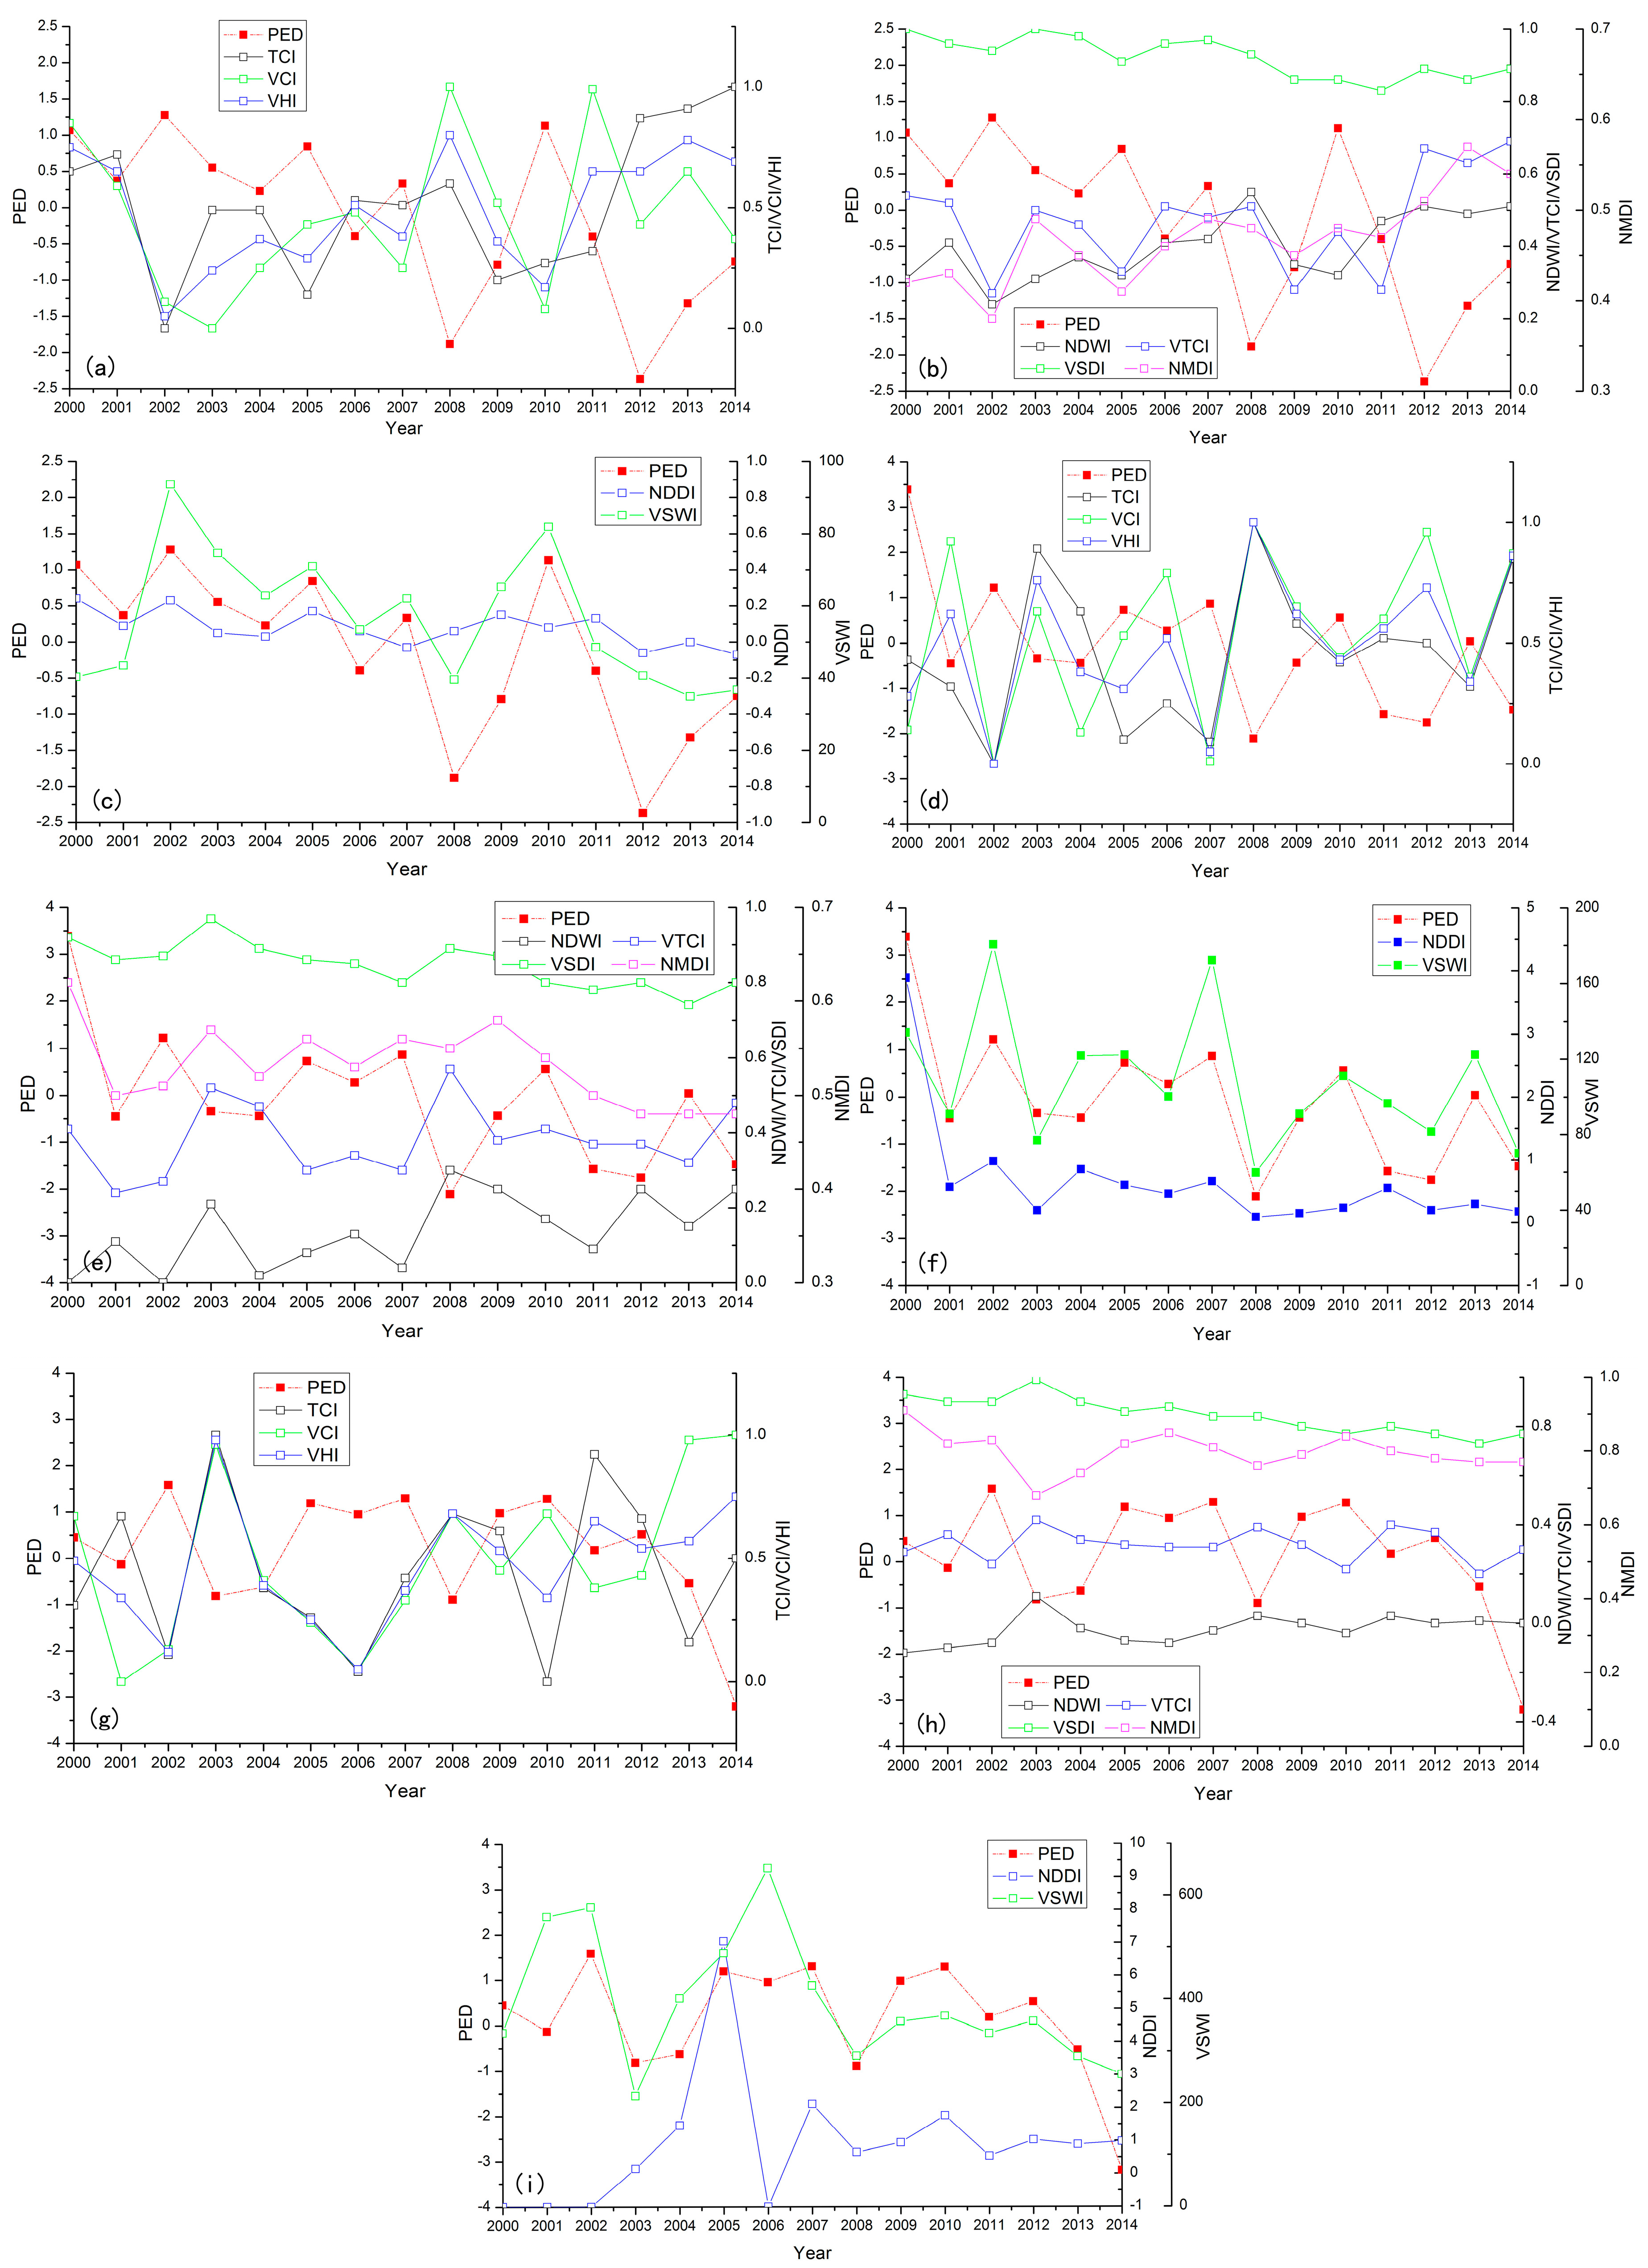
Figure 4.
Time series plots of nine RS-derived drought indices relative to the NorBio for the last 10 days of July 2000–2014 for the three land-cover classes: (a–c) forest steppe; (d–f) steppe; (g–i) desert steppe.
Figure 4.
Time series plots of nine RS-derived drought indices relative to the NorBio for the last 10 days of July 2000–2014 for the three land-cover classes: (a–c) forest steppe; (d–f) steppe; (g–i) desert steppe.
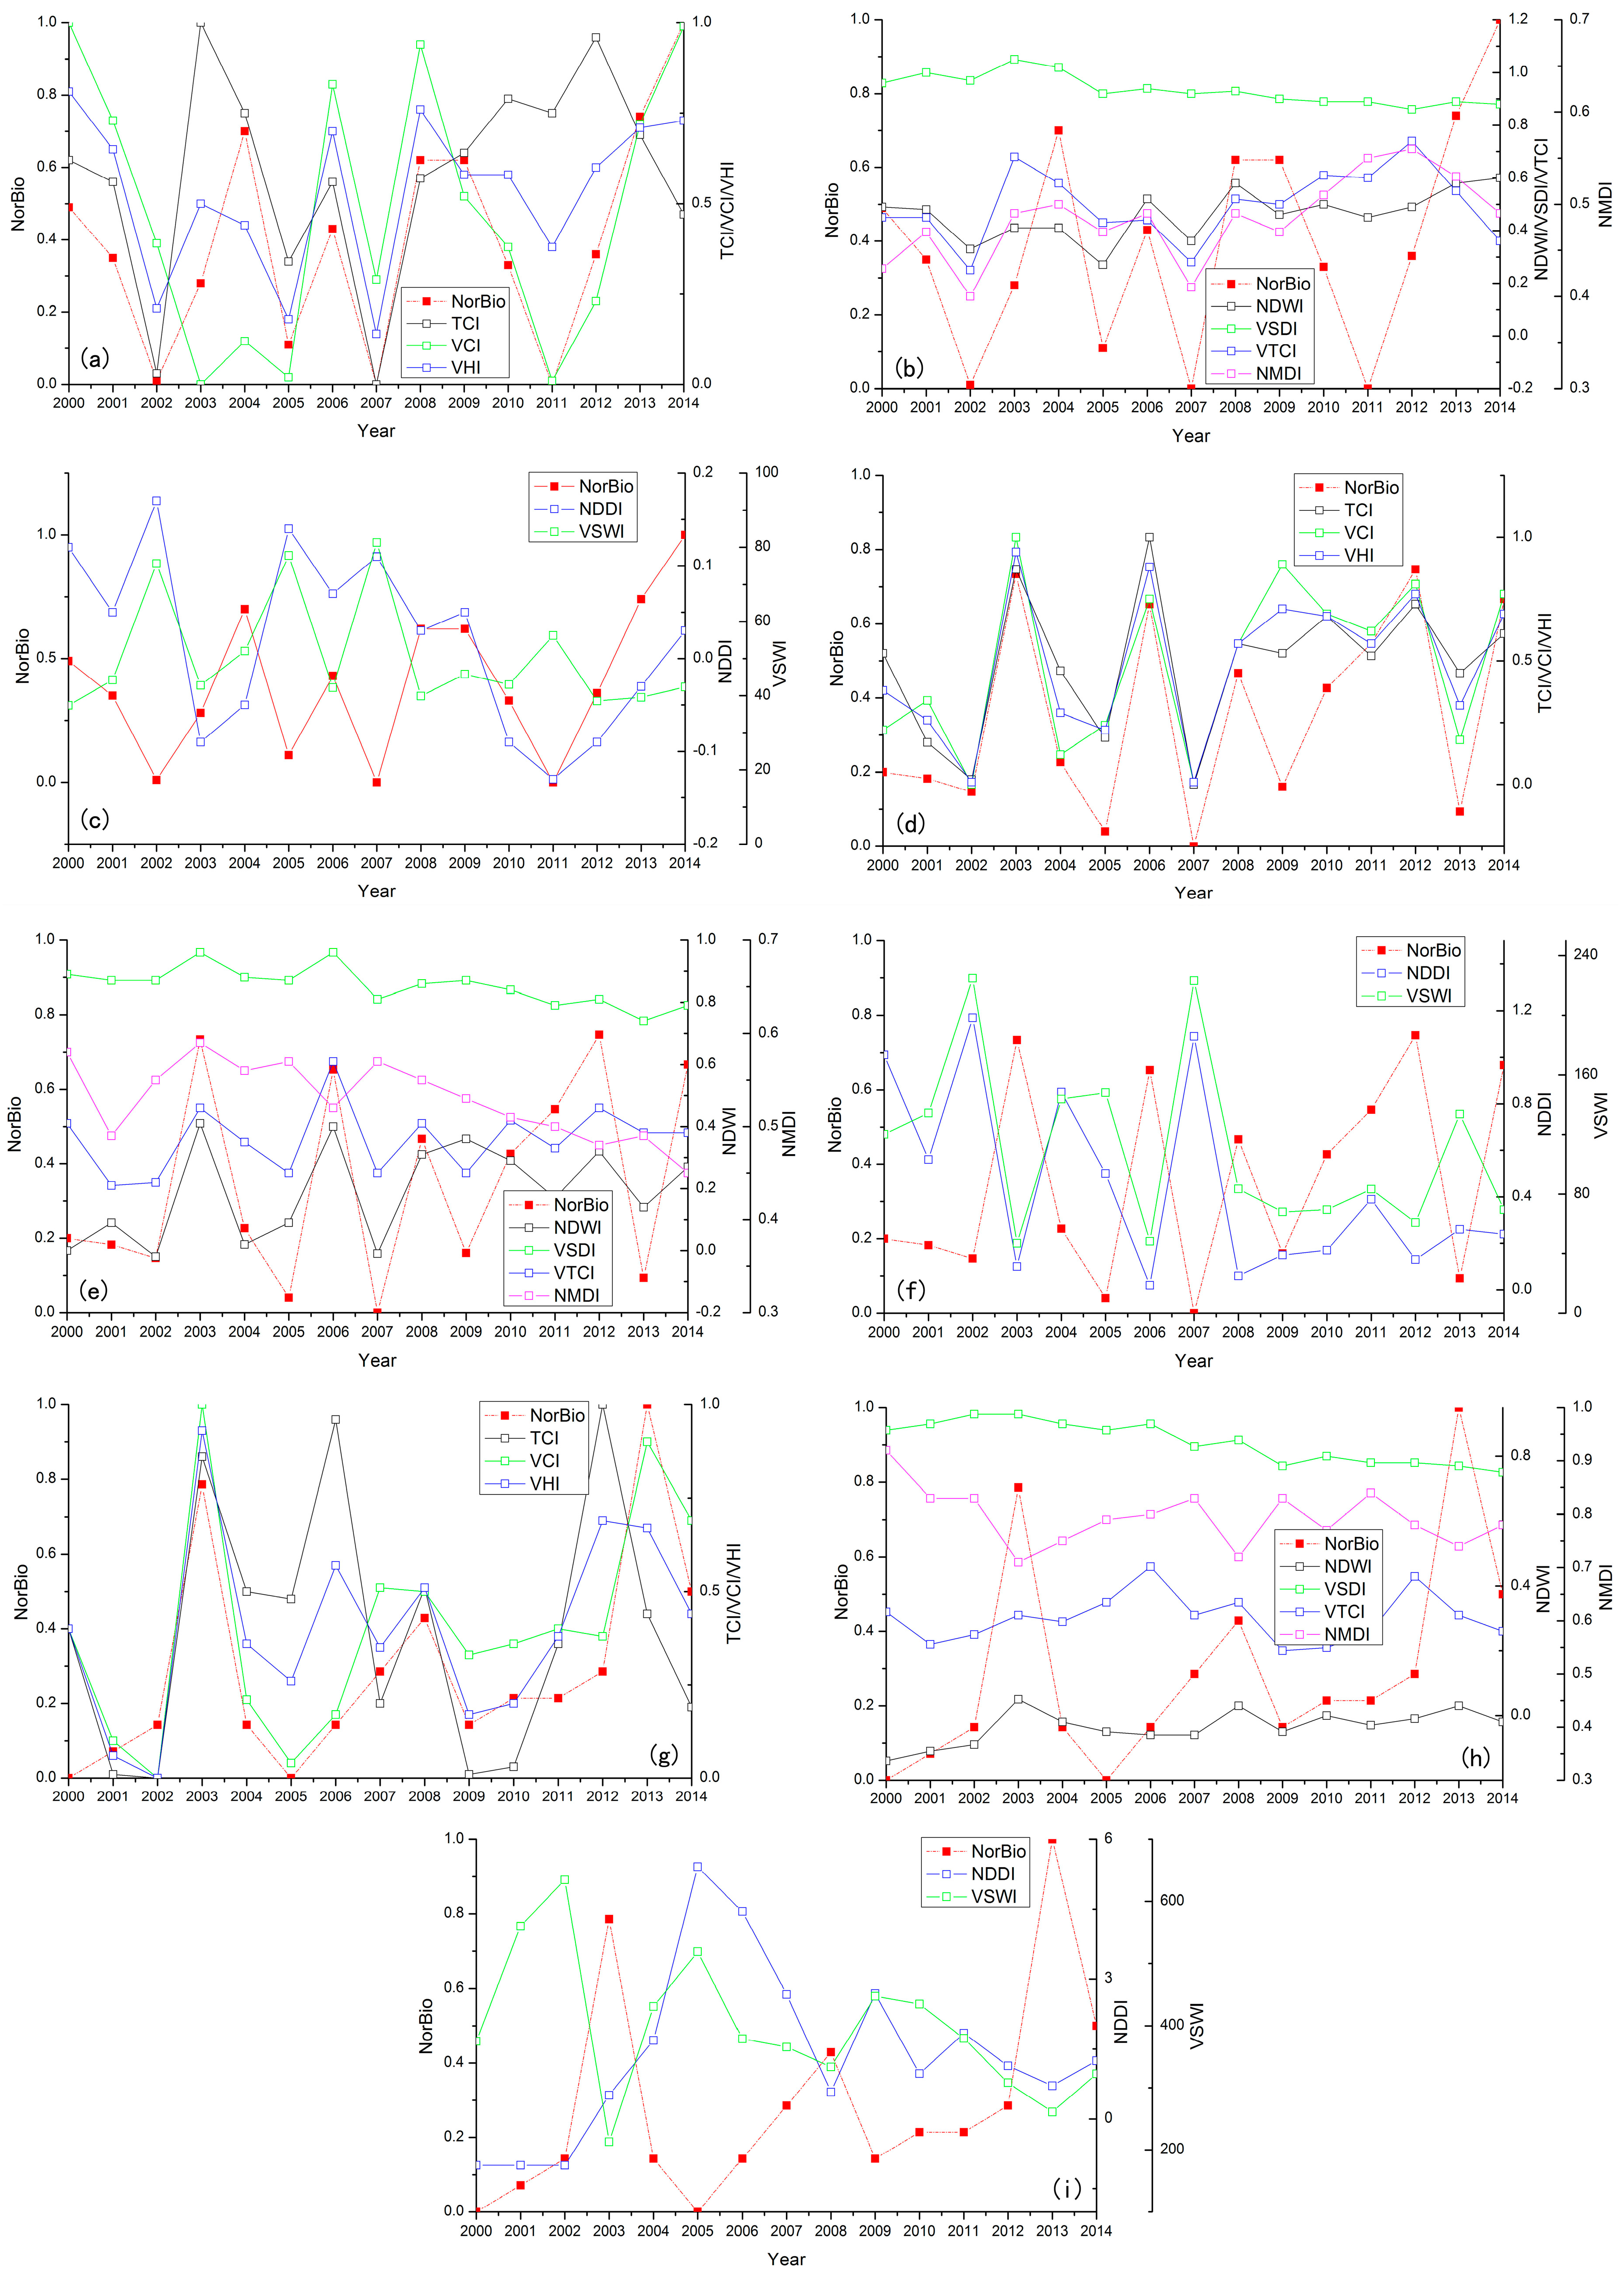
Figure 5.
Maximum, minimum and average CPs for the three land-cover types (forest steppe, steppe, and desert steppe) across stations.
Figure 5.
Maximum, minimum and average CPs for the three land-cover types (forest steppe, steppe, and desert steppe) across stations.

Figure 6.
Spatial distribution of drought in the first 10 days of July in 2002 for the RS-derived drought indices TCI, VCI, VHI, NDWI, NMDI, NDDI, VSDI, VSWI, and VTCI as well as the RDA in three land-cover categories.
Figure 6.
Spatial distribution of drought in the first 10 days of July in 2002 for the RS-derived drought indices TCI, VCI, VHI, NDWI, NMDI, NDDI, VSDI, VSWI, and VTCI as well as the RDA in three land-cover categories.

Figure 7.
Spatial distribution of drought for the first 10 days of July in 2003 for the RS-derived drought indices TCI, VCI, VHI, NDWI, NMDI, NDDI, VSDI, VSWI, and VTCI as well as the RDA in three land-cover categories.
Figure 7.
Spatial distribution of drought for the first 10 days of July in 2003 for the RS-derived drought indices TCI, VCI, VHI, NDWI, NMDI, NDDI, VSDI, VSWI, and VTCI as well as the RDA in three land-cover categories.

Table 1.
Data used in this study.
| Data Type | Year | Information | Source |
|---|---|---|---|
| Land cover | collected in 2010 | The NRSC of Mongolia | |
| Administrator boundary | from the IRIMHE of Mongolia | The NRSC of Mongolia | |
| MODIS 1B data (daily) | 2000–2014 | MODIS/TERRA | The Atmosphere Archive and Distribution System (LAADS) of National Aeronautics and Space Administration’s (NASA) |
| Precipitation (P) | 2000–2014 | 86 meteorological stations | The IRIMHE of Mongolia |
| Air temperature (T) | 2000–2014 | 86 meteorological stations | The IRIMHE of Mongolia |
| Soil moisture | 2000–2011 | 39 stations | The IRIMHE of Mongolia |
| Biomass | 2000–2014 | 86 meteorological stations | The IRIMHE of Mongolia |
| Drought-affected region (RDA) data | 2000–2014 | 37 counties with four directional values in each county | The IRIMHE of Mongolia |
Table 2.
Candidate drought indices.
| Satellite-Based Drought Index | Authors | Formula(e) |
|---|---|---|
| VCI | Kogan, F.N., 1995 [7] | NDVImax and NDVImin are the maximum and minimum NDVI in multi-year dataset |
| TCI | Kogan, F.N., 1995 [7] | LSTmax and LSTmin are the maximum and minimum LST in multi-year dataset |
| VHI | Kogan, F.N., 1995 [7] | |
| VTCI | Wang et al., 2001 [18] | |
| NMDI | Wang, L. and Qu, J.J., 2007 [11] | |
| VSDI | Zhang et al., 2013 [9] | |
| VSWI | Carlson et al., 1990 [15] | |
| NDWI | Gao, 1996 [10] | |
| NDDI | Yingxin Gu, 2007 [13] |
Table 3.
R of the PED and satellite-based drought indices during the grass growing period (June–August) across stations (with a 99% confidence level).
Table 3.
R of the PED and satellite-based drought indices during the grass growing period (June–August) across stations (with a 99% confidence level).
| RS-Derived Indices | Forest Steppe | Steppe | Desert Steppe |
|---|---|---|---|
| TCI | −0.69/−0.43/−0.57/0.07 | −0.71/−0.35/−0.56/0.08 | −0.62/−0.28/−0.46/0.09 |
| VCI | −0.57/−0.20/−0.34/0.14 | −0.68/−0.27/−0.47/0.10 | −0.58/−0.16/−0.40/0.11 |
| VHI | −0.75/−0.36/−0.61/0.09 | −0.76/−0.52/−0.66/0.07 | −0.75/−0.31/−0.56/0.11 |
| NDWI | −0.65/−0.20/−0.50/0.10 | −0.69/−0.29/−0.54/0.09 | −0.58/−0.20/−0.43/0.09 |
| NDDI | 0.58/0.21/0.44/0.10 | 0.62/0.02/0.39/0.15 | 0.39/−0.04/0.15/0.12 |
| VSWI | 0.70/0.35/0.54/0.09 | 0.73/0.35/0.58/0.10 | 0.64/0.33/0.48/0.09 |
| VTCI | −0.63/−0.29/−0.48/0.08 | −0.59/−0.23/−0.46/0.09 | −0.57/−0.22/−0.39/0.10 |
| VSDI | 0.48/0.02/0.25/0.11 | 0.35/−0.29/0.13/0.13 | −0.11/0.23/0.09/0.10 |
| NMDI | −0.59/0.05/−0.27/0.20 | 0.48/−0.52/0.10/0.24 | 0.51/0.13/0.31/0.13 |
Each cell in the table shows four values in the following order: MAX_R, MIN_R, AVE_R, and STDE_R. The bold number is maximum of MAX_R in nine indices.
Table 4.
R of soil moisture at a depth of 10 cm and the RS-derived indices in the three land-cover types across stations (at a 99% confidence level).
Table 4.
R of soil moisture at a depth of 10 cm and the RS-derived indices in the three land-cover types across stations (at a 99% confidence level).
| RS-Derived Indices | Forest Steppe | Steppe | Desert Steppe |
|---|---|---|---|
| TCI | 0.58/0.03/0.36/0.16 | 0.63/0.05/0.39/0.15 | 0.49/0.13/0.32/0.13 |
| VCI | 0.17/0.13/0.08/0.10 | 0.49/0.10/0.24/0.13 | 0.58/0.35/0.43/0.08 |
| VHI | 0.42/0.10/0.32/0.13 | 0.67/0.10/0.40/0.15 | 0.61/0.37/0.48/0.08 |
| NDWI | 0.29/0.06/0.17/0.13 | 0.69/0.02/0.26/0.17 | 0.43/0.08/0.22/0.34 |
| NDDI | −0.32/0.00/−0.18/0.10 | −0.62/−0.10/−0.19/0.17 | −0.19/0.00/−0.10/0.07 |
| VSWI | −0.37/0.00/−0.28/0.12 | −0.65/0.00/−0.38/0.14 | −0.58/−0.40/−0.48/0.07 |
| VTCI | 0.51/0.00/0.29/0.14 | 0.60/0.00/0.33/0.14 | 0.47/0.03/0.25/0.17 |
| VSDI | 0.32/0.01/0.11/0.17 | 0.43/0.03/0.25/0.16 | 0.54/0.02/0.19/0.27 |
| NMDI | −0.29/0.00/0.02/0.25 | −0.39/0.00/−0.06/0.16 | −0.49/0.00/−0.26/0.25 |
Each cell in the table shows four values in the following order: MAX_R, MIN_R, AVE_R, and STDE_R. The bold number is maximum of MAX_R in nine indices.
Table 5.
R of the NorBio and RS-derived drought indices in three land-cover types across stations (at a 99% confidence level).
Table 5.
R of the NorBio and RS-derived drought indices in three land-cover types across stations (at a 99% confidence level).
| RS-Derived Indices | Forest Steppe | Steppe | Desert Steppe |
|---|---|---|---|
| TCI | 0.70/0.04/0.43/0.19 | 0.80/0.09/0.45/0.21 | −0.46/0.73/0.23/0.30 |
| VCI | 0.83/0.35/0.64/0.16 | 0.94/0.12/0.57/0.16 | 0.92/0.28/0.67/0.15 |
| VHI | 0.87/0.30/0.62/0.17 | 0.94/0.38/0.60/0.14 | 0.82/0.32/0.59/0.16 |
| NDWI | 0.92/0.48/0.70/0.14 | 0.95/0.15/0.61/0.17 | 0.86/0.08/0.48/0.20 |
| NDDI | −0.81/0.14/−0.57/0.17 | −0.80/−0.08/−0.50/0.19 | −0.57/0.11/−0.33/0.17 |
| VSWI | −0.78/0.38/−0.59/0.14 | −0.88/−0.33/−0.59/0.14 | −0.83/−0.26/−0.60/0.12 |
| VTCI | 0.61/−0.21/0.32/0.22 | 0.72/−0.32/0.31/0.25 | 0.68/−0.76/0.05/0.34 |
| VSDI | 0.49/−0.48/−0.08/0.25 | 0.73/−0.56/0.02/0.33 | 0.82/−0.70/−0.05/0.38 |
| NMDI | 0.69/0.00/0.39/0.22 | −0.70/0.67/−0.16/0.38 | −0.79/0.05/−0.36/0.23 |
Each cell in the table had four values in the following order: MAX_R, MIN_R, AVE_R, and STDE_R. The bold number is maximum of MAX_R in nine indices.
Table 6.
Sensitivity of RS-derived drought indices to the reference indicators
| Reference Indicators | Forest Steppe | Steppe | Desert Steppe |
|---|---|---|---|
| PED | VHI */TCI ** | VHI */TCI ** | VHI */VSWI ** |
| Soil moisture | TCI */VTCI ** | NDWI */VHI ** | VHI */VSWI ** |
| NorBio | NDWI */VHI ** | VHI */NDWI ** | VCI */VSWI ** |
| RDA | NDWI */VHI ** | VHI */VCI ** | VCI */VHI ** |
| RDA spatial distribution | NDWI */VHI ** | VHI */VCI ** | VHI */VCI ** |
*, ** indicate the best and second-best correlations between the RS-derived drought indices and the reference indicators.
© 2017 by the authors. Licensee MDPI, Basel, Switzerland. This article is an open access article distributed under the terms and conditions of the Creative Commons Attribution (CC BY) license (http://creativecommons.org/licenses/by/4.0/).
Share and Cite
MDPI and ACS Style
Chang, S.; Wu, B.; Yan, N.; Davdai, B.; Nasanbat, E. Suitability Assessment of Satellite-Derived Drought Indices for Mongolian Grassland. Remote Sens. 2017, 9, 650. https://doi.org/10.3390/rs9070650
AMA Style
Chang S, Wu B, Yan N, Davdai B, Nasanbat E. Suitability Assessment of Satellite-Derived Drought Indices for Mongolian Grassland. Remote Sensing. 2017; 9(7):650. https://doi.org/10.3390/rs9070650
Chicago/Turabian StyleChang, Sheng, Bingfang Wu, Nana Yan, Bulgan Davdai, and Elbegjargal Nasanbat. 2017. "Suitability Assessment of Satellite-Derived Drought Indices for Mongolian Grassland" Remote Sensing 9, no. 7: 650. https://doi.org/10.3390/rs9070650
Note that from the first issue of 2016, this journal uses article numbers instead of page numbers. See further details here.