
A Novel Building Type Classification Scheme Based on Integrated LiDAR and High-Resolution Images


1
Guangdong Provincial Key Laboratory of Urbanization and Geo-simulation, School of Geography and Planning, Sun Yat-sen University, Guangzhou 510275, China
2
Department of Land, Air and Water Resources, University of California, Davis, CA 95616, USA
3
Center of Integrated Geographic Information Analysis, School of Geography and Planning, Sun Yat-sen University, Guangzhou 510275, China
*
Author to whom correspondence should be addressed.
Remote Sens. 2017, 9(7), 679; https://doi.org/10.3390/rs9070679
Submission received: 26 April 2017
/
Revised: 29 June 2017
/
Accepted: 29 June 2017
/
Published: 1 July 2017
(This article belongs to the Special Issue Remote Sensing for 3D Urban Morphology)
Abstract
:Building type information is crucial to many urban studies, including fine-resolution population estimation, urban planning, and management. Although scientists have developed many methods to extract buildings via remote sensing data, only a limited number of them focus on further classification of the extracted results. This paper presents a novel building type classification scheme based on the integration of building height information from LiDAR, textural, spectral, and geometric information from high-resolution remote sensing images, and super-object information from the integrated dataset. Building height information is firstly extracted from LiDAR point clouds using a progressive morphological filter and then combined with high-resolution images for object-oriented segmentation. Multi-resolution segmentation of the combined image is performed to collect super-object information, which provides more information for classification in the next step. Finally, the segmentation results, as well as their super-object information, are inputted into the random forest classifier to obtain building type classification results. The classification scheme proposed in this study is tested through applications in two urban village areas, a type of slum-like land use characterized by dense buildings of different types, heights, and sizes, in Guangzhou, China. Segment level classification of the study area and validation area reached accuracies of 80.02% and 76.85%, respectively, while the building-level results reached accuracies of 98.15% and 87.50%, respectively. The results indicate that the proposed building type classification scheme has great potential for application in areas with multiple building types and complex backgrounds. This study also proves that both building height information and super-object information play important roles in building type classification. More accurate results could be obtained by incorporating building height information and super-object information and using the random forest classifier.

1. Introduction
Urbanization is an inevitable trend of socioeconomic development, especially in developing countries like China, which can be reflected from the spread of urban built-up areas and the evolution of city structure. “Urban village”, a typical region formed due to the rapid urbanization of cities, appears in both the outskirts and downtown areas of many major Chinese cities, such as Guangzhou and Shenzhen. Although urban villages in China and mega-slums in other developing countries are caused by different reasons, they share some similarities in their structures and patterns. They all have compact patterns, irregular distributions, and various building types within limited spaces [1,2,3]. Therefore, study of the urban context of these areas can further help with the understanding and investigation of urbanization and socioeconomic development in developing countries.
As the foremost element of urban landscape, urban buildings are of great research importance in urban management, landscape architecture, and social economy [4]. Fast and accurate acquisition of the spatial distribution, structure, and type information of urban buildings is a principal and fundamental requirement for urban studies in order to analyze and understand characteristics, patterns, and driving forces of the urbanization process, as well as facilitate urban planning, urban management, and decision-making [5].
Remote sensing technology makes it possible to acquire building information rapidly and accurately from different perspectives, different scales, and different dimensions. The fast-developing high-resolution images (HRI) and Light Detection and Ranging (LiDAR) have provided ideal data sources for remote sensing building extraction. HRI could provide detailed spatial information including texture, color, and shape, as well as certain spectral information [6]. Meanwhile, its lack of height information can be compensated by LiDAR data, which display building information from three-dimensional aspects, but has limited spectral information. Naturally, integration of HRI and LiDAR data serves as an ideal option for extracting building information. As a matter of fact, there have been quite a large number of published papers in this area. Most of these studies focus on the extraction of buildings’ 3D information. For example, Nevatia integrated LiDAR point clouds and the building outline of HRI to extract 3D building information [7]. Rottensteiner built a hierarchical robust difference model to construct digital surface models for extraction and projected roof edge models generated from LiDAR data back to aerial images to further increase the accuracy [8,9]. Chen et al. built a set of point clouds for each building in LiDAR and then used these sets to detect boundaries and directions of buildings in HRI [10]. Antje Thiele also pointed out in her work that integrative use of multi-source data can significantly improve building reconstruction quality [11]. These studies have proved the superiority of using integrated HRI and LiDAR data over single data sources in extracting 3D building information. Some researchers have also focused on ways to improve the classification accuracy via additional features and information. One notable research direction is to use super-object information for remote sensing image extraction and classification. Super-object information refers to properties of the segment one pixel or sub-object is located within and its connection to that segment [12]. As an extension of the object-oriented classification, the super-object information method has been proved to be able to facilitate accurate HRI classifications [12,13,14].
Compared to the great progress in 3D building information extraction, it is only until recently that scientists began to show interest in classifying building types based on remote sensing data and techniques. Existing building type classification is usually performed to provide key information for estimating the population in a certain area [15]. Abellán built decision trees to classify different residential houses [16] according to the texture and shape of buildings. Block classification was employed by Qiu to distinguish single-, double-, and multi-floor family buildings through the building volumes from LiDAR data [17]. Some researchers used extracted morphological metrics to differentiate building types and then used the results for population estimation [18]. Yan et al. used phase analysis and 3D information to classify buildings according to their orientation, instead of their types [19]. These studies have resulted in meaningful exploration. However, most of them simply used background information or height information for classification and could only be applied to specific regions. Additionally, their accuracy of building type classification is not satisfactory yet and may further affect the accuracy of population estimations. In order to fully utilize the advantages of both LiDAR and HRI data, it is necessary to further explore topics such as decisive features of building type classification, approaches to acquire and integrate more sources of data, or the best performing classification model.
Based on integrated LiDAR and HRI data, we are hereby proposing a building type classification scheme for urban studies of urban villages or mega-slums in developing countries. This scheme integrates multiple methods following several steps. First, a progressive morphological filter, which was firstly developed by Zhang et al. to detect non-ground LiDAR measurements [20], is used in this study to identify and extract buildings from the grayscale grid image of elevations converted from the original LiDAR points. This is realized by gradually increasing the window size of the filter and using elevation difference thresholds. Second, data integration is performed by simply adding the grid layer of extracted buildings to the HRI data as a new band. Third, multi-resolution object-oriented segmentation is then performed to segment the integrated LiDAR and HRI data at different scales. The object-based image analysis approach segments an image, usually HRI, into relative homogeneous “segments”, which can provide rich spatial and contextual information, such as size, shape, texture, and topological relationships for accurate classification [21]. Multi-resolution object-oriented segmentation can produce a hierarchy in which segments generated at a fine scale are nested inside of segments generated at coarser scales. Spectral, texture, size, and shape information of the larger segments, referred to as super-objects, can be assigned to their sub-objects, i.e., the smaller segments nesting in them. Jonson and Xie have found that classification accuracy of HRI can be significantly improved by incorporating super-object information [12]. Therefore, we incorporated super-object information in the segmentation process of the integrated LiDAR and HRI data, to provide more information for classification. Finally, instead of using traditional supervised or unsupervised classification methods, we used a random forest algorithm to classify buildings into specific types based on segmentation results along with their super-object information. The random forest classifier is an ensemble classifier that uses a random subset of the input variables and a bootstrapped sample of the training data to perform a decision tree classification [22]. It has been widely used in many areas and has been shown to perform quite well for classifying remote sensing images [23,24]. Based on the segmentation-based classification results, the dominant building type in each single building is then calculated in light of the LiDAR building footprints. In order to prove the necessity of integrating LiDAR and HRI data, as well as the necessity of incorporating super-object information during classification, we used different data combinations to extract and classify buildings in the study area and compared the results. Comparison to another classification method, namely the support vector machine (SVM), was also included. Validation of the proposed scheme was performed through its application in a different area.
2. Data
The remotely-sensed data used in this research include LiDAR point cloud data and high spatial resolution orthoimagery data, both collected on 19 April 2014. Two areas are chosen in this study, one as the study area and the other as a site to validate the proposed method. The LiDAR data were produced at a point spacing of 0.1 m, with an accuracy of 15 cm. The highest point in the study area is at an absolute altitude of 26.73 m above the mean sea level and the lowest point is at an absolute altitude of 14.2 m. The altitude of the highest point in the validation district is 57 m. Digital Orthophoto Map products were elaborated and corrected from raw aerial photos captured by airplanes, and has three bands (red, green, and blue) with a spatial resolution of 0.1 m. Both the LiDAR data and the orthoimagery data were transformed into the datum of Xi’an 1980.
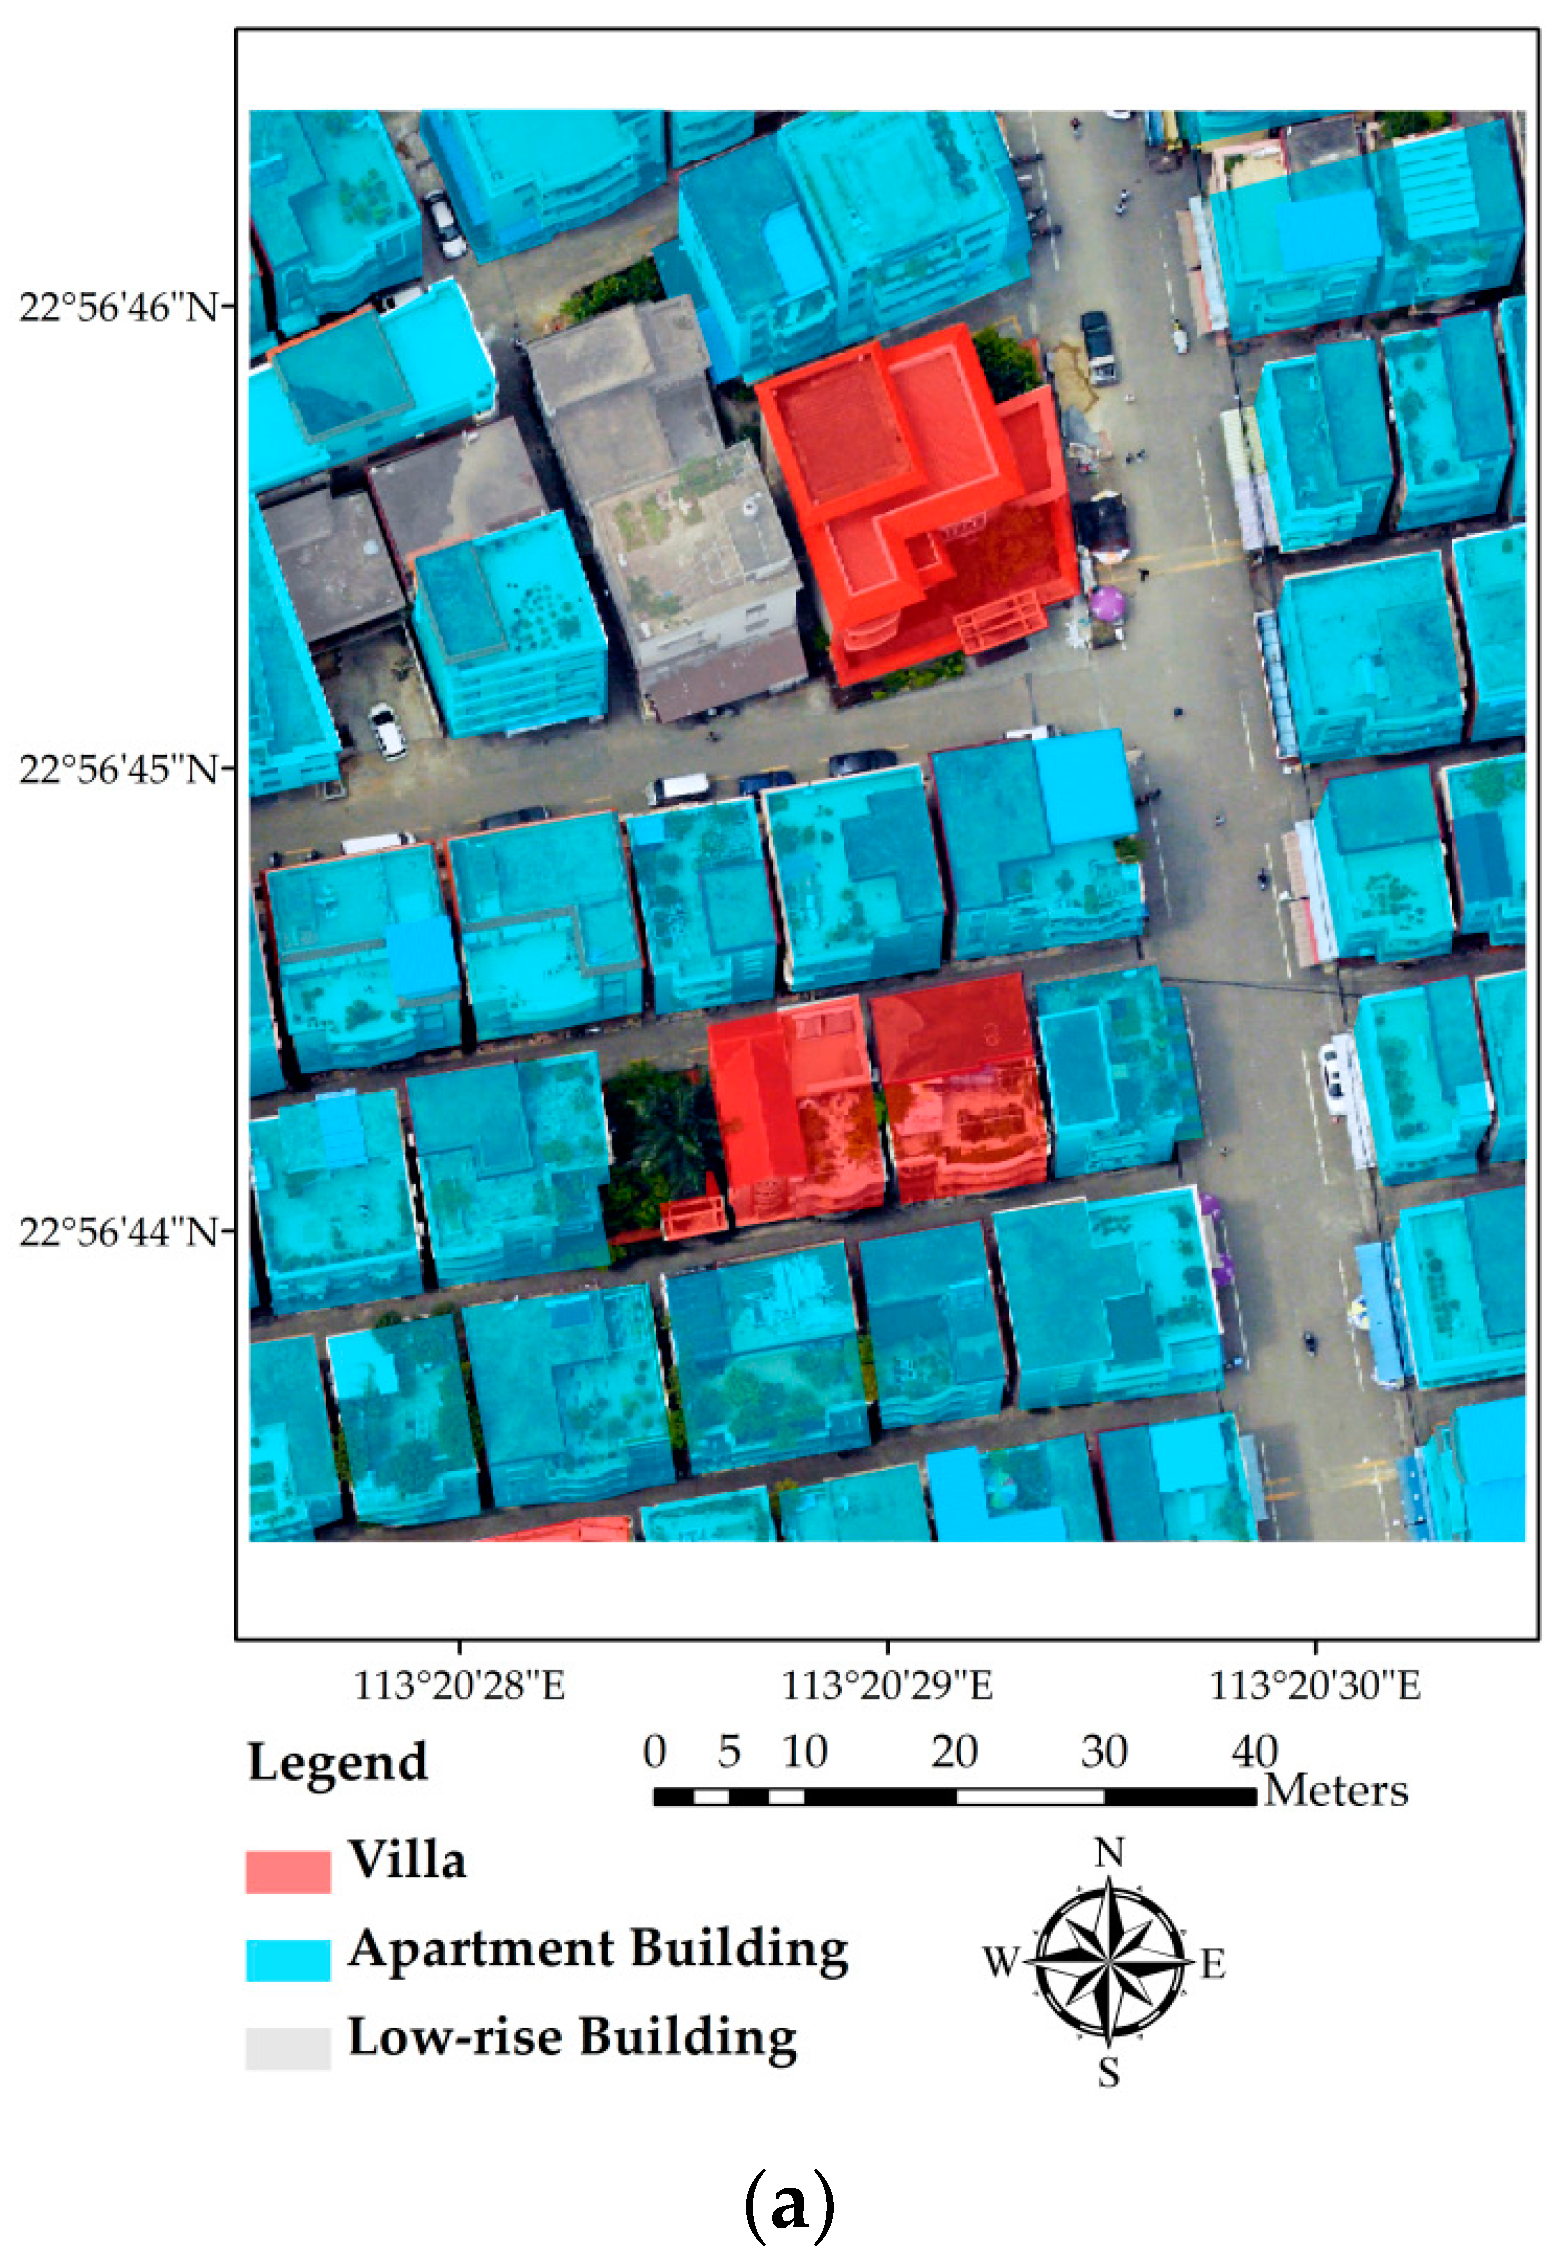
The study area we selected is located at Shiqiao street, around the downtown area of Panyu District, Guangzhou, Guangdong province, China (see Figure 1a). Buildings are the dominant landscape feature in this area, with some trees and green plants scattered among them. Other ground objects in this area include roads, driveway, parking lots, and cars. Buildings in this area are of different types. Most of them are apartment buildings; some are villas; a few others are low-rising buildings. We also selected another area in the same administrative district (Figure 1b) to validate our proposed method, which not only includes building types mentioned above, but also has some large factory buildings and car ports. Both of these two areas are within urban villages, surrounded by modern urban constructions. Differing from buildings in ordinary urban or rural areas, buildings in urban villages or slums are usually densely distributed and built in various shape, structure styles, roof/balcony styles, and building materials. Some buildings even have green plants grown on their roofs or balconies. All of these characteristics make it a difficult task to extract and classify buildings in the urban villages or slums. In this study, we especially chose these two areas to test the adaptability of our proposed building classification scheme for the sake of providing a globally applicable method of building classification for urban villages and slums in developing countries.
3. Methods
Building height is one of the most important and effective indicators to identify building types. However, it has not been fully utilized in building type classification studies [25]. In this study, building height information is firstly extracted from LiDAR data using a morphological progressive filter, with the purpose of minimizing the interference of non-building areas in building classification. The extracted building height footprints are then integrated with HRI data as a supplementary band, so as to fully utilize the height information from LiDAR, as well as spatial, textural, and spectral information from HRI [26,27,28,29]. Object-oriented multi-resolution image segmentations are operated on the integrated data based on the height, texture, spatial and spectral information. Segments obtained in this step are then assigned with the super-objects information, i.e., the height, spectrum, texture, size, and shape information of their super-objects from coarser segmentations of the same scene. Finally, segmented patches, after connecting to their corresponding height, spectral, surface, geometric, spatial-relation information, as well as super-object features, are set as inputs when performing the random forest classification. The informative features could not only enhance the ability of the classifier to identify building type, but also increase the homogeneity of objects and their surroundings. As the classification is based on different building patches and it is difficult to interpret the result, further modification of results includes using the building outline extracted from the LiDAR building footprints as the boundary to calculate the dominant type of each individual building. A flowchart of this study is shown in Figure 2, with key steps described in the following subsections. Data processing and analysis are conducted in MATLAB R2015a (www.mathworks.com), ESRI ArcGIS 10.4 (www.esri.com/software/arcgis), and Trimble eCognition (www.ecognition.com).
3.1. Building Extraction
3.1.1. Conversion from LiDAR Point Clouds to the Height Raster Image
LiDAR point clouds store height information of each building, which serves as an important feature to differentiate buildings from other urban constructions. However, it is difficult to use the point cloud data directly. Therefore, the LiDAR point clouds are firstly converted to a height raster layer. Due to the irregular distribution of LiDAR points, some cells in the converted raster layer may contain more than one point or no point at all. We followed three rules during the conversion process [30]: (1) the cell size of the height raster should be less than, or equal to, the average point space of the LiDAR data; (2) the value of a cell is determined by the height of the lowest point in that cell so that the erroneous or misleading height values produced by birds, clouds, or any other unnecessary objects could be removed; (3) when there is an empty cell, the value of that cell would be calculated by the nearest neighbor interpolation, which assigns the average height of the other eight cells around that cell as its own height.
3.1.2. Progressive Morphological Building Extraction
In most cases, LiDAR-based building extraction uses LiDAR data only [31,32,33]. Some scholars have also integrated LiDAR and other sources of data [34,35,36,37] for extracting buildings. Although integrated data could provide more sources of information for building extraction, it also brings problems, like information redundancy and operation complexity. Therefore, using LiDAR only is still the first choice provided that the extraction accuracy is acceptable.
The progressive filter can adaptively adjust its threshold according to the relationship between the filter window size and the bandwidth of the height difference inside the filter window [20,38]. This filter can efficiently rule out ground pixels and other non-building pixels in light of the morphological features of each pixel and its neighboring pixels without manual intervention. In this study, we used the progressive morphological filter to process the height raster image derived in the last step and extract the buildings.
A suitable range of filter window sizes was first decided according to the compactness, aggregation, and proximity of the pixel, as well as the distance of different objects in the image. Then, progressive morphological iteration is executed to delineate building footprints with a step length of 1. The formula used to calculate the weight value of each pixel, proposed by Michel Morgan and Klaus Tempfli, was listed as follows [30]. The weight value determines if a pixel is inside a building area:
In the formula, k represents the sequence of the current window; S represents the size of the window; Smin and Smax refer to the minimum and maximum sizes of the filter window range selected in the first step; i is the sequence of cell; h is the height value of the current cell, while hmin is the minimum height value in the current window; HT means the height threshold set for the current window. According to Meilin Sun et al. [39], the height threshold is determined by:
where Hmax means the maximum value of the range of heights, H0 means the value of initial height, c refers to the size of the cell.
After this step, all of the building pixels would have low weights, while ground pixels and many other pixels containing low objects would have high weights. Finally, the building footprint is generated by filtering non-building pixels with a threshold.
In addition, the building footprint raster could be modified by applying a Laplacian filter. A possible kernel of this filter is defined as follows:
The filter can enhance the digital number (DN) values of building pixels in the image [40,41]. Sometimes, vegetation might mix with some low buildings. A Laplacian filter could efficiently distinguish these two kinds of objects and could clear out all of the confusing pixels at the cost of minimum information loss [42,43,44]. Additionally, the difference of heights among different buildings could also be stretched by employing this filter without disturbing their basic mathematical relationship.
3.2. Building Type Classification
3.2.1. Integration of LiDAR and HRI
Although building height is one of the most important features for classification of different buildings, it is difficult to get accurate building type classification results when solely using height information. Through data integration, it is possible to fully utilize height information from LiDAR, as well as spatial, textural, and spectral information from HRI.
According to the method in Section 3.1, a height raster image of building footprints is converted from original LiDAR data with non-building points being filtered out in order to minimize their interference to the building classification. The building footprints are then georeferenced with the HRI data to be in the same spatial range and resampled to the same spatial resolution of 0.1 m. Integration of the LiDAR and HRI data is then performed by stacking the building extraction layer with the HRI data as a supplementary feature layer. Four feature layers are obtained in total, with the red, green and blue bands showing the textural and geometric information and one band showing the height information. These two data are combined in this simple way, making the method easy to operate, and at the same time ensuring that the integration of building height information with textural and spectral information provides more information for building classification. Buildings can be more easily distinguished from their surrounding ground objects thanks to the apparent height differences. Higher classification accuracy can, hence, be expected.
3.2.2. Super-Object Information from Multi-Resolution Segmentation
Super-object information refers to the information contained by coarse segments, including spectrum, proximity, geometry, shape, texture, etc. By assigning super-object information to pixels or segments, characteristics of each fine scale segmentation could be prominently highlighted [12].
After the integration of two sources of data, object-oriented segmentation is operated on these bands, using the multi-resolution method in the Trimble eCognition software. The multi-resolution segmentation, starting from one small pixel, can merge small objects into a large one through a pair-wise clustering process [45]. In this study, the large scale segmentation serves as the super-object information and is related to the fine scale segmentation in order to enrich indications to classification and increase the accuracy of the method [13].
For this study, selected super-object information can be classified into three types: (1) geometry, which mainly contains extent, length, thickness, asymmetry, density, and compactness, describing the boundary and shape of each segmentation, as well as its neighborhood and its relation to the super-object; (2) band information, which mainly contains brightness, standard deviation, mean DN values, spectral and layer information; and (3) texture information, which contains the contrast information, angular second moment and correlation of gray level co-occurrence matrix, describing Haralick texture features of segments [46,47]. These three types of information could speak for most of the basic characteristics of spatial objects in the study area. On one hand, they can represent the two-dimensional information of HRI, quantifying spatial features of each object; on the other hand, they connect each independent object with its surrounding objects and improve the coverage and the ability of spatial expression of super-object information. Moreover, it is proven that the super-object information fits well with the 3D height information.
3.2.3. Random Forest Building Type Classification
Random forest classification is an ensemble method which could enhance the distinction between two different unclassified classes and distinguish their own features based on the results from several decision trees [48]. Every decision forest includes a set of expert tree classifiers, and all of these classifiers would, altogether, vote for the most probable class of an input vector [49]. Decision trees can summarize the features of those confusing objects to increase their distinctions [50]. Additionally, the classifier can correct each decision tree’s habit and choose the most popular classification. An appealing aspect of the random forest classifier is that it can avoid overfitting and can rapidly adapt to the training data. Moreover, the random forest classifier can still accurately estimate the missing samples and maintain its stable classification performance even when there is information loss [22]. Random forest classification has been widely used in areas of economics, geography, medical science, and signal engineering. As for its applications in remote sensing, Ham implemented two approaches within a binary hierarchical multi-classifier system, generalizing the random forest classifiers in an analysis of hyperspectral data [23]. Fan et al. extracted building areas from LiDAR point clouds using the random forest algorithm [51]. Bosch et al. explored the method of classifying images using object categories by combining multi-way SVM and random forest classification [52]. Nonetheless, all of these studies are simply using the random forest classifier for extracting building information, without further classifying these buildings into different types.
In general, the random forest classifier has better performance in urban building classification compared to other classifiers [53] due to the complex building structures in the urban area. Therefore, we incorporated the random forest classifier in this study to classify building types based on the building segmentations obtained in the last step. In this research, random forest classification is implemented in MATLAB R2015a using the corresponding package.
Located inside the “Urban Village”, both the study area and validation area have various types of buildings. Considering their pattern, volume fraction, building heights, as well as land use type, buildings are classified into the following categories: apartment building, villa, and low-rise building. In order to train the classifier, 164 object patches (17% of the total number) are randomly selected from the segmentation data. Seventy percent (70%) of these sample segmentations (117 patches) are used as the training set while the remaining samples are used for validation. The two main parameters of random forest method, namely number of trees and number of branches, are adjusted according to the out-of-bag error rate of the training samples. In the classification process of the study area, the number of trees is set as fifty, while the number of branches is set as three.
Random forest building type classification was executed after object-oriented segmentation of the combined data. The super-object information is appended to each patch from multi-resolution segmentation using the spatial joining tool in ESRI ArcGIS software. Patches in the training set, together with their properties and super-object information, are then input to the classifier. Selection and combination of different features are conducted randomly during the process. Features are randomly selected and then connected through random nodes to form unrelated trees and forests. By doing so, similarity and correlation among the trees are minimized. Therefore, trees can provide more decision-making supports when there are only a limited number of features relating to the buildings. Moreover, different linear sub-feature combinations are also tried to find the optimal feature space. The main steps of random forest classification [50,52] in this research are listed as follows:
- (1)
- Select training samples from the object-oriented segmentation results. The samples should cover all of the building types and contain building type information, as well as super-object information.
- (2)
- Build an initial unpruned tree for every single sample. Then every tree would modify itself and select the optimal type and branch when predicting the samples.
- (3)
- Predict the next building type according to the mean reversion and the maximum number of decision trees in the last round of prediction. The out-of-bag (OOB) error rate is calculated for the building classification results to assess the accuracy and performance of the training.
- (4)
- After the training process, all of these trained decision trees would be selected for the building classification of all of the data.
Since the random forest classification is performed at segment level, it is very possible that segments from a single building are classified into different building types. Therefore it is necessary to further process the segment-level classification results to get the building-level classification results. In this study, such building-level classification results were derived by assigning each building the dominant (in terms of area) building type of all the segmentations inside its outline.
4. Results
4.1. Building Extraction Results
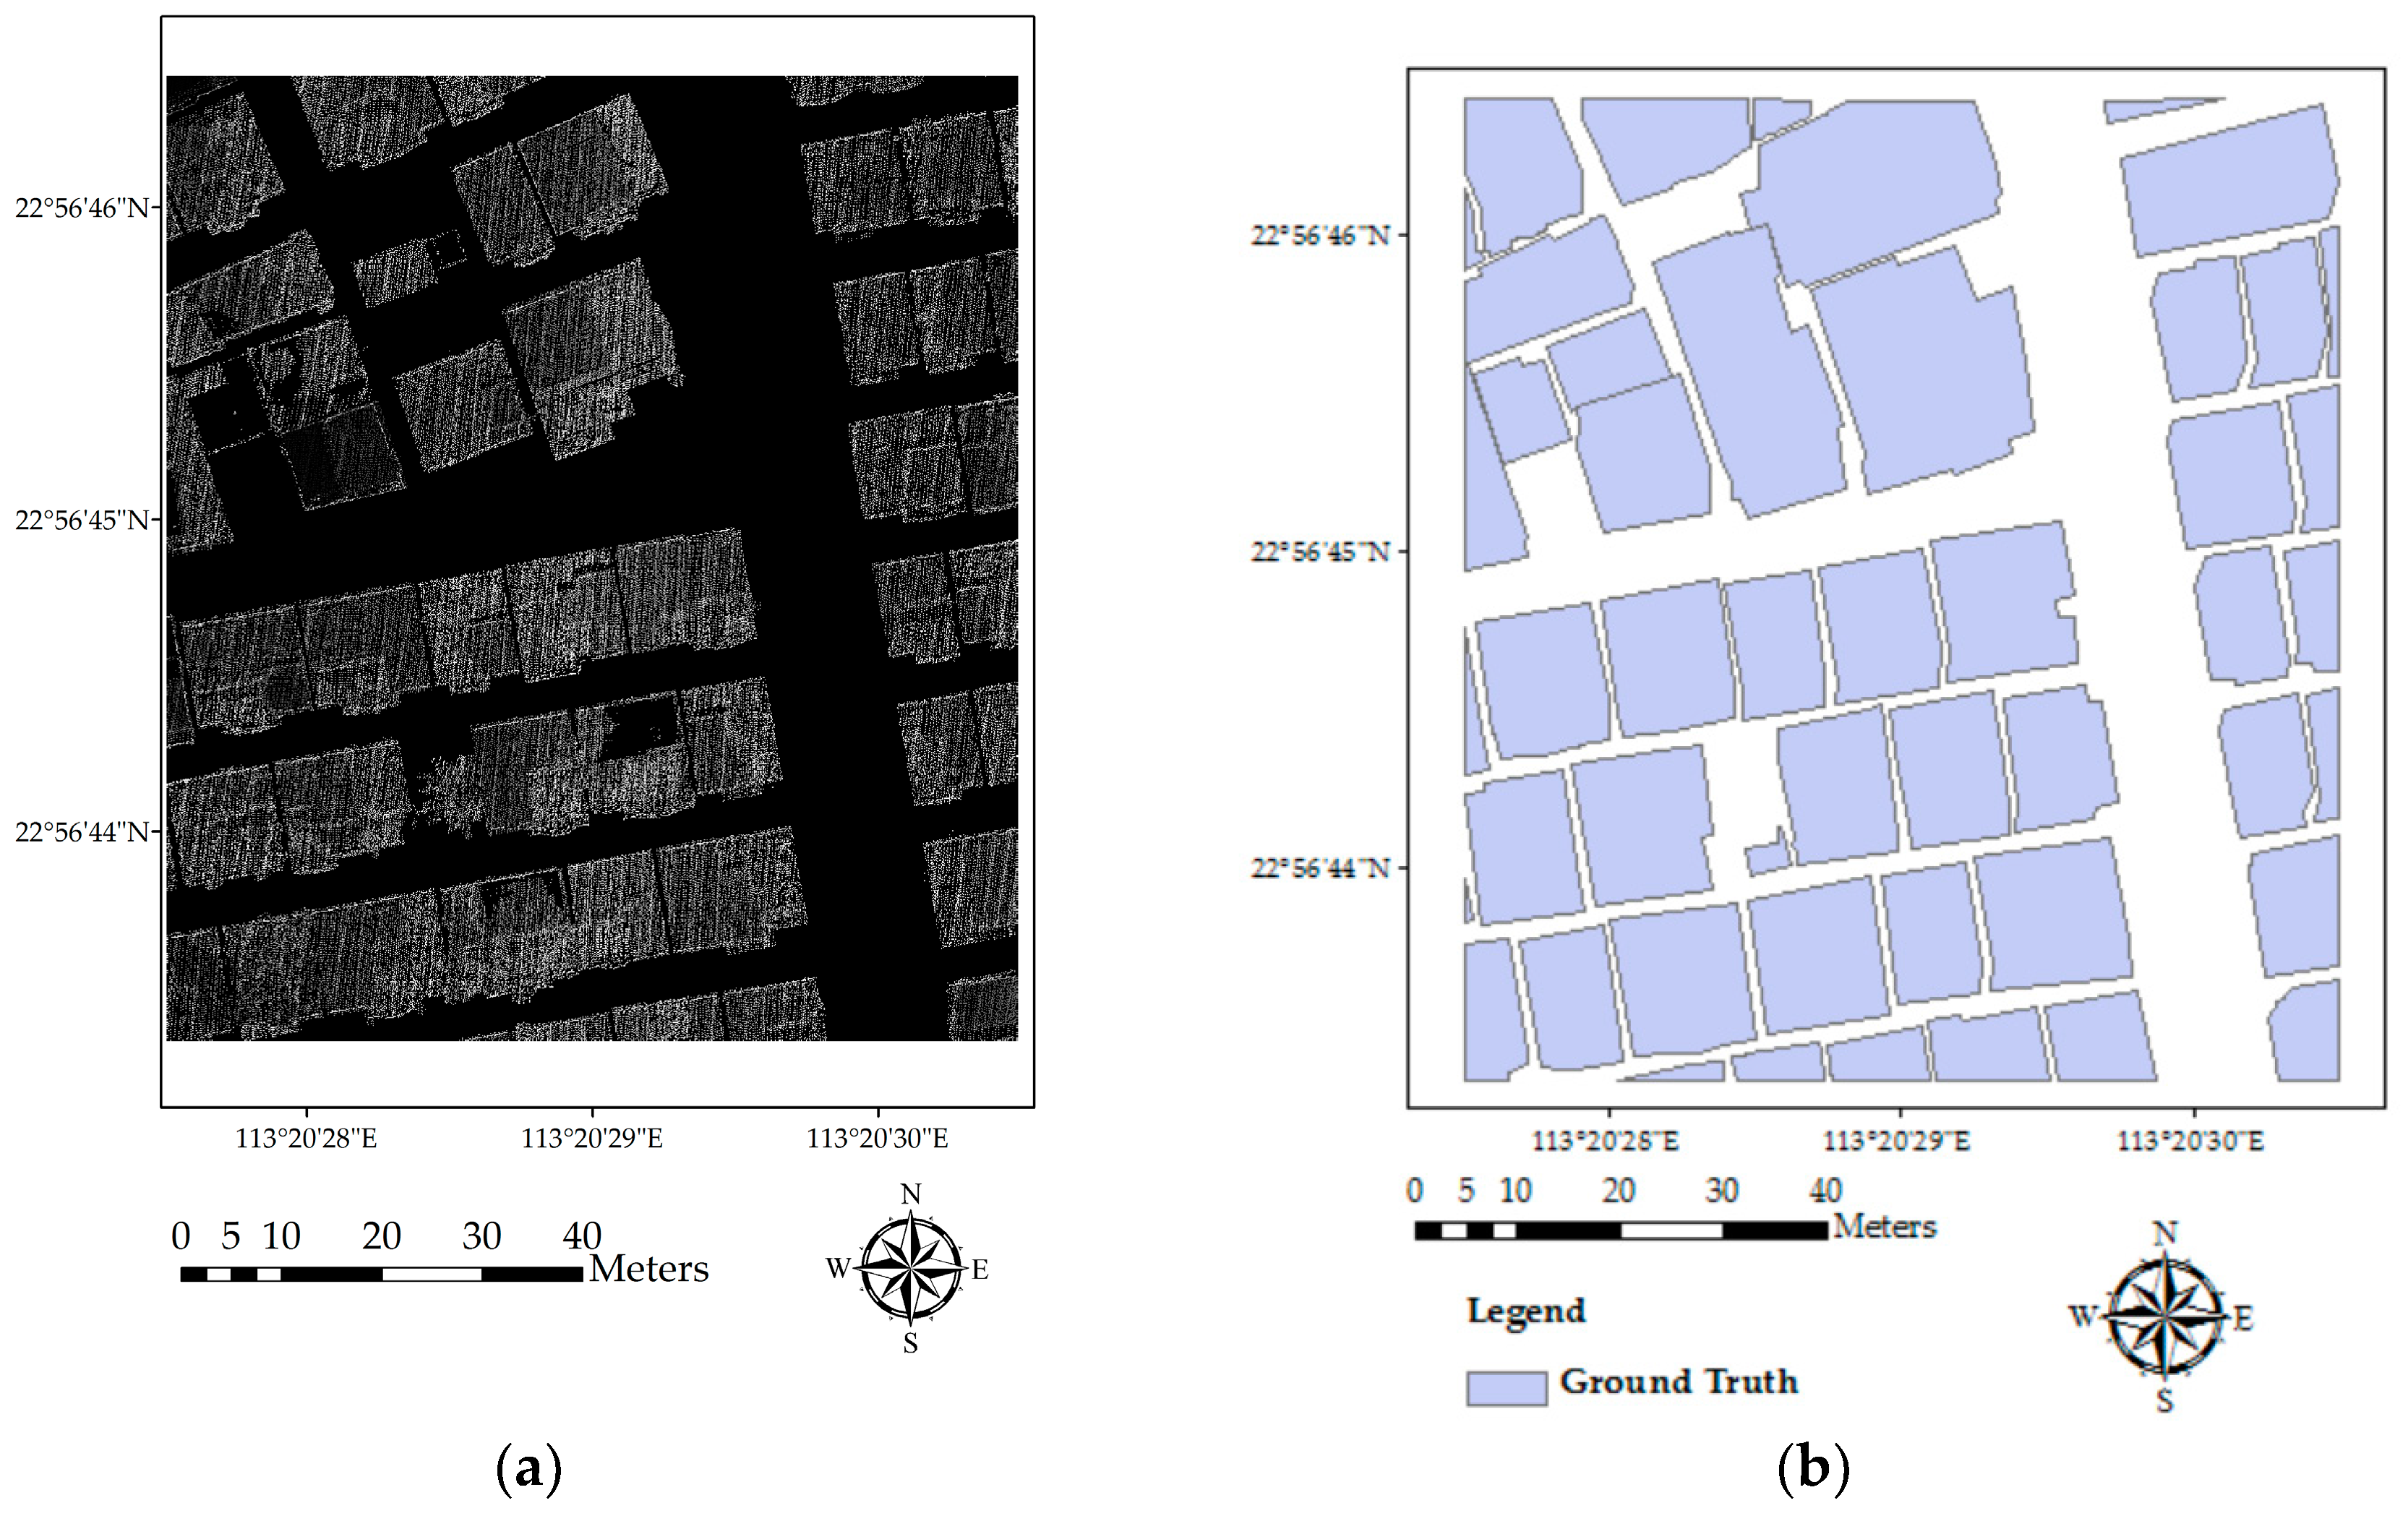
Building footprints, after being extracted by the progressive morphological filter and the Laplacian filter, are shown in Figure 3a. According to the method in Section 3.1.2, the weighting function would transform the DN values of pixels with high height values (buildings) into a low value range (0–0.3 in this study) close to 0 and the low height value pixels (ground points, low vegetation, and cars) into a high weight value range (0.85–1 in this study) close to 1, while extending the differences in DN values of those pixels in between (which are a few pixels sparsely distributed in this study area with values higher than low objects and lower than buildings). A separation threshold value of 0.5 is used to extract building areas.
The accuracy of the method is examined by comparing the extraction result with the visual interpretation result (Figure 3a,b). A Sobel filter is used to derive the outline raster from the extraction, which is then converted into a vector format and overlaid on the original orthophoto (Figure 3c). Apparently, the outlines fit the real building areas quite well, indicating that the method could help extract a complete outline of the building areas with high accuracy. Additionally, the shape and pattern of most buildings have been kept by using the progressive morphological algorithm.
Based on visual interpretation, there are 51 buildings in the study area. The method we used in this study extracted 52 buildings, with one building being left out, one non-building ground object being mistakenly classified as a building and two adjacent buildings recognized as one. The overall accuracy of extraction is about 92%.
In general, the method we used in this study can effectively extract roads and buildings at the same time filtering out several common sources of error in building extraction practices, such as cars and vegetation. However, tall trees around buildings and large plants on roofs are still difficult to filter out and may lead to inaccurate extraction results.
We selected four representative buildings (as labeled in Figure 3c) and calculated the coordinates of their vertices to evaluate the accuracy of the extracted buildings’ locations. Table 1 shows offsets of the four buildings. Examining Figure 3 and Table 1, the following findings can be obtained: Building 1 has a relatively high accuracy in the X axis with minor offsets in the Y axis; Building 2 has three accurate vertices (northwest, southwest, and southeast), while the northwest vertex has a 2 m offset in the Y axis; the triangular part of Building 3 is accurately extracted, with very small offsets at all of the vertices; Building 4 covers most of the building area, with accurate vertices. However, the edge on the west side of the building is distorted under the influence of the tall tree over its roof. In addition, a comparison of the extracted outline with ground truth data of reference buildings is shown in Figure 3d. It is obvious that most of the buildings have been extracted accurately, with only two buildings being misrecognized.
4.2. Building Type Classification Results
The multi-resolution object oriented classification produces 941 segments in total, including non-building areas. One-hundred and sixty-four (164) sample segments were selected as training samples, distributed through the whole study area and covering all building types. Among these samples, there are 48 villas, 53 apartment buildings, 17 low-rise buildings, and 46 non-building areas. The non-building samples are mostly extended wooden frame, rain shelter etc. Spatial distribution of the selected samples is given in Figure 4. Most apartment building and low-rising building samples are evenly distributed, while villa samples are mainly located in the middle of the study area.
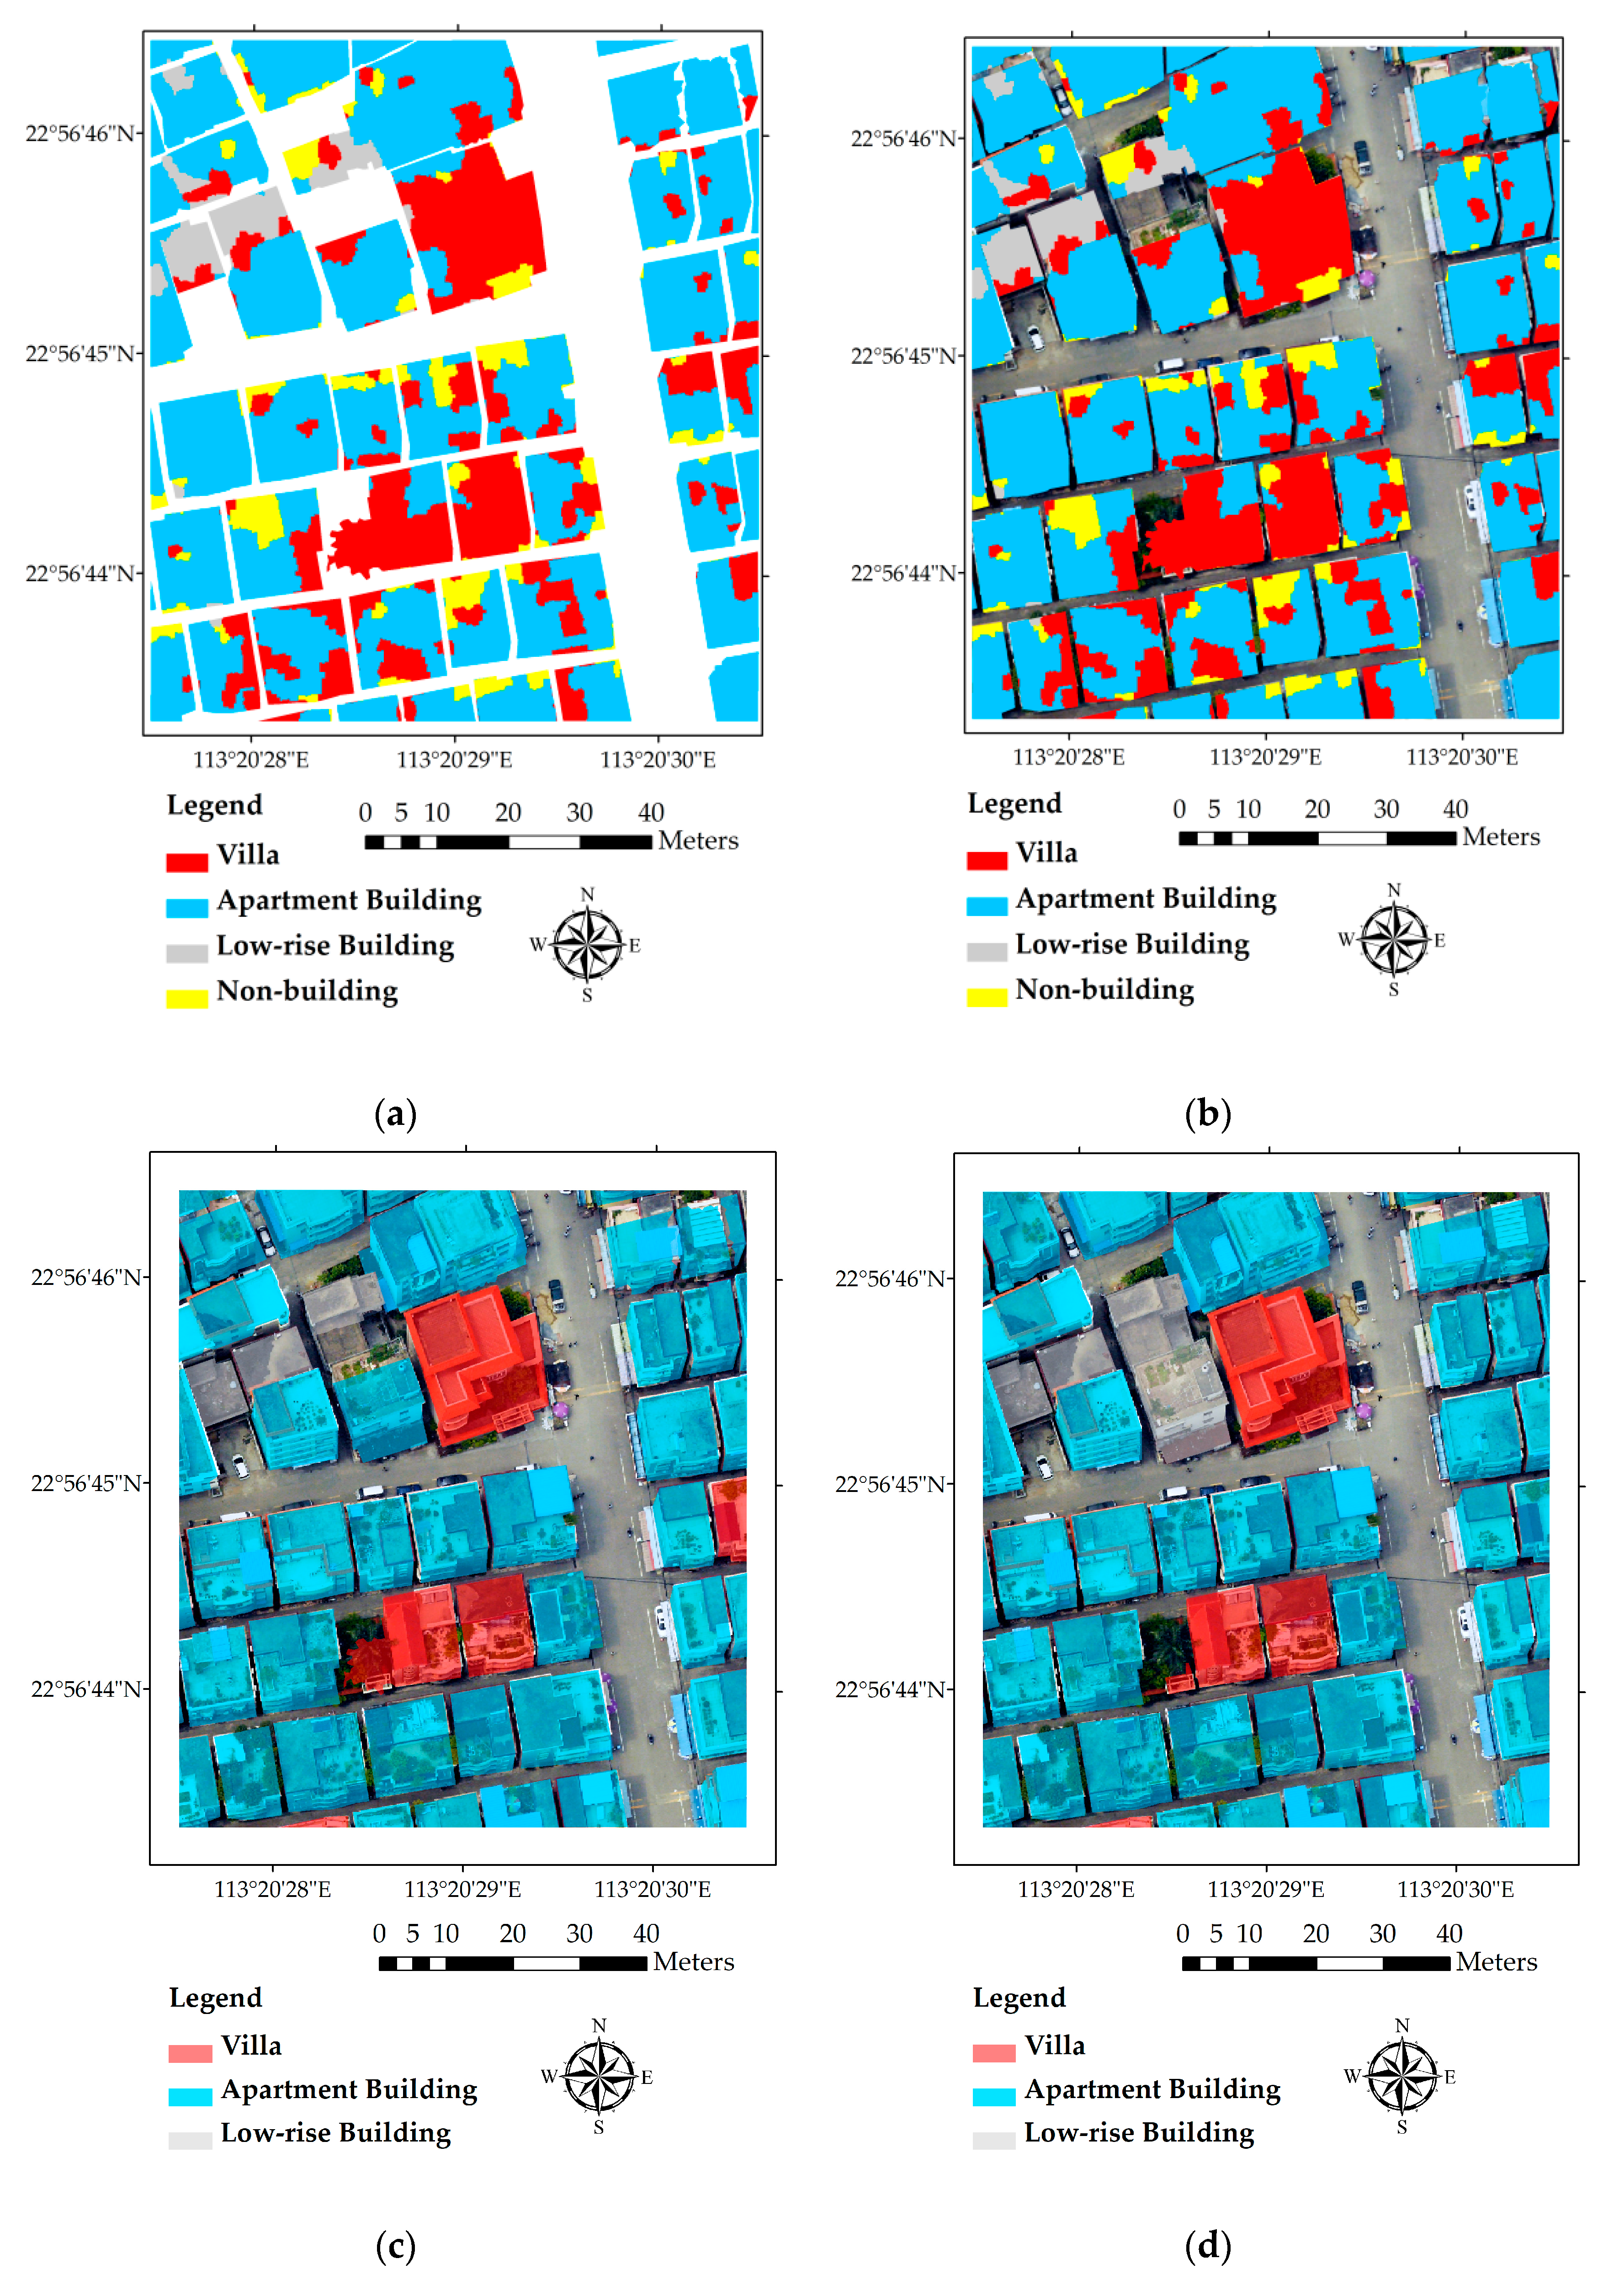
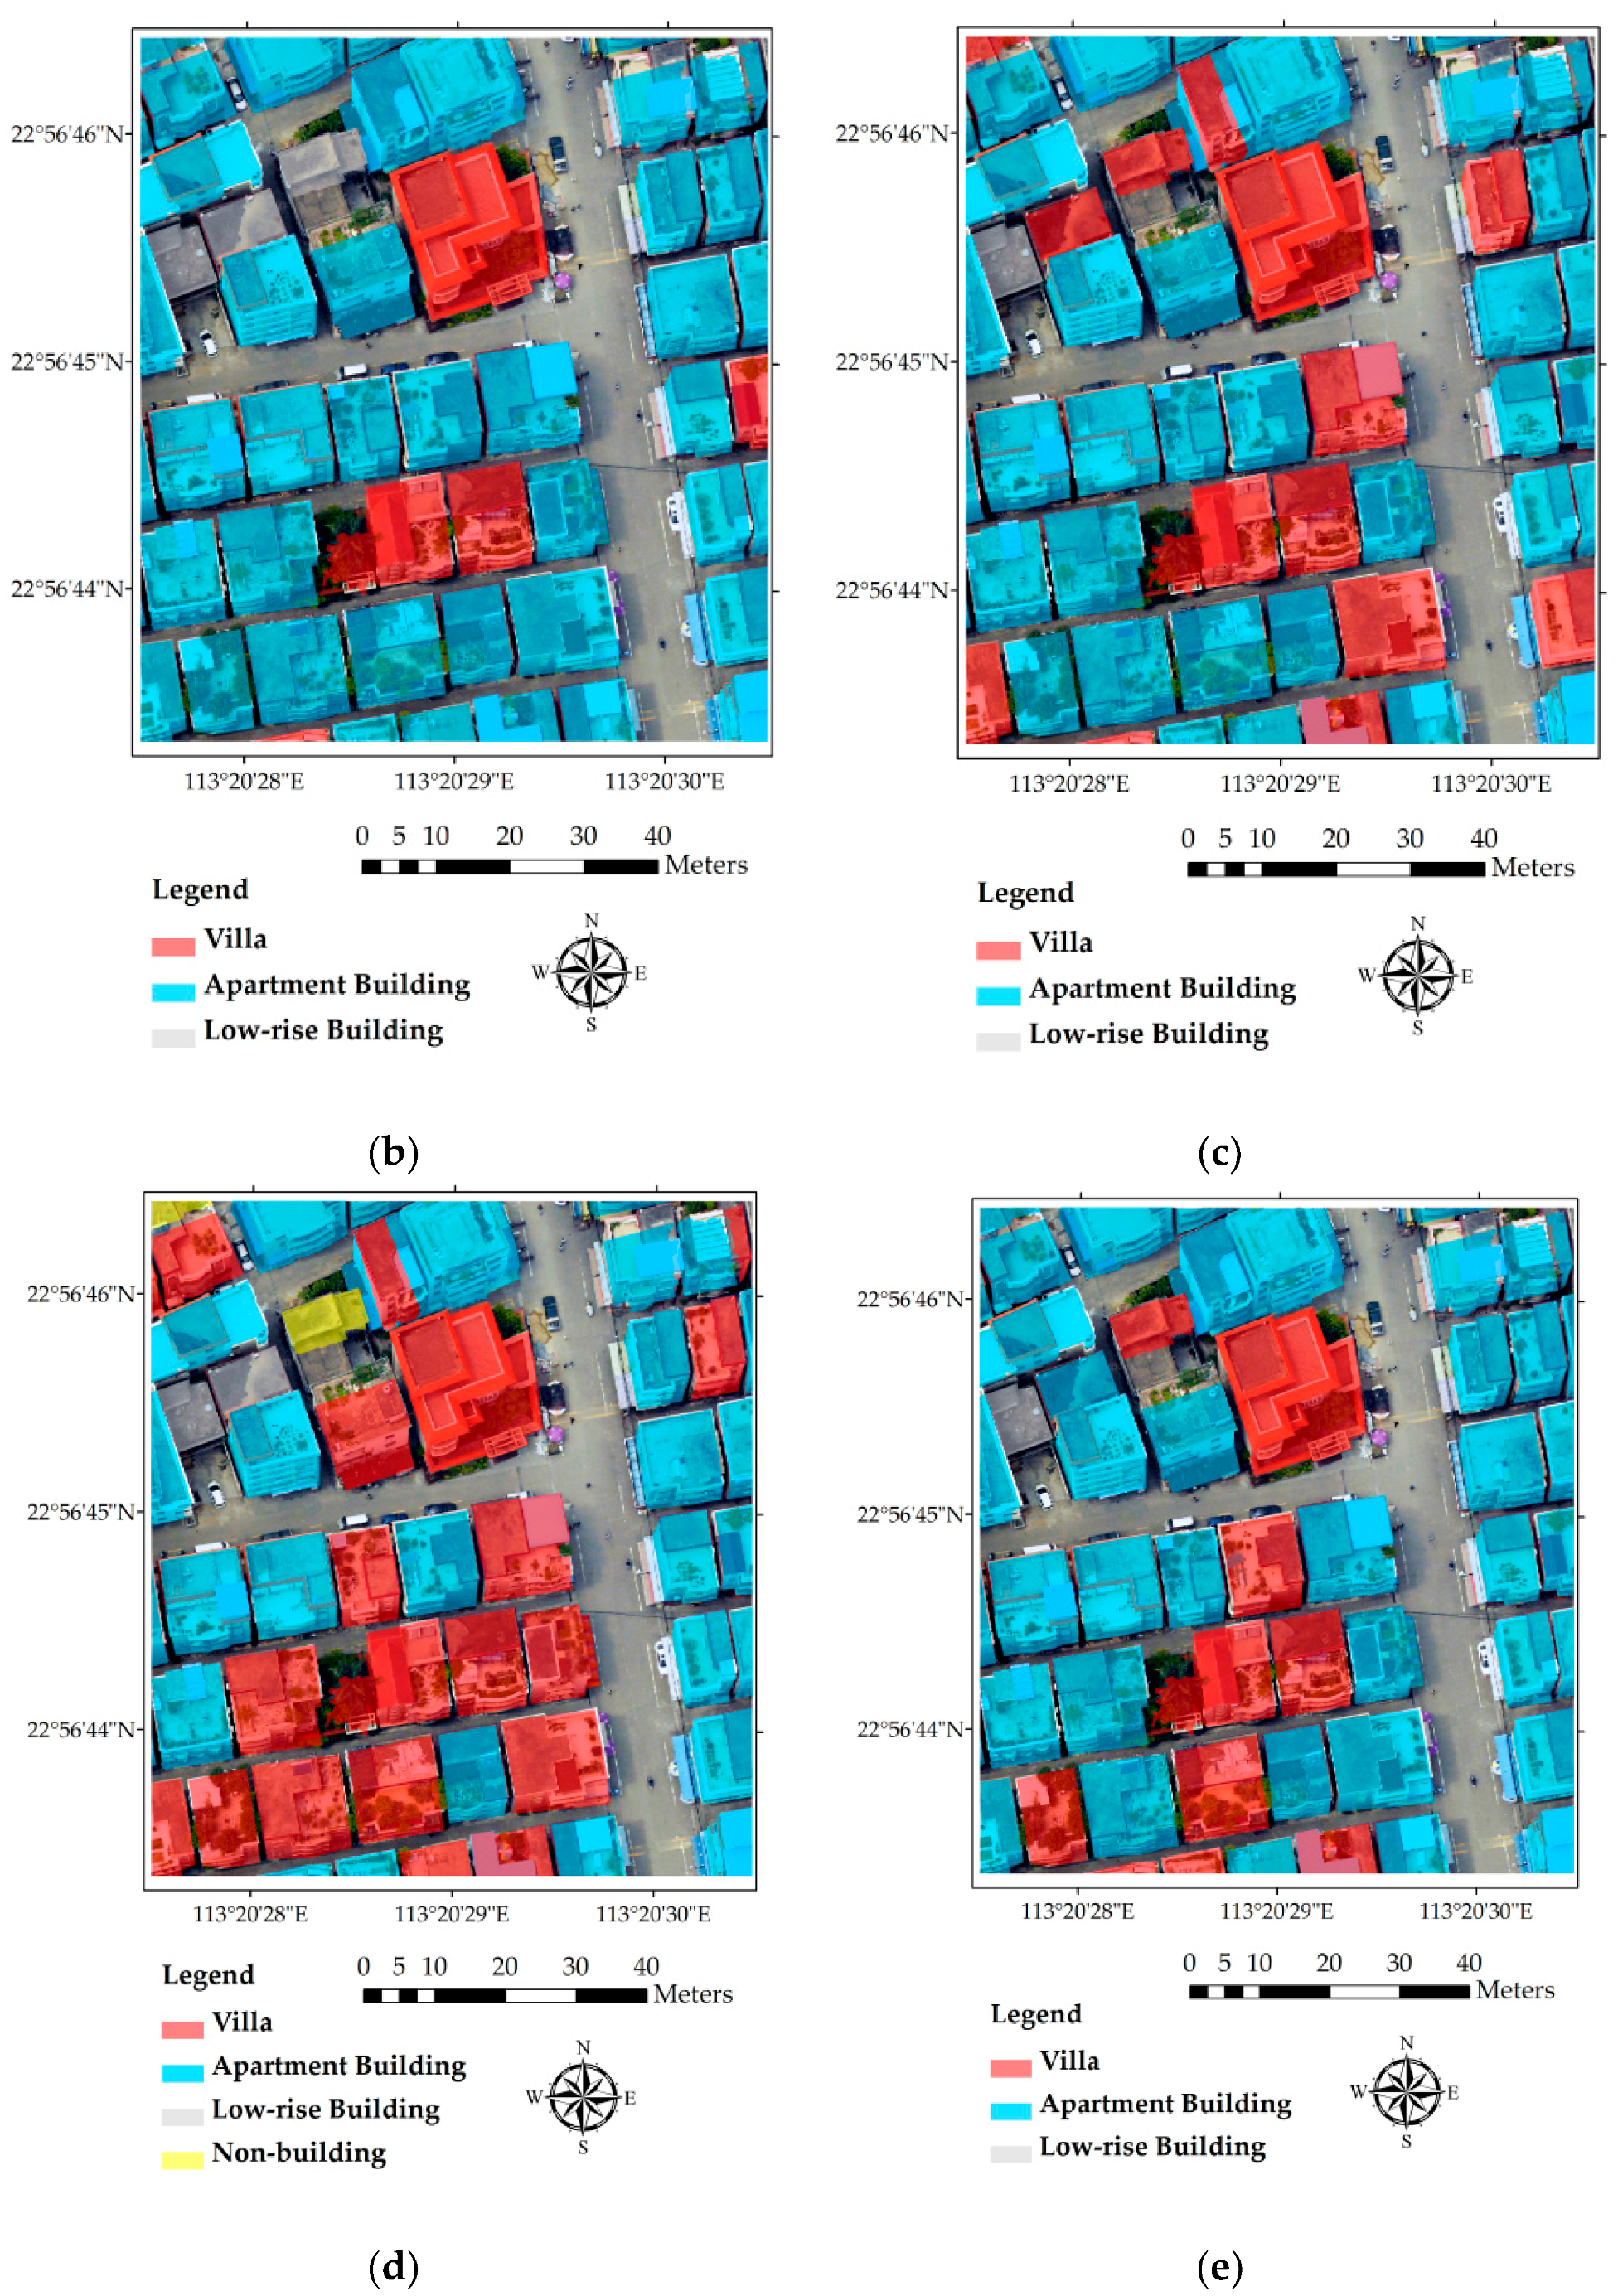
The classifier needs to be trained and modified before it is applied. Therefore, we select 70% of the total samples (117 segments) to construct the random forest model. The remaining samples are used for validating the classifier. Validation results show that the lowest OOB error rate (14.89%) was achieved when the branch number and tree number are set to 3 and 50, respectively. Segment-level and building-level classification results of the study area are shown in Figure 5a,c, respectively, comparisons with the original image and ground truth building type data are also included in Figure 5. Table 2 shows the confusion matrix of the segment-level classification results. For each building type, percentages of correctly-classified and incorrectly-classified segmentations are listed in the corresponding row. For instance, among all the segmentations classified as villa, 71.82% of them are correctly classified, while 16.82%, 2.27% and 9.09% of them are incorrectly classified as apartment building, low-rise building and non-building, respectively. For segmentations classified as apartment buildings, 82.57% of them are correctly classified, while 8.93% are incorrectly classified as villa. Confusion between villa and apartment building is apparent, probably because these two types are very similar. Their differences in many aspects, including size, appearance (especially view from the top) and height, are all very small. Percentages of correctly-classified low-rise building and non-building are not satisfactory either, which should be largely ascribed to inadequate training samples.
The imperfect segment level classification results are further processed using the method described in Section 3.2.3, i.e., assigning each building the dominant building type of all the segments inside its outline. Comparing Figure 5c with Figure 5d, it can be found that the building-level classification results are quite close to the ground truth. Among the extracted 54 buildings, only two apartment buildings at the corner are incorrectly classified as villas. Overall accuracy of the building-level results is 98.15%.
Table 3 shows accuracy assessment result of the segment-level classification. The overall accuracy is 80.02% and the Cohen’s Kappa Coefficient is 0.6971, which indicates that the classification method used in this study is reasonably accurate. From Table 2 and Table 3, it can be seen that apartment buildings are more likely to be identified accurately, compared to other building types. This is probably because apartment buildings are the most common building type in the study area and there are more training samples for the apartment building type. Moreover, the LiDAR data we used in this study provided a key feature of building height, since apartment buildings in the study area are usually taller than other types of buildings. The results prove again that different types of building with various heights can be more easily differentiated by combining LiDAR data with high-spatial resolution remote sensing images.
Table 4 presents the confusion matrix of building-level classification results of the study area. It can be noticed that the classification accuracy was greatly improved after assigning each building the dominant building type of all the segments inside its outline. Villas and low-rise buildings are all 100% recognized. As for apartment buildings, 97.87% of them are successfully identified, with only one misclassified as the villa. Using the building type classification scheme proposed in this paper, the building-level classification of the study area reached an overall accuracy of 98.15% and a kappa coefficient of 0.9255.
4.3. Validation
In the study area, there are only three types of buildings, most of which are distributed uniformly in the region. In order to validate the proposed method’s applicability in other areas, we selected another area in the same district, which has more types of buildings and heterogeneous distribution. As shown in Figure 1b, the northern part of the validation area consists of dense “urban village” buildings, mostly apartments and several low-rise buildings, while the southern part has more open space and fewer buildings, with two factory buildings and a row of carports. It should be noted that the terrain in the south is apparently higher than that in the north. There are a line of trees standing between these two parts, as well as some separately distributed in the southern part.
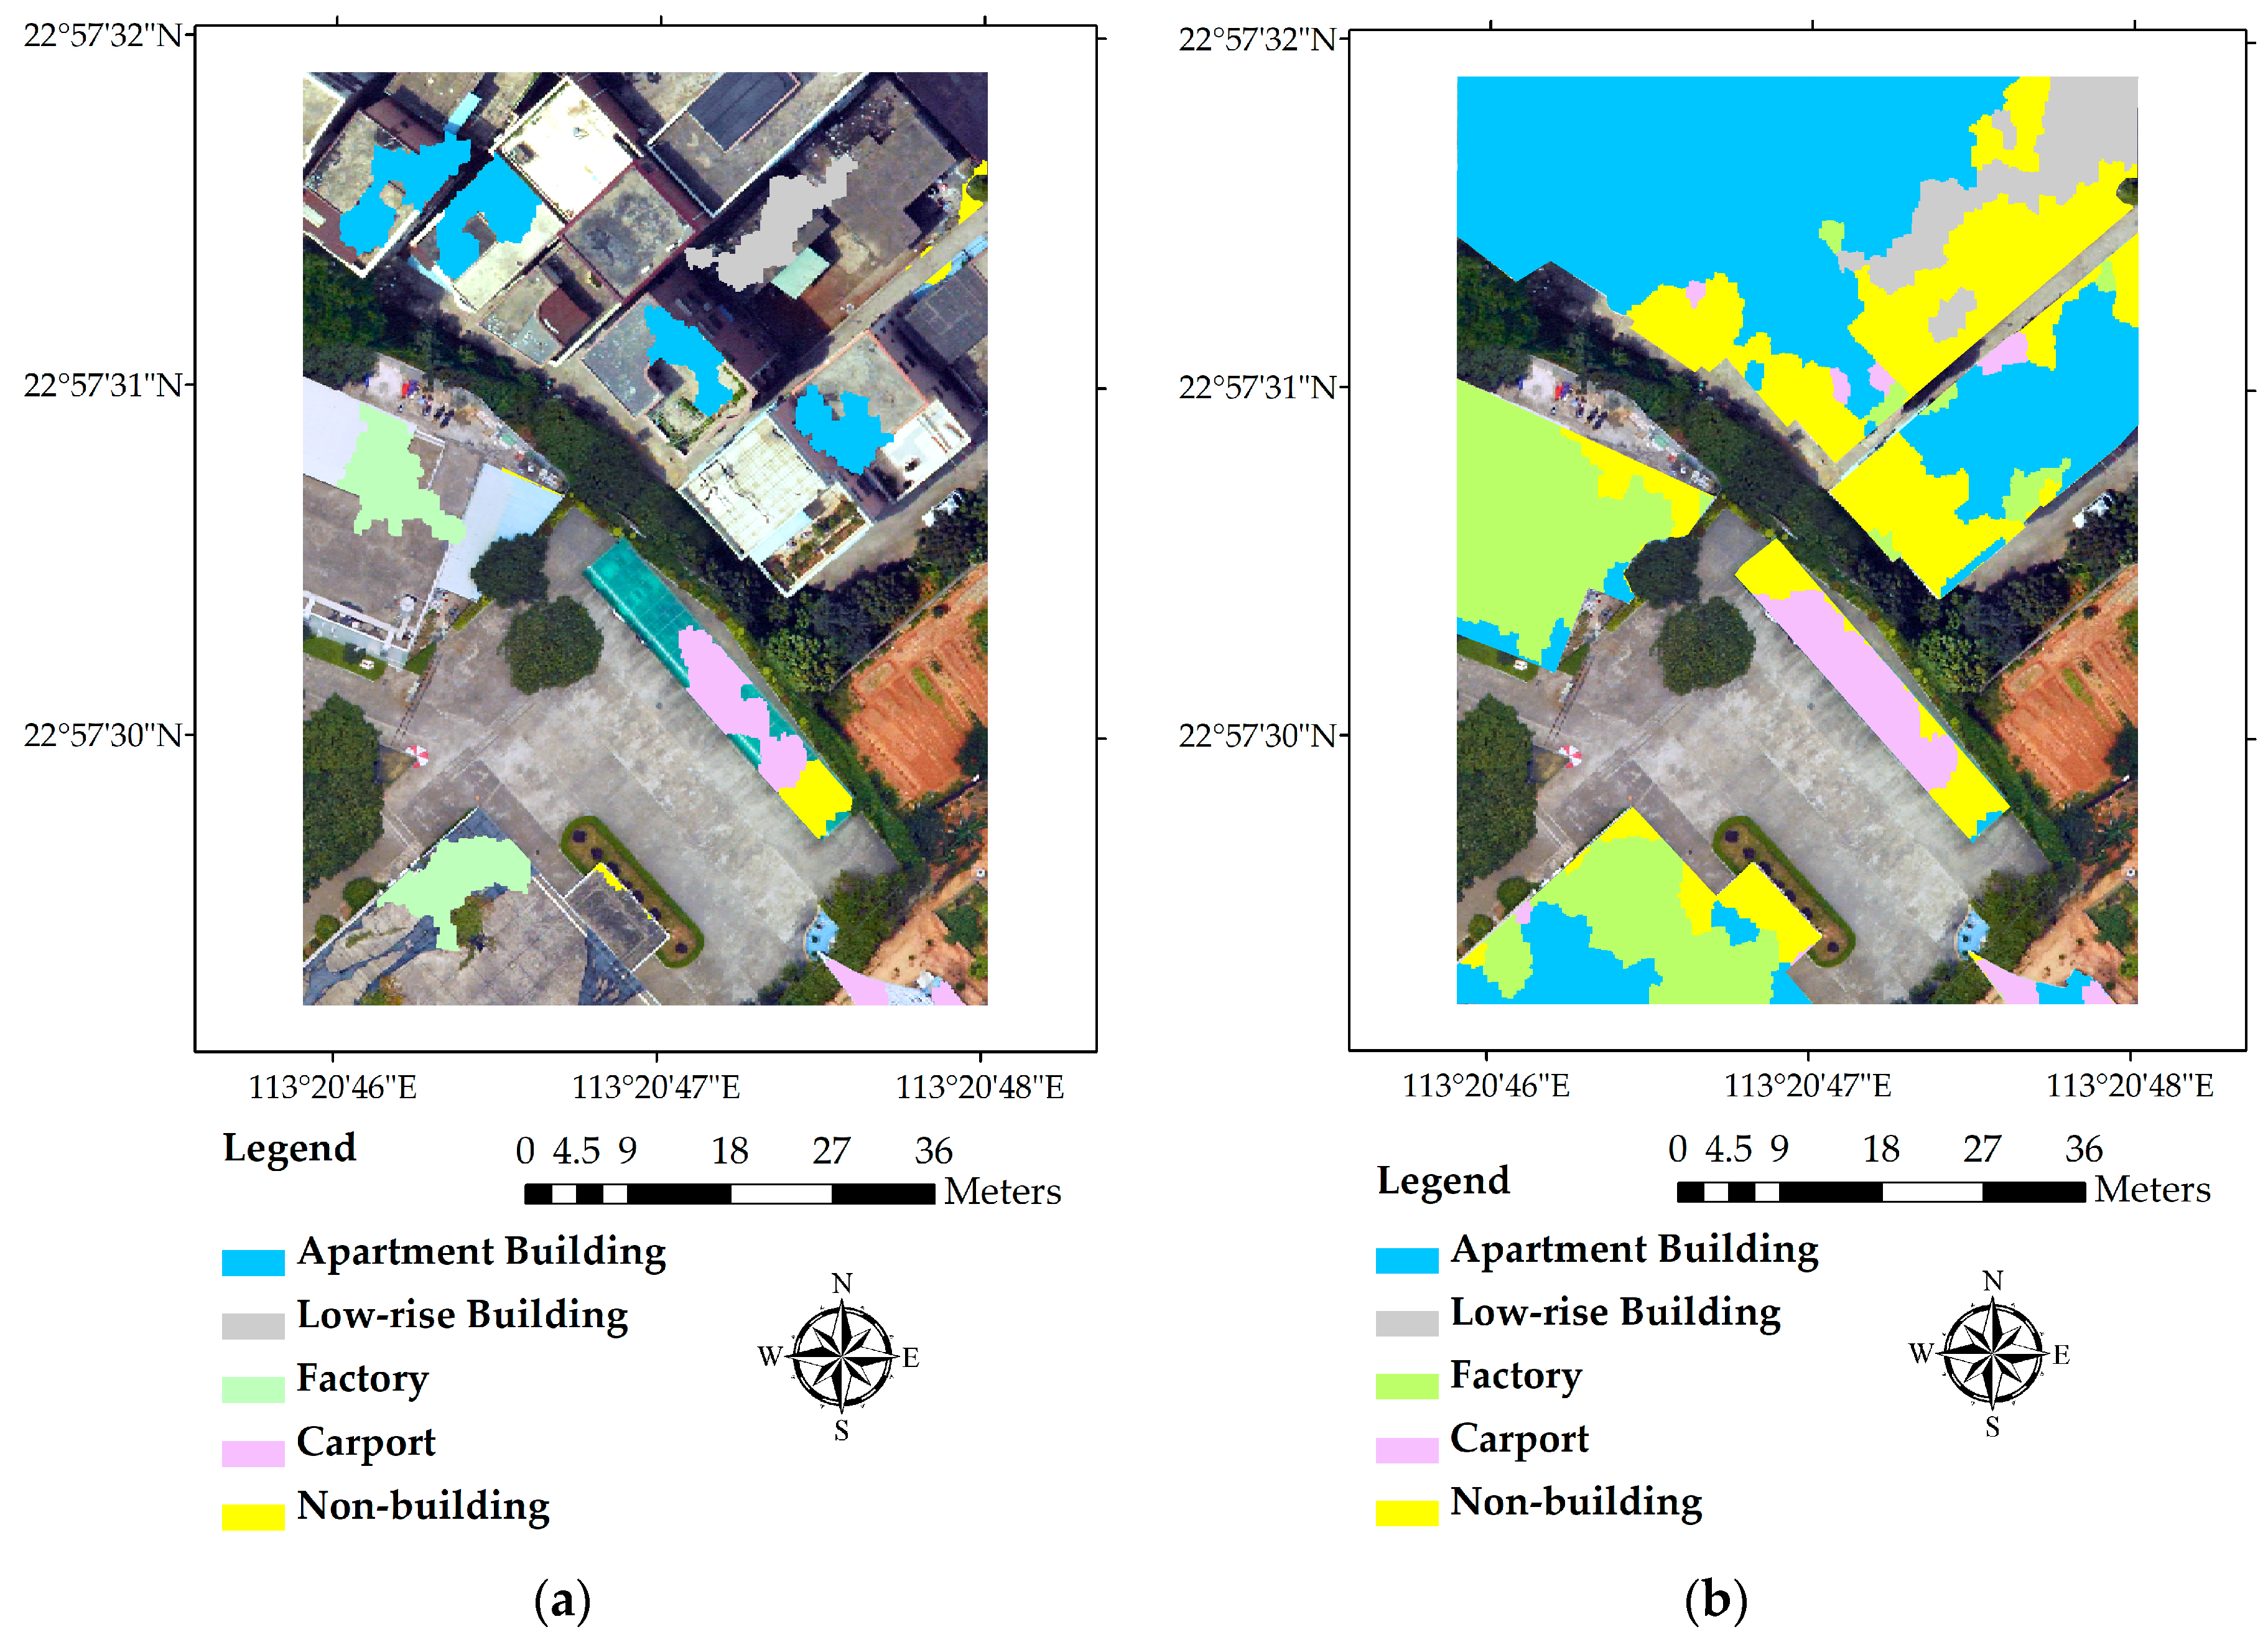
Buildings in the validation area are categorized into four types: apartment buildings, factory buildings, low-rise buildings and car ports. Other features, like vegetation, bare soil, roads, and cars were all classified as non-buildings. Eighty-eight (88) segmentation samples were selected randomly before classification, which include 18 apartment building segments, eight low-rise building segments, 15 factory building segments, nine carport segments, and 39 non-building segments. Overall, samples selected are evenly distributed across the space for each building type. A stable OOB error rate of 10.71% was achieved when the number of branches and trees were set as 10 and 100, respectively. The OOB error rate of the validation area is even lower than that of the study area.
As is shown in Figure 6a,b, the proposed method could effectively classify most of the buildings in the validation area, although some low-rise building segments and carport segments were missing or incorrectly identified as other types. The confusion between low-rise buildings and other types might be resulted by the uneven terrain of the validation area. With the lowest point in one part taller than the highest point in the other part, it would inevitably lead to some confusion for the classifier, which uses absolute heights to differentiate buildings. Another possible reason may be that there are not enough samples for low-rise buildings and carports to train the classifiers. The building-level classification result and ground truth are shown in Figure 6c,d, which proves that our classification scheme works well in the validation area. Overall accuracies of the segment-level classification and building-level classification of the validation area are 76.85% and 87.50%, respectively.
5. Discussion
5.1. Effects of Different Data Combinations
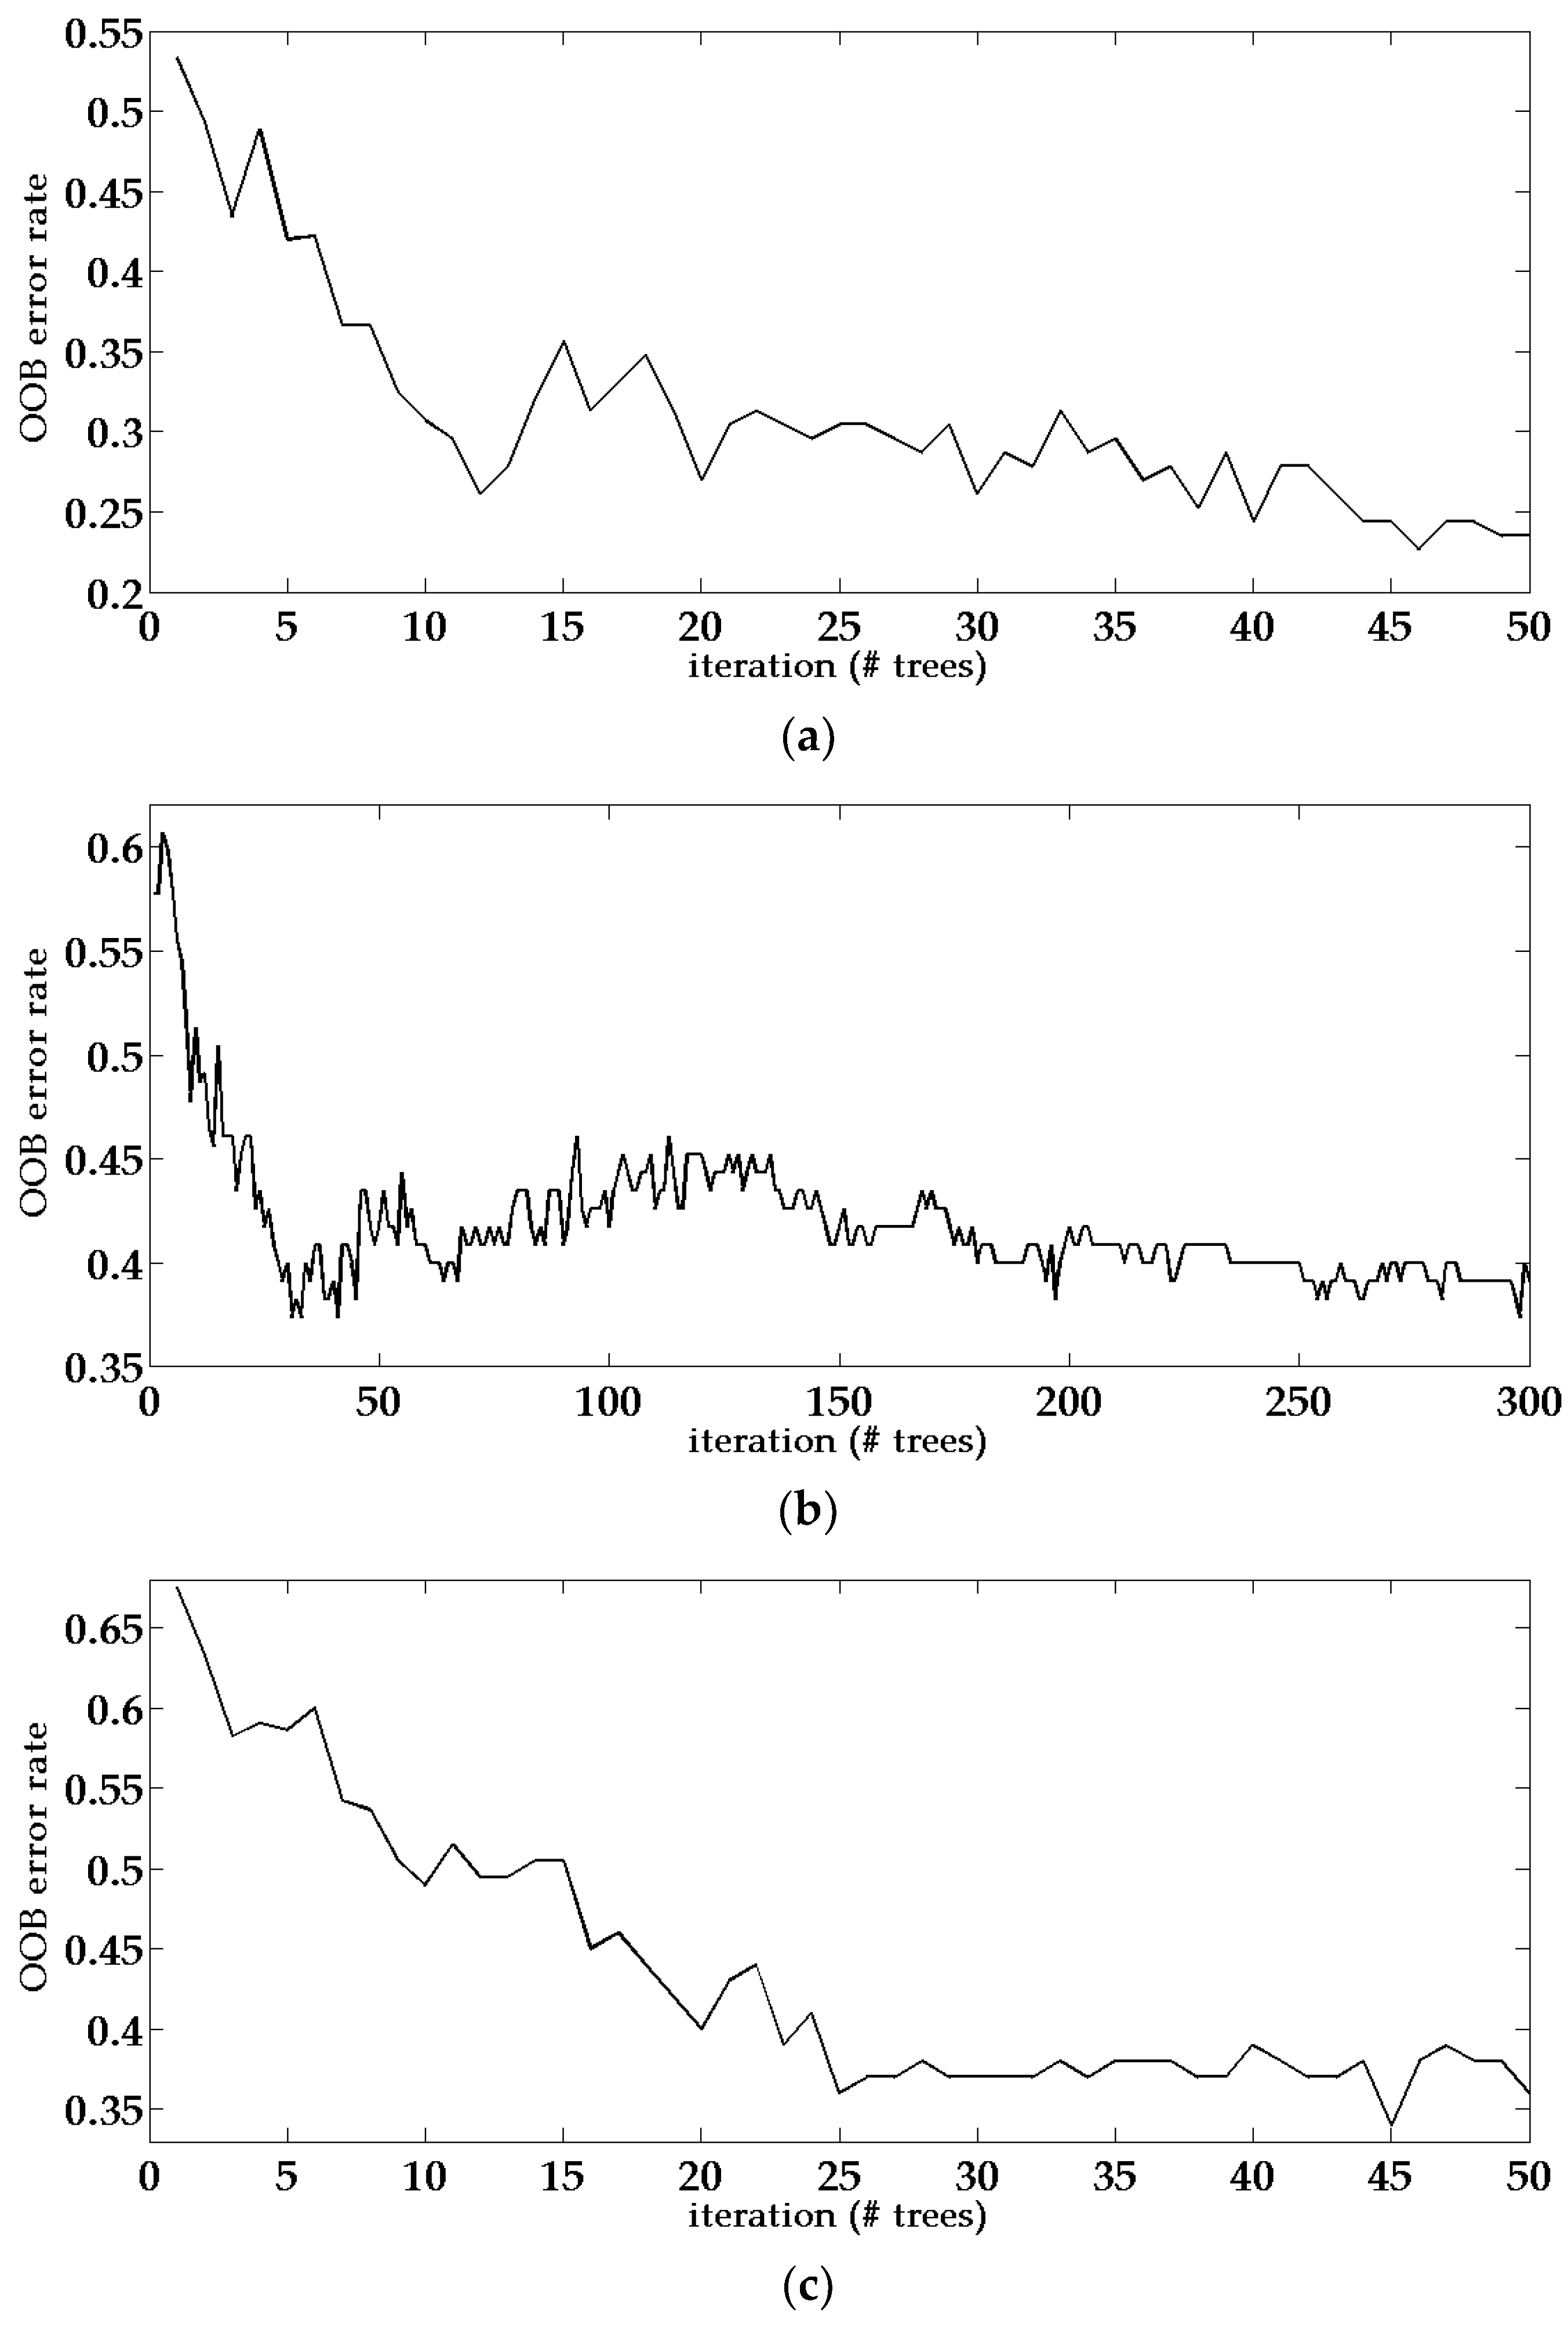
In order to further examine the effects of using integrated LiDAR and HRI data and incorporating super-object information on building type classification, we compared the performance of random forest classifiers with different data sources, namely only using LiDAR data, only using HRI, using integrated LiDAR and HRI data, and using integrated data with super-object information. Apart from the number of trees and the number of branches, other settings of the classifier are kept the same, including parameters like the randomizer seed, the maximum node size, as well as the input of training samples [49]. Table 5 shows a comparison of the OOB error rate and two key parameters of the random forest classifier, i.e., number of trees and branches, when four different data combinations are used.
From Figure 7 and Table 5, it could be found that the out-of-bag (OOB) error rates are both around 30% when using LiDAR or HRI data only. Performance using only HRI is relatively better than using only LiDAR data, since the HRI data can provide more information like color, texture, and spectrum to the classifier. The integrated data combines height information from LiDAR data with features from HRI data and has an even lower OOB error rate. When super-object information is incorporated into the integrated data, background information from different scales provides more features and information, hence produces the lowest OOB error rate. Meanwhile, the number of trees and branches are also the smallest among the four conditions, indicating that the classification method based on integrated data with super-object information is not only accurate but also computationally efficient. Figure 7 shows the changing curve of the OOB error rate during iterations of each method.
The segment-level classification results (Figure 8) were all processed to derive the final building-level classification results (Figure 9), based on the dominant building type of each building. F statistics, a common method used to test binary classification [54], was then used to assess the results. Precision and recall, two indices of the F statistics method used to measure accuracy, were calculated for each building type classified from different data combinations. The F1 score, which is an integrative index of recall and precision, was also calculated using the following equation:
where P represents precision, R represents recall. Precision is defined as ratio of the number of correct positive results to the number of positive results, while recall is defined as ratio of the number of correct positive results to the number of positive results that are supposed to be obtained.
The F statistics results are listed in Table 6. It can be easily noticed that the classification result based on integrated LiDAR and HRI with super-object information has the best performance. The F1 scores for villa, apartment building and low-rise building are 75%, 97.9%, and 100%, respectively, which are all the highest among the four different data combinations.
This comparison proves again that the integrative use of LiDAR and HRI data in building type classification yields more accurate results compared to using a single data source. The OOB error rate is significantly reduced when integrated data are used. Another finding of the comparison is that incorporating super-object information to the integrated LiDAR and HRI helps further improving the random forest classifier’s performance, with even lower OOB error rates and less misclassified segments.
5.2. Comparison of Different Classification Methods
Many supervised learning methods have been developed and applied for remote sensing classification in last two decades. Among these methods, both the random forest and the SVM have been proved as excellent classifiers [50,55]. Both classifiers have certain advantages. For example, the SVM works well with small training data sets; the random forest is simpler to train for a practitioner because it requires only two parameters to be set, whereas the SVM require a number of user-defined parameters [50]. In this part, we present a comparison of the building type classification results derived by the random forest and the SVM. Figure 10 shows both segment-level and building-level classification result derived from the SVM classifier, while Table 7 shows the corresponding confusion matrix (in percentage) of building-level classification.
The SVM building type classification is also performed using the integrated data with super-object information. The classification has an overall accuracy of 68.97%, with 649 out of 941 segments being correctly classified. As shown in Figure 10, the SVM classifier incorrectly classified many apartment building segments into other types, which resulted even more apparent mistakes in the building level result. As the confusion matrix in Table 7 shows, the percentages of correctly classified buildings are only 75.00% for villa, 70.21% for apartment building and 66.67% for low-rise building, respectively, which are all inferior to the results derived by the random forest classifier.
5.3. Advantages and Limitations of the Proposed Scheme
Compared with type classification methods based on other data sources (discussed in Section 5.1), the proposed scheme makes better use of the available classification features and is able to distinguish more complex building types. Performance of the classifier is also more stable. In addition to the commonly-used basic geometric and texture information [16,18], the proposed scheme takes spatial connection and autocorrelation of different image objects into consideration, which can serve as new classification features and enable the classifier to make decisions in a multi-dimensional aspect.
Most existing building type classification methods were applied in areas with relatively simple circumstances. Buildings were classified into a few types, such as single- and multiple-family buildings, single- and multiple-floor buildings, or north- and east-oriented buildings [17,19]. The proposed scheme, in contrast, was applied in a much more complex area, i.e., an “urban village”, one type of typical Chinese region that has an urban pattern similar to slums in other developing countries. Buildings in such areas are not only unique in their usage, but also in their height, size, appearance, and material. Moreover, most of them are densely built, with very little space between each other. All of these made it a great challenge to accurately extract the buildings’ 3D information and correctly classify them. In this study, the proposed building classification scheme performed rather well in both the study area and validation area, which indicates that it has great potential for application in areas with complex circumstances. Nevertheless, the proposed scheme still has certain limitations. Firstly, the object-oriented segmentation may divide one single building into many small segments, which may be unrealistically identified as different building types in later steps and increase the computation cost. A better segmentation scheme or algorithm should be applied in future studies to solve this problem. Secondly, we used height information derived directly from LiDAR in the data integration process in this study. Although the effect of terrain difference on the accuracy of classification results is not obvious in this study, it may cause greater error when the proposed method is applied in areas with more complex terrain condition. Using buildings’ relative height, instead of absolute heights, will probably help prevent such errors. Thirdly, the proposed method in this study was realized using multiple software packages, like ArcGIS, eCognition, and MATLAB, which makes it difficult to assess its efficiency. Integrating all of the algorithms and methods into one single program will apparently improve the method’s applicability. Furthermore, the proposed method needs to be tested in a larger area, with more building types and more complex terrain conditions.
6. Conclusions
This research proposes a whole scheme for classifying building types based on LiDAR data and high spatial resolution remote sensing images. The first step is using the progressive morphological filter to extract building footprints from LiDAR point clouds; the second step is combining the building height information with high-resolution images; the third step is object-oriented multi-resolution segmentation of the integrated LiDAR and high-resolution images while incorporating super-object information; the final step is classifying building types by using the random forest classifier. Comparative studies were carried out to prove the necessity of using combined LiDAR and HRI data, as well as the necessity of incorporating super-object information during classification. The proposed scheme was also validated by applying it to a different area.
The following conclusions can be made through the analysis of this study’s results. Firstly, more precise building classifications could be obtained by integrating LiDAR building footprints and high-resolution images, compared to simply using LiDAR data or high-resolution images. Secondly, both building height information and super-object information play important roles in building type classification. The accuracy of building type classification can be remarkably improved by assigning super-object information to fine-scale segments. Through super-object information, fine-scale segments could inherit properties like proximity, aggregation, spectrum, and so on from course-scaled segments, hence providing more information to the classifier. Thirdly, the random forest classifier could effectively utilize various features from the integrated LiDAR and HRI data and provide accurate building type classification results. Finally, the building type classification scheme proposed in this paper has great potential for application in areas with multiple building types and complex backgrounds, especially applicable to urban villages or slums in developing countries worldwide.
Limitations of this research include inadequate consideration of terrain effects, inconvenience in realization, and a lack of extensive testing and validation. In spite of these limitations, we strongly believe that the building type classification scheme proposed in this paper has great potential for application in many areas, such as building information updates, population estimation, urban planning, management, etc.
Acknowledgments
The authors appreciate the financial support provided by National Natural Science Foundation of China, No. 41371499.
Author Contributions
Y.H., L.Z. and H.T. conceived and designed the experiments; Y.H. performed the experiments and analyzed the data; L.Z. and K.L. contributed data; Y.H. and L.Z. wrote the paper. H.T., Q.S. and K.L. helped refine the manuscript.
Conflicts of Interest
The authors declare no conflict of interest.
References
- Brindley, T. The social dimension of the urban village: A comparison of models for sustainable urban development. Urban Des. Int. 2003, 8, 53–65. [Google Scholar] [CrossRef]
- Whitzman, C. Suburb, Slum, Urban Village: Transformations in Toronto’s Parkdale Neighbourhood, 1875–2002; UBC Press: Vancouver, BC, Canada, 2010. [Google Scholar]
- Wei, L.; Yan, X. Transformation of “Urban Village” and Feasible Mode. City Plan. Rev. 2005, 7, 9–13. (In Chinese) [Google Scholar]
- Tao, C.; Tan, Y.; Zou, Z.R.; Tian, J. Unsupervised detection of built-up areas from multiple high-resolution remote sensing images. IEEE Geosci. Remote Sens. Lett. 2013, 10, 1300–1304. [Google Scholar] [CrossRef]
- Herold, M.; Goldstein, N.C.; Clarke, K.C. The spatiotemporal form of urban growth: Measurement, analysis and modeling. Remote Sens. Environ. 2003, 86, 286–302. [Google Scholar] [CrossRef]
- Voogt, J.A.; Oke, T.R. Thermal remote sensing of urban climates. Remote Sens. Environ. 2003, 86, 370–384. [Google Scholar] [CrossRef]
- Nevatia, R.; Price, K. Automatic and interactive modeling of buildings in urban environments from aerial images. In Proceedings of the 2002 International Conference of on Image Processing, Rochester, NY, USA, 22–25 September 2002; Volume 3, pp. 525–528. [Google Scholar]
- Rottensteiner, F. Automatic generation of high-quality building models from lidar data. IEEE Comput. Graph. Appl. 2003, 23, 42–50. [Google Scholar] [CrossRef]
- Rottensteiner, F.; Briese, C. A new method for building extraction in urban areas from high-resolution LiDAR data. Int. Arch. Photogramm. Remote Sens. Geogr. Inf. 2002, 34, 295–301. [Google Scholar]
- Chen, L.; Teo, T.; Rau, J.Y.; Liu, J.; Hsu, W. Building reconstruction from LiDAR data and aerial imagery. In Proceedings of the 2005 IEEE International Geoscience and Remote Sensing, Seoul, Korea, 25–29 July 2005; pp. 2846–2849. [Google Scholar]
- Thiele, A.; Cadario, E.; Schulz, K.; Thonnessen, U.; Soergel, U. Building recognition from multi-aspect high-resolution InSAR data in urban areas. IEEE Trans. Geosci. Remote Sens. 2007, 45, 3583–3593. [Google Scholar] [CrossRef]
- Johnson, B.; Xie, Z. Classifying a high-resolution image of an urban area using super-object information. ISPRS J. Photogramm. Remote Sens. 2013, 83, 40–49. [Google Scholar] [CrossRef]
- Morgan, J.L.; Gergel, S.E. Quantifying historic landscape heterogeneity from aerial photographs using object-based analysis. Landsc. Ecol. 2010, 25, 985–998. [Google Scholar] [CrossRef]
- Moller, M.; Lymburner, L.; Volk, M. The comparison index: A tool for assessing the accuracy of image segmentation. Int. J. Appl. Earth Obs. Geoinf. 2007, 9, 311–321. [Google Scholar] [CrossRef]
- Lu, Z.; Im, J.; Quackenbush, L. A volumetric approach to population estimation using LiDAR remote sensing. Photogramm. Eng. Remote Sens. 2011, 77, 1145–1156. [Google Scholar] [CrossRef]
- Abellán, J.; Moral, S. Building classification trees using the total uncertainty criterion. Int. J. Intell. Syst. 2003, 18, 1215–1225. [Google Scholar] [CrossRef]
- Qiu, F.; Sridharan, H.; Chun, Y. Spatial autoregressive model for population estimation at the census block level using LIDAR-derived building volume information. Cartogr. Geogr. Inf. Sci. 2010, 37, 239–257. [Google Scholar] [CrossRef]
- Xie, Y.; Weng, A.; Weng, Q. Population Estimation of Urban Residential Communities Using Remotely Sensed Morphologic Data. IEEE Geosci. Remote Sens. Lett. 2015, 12, 1111–1115. [Google Scholar]
- Yan, Y.; Zhang, Y.; Tian, S.; Gao, F. Phase Analysis of Three-Dimensional Zernike Moment for Building Classification and Orientation in Digital Surface Model. IEEE Geosci. Remote Sens. Lett. 2016, 13, 58–62. [Google Scholar] [CrossRef]
- Zhang, K.; Chen, S.C.; Whitman, D.; Shyu, M.L.; Yan, J.; Zhang, C. A progressive morphological filter for removing nonground measurements from airborne LIDAR data. IEEE Trans. Geosci. Remote Sens. 2003, 41, 872–882. [Google Scholar] [CrossRef]
- Al-Khudhairy, D.H.; Caravaggi, I.; Giada, S. Structural damage assessments from Ikonos data using change detection, object-oriented segmentation, and classification techniques. Photogramm. Remote Sens. 2005, 71, 825–837. [Google Scholar] [CrossRef]
- Breiman, L. Random Forests. Mach. Learn. 2001, 45, 5–32. [Google Scholar] [CrossRef]
- Ham, J.; Chen, Y.; Crawford, M.M.; Ghosh, J. Investigation of the random forest framework for classification of hyperspectral data. IEEE Trans. Geosci. Remote Sens. 2005, 43, 492–501. [Google Scholar] [CrossRef]
- Lawrence, R.L.; Wood, S.D.; Sheley, R.L. Mapping invasive plants using hyperspectral imagery and Breiman Cutler classifications (RandomForest). Remote Sens. Environ. 2006, 100, 356–362. [Google Scholar] [CrossRef]
- Lu, Z.; Im, J.; Rhee, J.; Hodgson, M. Building type classification using spatial and landscape attributes derived from LiDAR remote sensing data. Landsc. Urban Plan. 2014, 130, 134–148. [Google Scholar] [CrossRef]
- Belgiu, M.; Tomljenovic, I.; Lampoltshammer, T.; Blaschke, T.; Hofle, B. Ontology-Based Classification of Building Types Detected from Airborne Laser Scanning Data. Remote Sens. 2014, 6, 1347–1366. [Google Scholar] [CrossRef]
- Miliaresis, G.; Kokkas, N. Segmentation and object-based classification for the extraction of the building class from LiDAR DEMs. Comput. Geosci. 2007, 33, 1076–1087. [Google Scholar] [CrossRef]
- Sohn, G.; Huang, X.; Tao, V. Using a binary space partitioning tree for reconstructing polyhedral building models from airborne LiDAR data. Photogramm. Eng. Remote Sens. 2008, 74, 1425–1438. [Google Scholar] [CrossRef]
- Wu, S.S.; Qiu, X.; Usery, E.; Wang, L. Using Geometrical, Textural, and Contextual Information of Land Parcels for Classification of Detailed Urban Land Use. Ann. Assoc. Am. Geogr. 2009, 99, 76–98. [Google Scholar] [CrossRef]
- Morgan, M.; Tempfli, K. Automatic building extraction from airborne laser scanning data. Int. Arch. Photogramm. Remote Sens. 2000, 33, 616–623. [Google Scholar]
- Zhang, K.; Whitman, D. Comparison of three algorithms for filtering airborne LiDAR data. Photogramm. Eng. Remote Sens. 2005, 71, 313–324. [Google Scholar] [CrossRef]
- Meng, X.; Currit, N.; Zhao, K. Ground filtering algorithms for airborne LiDAR data: A review of critical issues. Remote Sens. 2010, 2, 833–860. [Google Scholar] [CrossRef]
- Zhang, K.; Yan, J.; Chen, S.C. Automatic Construction of Building Footprints from Airborne LIDAR Data. IEEE Trans. Geosci. Remote Sens. 2006, 44, 2523–2533. [Google Scholar] [CrossRef]
- Sohn, G.; Dowman, I. Data fusion of high-resolution satellite imagery and LiDAR data for automatic building extraction. ISPRS J. Photogramm. Remote Sens. 2007, 62, 43–63. [Google Scholar] [CrossRef]
- Awrangjeb, M.; Ravanbakhsh, M.; Fraser, C.S. Automatic detection of residential buildings using LiDAR data and multispectral imagery. ISPRS J. Photogramm. Remote Sens. 2010, 65, 457–467. [Google Scholar] [CrossRef]
- Dong, P.; Ramesh, S.; Nepali, A. Evaluation of small-area population estimation using LiDAR, Landsat TM and parcel data. Int. J. Remote Sens. 2010, 31, 5571–5586. [Google Scholar] [CrossRef]
- Rottensteiner, F.; Briese, C. Automatic generation of building models from LiDAR data and the integration of aerial images. In Proceedings of the ISPRS Working Group III/3 Workshop on ‘3-D Reconstruction from Airborne Laserscanner and InSAR Data’, Dresden, Germany, 8–10 October 2003; Maas, H., Vosselman, G., Streilein, A., Eds.; Volume XXXIV, pp. 174–180. [Google Scholar]
- Pingel, T.J.; Clarke, K.C.; McBride, W.A. An improved simple morphological filter for the terrain classification of airborne LIDAR data. ISPRS J. Photogramm. Remote Sens. 2013, 77, 21–30. [Google Scholar] [CrossRef]
- Sun, M.; Li, Y.; Chen, Q.; Cai, G. A Progressive Morphological Filtering Method for Airborne LiDAR Point Cloud Based on Scan Line. Opto-Electron. Eng. 2013, 11, 013. (In Chinese) [Google Scholar]
- Oho, E.; Baba, N.; Katoh, M.; Nagatani, T.; Osumi, M.; Amako, K.; Kanaya, K. Application of the Laplacian filter to high-resolution enhancement of SEM images. J. Electron. Microsc. Tech. 1984, 1, 331–340. [Google Scholar] [CrossRef]
- Shen, D.F.; Chiu, C.W.; Huang, P.J. Modified laplacian filter and intensity correction technique for image resolution enhancement. In Proceedings of the 2006 IEEE International Conference on Multimedia and Expo, Toronto, ON, Canada, 9–12 July 2006; pp. 457–460. [Google Scholar]
- Gong, P.; Howarth, P. The use of structural information for improving land-cover classification accuracies at the rural-urban fringe. Photogramm. Eng. Remote Sens. 1990, 56, 67–73. [Google Scholar]
- İlk, H.G.; Jane, O.; İlk, Ö. The effect of Laplacian filter in adaptive unsharp masking for infrared image enhancement. Infrared Phys. Technol. 2011, 54, 427–438. [Google Scholar] [CrossRef]
- Wurm, M.; Schmitt, A.; Taubenbock, H. Building Types’ Classification Using Shape-Based Features and Linear Discriminant Functions. IEEE J. Sel. Top. Appl. Earth Obs. Remote Sens. 2015, 16, 1–12. [Google Scholar] [CrossRef]
- Benz, U.C.; Hofmann, P.; Willhauck, G.; Lingenfelder, I.; Heynen, M. Multi-resolution, object-oriented fuzzy analysis of remote sensing data for GIS-ready information. ISPRS J. Photogramm. Remote Sens. 2004, 58, 239–258. [Google Scholar] [CrossRef]
- Haralick, R.M.; Shanmugam, K. Textural features for image classification. IEEE Trans. Syst. Man Cybern. 1973, 3, 610–621. [Google Scholar] [CrossRef]
- Bharati, M.H.; Liu, J.J.; MacGregor, J.F. Image texture analysis: Methods and comparisons. Chemom. Intell. Lab. 2004, 72, 57–71. [Google Scholar] [CrossRef]
- Ho, T.K. Random decision forests. In Proceedings of the IEEE 3rd International Conference on Document Analysis and Recognition, Montreal, QC, Canada, 14–16 August 1995; Volume 1, pp. 278–282. [Google Scholar]
- Ho, T.K. The random subspace method for constructing decision forests. IEEE Trans. Pattern Anal. Mach. Intell. 1998, 20, 832–844. [Google Scholar]
- Pal, M. Random forest classifier for remote sensing classification. Int. J. Remote Sens. 2005, 26, 217–222. [Google Scholar] [CrossRef]
- Fan, S.J.; Zhang, A.W.; Hu, S.X.; Sun, W.D. A Method of Classification for Airborne Full Waveform LiDAR Data Based on Random Forest. Chin. J. Lasers 2013, 40, 216–222. (In Chinese) [Google Scholar]
- Bosch, A.; Zisserman, A.; Munoz, X. Image classification using random forests and ferns. In Proceedings of the 2007 IEEE 11th International Conference on Computer Vision, Rio de Janeiro, Brazil, 14–21 October 2007; pp. 1–8. [Google Scholar]
- Rodriguez-Galiano, V.F.; Ghimire, B.; Rogan, J.; Chica-Olmo, M.; Rigol-Sanchez, J.P. An assessment of the effectiveness of a random forest classifier for land-cover classification. ISPRS J. Photogramm. Remote Sens. 2012, 67, 93–104. [Google Scholar] [CrossRef]
- Van Rijsbergen, C. Information Retrieval; Butterworth-Heinemann: London, UK, 1979. [Google Scholar]
- Caruana, R.; Niculescu-Mizil, A. An empirical comparison of supervised learning algorithms. In Proceedings of the 23rd International Conference on Machine Learning, Pittsburgh, PA, USA, 25–29 July 2006; pp. 161–168. [Google Scholar]
Figure 1.
Orthophotos of the study area (a), the validation site (b), and part of the city of Guangzhou, where the study area and validation site are located (c).
Figure 1.
Orthophotos of the study area (a), the validation site (b), and part of the city of Guangzhou, where the study area and validation site are located (c).
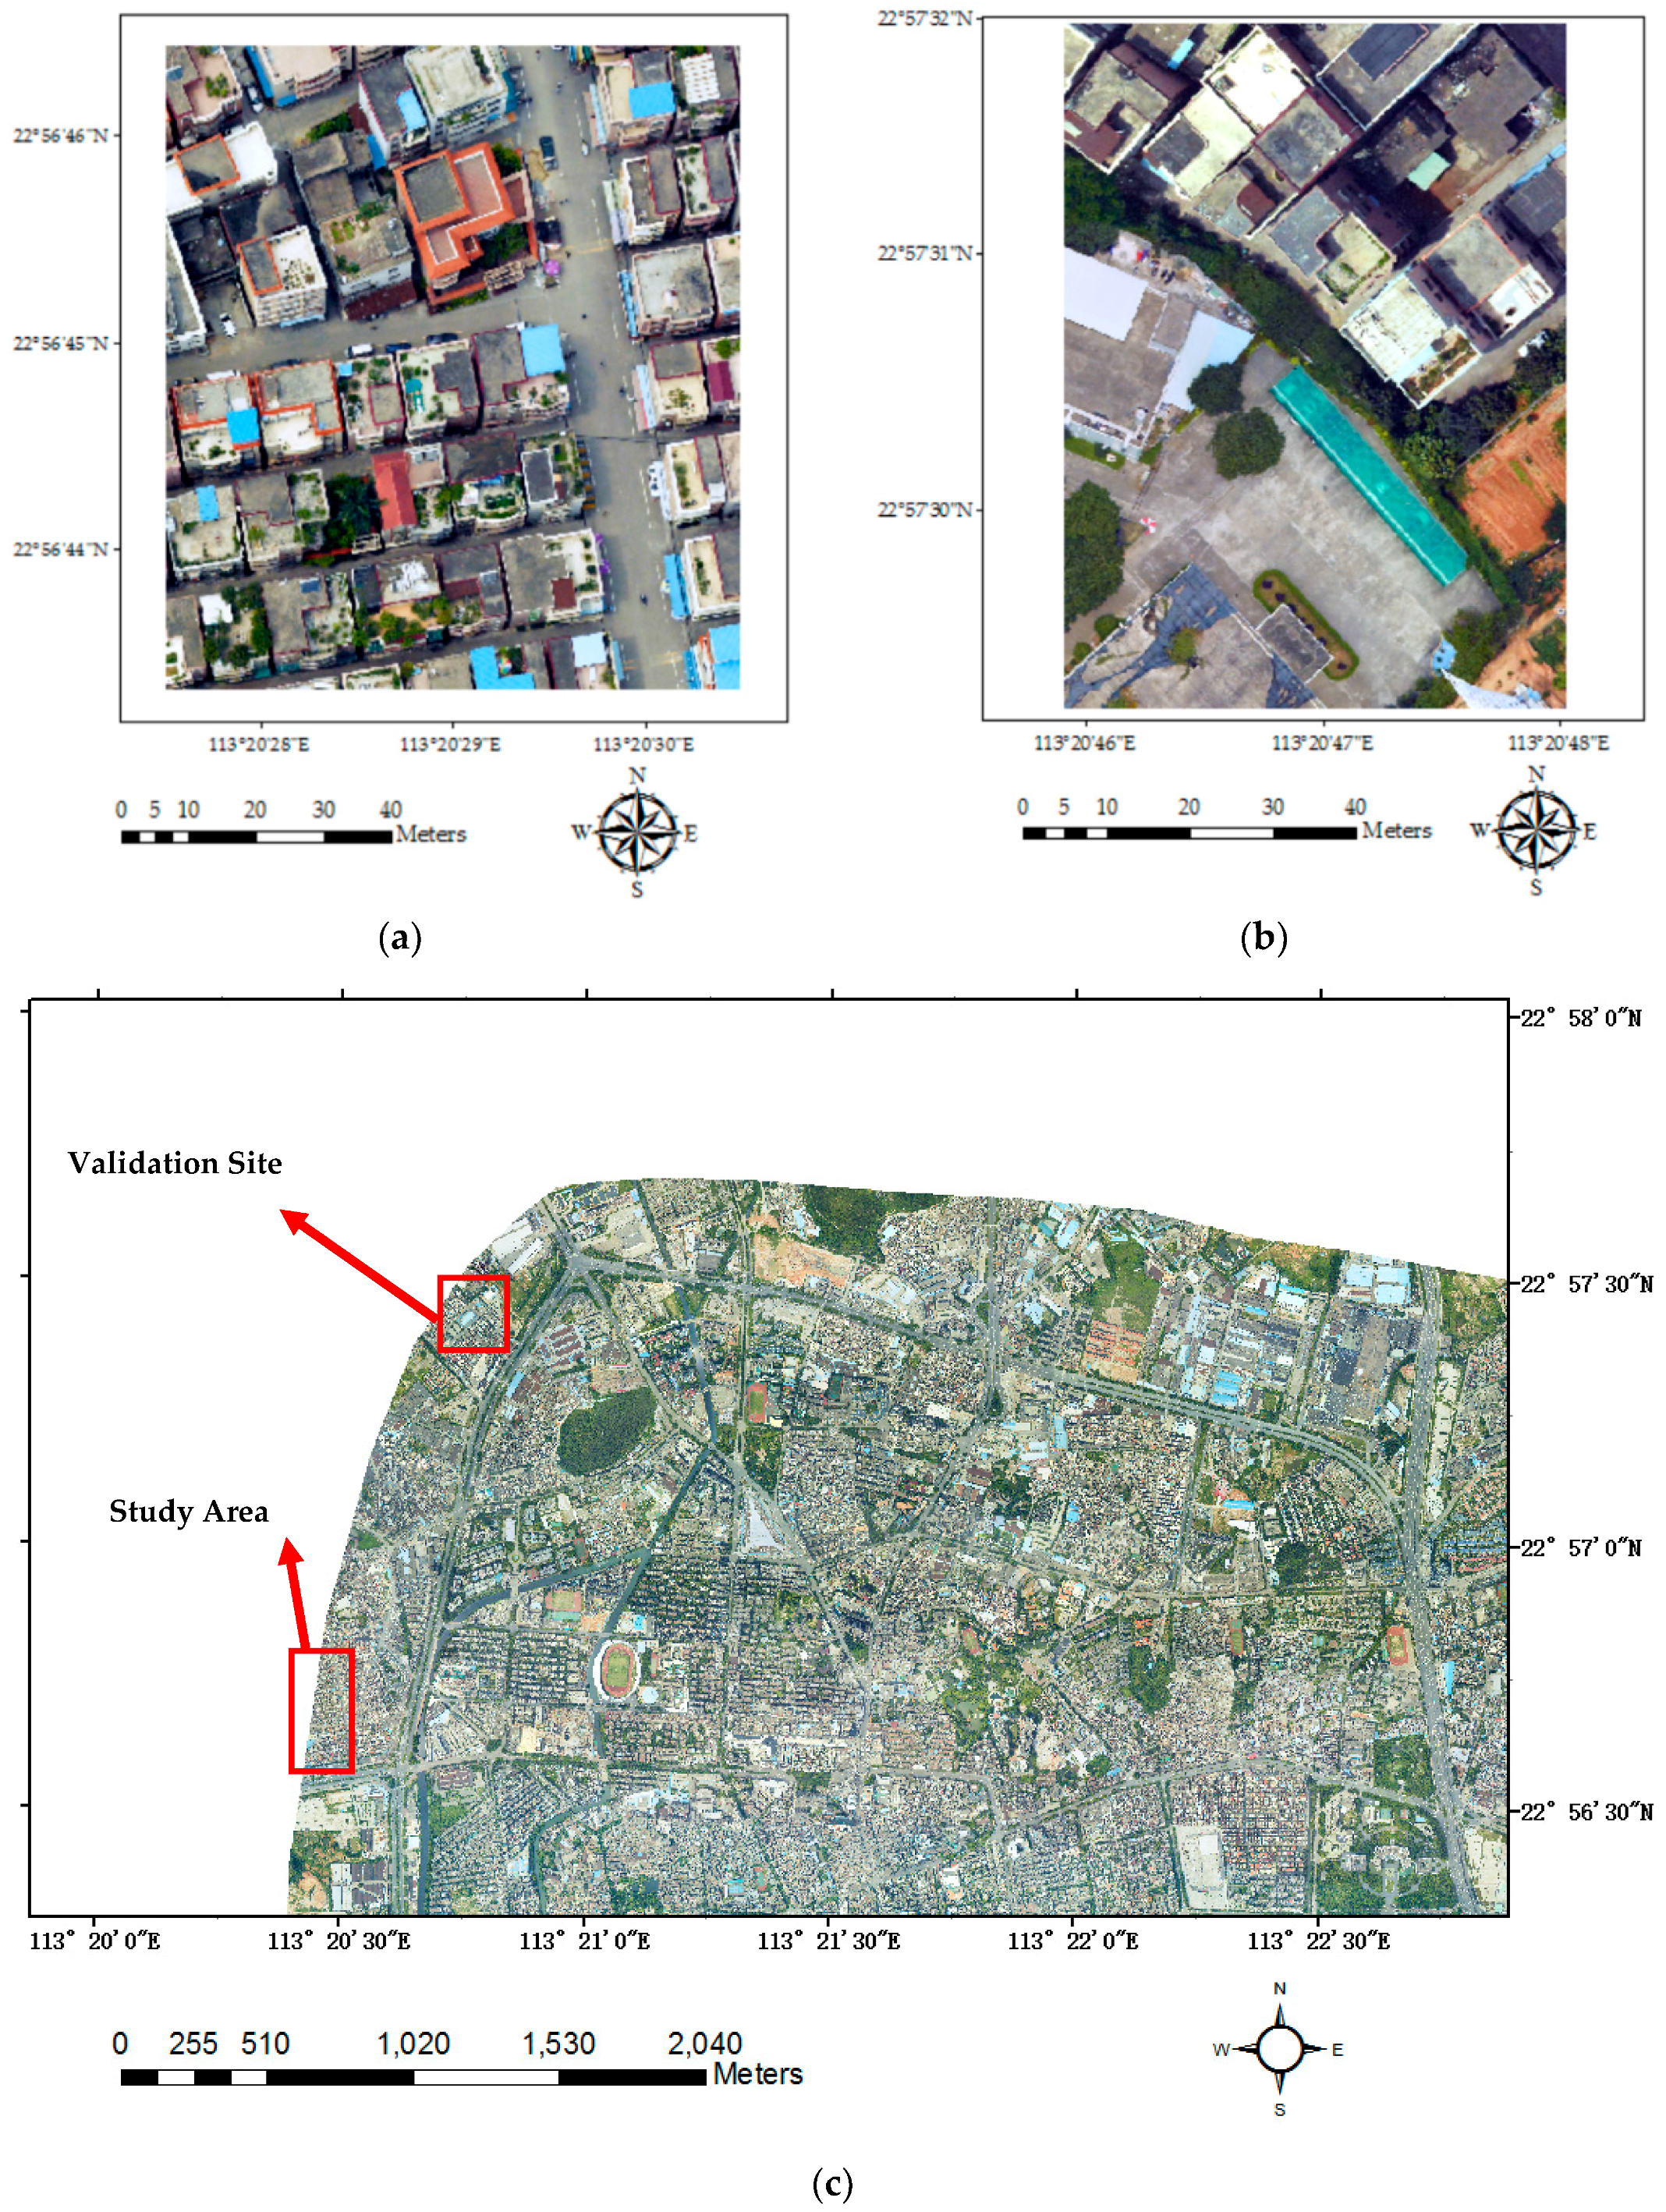
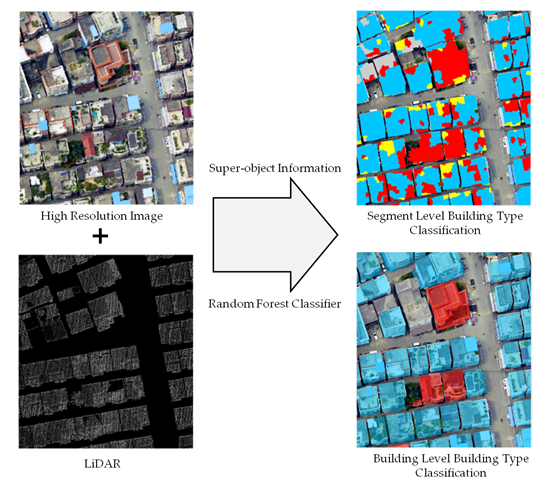
Figure 2.
Flowchart of the proposed building type classification scheme.
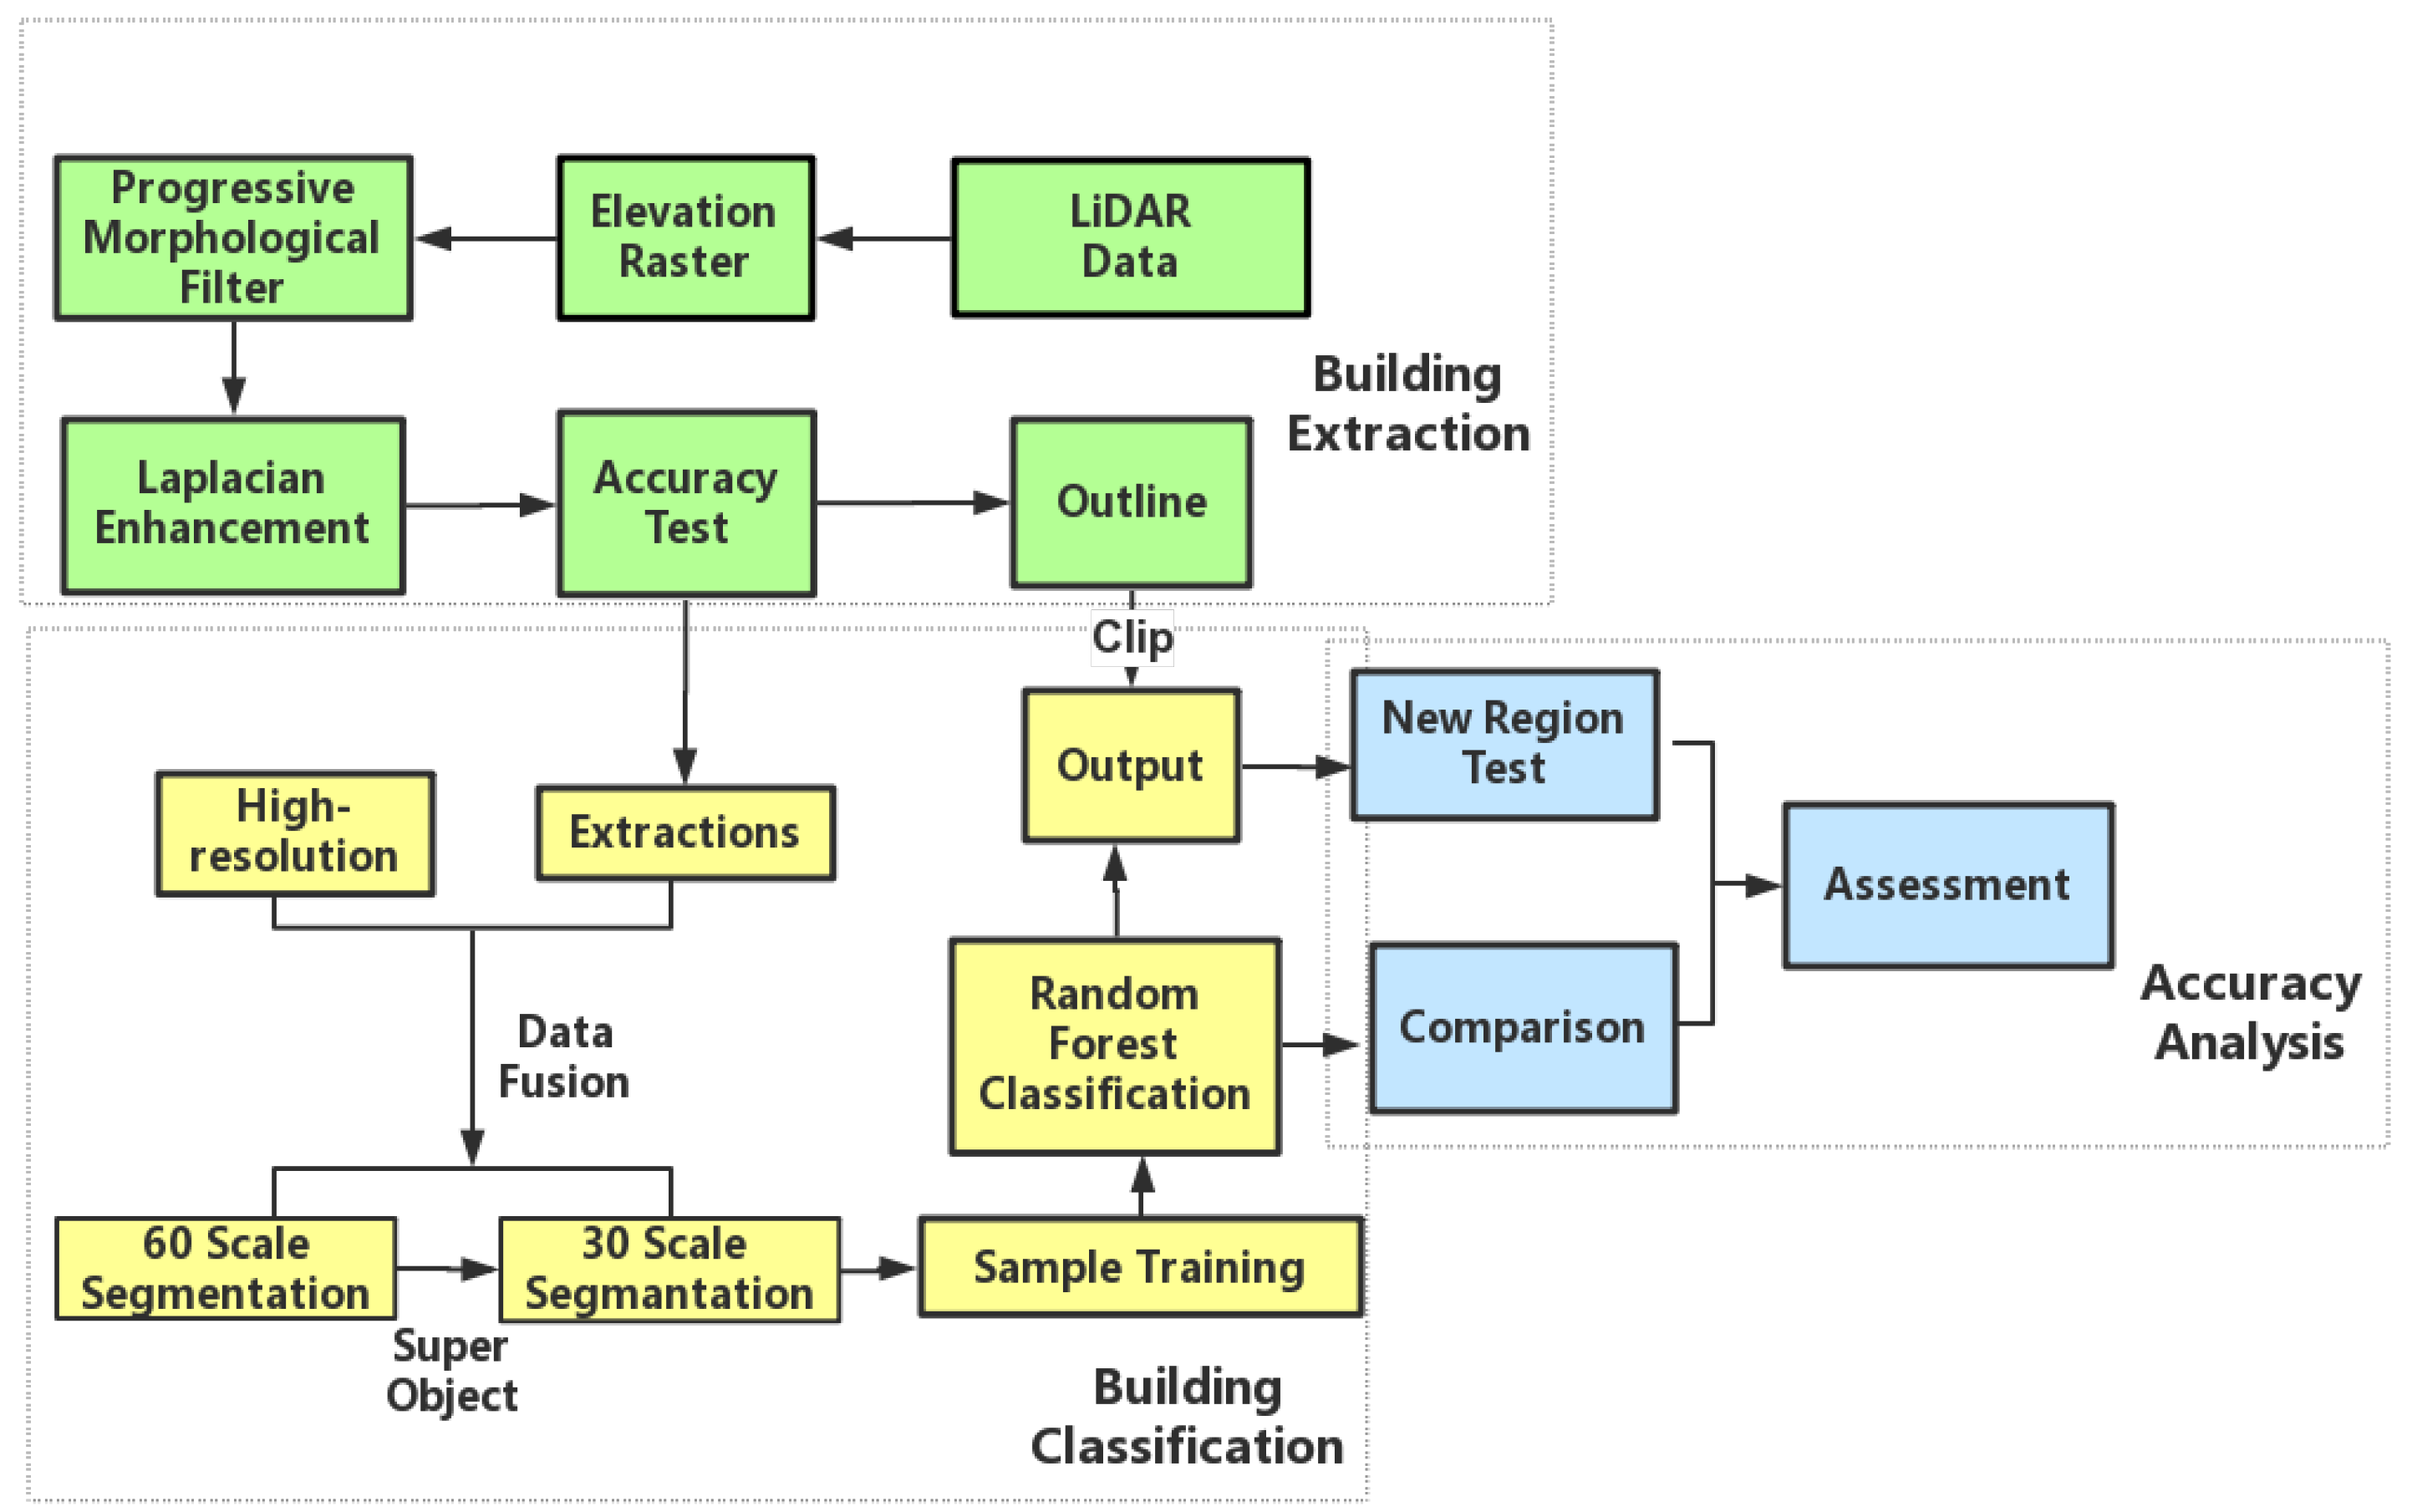
Figure 3.
Building extraction results: (a) extracted building footprints; (b) reference buildings; (c) comparison of extracted outline with the original image (Building 1, 2, 3, and 4 labeled in this figure are the four sample buildings chosen for vertex tests); and (d) a comparison of the extracted building outline with ground truth data.


Figure 4.
Distribution of training samples in the study area.
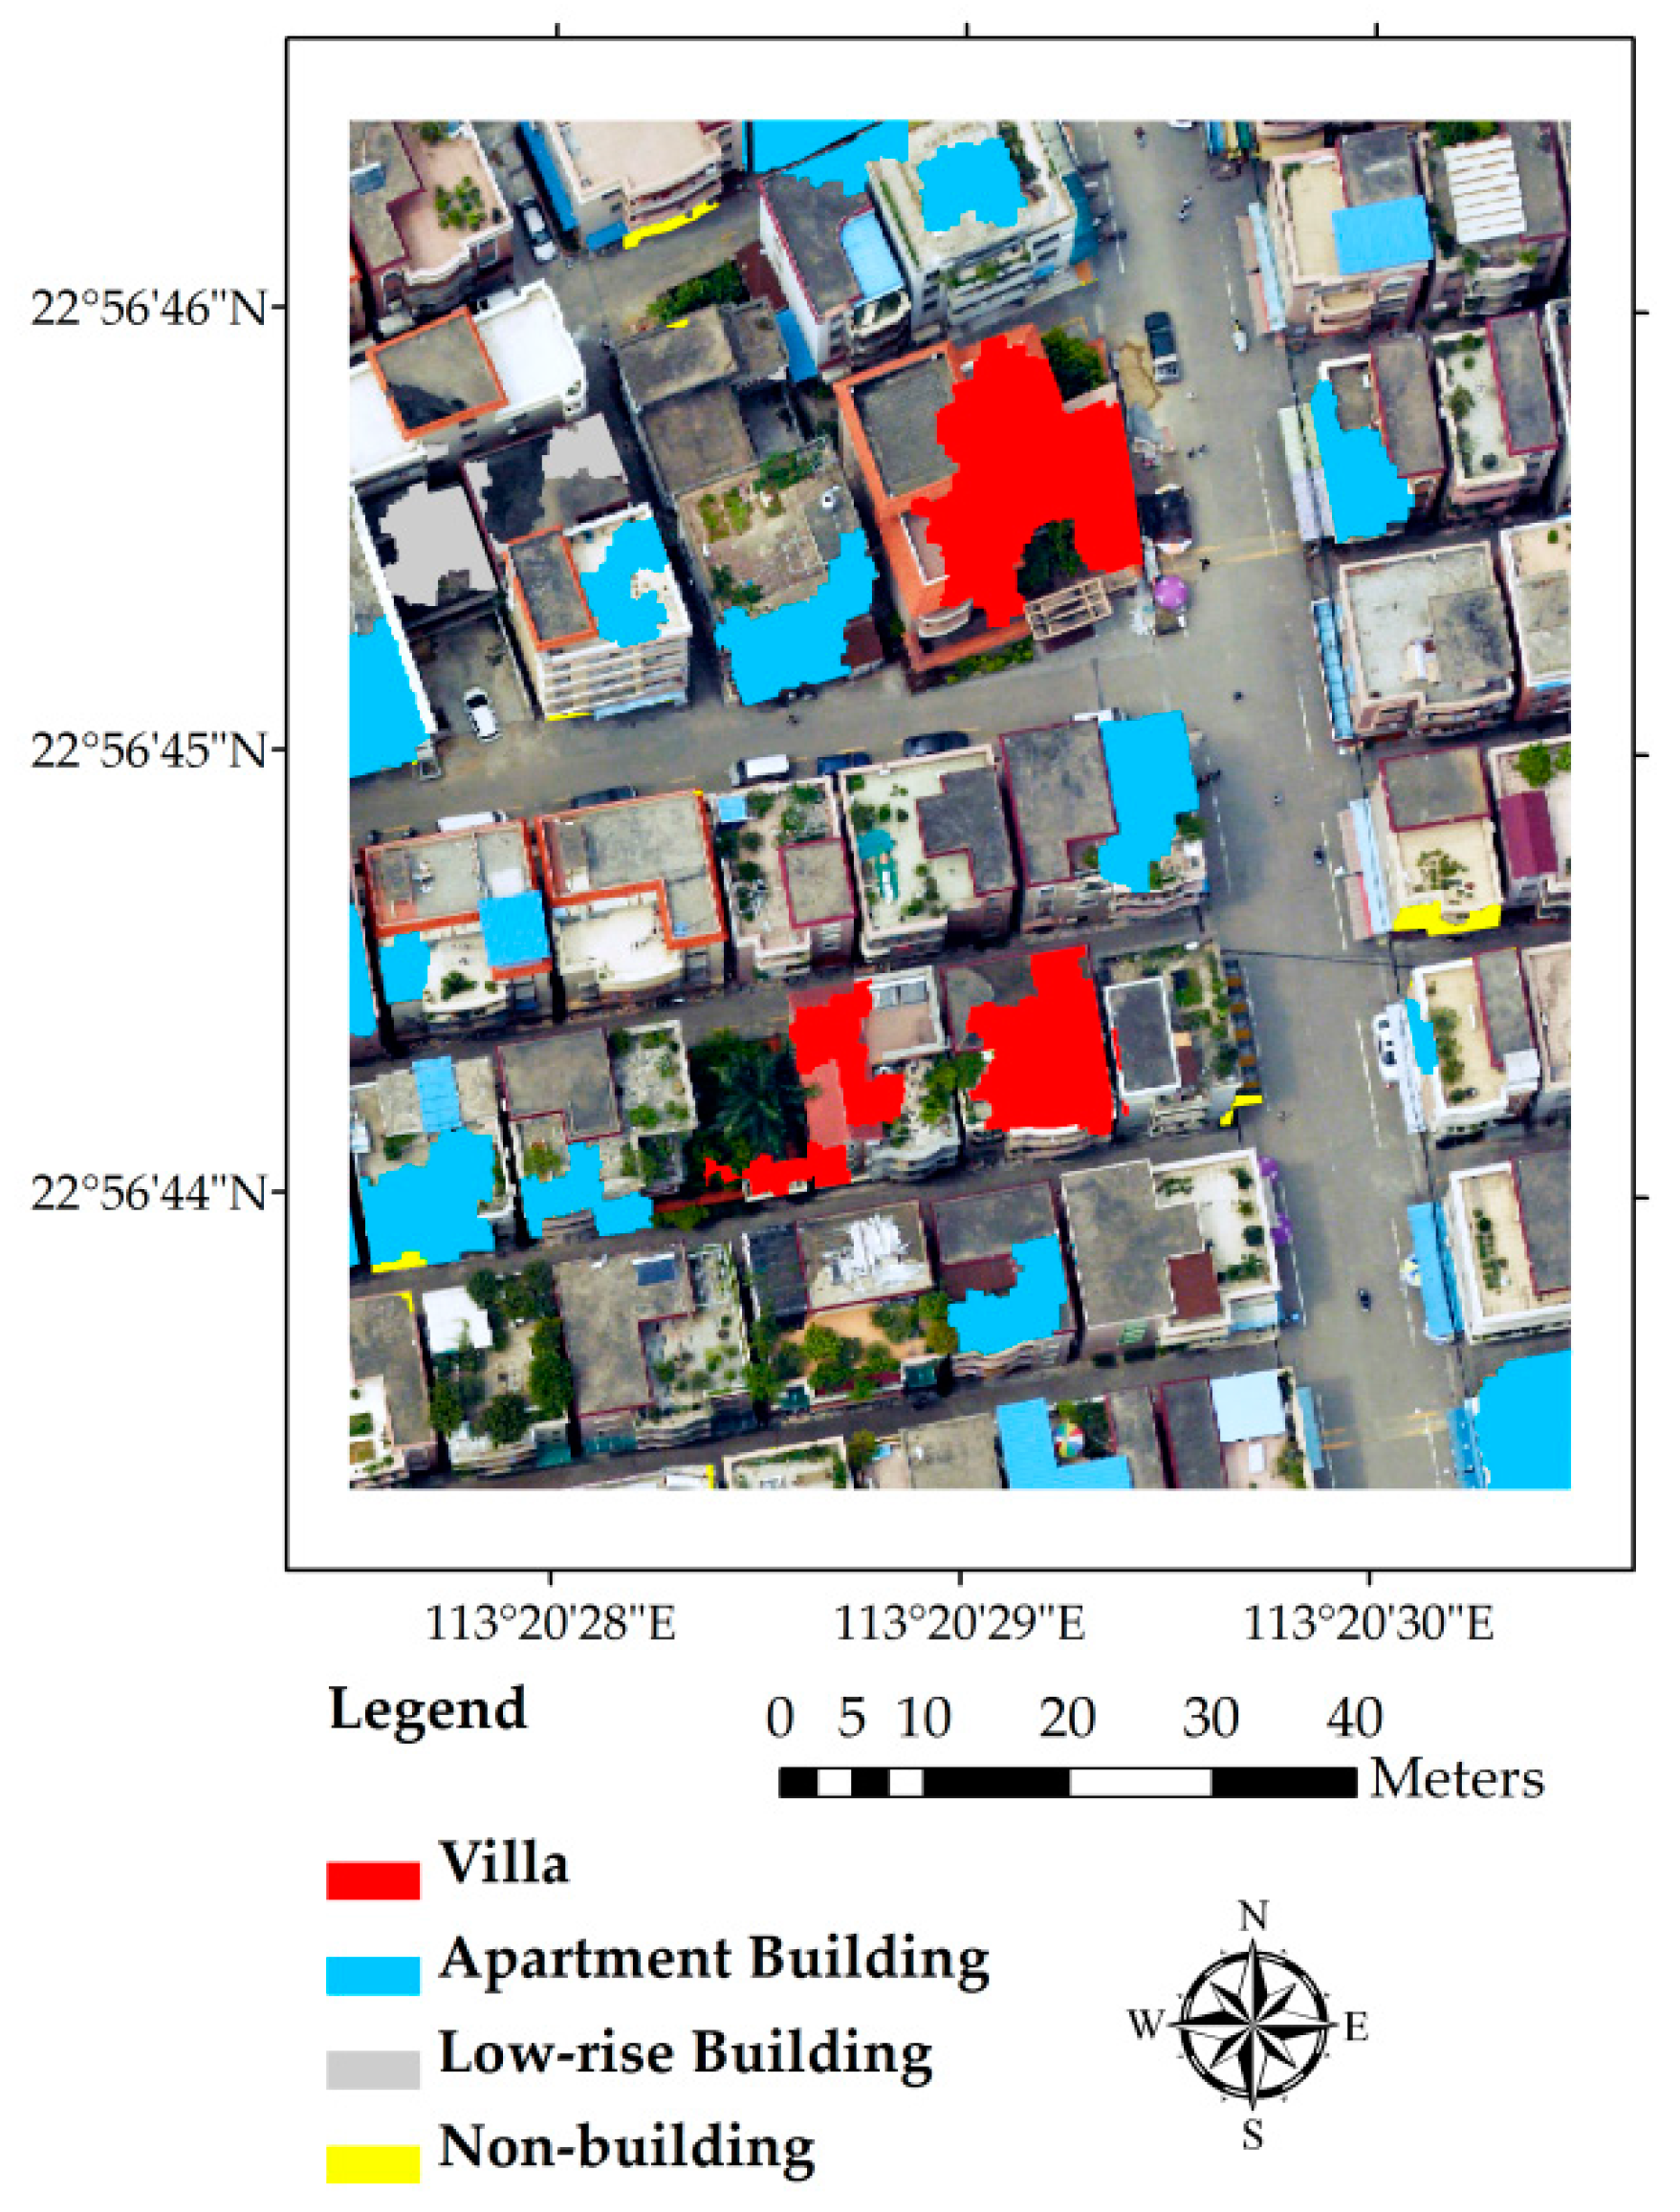
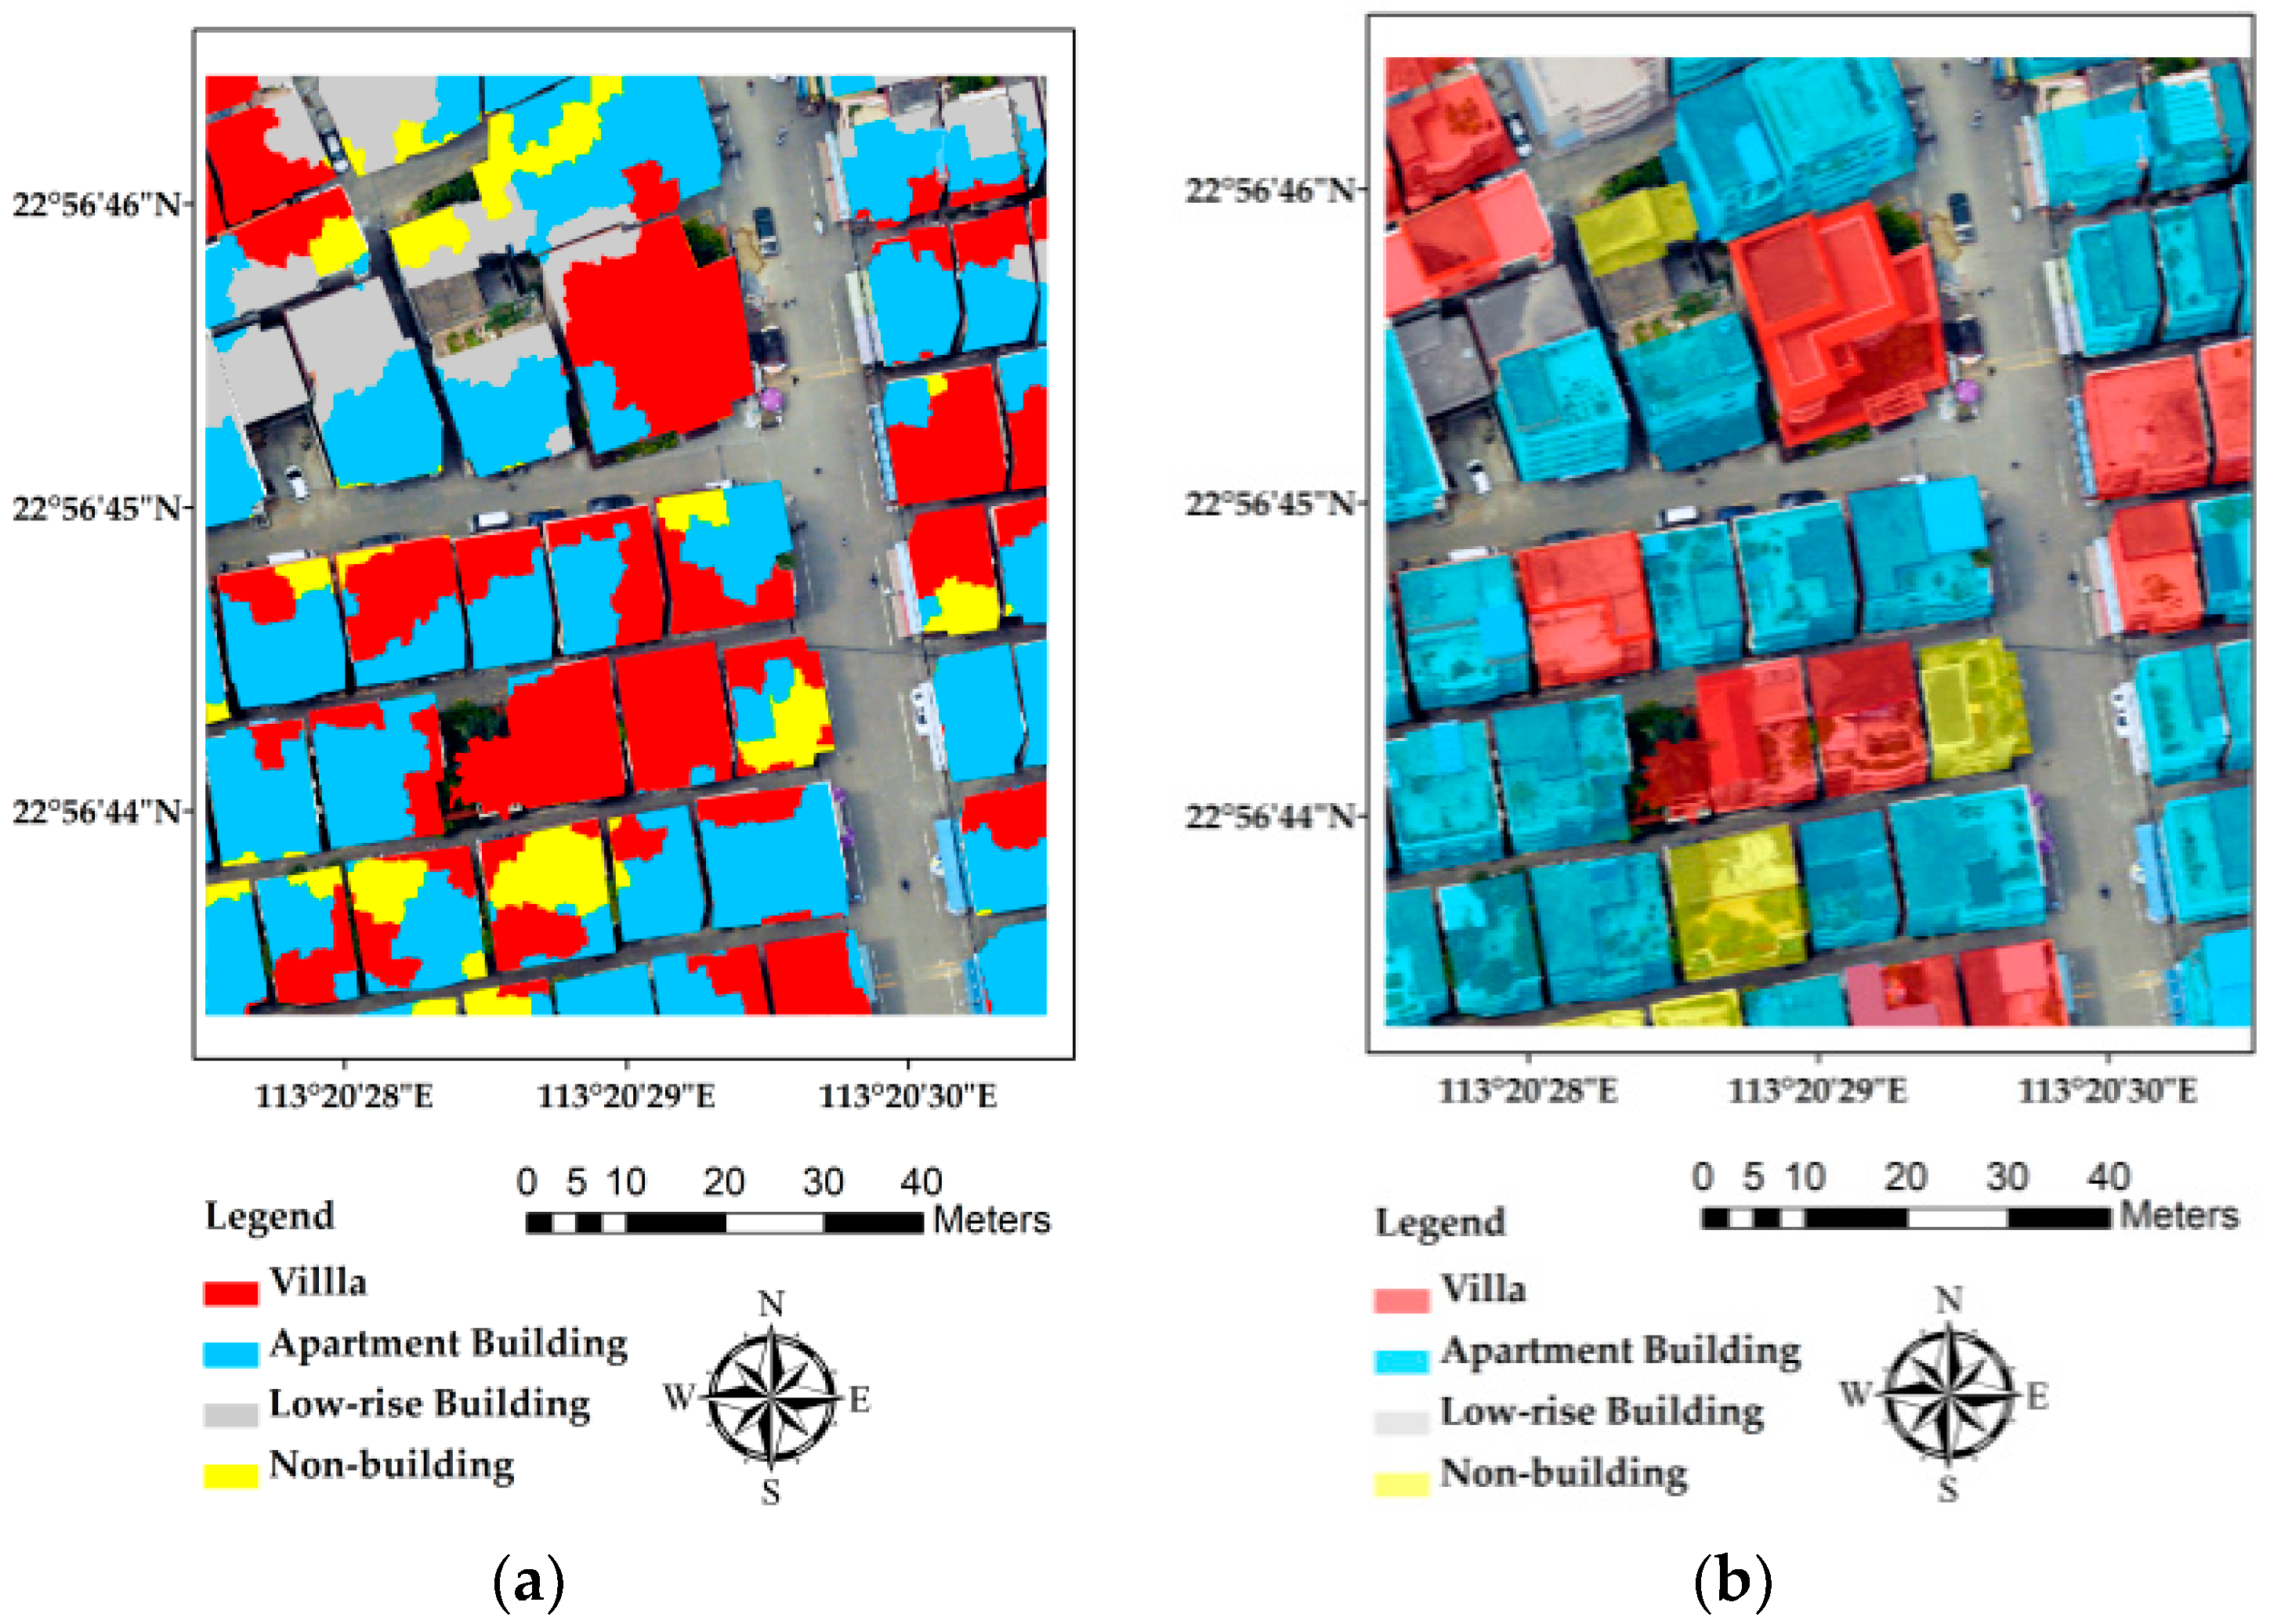
Figure 5.
(a) Building type classification results of the study area; (b) a comparison of the classification results with the original image; (c) dominant classified building type; (d) ground truth building type.
Figure 5.
(a) Building type classification results of the study area; (b) a comparison of the classification results with the original image; (c) dominant classified building type; (d) ground truth building type.

Figure 6.
(a) Distribution of training samples in the validation area; (b) classification result of the validation site; (c) dominant classified building type of the validation site; (d) ground truth building type of the validation site.
Figure 6.
(a) Distribution of training samples in the validation area; (b) classification result of the validation site; (c) dominant classified building type of the validation site; (d) ground truth building type of the validation site.

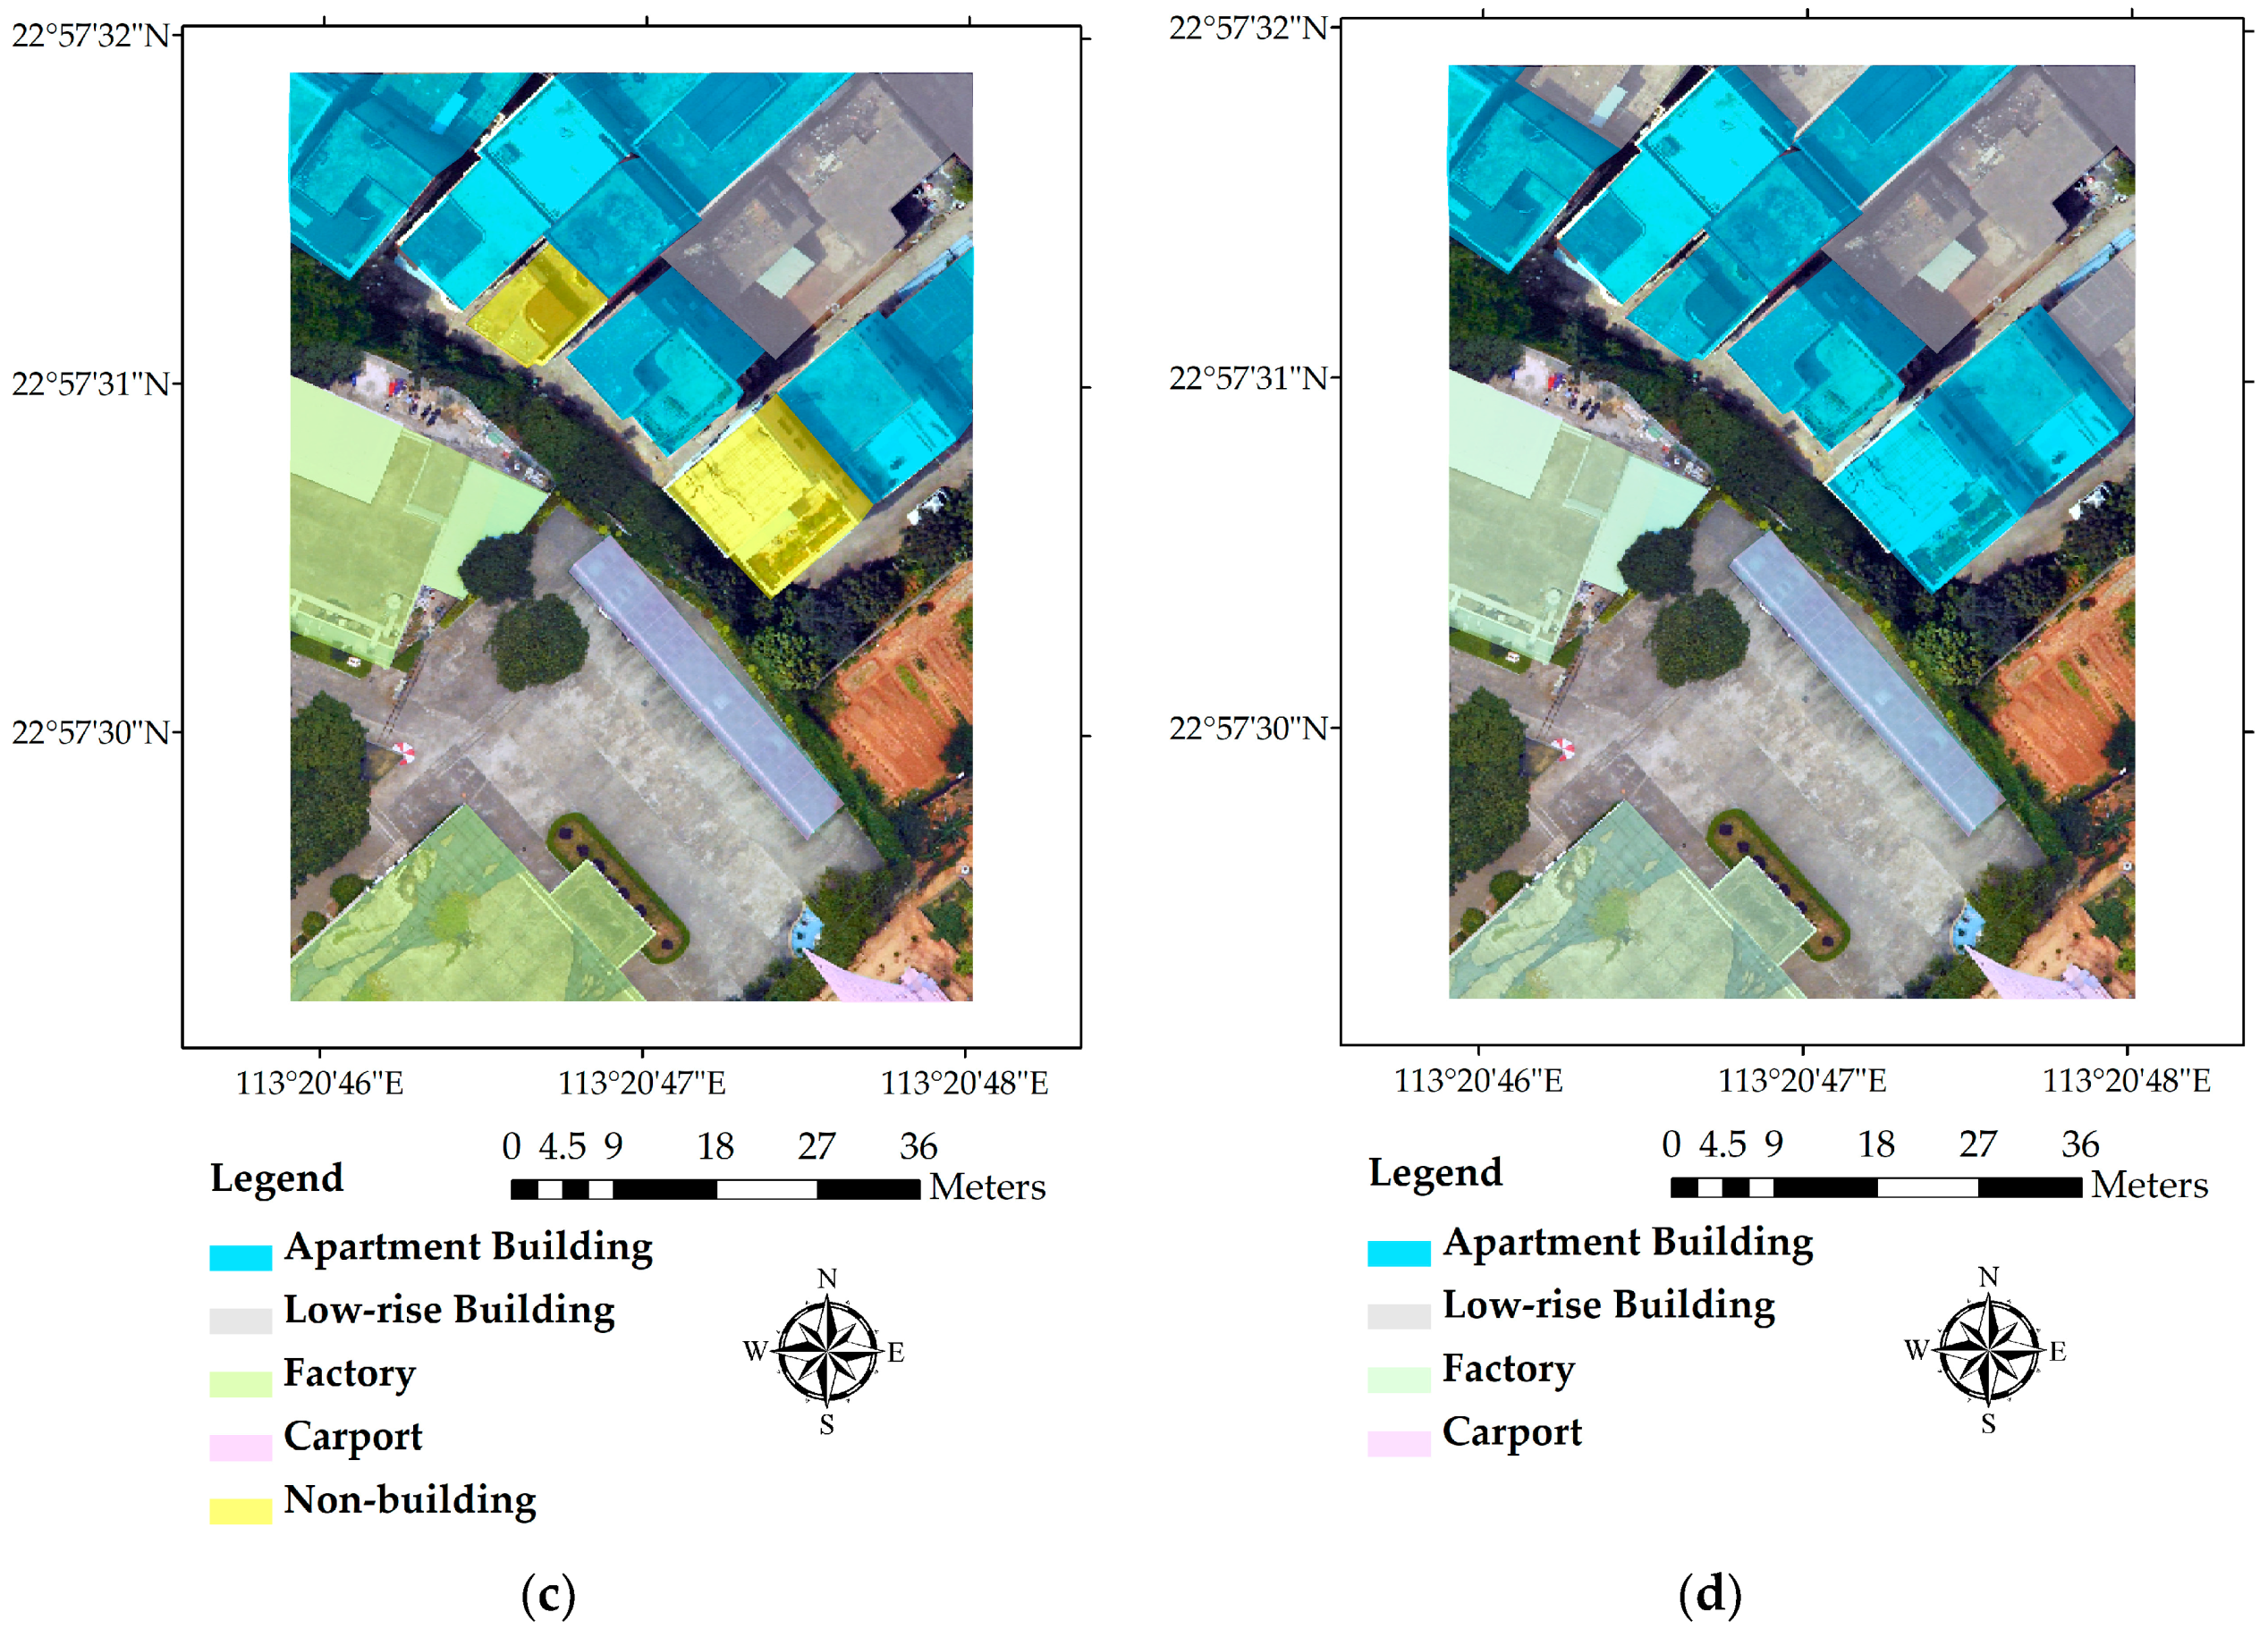
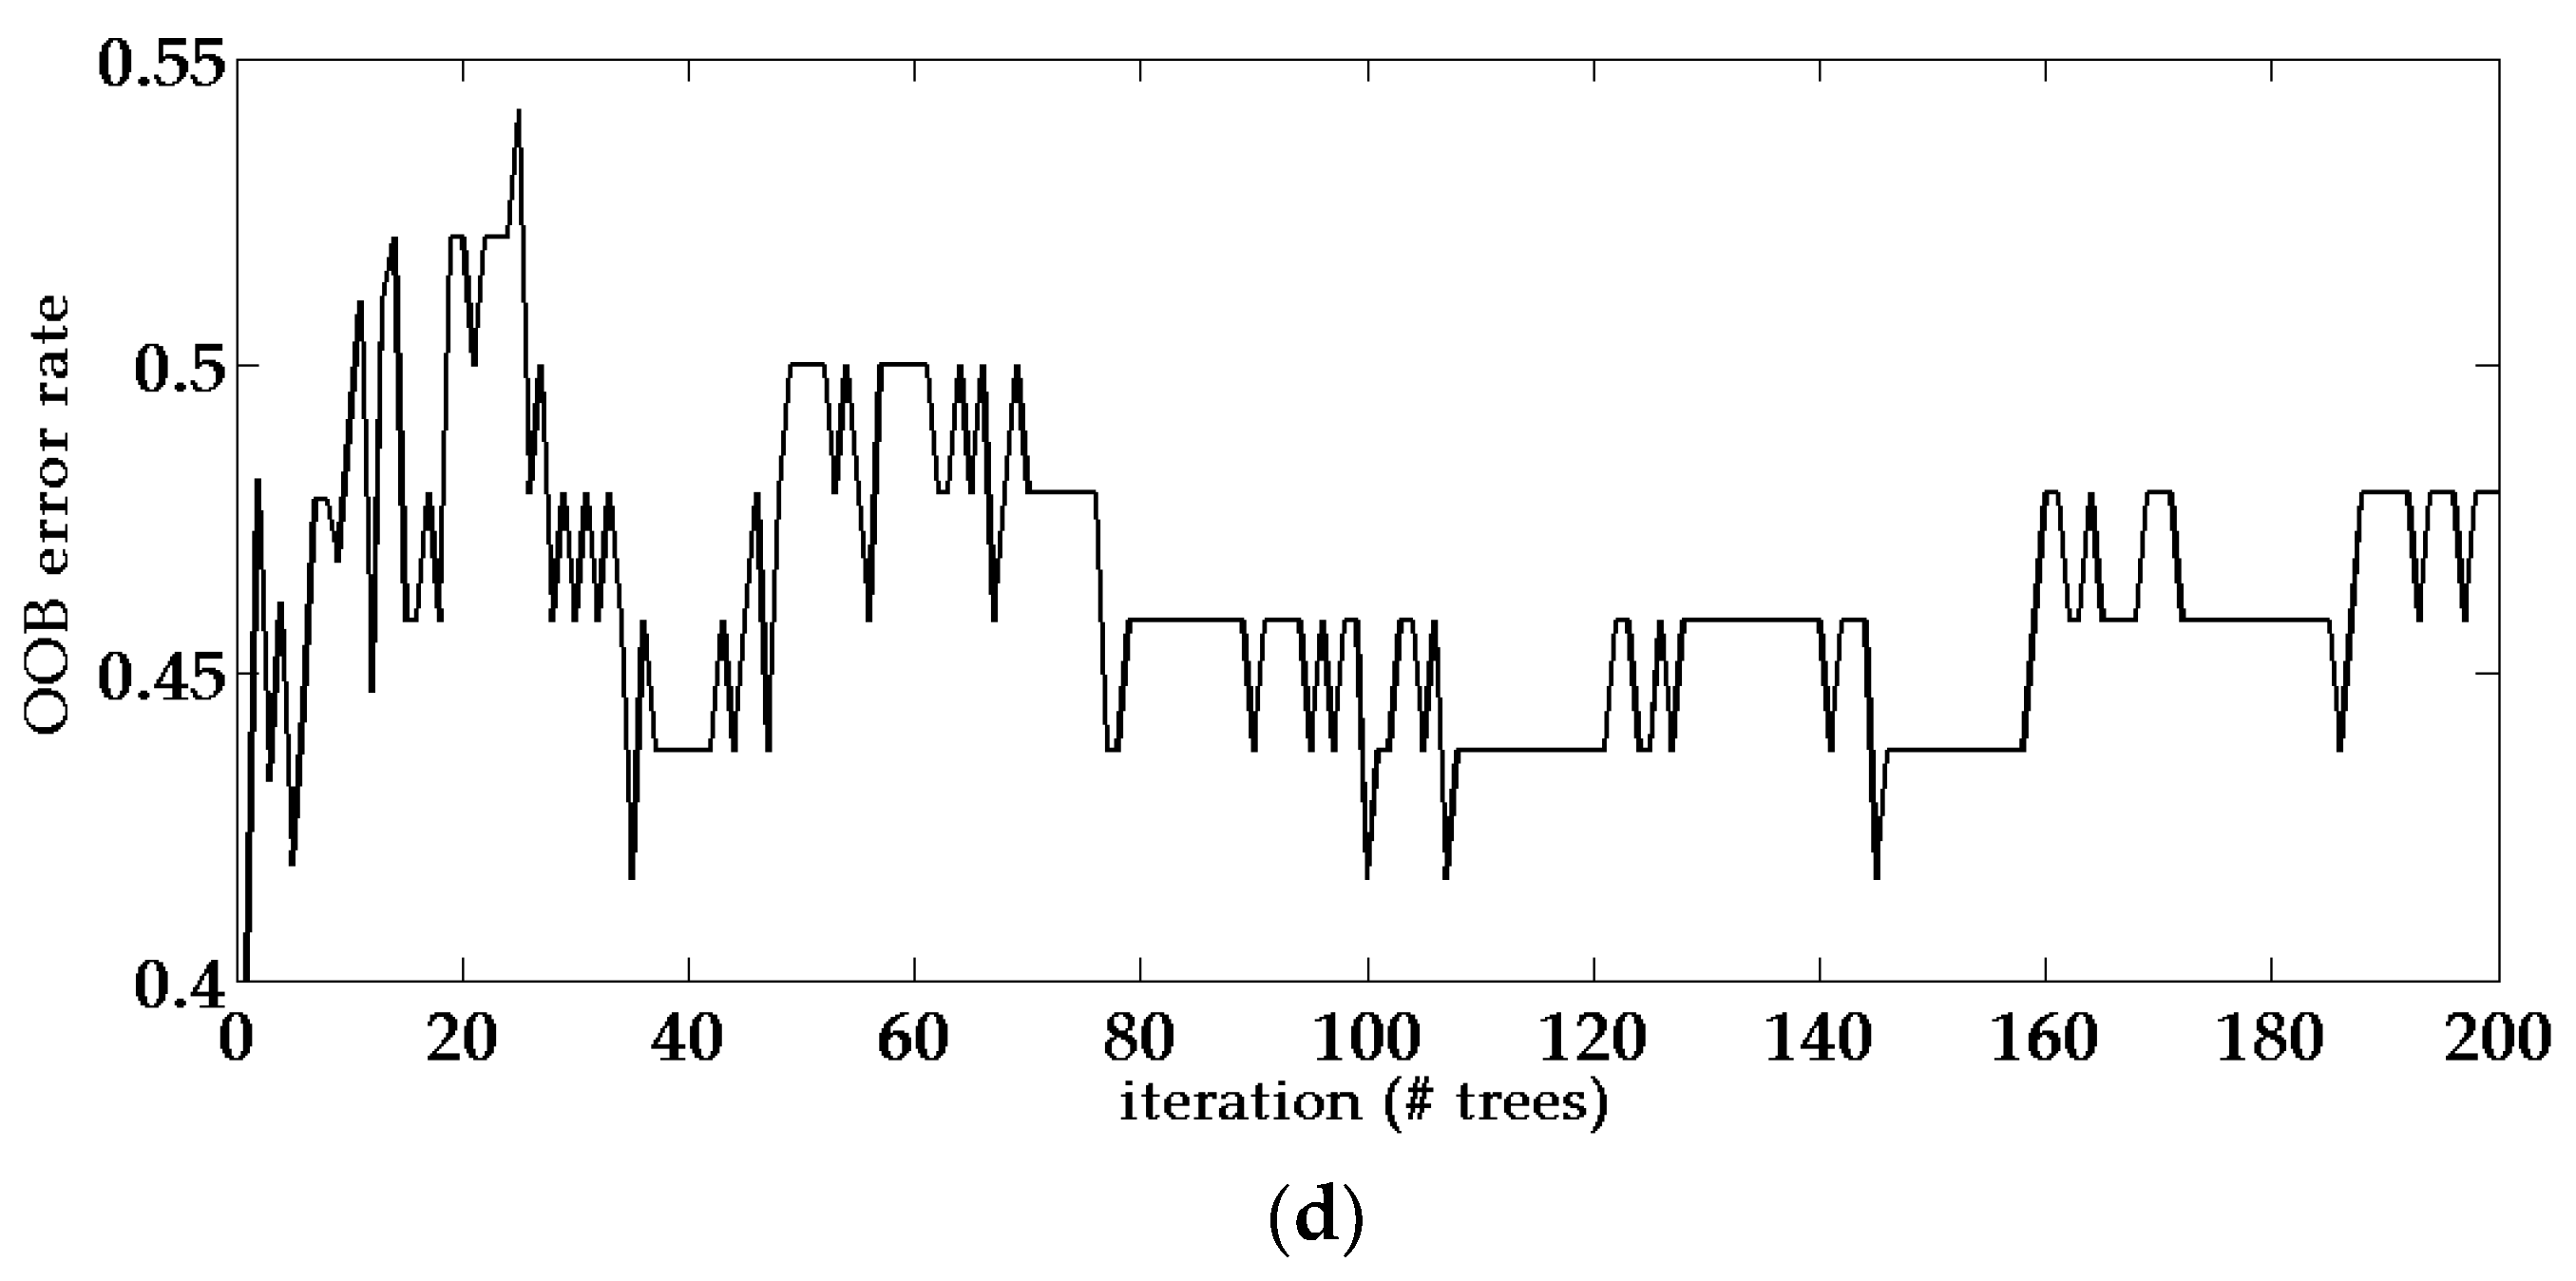
Figure 7.
OOB error rate of the random forest classifier when applied to four different data combinations: (a) integrated data with super-object information; (b) integrated data; (c) high-resolution image only; (d) Light Detection and Ranging (LiDAR) only.
Figure 7.
OOB error rate of the random forest classifier when applied to four different data combinations: (a) integrated data with super-object information; (b) integrated data; (c) high-resolution image only; (d) Light Detection and Ranging (LiDAR) only.


Figure 8.
Comparison of building type classification results at segment level derived from four different data combinations: (a) integrated data with super-object information; (b) integrated data; (c) high-resolution image only; and (d) LiDAR only.
Figure 8.
Comparison of building type classification results at segment level derived from four different data combinations: (a) integrated data with super-object information; (b) integrated data; (c) high-resolution image only; and (d) LiDAR only.
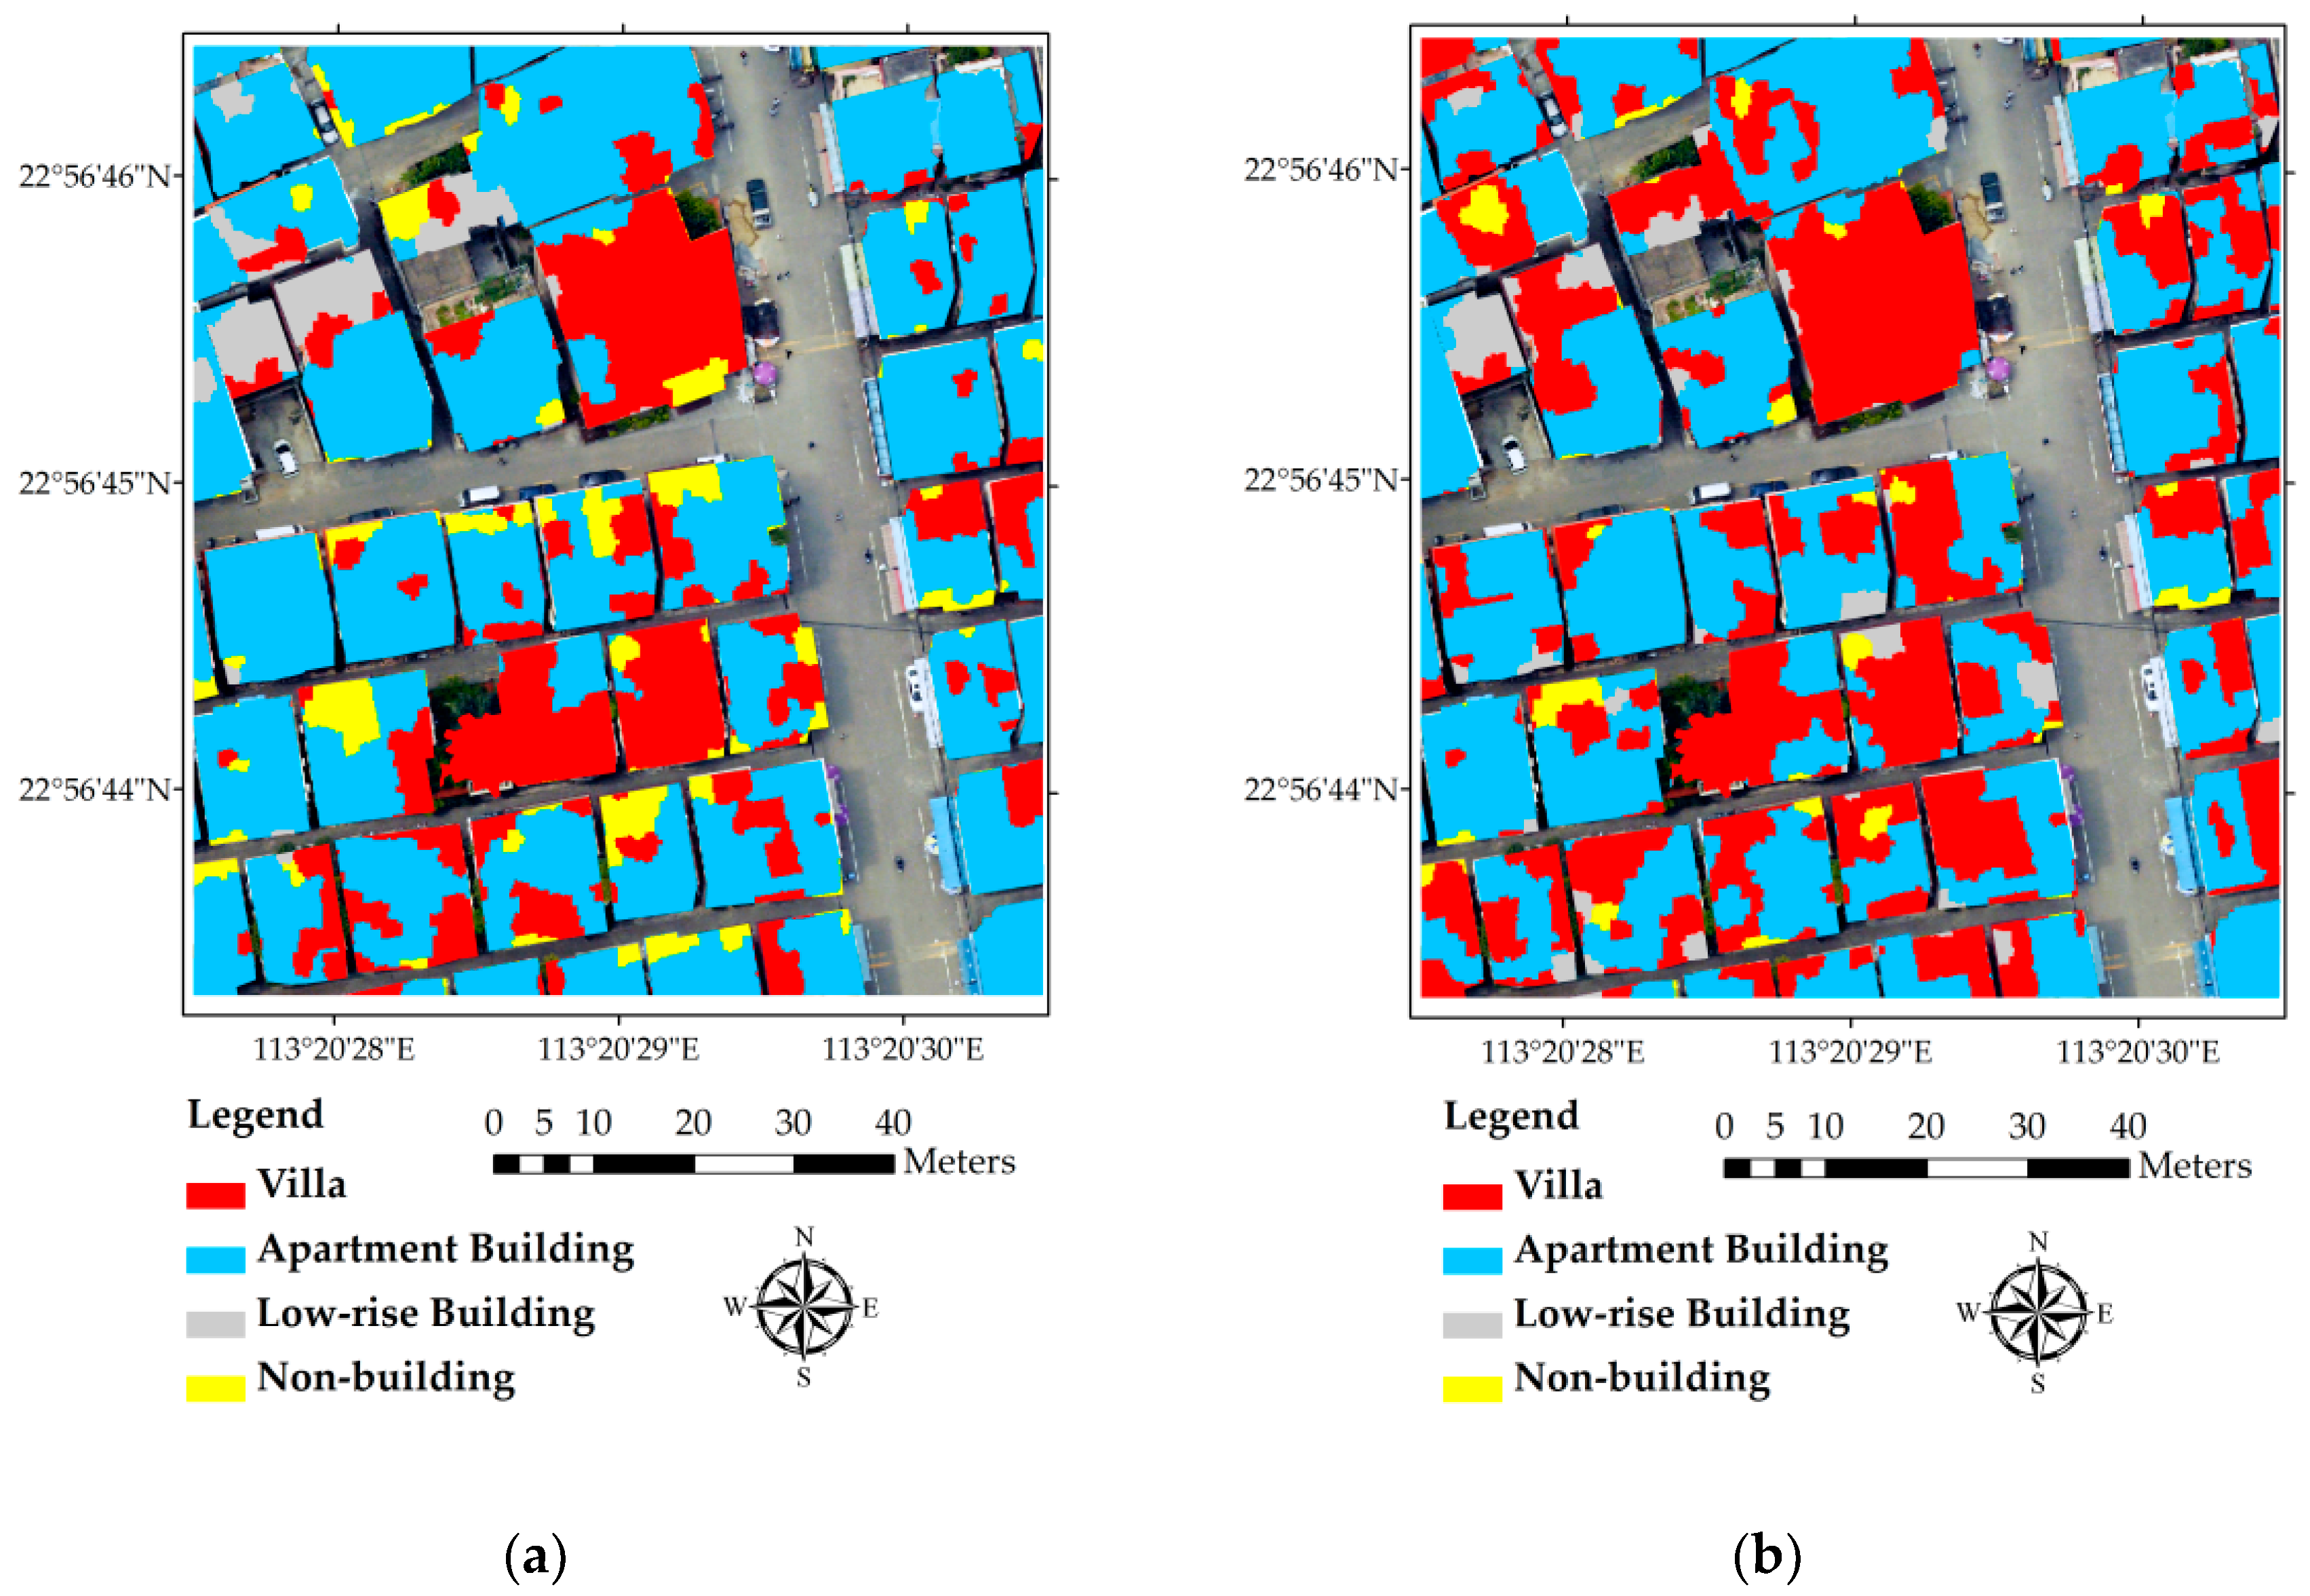
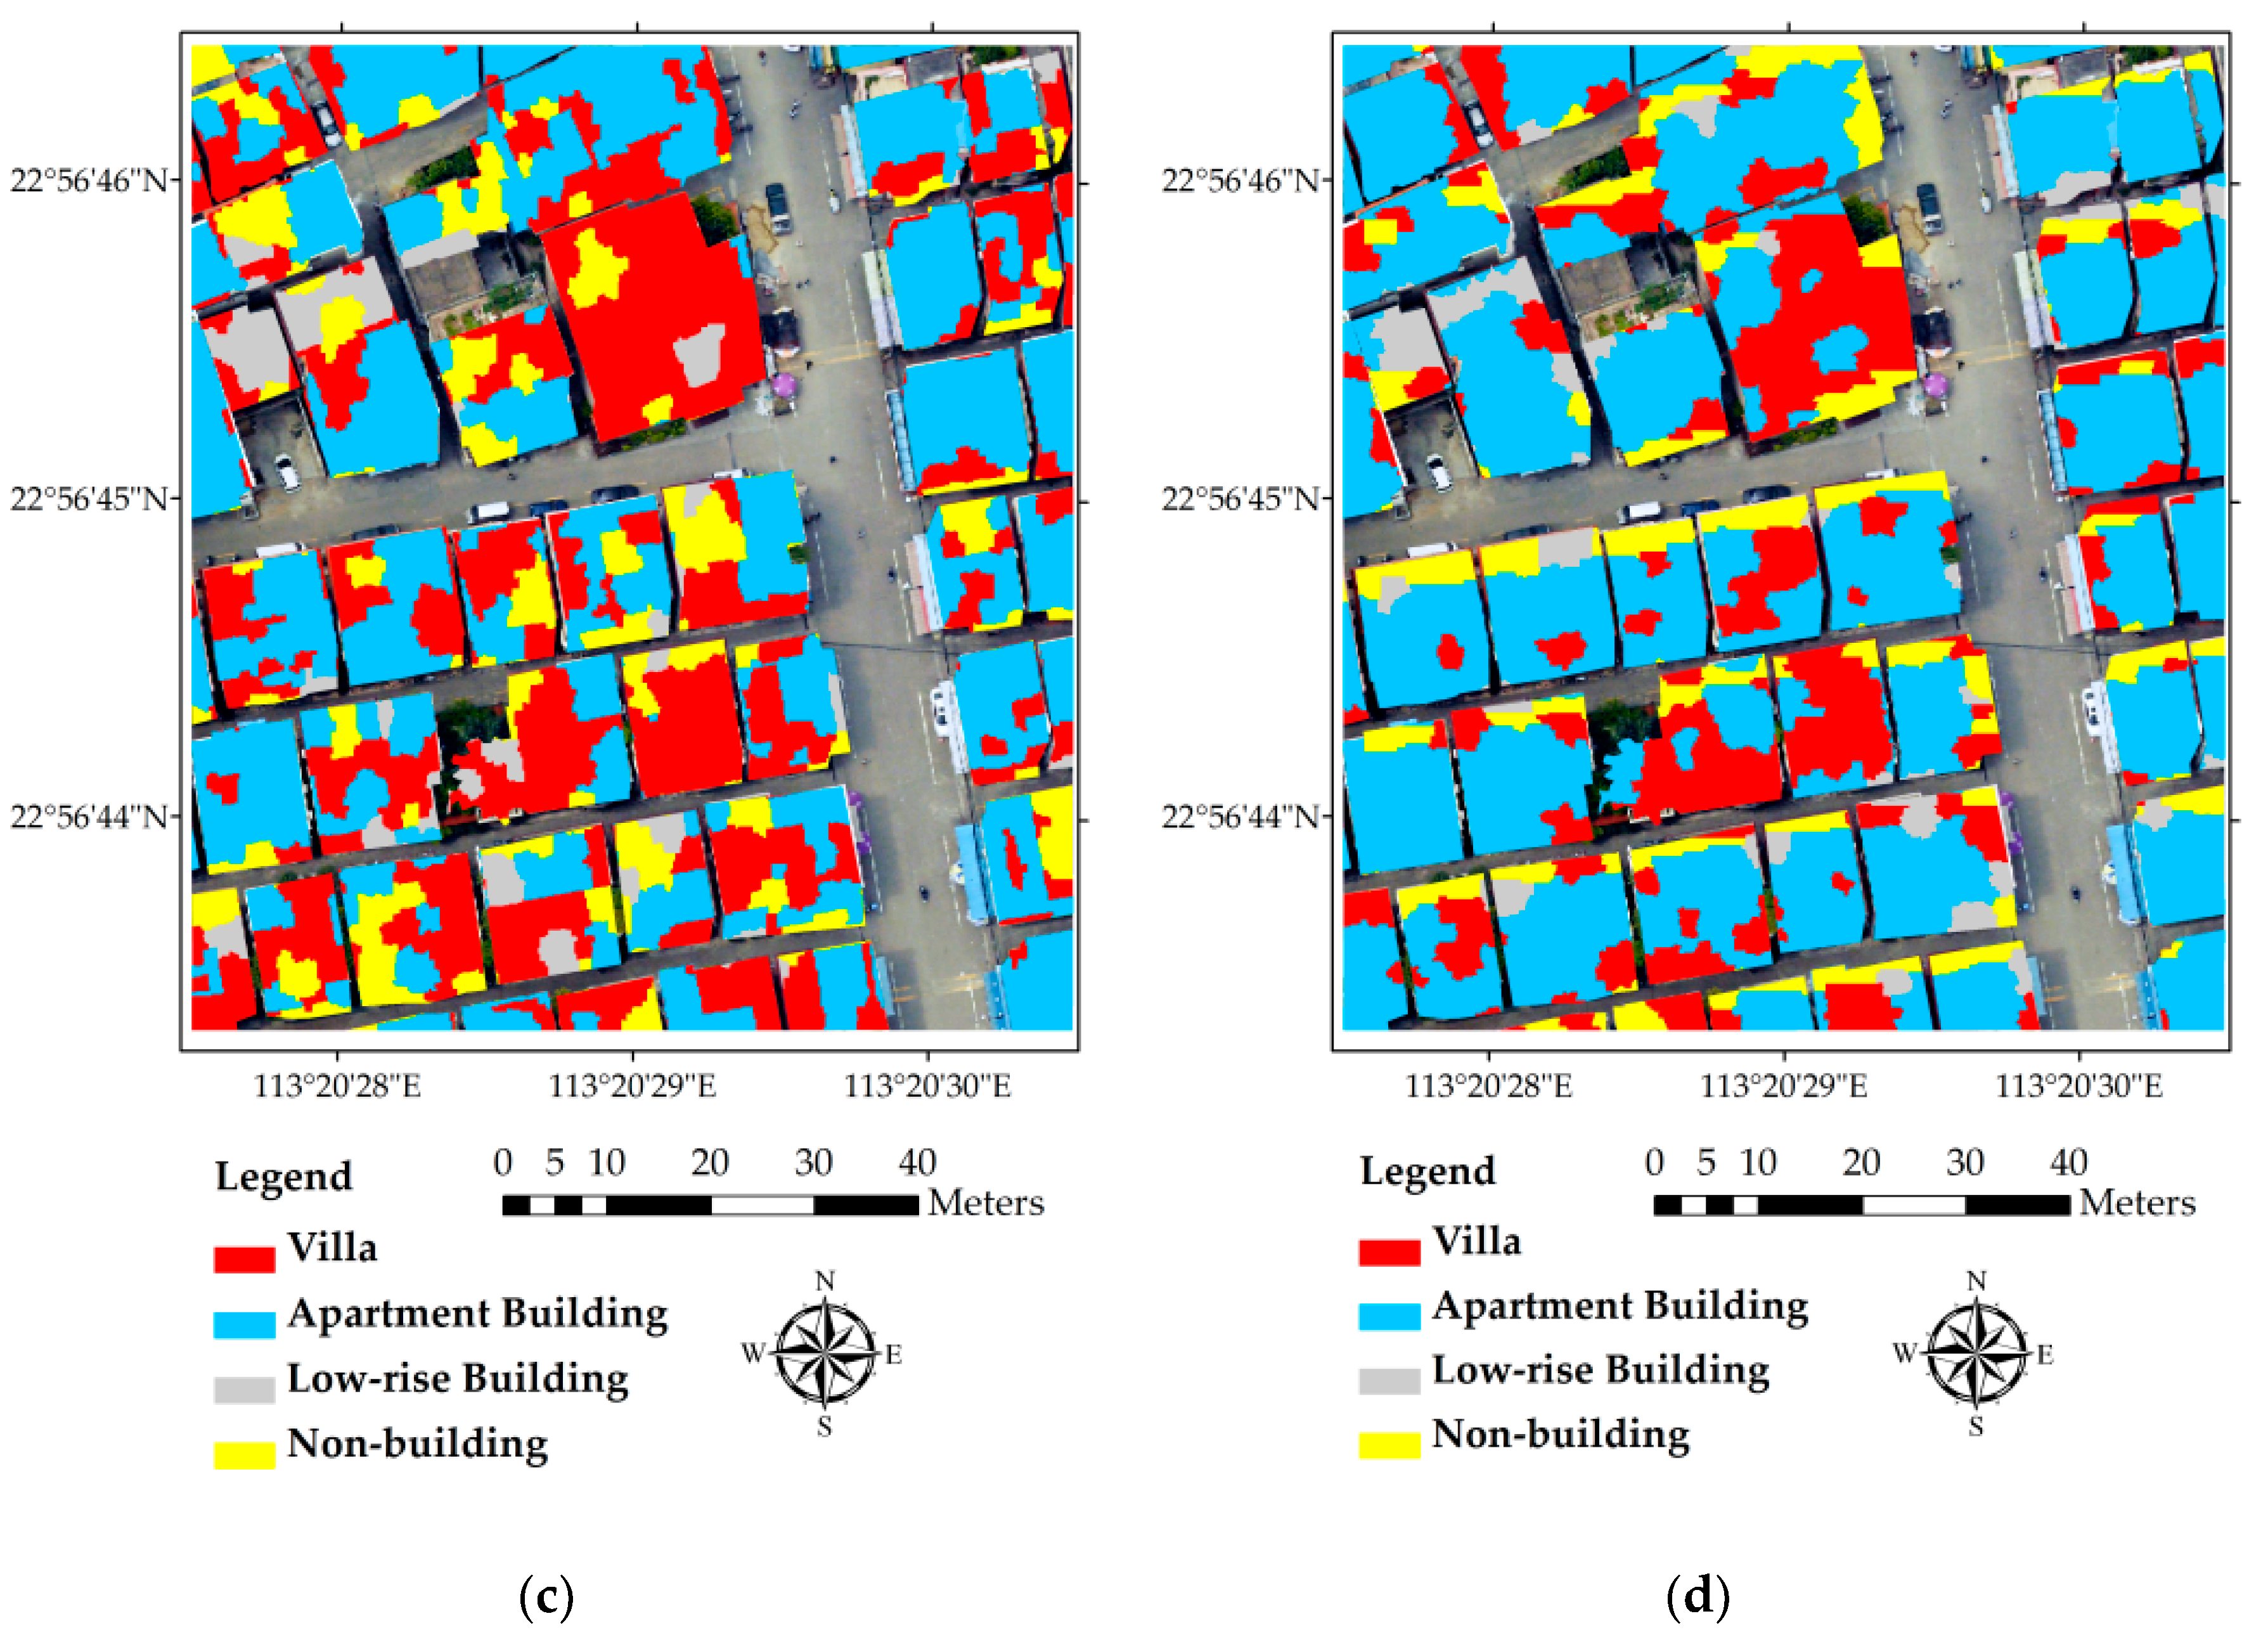
Figure 9.
Comparison of dominant building type derived from four different data combinations: (a) ground truth information; (b) integrated data with super-object information; (c) integrated data; (d) high-resolution image only; and (e) LiDAR only.
Figure 9.
Comparison of dominant building type derived from four different data combinations: (a) ground truth information; (b) integrated data with super-object information; (c) integrated data; (d) high-resolution image only; and (e) LiDAR only.


Figure 10.
Building type classification results derived by support vector machine (SVM): (a) segment level result; (b) building level result.
Figure 10.
Building type classification results derived by support vector machine (SVM): (a) segment level result; (b) building level result.

Table 1.
Coordinate offsets of the four sample buildings (unit: m).
| No. | Position | Real Coordinate 1 | Extracted Coordinate | Offsets | |||
|---|---|---|---|---|---|---|---|
| X | Y | X | Y | ∆X | ∆Y | ||
| 1 | Northwest | 31.9 | 709.1 | 32.2 | 706.6 | −0.3 | 2.5 |
| Southwest | 42.7 | 713.6 | 43.9 | 710.3 | −1.2 | 3.3 | |
| Northeast | 35.7 | 695.3 | 36.9 | 694.7 | −1.2 | 0.6 | |
| Southeast | 46.5 | 697.8 | 46.5 | 697.8 | 0 | 0 | |
| 2 | Northwest | 73.1 | 729.8 | 73.1 | 729.8 | 0 | 0 |
| Southwest | 74.6 | 720.7 | 74.6 | 720.7 | 0 | 0 | |
| Northeast | 83.0 | 734.9 | 83.3 | 732.6 | −0.3 | 2.3 | |
| Southeast | 83.6 | 721.9 | 83.6 | 721.9 | 0 | 0 | |
| 3 | North | 9.2 | 709.9 | 9.0 | 708.7 | 0.2 | 1.2 |
| Southwest | 9.2 | 689.5 | 9.2 | 689.5 | 0 | 0 | |
| Southeast 1 | 15.4 | 693.0 | 15.0 | 692.8 | 0.4 | 0.2 | |
| Southeast 2 | 15.2 | 691.3 | 14.3 | 691.0 | 0.9 | 0.3 | |
| 4 | Northwest | 49.8 | 679.4 | 49.8 | 679.4 | 0 | 0 |
| Southwest | 51.4 | 662.8 | 51.4 | 662.8 | 0 | 0 | |
| Northeast | 39.7 | 674.4 | N/A | N/A | N/A | N/A | |
| Southeast | 41.6 | 661.4 | N/A | N/A | N/A | N/A | |
1 Since the four buildings selected are all located in a small region with a size of 85 m by 95 m and a resolution of 0.1 m, the four leading digits of their corners’ coordinates are all the same (4324 for X coordinates and 2538 for Y coordinates). For the sake of simplicity, we omitted the four leading digits for all the coordinates in Table 1.
Table 2.
Confusion matrix (in percentage) of segment-level building type classification results of the study area.
Table 2.
Confusion matrix (in percentage) of segment-level building type classification results of the study area.
| Confusion Matrix | Reference | ||||
|---|---|---|---|---|---|
| Villa | Apartment Building | Low-Rise Building | Non-Building | ||
| Classified | Villa | 71.82% | 16.82% | 2.27% | 9.09% |
| Apartment building | 8.93% | 82.57% | 1.96% | 6.54% | |
| Low-rise building | 6.82% | 11.36% | 72.73% | 9.09% | |
| Non-building | 4.59% | 7.34% | 3.67% | 84.40% | |
Table 3.
Accuracy assessment of segment-level classification of the study area.
| Accuracy Assessment | Villa | Apartment Building | Low-Rise Building |
|---|---|---|---|
| Producer’s Accuracy | 71.82% | 82.57% | 72.73% |
| User’s Accuracy | 74.53% | 85.73% | 59.26% |
| Overall Accuracy | 80.02% | ||
| Kappa Coefficient | 0.6971 | ||
Table 4.
Confusion matrix (in percentage) of building-level classification results of the study area.
Table 4.
Confusion matrix (in percentage) of building-level classification results of the study area.
| Confusion Matrix | Classified | |||
|---|---|---|---|---|
| Villa | Apartment Building | Low-Rise Building | ||
| Reference | Villa | 100.00% | 0.00% | 0.00% |
| Apartment building | 2.13% | 97.87% | 0.00% | |
| Low-rise building | 0.00% | 0.00% | 100.00% | |
Table 5.
Comparison of the out-of-bag (OOB) error rate and key parameters of the random forest classifier when four different data combinations are used.
Table 5.
Comparison of the out-of-bag (OOB) error rate and key parameters of the random forest classifier when four different data combinations are used.
| Method | OOB Error Rate | Trees | Branches |
|---|---|---|---|
| LiDAR Only | 33.33% | 200 | 3 |
| HRI Only | 30% | 50 | 10 |
| Integrated Data | 26.47% | 300 | 5 |
| Integrated Data with super-object information | 14.89% | 50 | 3 |
Table 6.
Comparison of the F Statistics for different dominant building types when four different data combinations are used.
Table 6.
Comparison of the F Statistics for different dominant building types when four different data combinations are used.
| Different Data Combinations | Building Types | Recall (%) | Precision (%) | F-Score (%) |
|---|---|---|---|---|
| Integrated Data with Super-object | Villa | 100.0 | 60.0 | 75.0 |
| Apartment | 95.8 | 100 | 97.9 | |
| Low-rise | 100.0 | 100.0 | 100.0 | |
| Integrated Data | Villa | 100.0 | 21.4 | 35.3 |
| Apartment | 81.3 | 100.0 | 89.7 | |
| Low-rise | 33.3 | 100 | 50.0 | |
| HRI | Villa | 100.0 | 15.79 | 27.27 |
| Apartment | 66.7 | 100.0 | 80.0 | |
| Low-rise | 100.0 | 50.0 | 66.7 | |
| LiDAR | Villa | 15.0 | 100.0 | 26.1 |
| Apartment | 97.7 | 87.5 | 92.3 | |
| Low-rise | 100.0 | 50.0 | 66.7 |
Table 7.
Confusion matrix (in percentage) of building-level classification results derived by SVM.
| Confusion Matrix | Classified | ||||
|---|---|---|---|---|---|
| Villa | Apartment Building | Low-Rise Building | Non-Building | ||
| Reference | Villa | 75.00% | 0.00% | 0.00% | 25.00% |
| Apartment building | 21.28% | 70.21% | 2.13% | 6.38% | |
| Low-rise building | 0.00% | 0.00% | 66.67% | 33.33% | |
| Non-building | NA | NA | NA | NA | |
© 2017 by the authors. Licensee MDPI, Basel, Switzerland. This article is an open access article distributed under the terms and conditions of the Creative Commons Attribution (CC BY) license (http://creativecommons.org/licenses/by/4.0/).
Share and Cite
MDPI and ACS Style
Huang, Y.; Zhuo, L.; Tao, H.; Shi, Q.; Liu, K. A Novel Building Type Classification Scheme Based on Integrated LiDAR and High-Resolution Images. Remote Sens. 2017, 9, 679. https://doi.org/10.3390/rs9070679
AMA Style
Huang Y, Zhuo L, Tao H, Shi Q, Liu K. A Novel Building Type Classification Scheme Based on Integrated LiDAR and High-Resolution Images. Remote Sensing. 2017; 9(7):679. https://doi.org/10.3390/rs9070679
Chicago/Turabian StyleHuang, Yuhan, Li Zhuo, Haiyan Tao, Qingli Shi, and Kai Liu. 2017. "A Novel Building Type Classification Scheme Based on Integrated LiDAR and High-Resolution Images" Remote Sensing 9, no. 7: 679. https://doi.org/10.3390/rs9070679
Note that from the first issue of 2016, this journal uses article numbers instead of page numbers. See further details here.