Article

Response of Land Surface Phenology to Variation in Tree Cover during Green-Up and Senescence Periods in the Semi-Arid Savanna of Southern Africa

1
Natural Resources and Environment Unit, The Council for Scientific and Industrial Research (CSIR), P.O. Box 395, Pretoria 0001, South Africa
2
Department of Plant and Soil Science, University of Pretoria, Pretoria 0002, South Africa
3
Risk and Vulnerability Assessment Centre, University of Limpopo, Sovenga 0727, South Africa
*
Author to whom correspondence should be addressed.
Remote Sens. 2017, 9(7), 689; https://doi.org/10.3390/rs9070689
Submission received: 1 June 2017 / Revised: 30 June 2017 / Accepted: 2 July 2017 / Published: 4 July 2017

Abstract

:
Understanding the spatio-temporal dynamics of land surface phenology is important to understanding changes in landscape ecological processes of semi-arid savannas in Southern Africa. The aim of the study was to determine the influence of variation in tree cover percentage on land surface phenological response in the semi-arid savanna of Southern Africa. Various land surface phenological metrics for the green-up and senescing periods of the vegetation were retrieved from leaf index area (LAI) seasonal time series (2001 to 2015) maps for a study region in South Africa. Tree cover (%) data for 100 randomly selected polygons grouped into three tree cover classes, low (<20%, n = 44), medium (20–40%, n = 22) and high (>40%, n = 34), were used to determine the influence of varying tree cover (%) on the phenological metrics by means of the t-test. The differences in the means between tree cover classes were statistically significant (t-test p < 0.05) for the senescence period metrics but not for the green-up period metrics. The categorical data results were supported by regression results involving tree cover and the various phenological metrics, where tree cover (%) explained 40% of the variance in day of the year at end of growing season compared to 3% for the start of the growing season. An analysis of the impact of rainfall on the land surface phenological metrics showed that rainfall influences the green-up period metrics but not the senescence period metrics. Quantifying the contribution of tree cover to the day of the year at end of growing season could be important in the assessment of the spatial variability of a savanna ecological process such as the risk of fire spread with time.

Graphical Abstract

1. Introduction

Spaceborne remote sensing has provided a cost effective means to study, understand and monitor spatio-temporal changes in vegetated land surfaces [1]. The study of the seasonal pattern of variation in vegetated land surface using remote sensing is known as land surface phenology [1,2], while the traditional phenology is the study of the recurring patterns of vegetation growth and development and their relation to climate, usually for single vegetation types or species [3,4,5]. For example, the phenology of deciduous trees in the Southern African savanna is characterised by periods of leaf green-up, leaf display and leaf fall [6]. On the other hand, the land surface phenological signature of a remotely sensed pixel in the African savanna is determined by the spectral characteristics of the various vegetation types present in the pixel, which could be any combination of types including deciduous trees, evergreen trees, perennial or annual grasses [1].
Commonly defined land surface phenological metrics include the dates corresponding to the start, end and length of the growing season. These metrics are important parameters in ecosystem simulation models and coupled biosphere/atmosphere models [7]. For example, the timing and the length of the growing season control spatio-temporal variations of carbon and water cycles and influences latent/sensible heat transport [7,8]. Wessels et al. [9] used land surface phenological metrics to describe and map various vegetation biomes in South Africa. Archibald and Scholes [6] have stressed the need for reliable phenological models with the advent global change given the influence of climatic factors on phenological metrics. The land surface phenology of Southern African semi-arid savannas is still largely understudied.
The savanna biome is characterised by a mixture of grasses (herbaceous vegetation in general) and trees of varying ratios e.g., more trees in general means less grass [10,11]. The grass layer is made up of annual and perennial grass species [12,13], while the trees consist of deciduous and evergreen tree species of various heights and crown dimensions [14,15,16]. Savanna grasses and trees have been shown to exhibit differential leaf phenological patterns because of differences in the factors that control the phenological events [6,17]. In general, Southern African savanna phenology is influenced by climate, topography, grazing or browsing activities and fire [18,19]. Grass production is generally limited by rainfall or water availability [6,10]. The start of the growing season of the grass layer has been shown to be closely associated to rainfall [20]. On the other hand, savanna tree species exhibit varying phenological patterns. For example, Whitecross et al. [20] recently demonstrated that the green-up dates amongst savanna tree species are more variable when compared to the differences between grass species. This finding supports the earlier study of Archibald and Scholes [6] who showed that most trees in the Southern part of the Kruger National Park, South Africa flushed new leaves before the onset of the rainy season with the exception Combretum apiculatum and C. Zeyheri which started greening up at the same time with grasses. With respect to interannual variability of the phenological metrics, Archibald and Scholes [6] demonstrated savanna trees show lower interannual variability in phenology in comparison to grasses.
Studying the phenology of savanna trees or grasses using commonly available satellite imageries such the Advanced Very High Resolution Radiometer (AVHRR) and the Moderate Resolution Imaging Spectroradiometer (MODIS) is not feasible because of the difficulties to separate trees and grasses using these coarse resolution sensors. AVHRR (1km resolution) or MODIS (250–500 m) pixels are most often mixed pixels of varying proportion of trees, grasses and bare soil [1]. As described in Archibald and Scholes [6], various studies have made different assumptions in studying the phenology of trees and grasses using the above coarse resolution sensors and reached varying conclusions. For example, over-prediction of early green-up was observed in sites with high grass cover when the grass layer was not considered [21]. In the domain of land surface phenology, the objective is not to study the phenology of trees and grass separately but rather to understand the periodic events of vegetation growth and development occurring at the pixel level. In the case of the savanna, it would entail studying the composite phenology of grasses and trees at the broad landscape. An extensive land surface phenological study undertaken by Guan et al. [1] on African savannas and woodlands revealed that African woodlands generally show early green-up before the onset of the rainy season and have a variable delayed senescence period after the rainy season. They also showed that the length of growing season had a positive linear relationship with tree cover fractions and that interannual variability in woodland phenological phases is smaller in comparison to grasses. The specific influence of varying tree cover fractions across the landscape on the spatio-temporal variations in land surface phenology in the semi-arid savanna of Southern Africa is not well understood.
Chidumayo [17] indicated that the ratio of tree:grass affects the spectral response (e.g., NDVI) of savanna pixels, and by implication should affect the phenological response of the pixels. For example, Fuller [22] showed that areas with relatively low tree canopy closure senesced earlier than tree dominated areas in Miombo woodlands. The main aim of this study was therefore to determine the influence of varying tree cover on the land surface phenology of the semi-arid savanna of Southern Africa, using the savanna landscape of South Africa as the study area. The influence of annual variation of rainfall on land surface phenology in the region was assessed.
Understanding the contribution of tree cover to land surface phenology could be relevant in the assessment of savanna ecosystem processes such as the spread of fire. The spread of fire in Southern African savanna is mainly determined by the amount of vegetation (herbaceous biomass and tree cover) and the state of the vegetation e.g., moisture content [23,24] and by implication, the phenological status of the vegetation. Bajocco et al. [25] concluded that the vegetation phenological status represents the main driver affecting fuel availability and moisture content and further argued that any investigation on fire behaviour over large areas requires the ability of mapping the spatio-temporal changes in vegetation phenology. Staver et al. [26] showed that fire spreads only at tree cover less than 40%. Therefore, the combined information on the contribution of trees to the land surface phenology of savannas and tree cover fractions could improve fire risk assessment in these systems.

2. Materials and Methods

The methodology involved:
-
determining land surface phenological metric from leaf area index (LAI) time series data via a Gaussian model approach;
-
determining the influence of percentage tree cover on various land surface phenological metrics in two ways: (i) assessing whether significant differences exist between three tree cover classes for each land surface phenological metric; and (ii) assessing the strength of the relationship between each land surface phenological metric and percentage tree cover; and
-
assessing the influence of rainfall on land surface phenology by Pearson’s correlation between mean rainfall data with the land surface phenological metric.
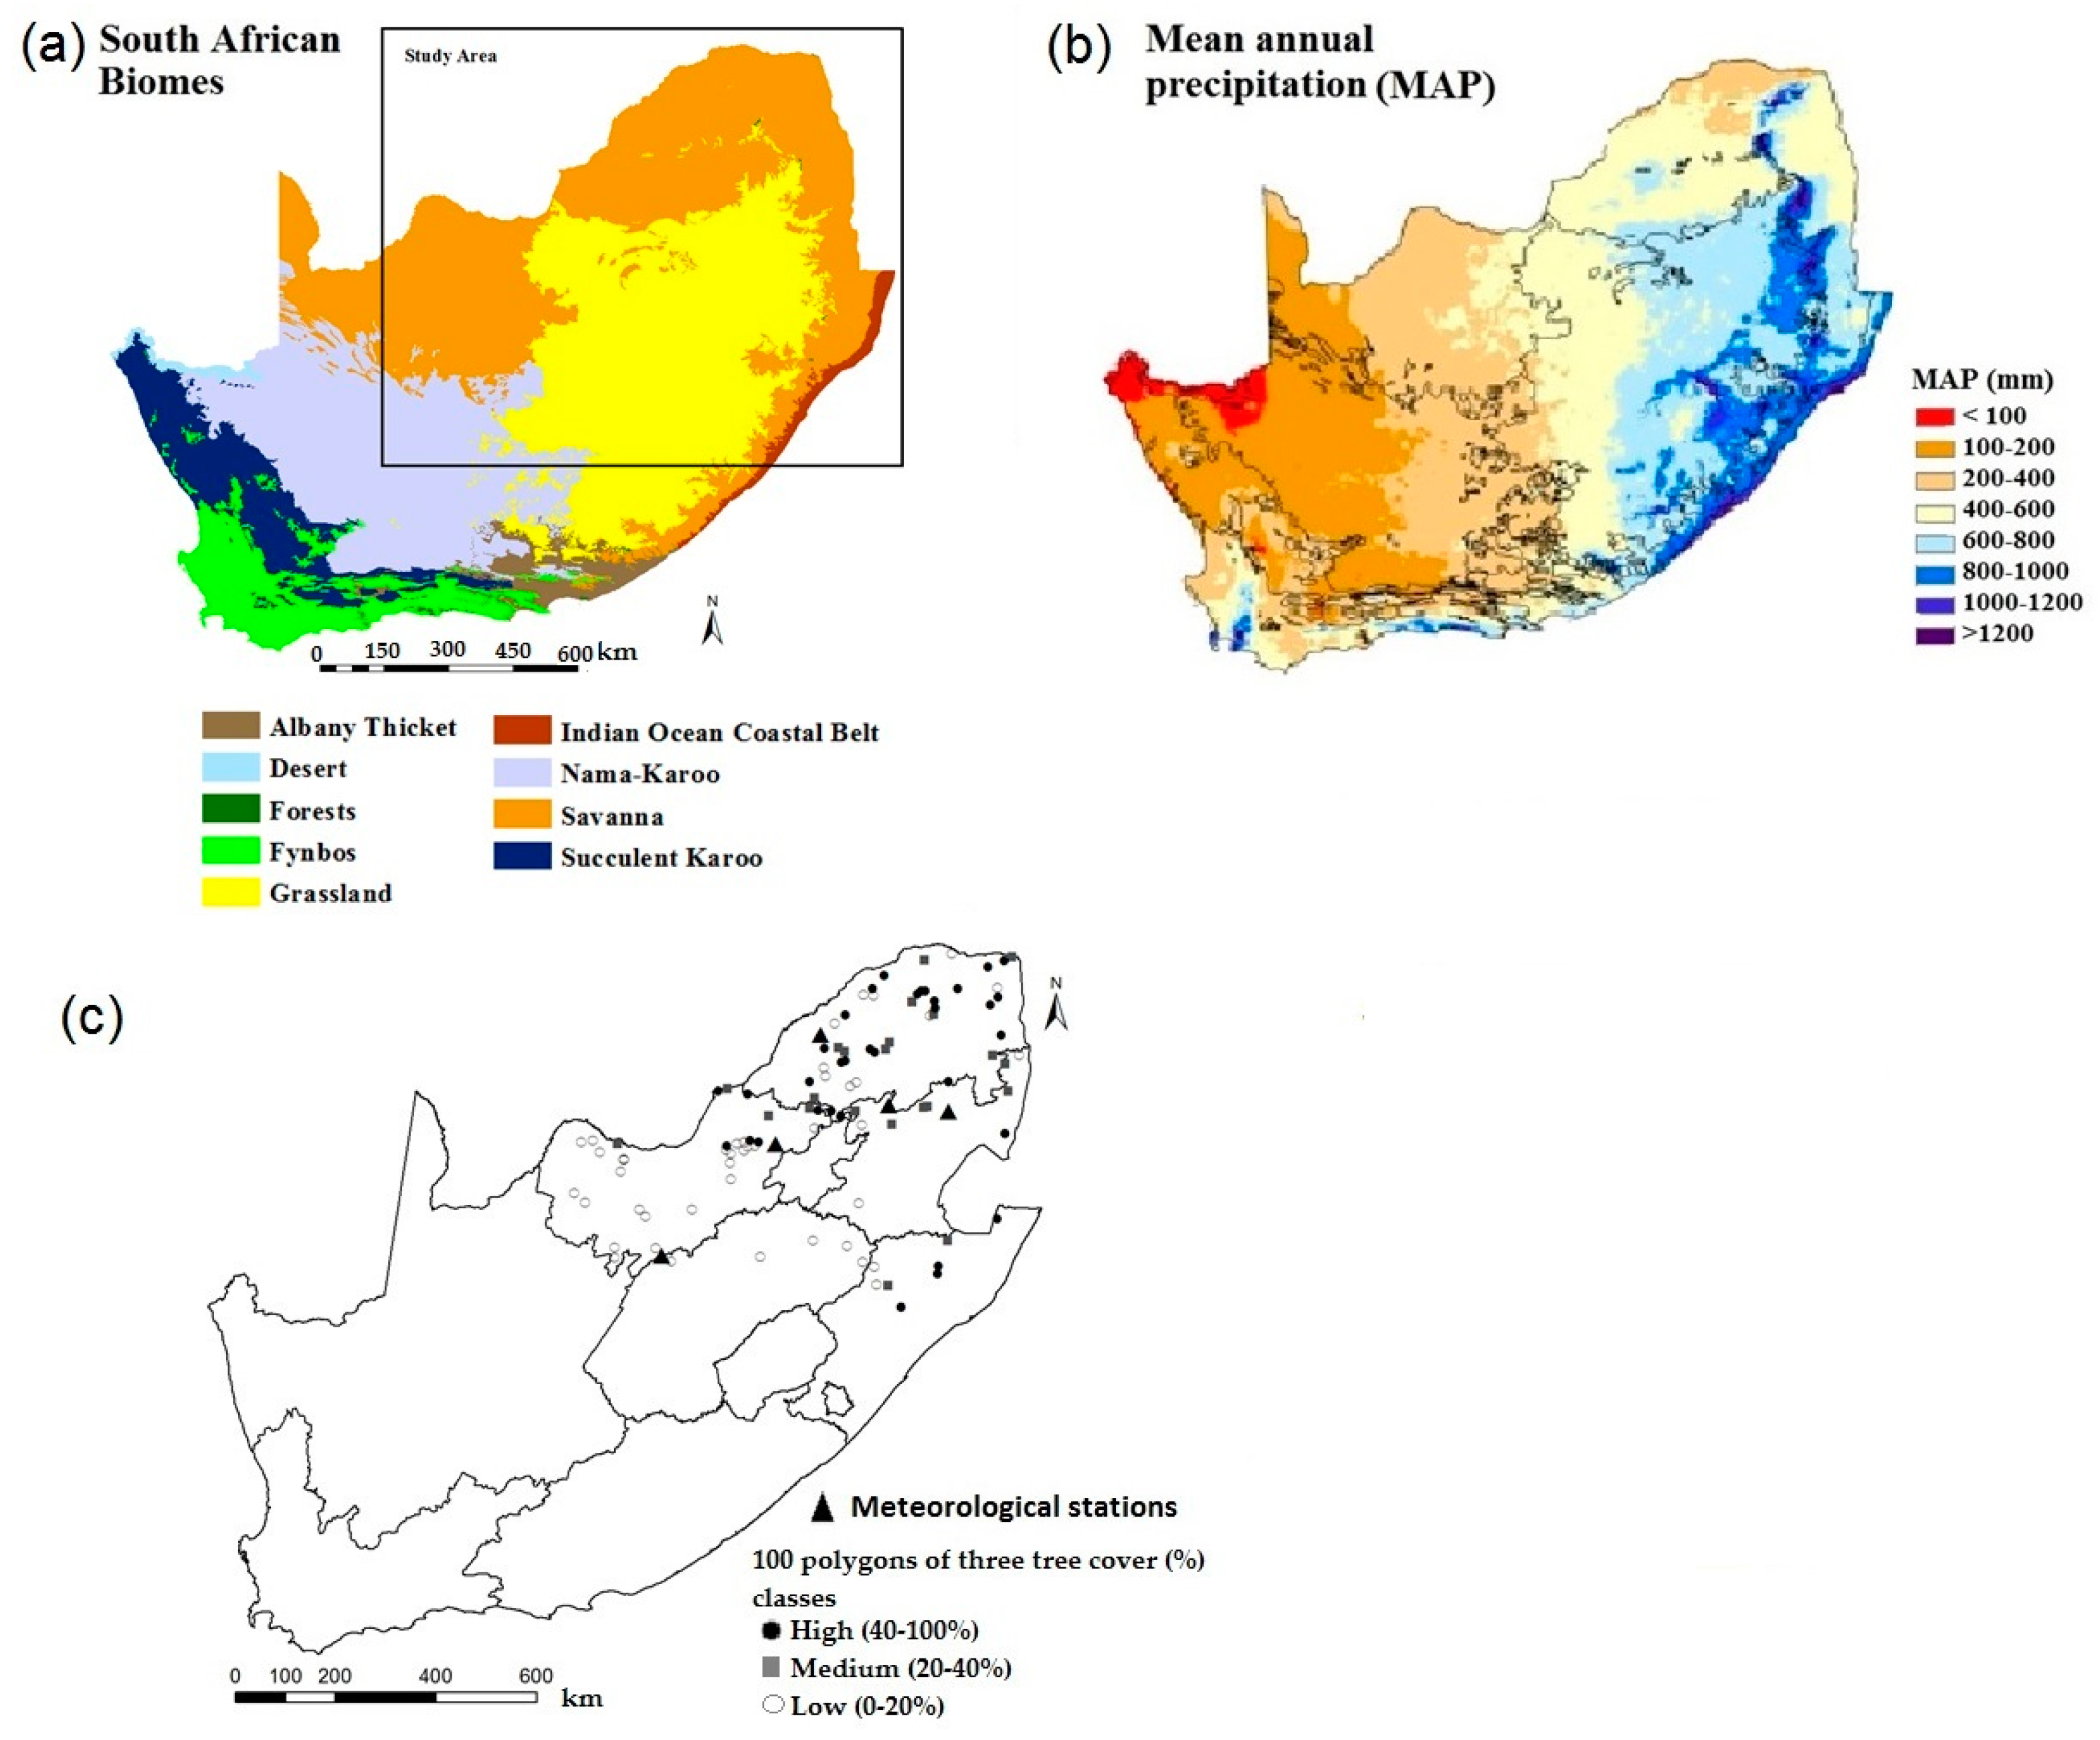
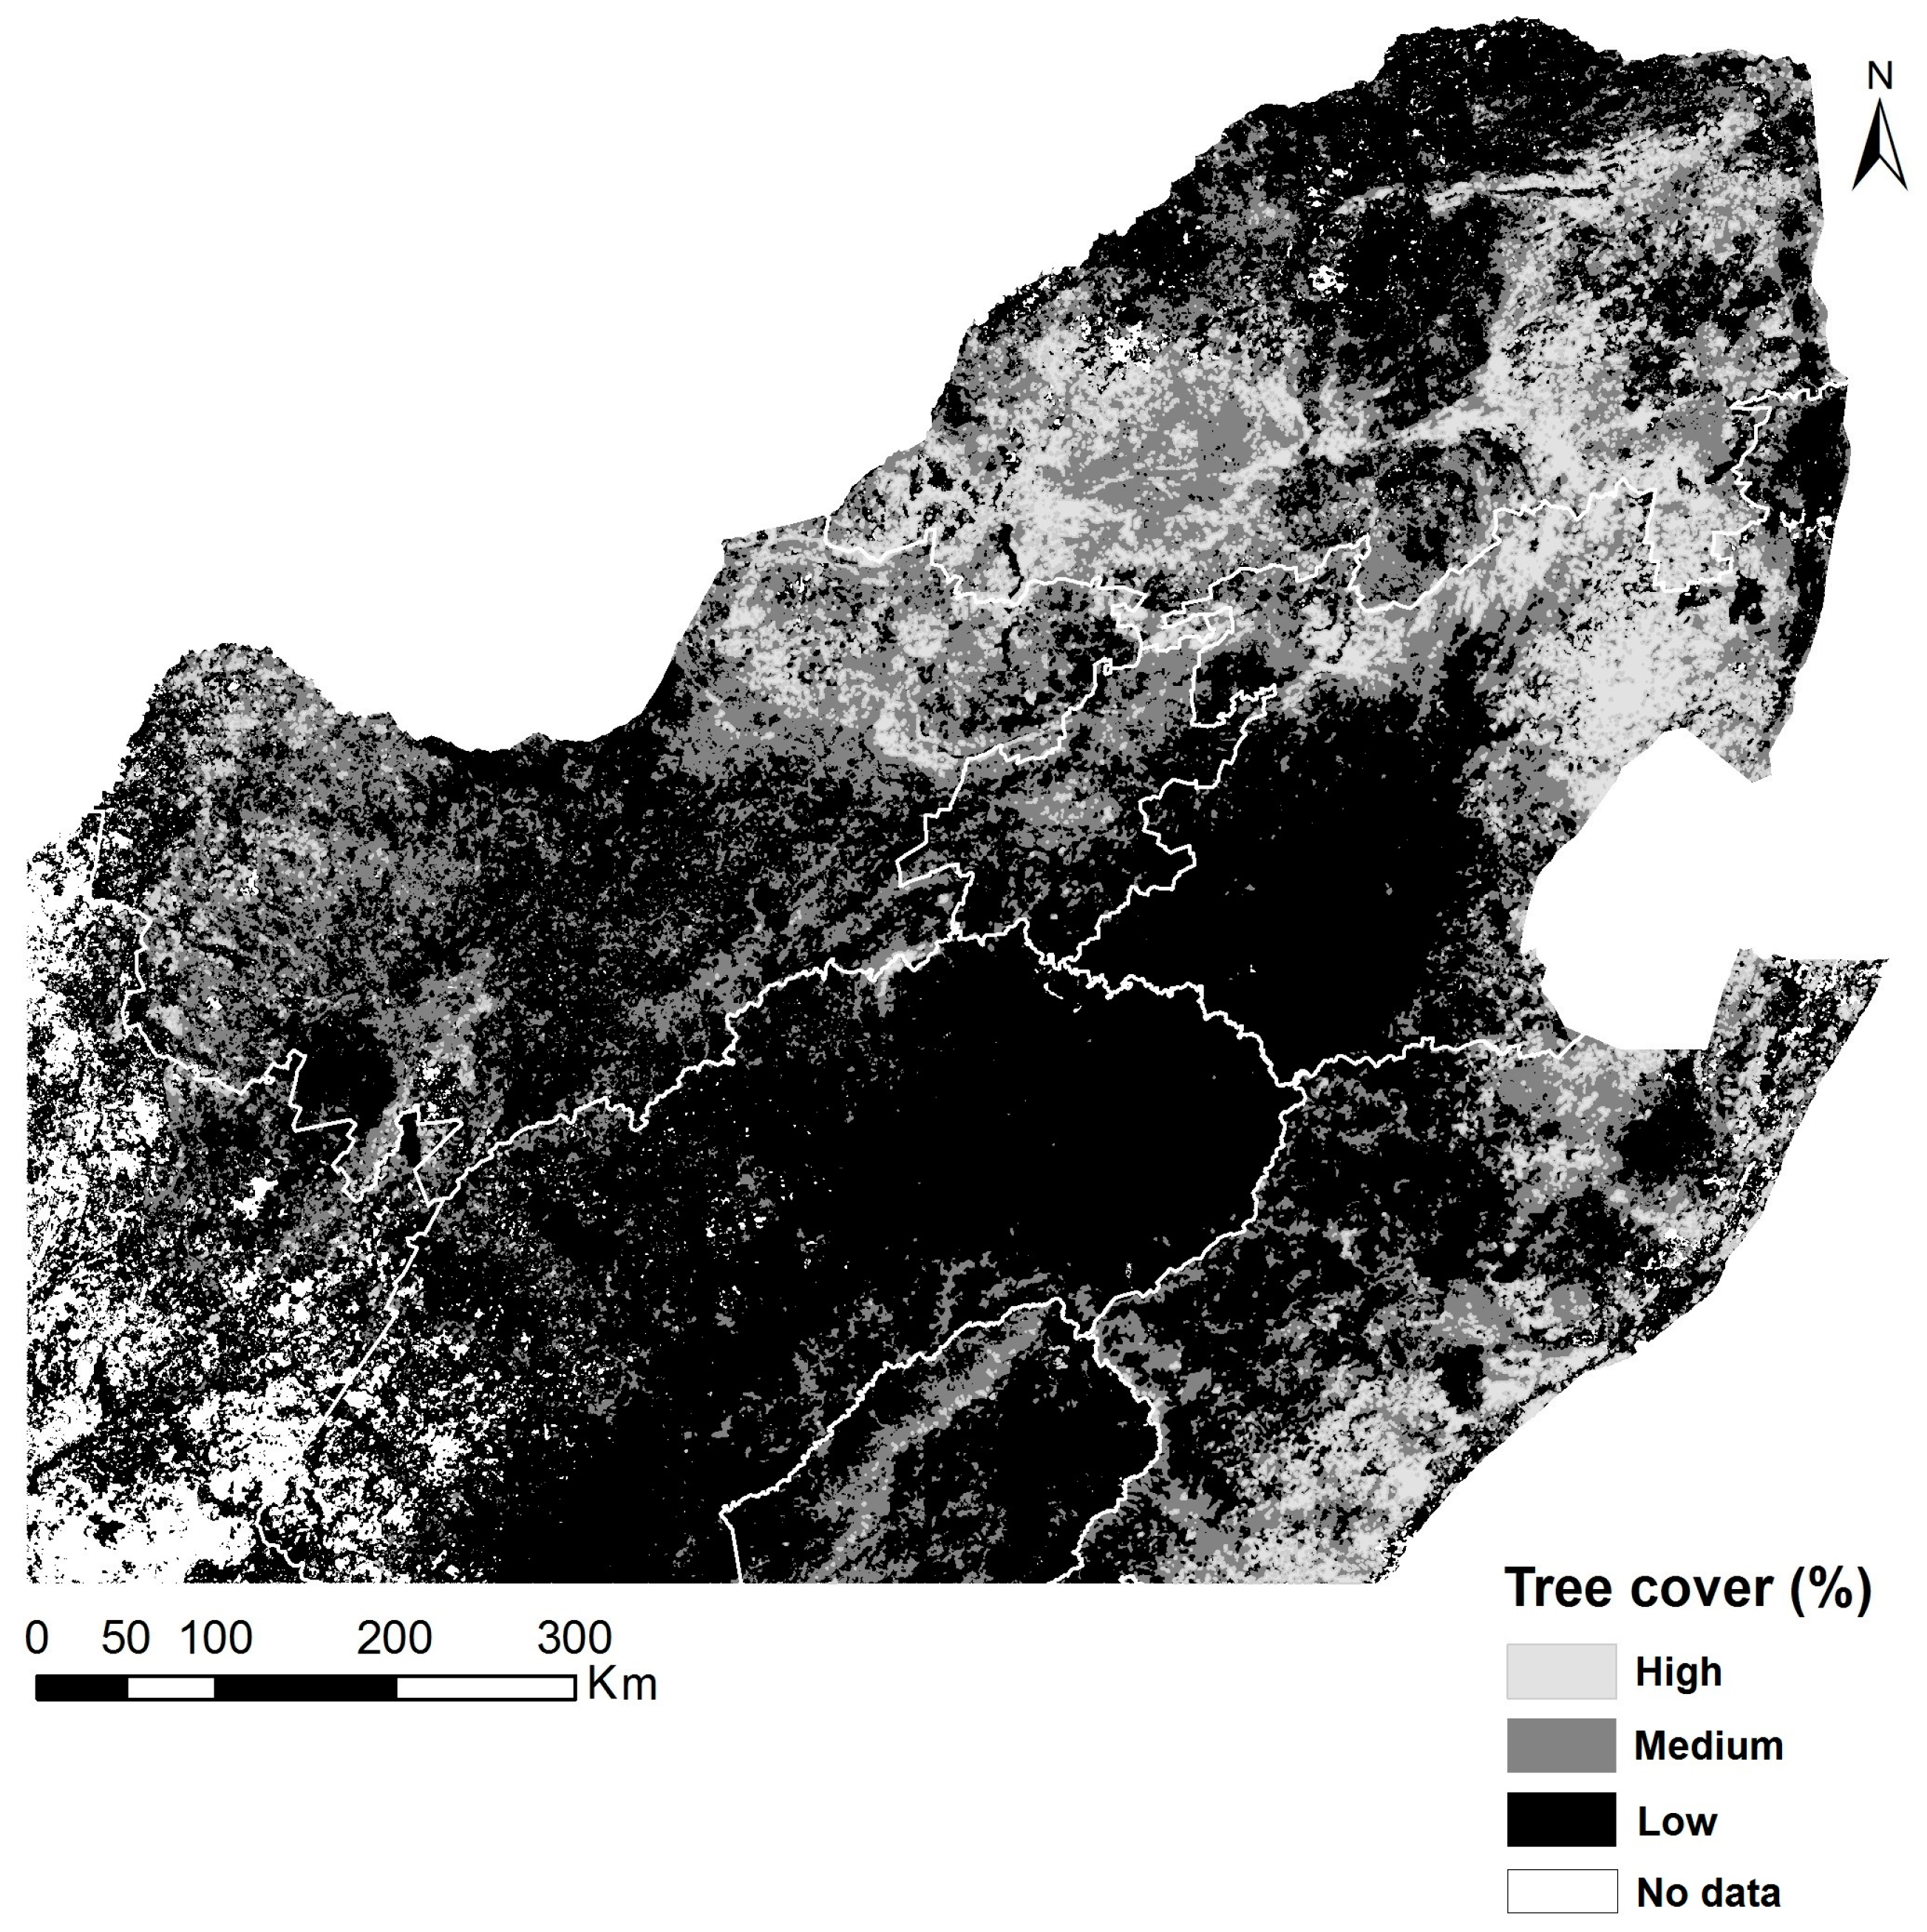
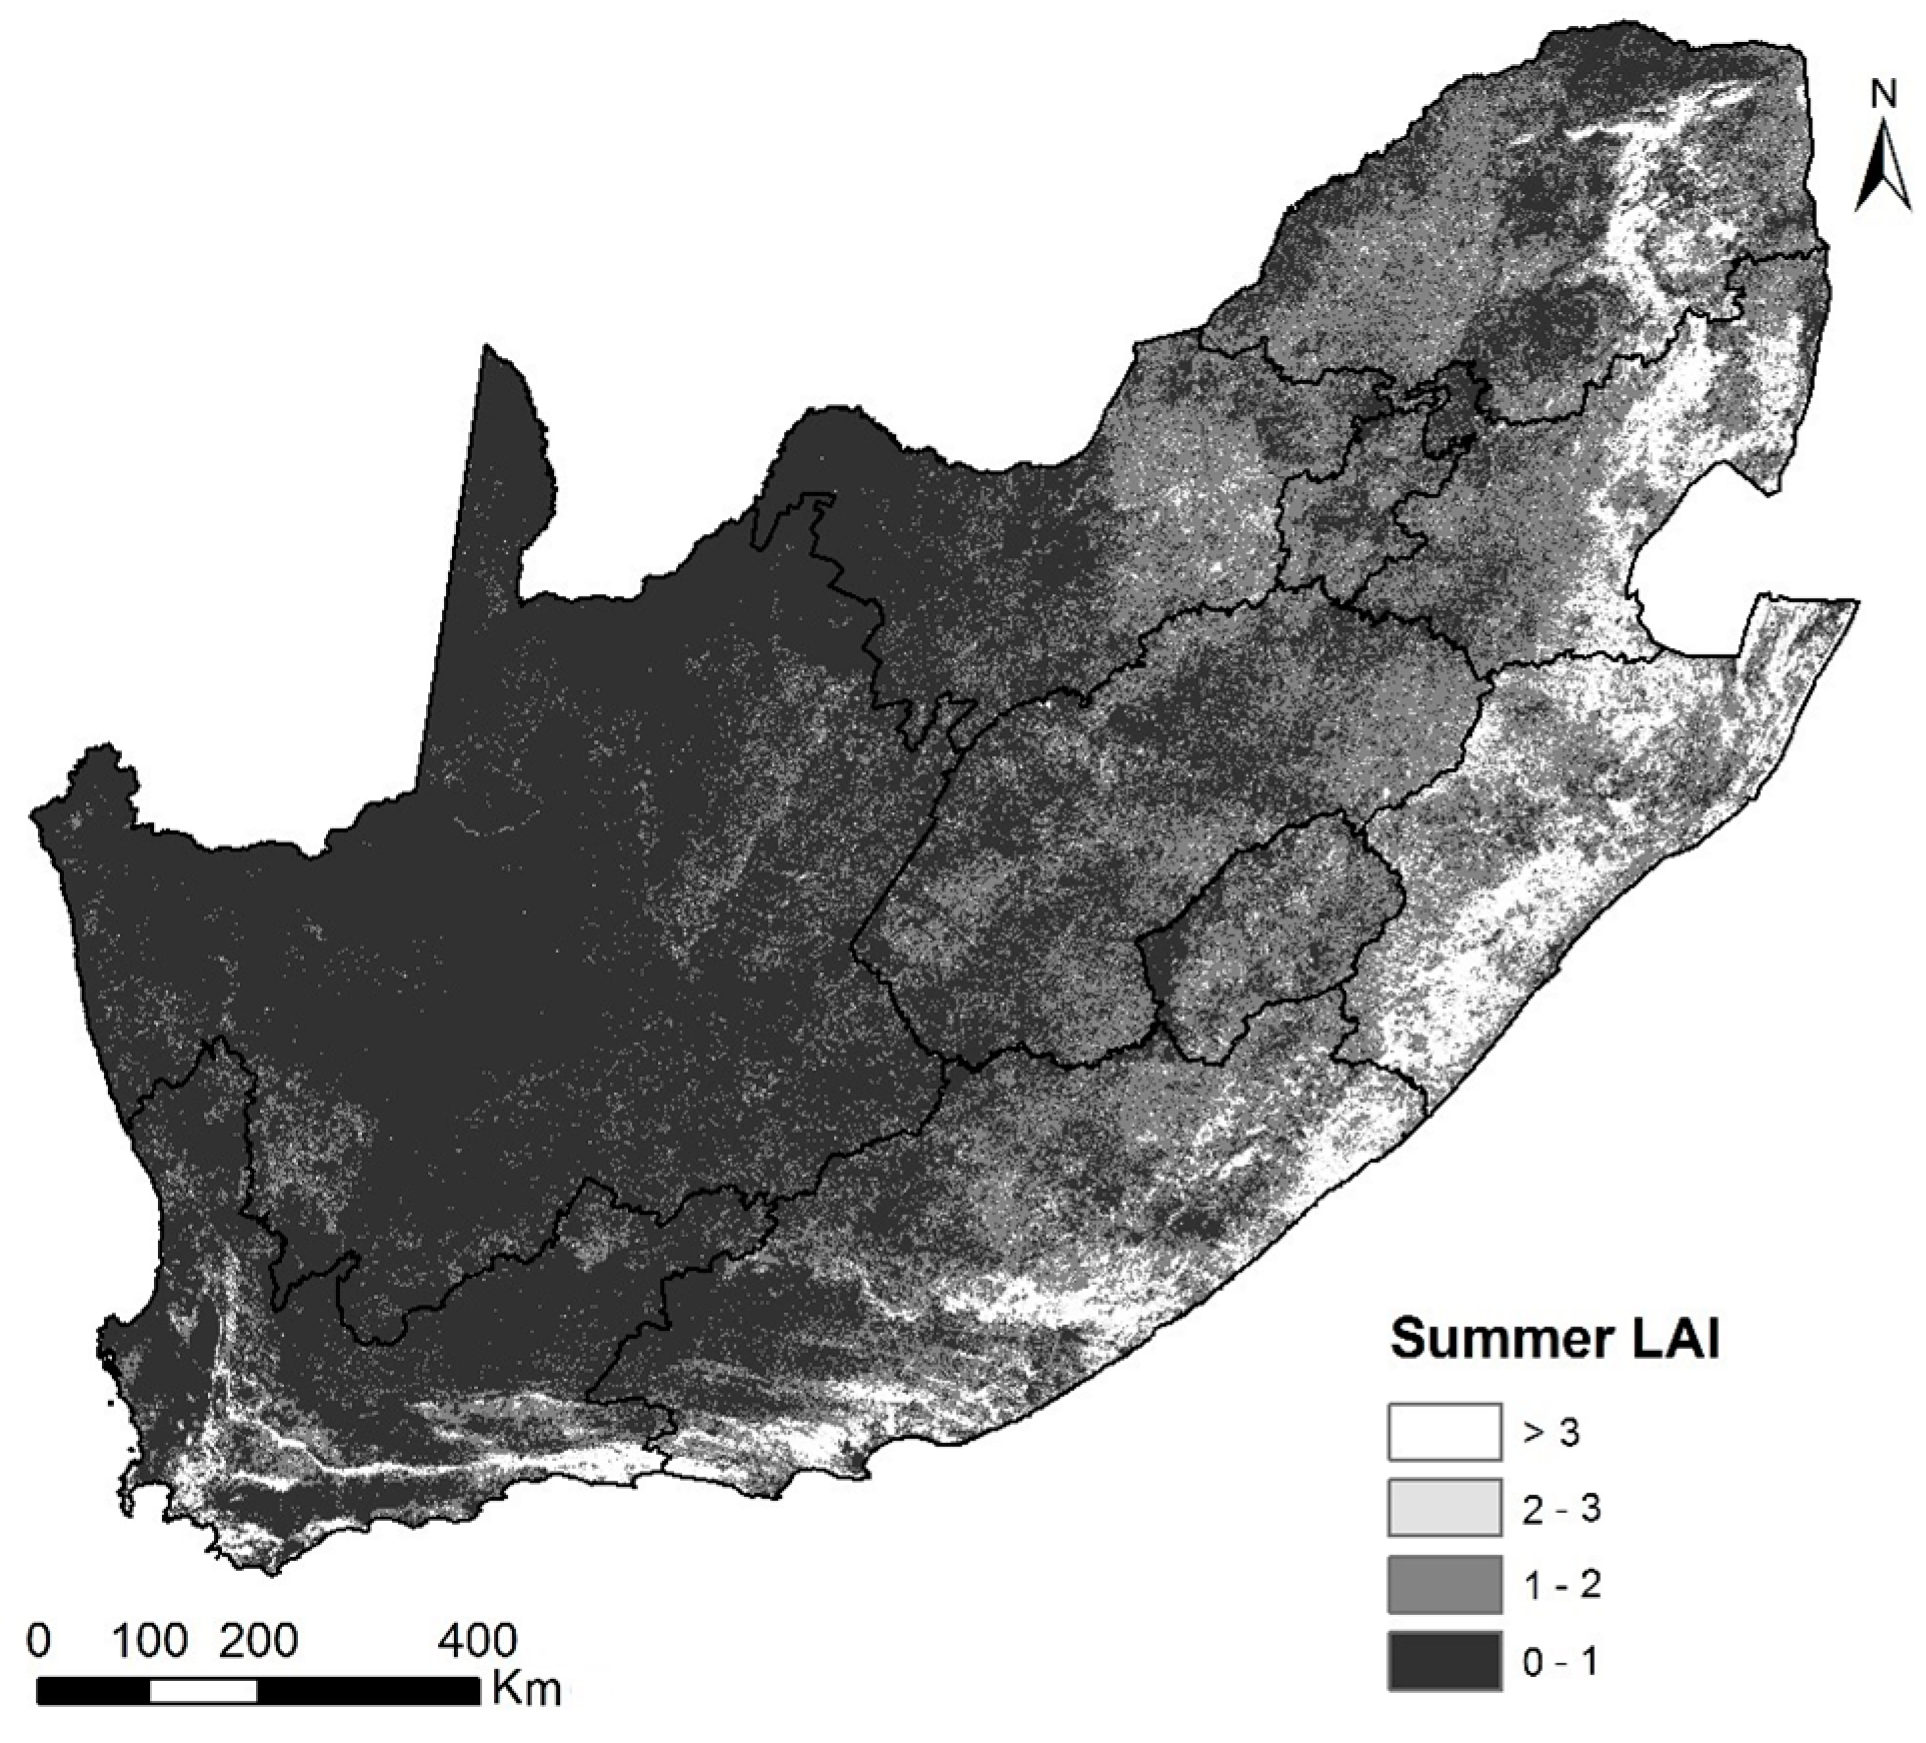
This section starts by first describing the study area, and how the input data into the various analyses were derived i.e., the: (i) percentage tree cover for 100 randomly selected plots using high resolution Google Earth imagery; and (ii) LAI time series imagery by applying a regression model developed from synthetic data simulated using a canopy radiative transfer model on MODIS images.

2.1. Study Area

The study area consists of MODIS tile: h20v11, clipped to South African boundaries (Figure 1). Two main biomes dominate the MODIS tile, namely the savanna and grassland [9,27] (Figure 1a). The main focus though was on the savanna biome, which is in a hot semi-arid climatic zone, characterised by summer rainfall (September to April). The 2002–2015 precipitation data of five meteorological stations (Rustenburg, Marbel Hall, Moosriver, Lephalale, Bloemhof and Escelsior-benchmark) located in the region showed a mean annual rainfall of 820 mm. The rainfall data were obtained from the Agricultural Research Council (ARC) of South Africa. However, as can be observed in Figure 1b, mean annual rainfall varies across the region.

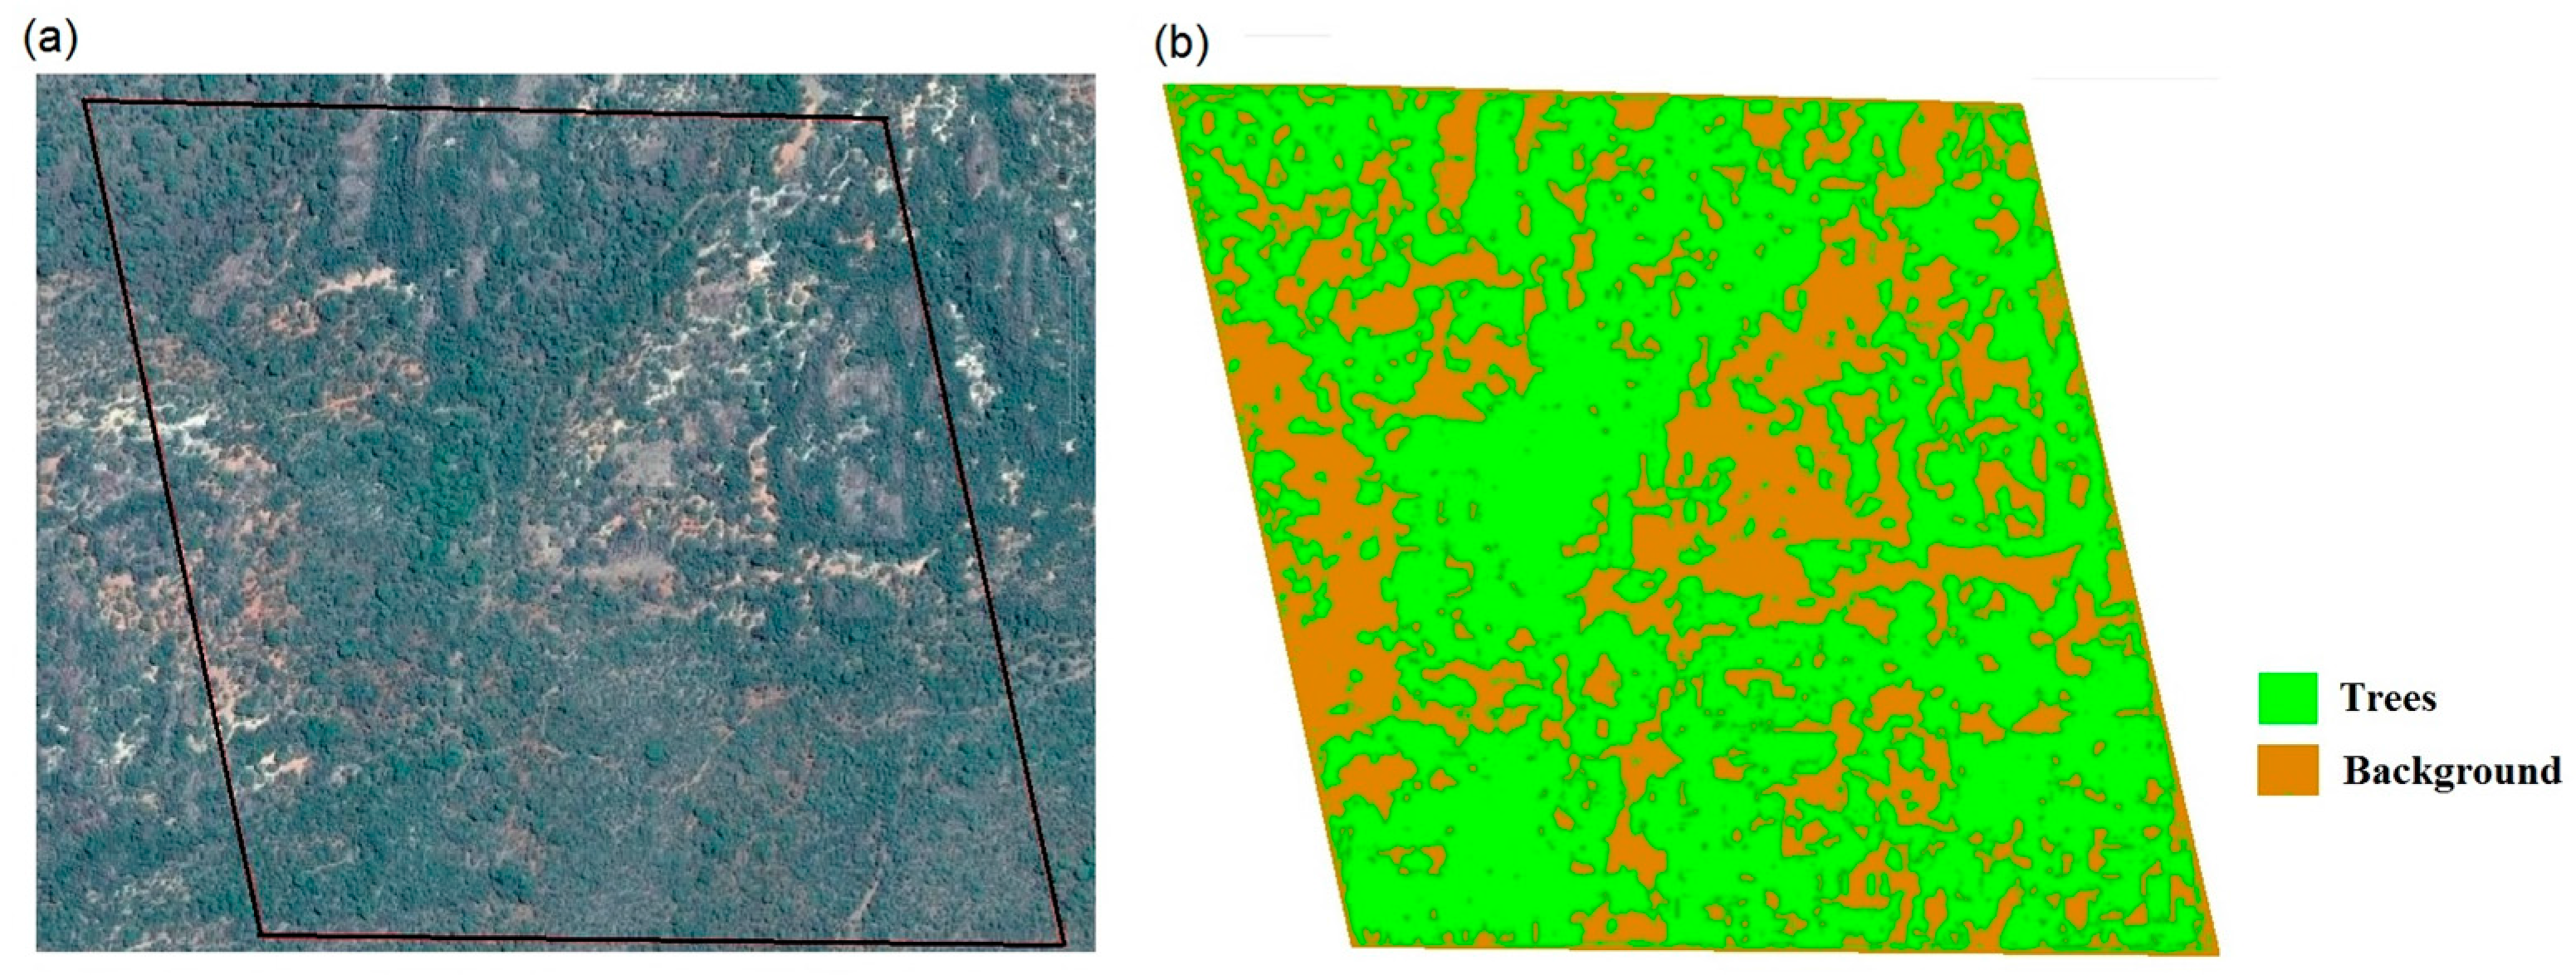
2.2. Tree Cover Percentage Estimation

We have assessed the quantity of woody plants in the system using tree canopy cover percentage [10]. The tree cover estimates were determined from Google Earth high resolution imagery using similar methods described by Duhl et al. [28] and Ludwig et al. [29]. One hundred fifty random polygons (2 by 2 pixels or 926 m by 926 m) were generated on the MODIS image scene, converted to kml files and overlaid on Google Earth high resolution image in the Google Earth software (Google Inc.) (Figure 1c). Only polygons that have not undergone changes in tree cover from 2001 to 2016 were retained for the study. This was achieved by examining historical images of each polygon. Polygons with no high resolution historical images were also not considered. Polygons that fell on plantation forest, crop fields and settlements were not considered and only images acquired during the summer months were used because woody cover in the savanna is known to vary with season [22]. We stopped the exercise at the first 100 polygons. Three-band (red-green-blue) raster image scenes (JPEG format, Figure 2a) of the polygons were captured and imported into an image processing, ENVI software (ITT Visual information solutions). In ENVI, the scenes were classified into two classes (tree and non-tree) using a minimum distance supervised classification (see Figure 2 for an illustration of the process). The percentage tree cover per polygon was determined from the classified polygon as a ratio of the area of the tree-class to the total area of the polygon.

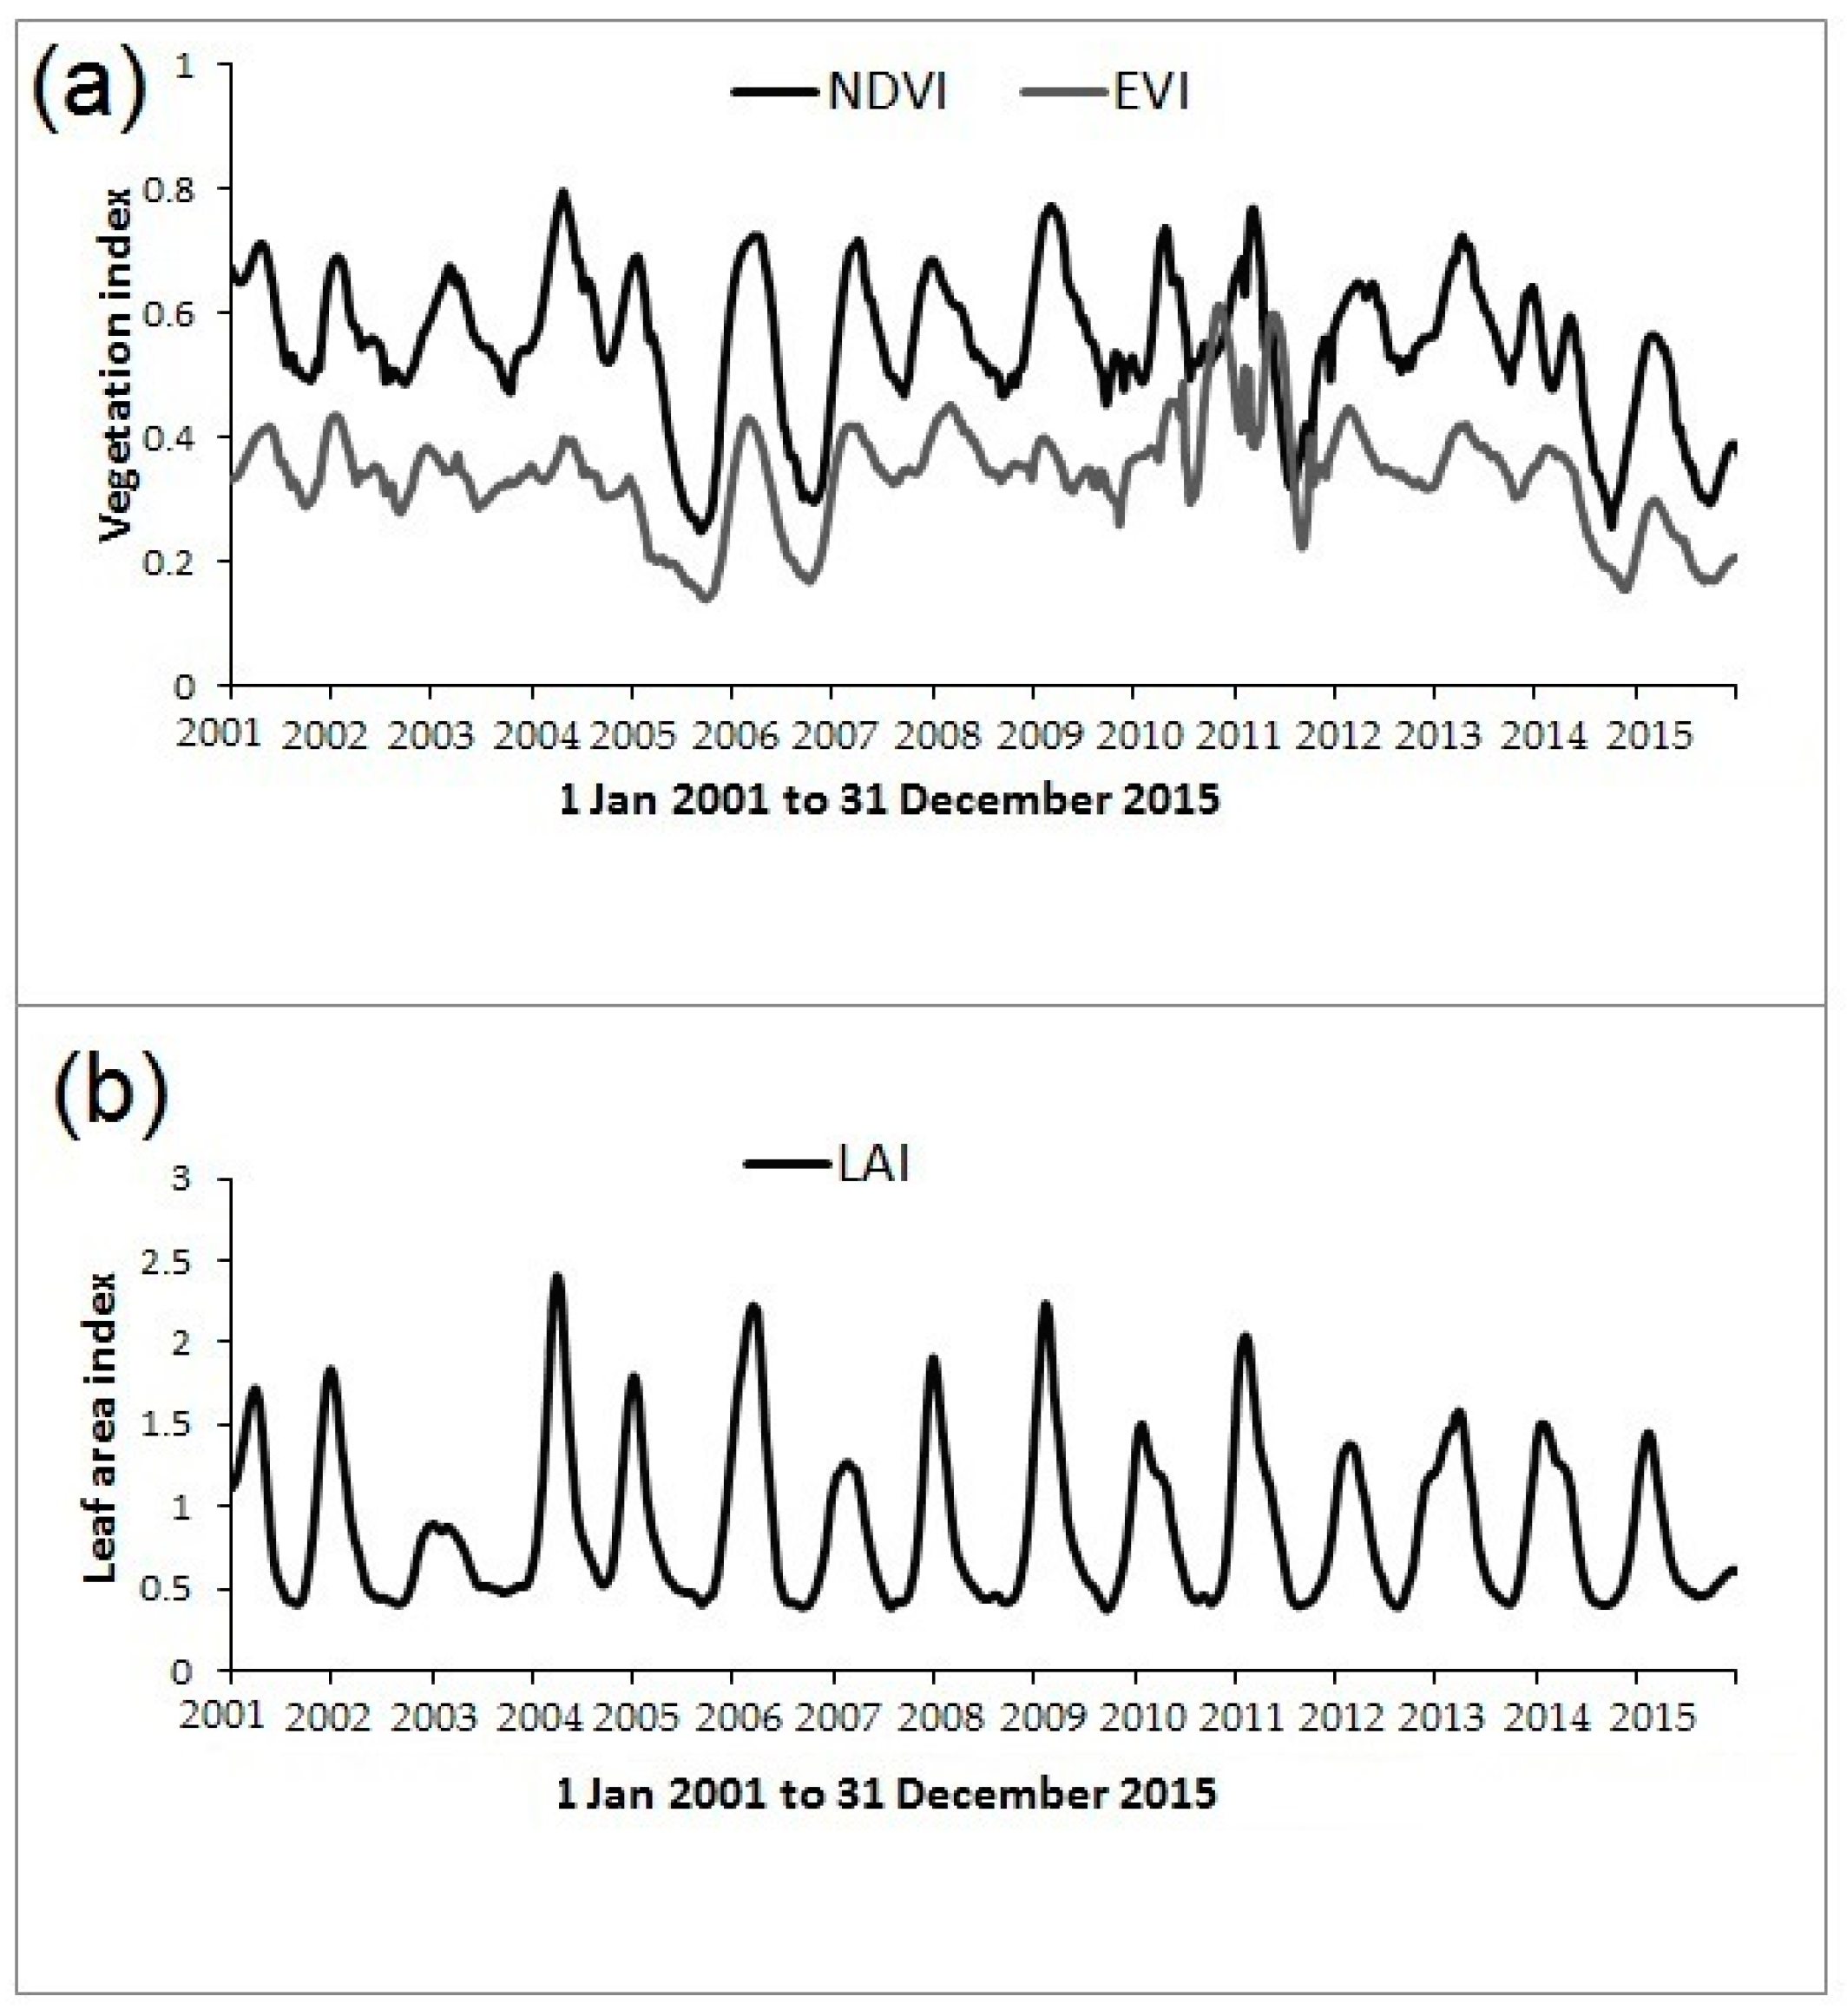
2.3. MODIS Imagery and Leaf Area Index (LAI) Time Series

Most studies have computed land surface phenological metrics from the normalised difference vegetation index (NDVI) or enhanced vegetation index (EVI) time series [30,31], but rarely from leaf area index (LAI) time series. The NDVI time series for African savannas are noted for their irregular temporal patterns [32]. We also found the NDVI time series for the study area to be noisier than the LAI time series (e.g., Figure 3), even after applying a Savitzky–Golay smoothing filter (5 window filter, 5th order polynomial) to the data. The LAI time series for the MODIS tile (h20v11, MOD09A1 eight-day composite images at 463 m resolution) were established by using a regression model that was derived from synthetic data simulated from the PROSAIL radiative transfer model [33]. PROSAIL is a combination of PROSPECT (a leaf optical properties model) and SAIL (a four-stream canopy radiative transfer model). First, synthetic canopy spectral reflectance data were simulated from the commonly used PROSAIL radiative transfer model in the 400–1060 nm optical range at 10 nm bandwidth, using MATLAB software. In the forward modelling mode, PROSAIL was parameterised using commonly used parameter ranges. Leaf (PROSPECT) parameters included: Chlorophyll content (0 to 90 µg/cm2), equivalent water thickness (0.0005–0.055 cm), leaf dry matter content (1.25 × equivalent water thickness) and structural parameter (mean = 2.2 and standard deviation = 0.03, no dimension). Canopy (SAIL) parameters included: LAI (0 to 7.5 m2m−2), average leaf angle (25 to 80 degree), hotspot size (mean = 0.1 mm−1, standard deviation = 0.01). The observation zenith angle, the solar zenith and azimuthal angle difference between the solar and view angles were fixed at 0, 0.78 rad and 0, respectively. The fraction of diffuse illumination was fixed at 0.1 independent of wavelengths. Two soil spectra (granite and dark gabbro soil) collected in the study area using the portable Analytical Spectral Device (ASD) were averaged and used to represent the soil spectral profile. Within the above parameter ranges, 1000 parameter sets were randomly generated and used to simulate the synthetic canopy reflectance data.
Two empirical models relating: (i) NDVI and LAI; and (ii) red and near-infrared bands, and LAI in a factorial regression analysis were explored using the synthetic data. The factorial regression model (Equation (1)) involving the red and NIR band was used to predict LAI on the MOD09A1 8-day composite data for the period; January 2001 to December 2015, as this model yielded higher prediction accuracy (RMSE = 0.91) on a test dataset [33] compared to the regression model involving NDVI (RMSE = 1.33). Figure 4 shows a summer (Julian day 73) LAI map of South Africa. The LAI model adopted above showed a higher performance when compared to the MOD15 LAI product for the region [33].
L A I = 5.74 44.31 x + 47.02 x 2 3.43 y + 4.72 y 2 + 45.80 x y
where x and y are the red and NIR bands, respectively.
The land surface phenological maps that were generated from the NDVI time series in our exploratory study contained far more speckles than those generated from the LAI time series. The LAI time series was therefore adopted in this study. Moreover, Archibald and Scholes [6] indicated that LAI would be preferable to NDVI in phenological studies, as it is one of the most accurate measures of the photosynthetic capacity of vegetation.

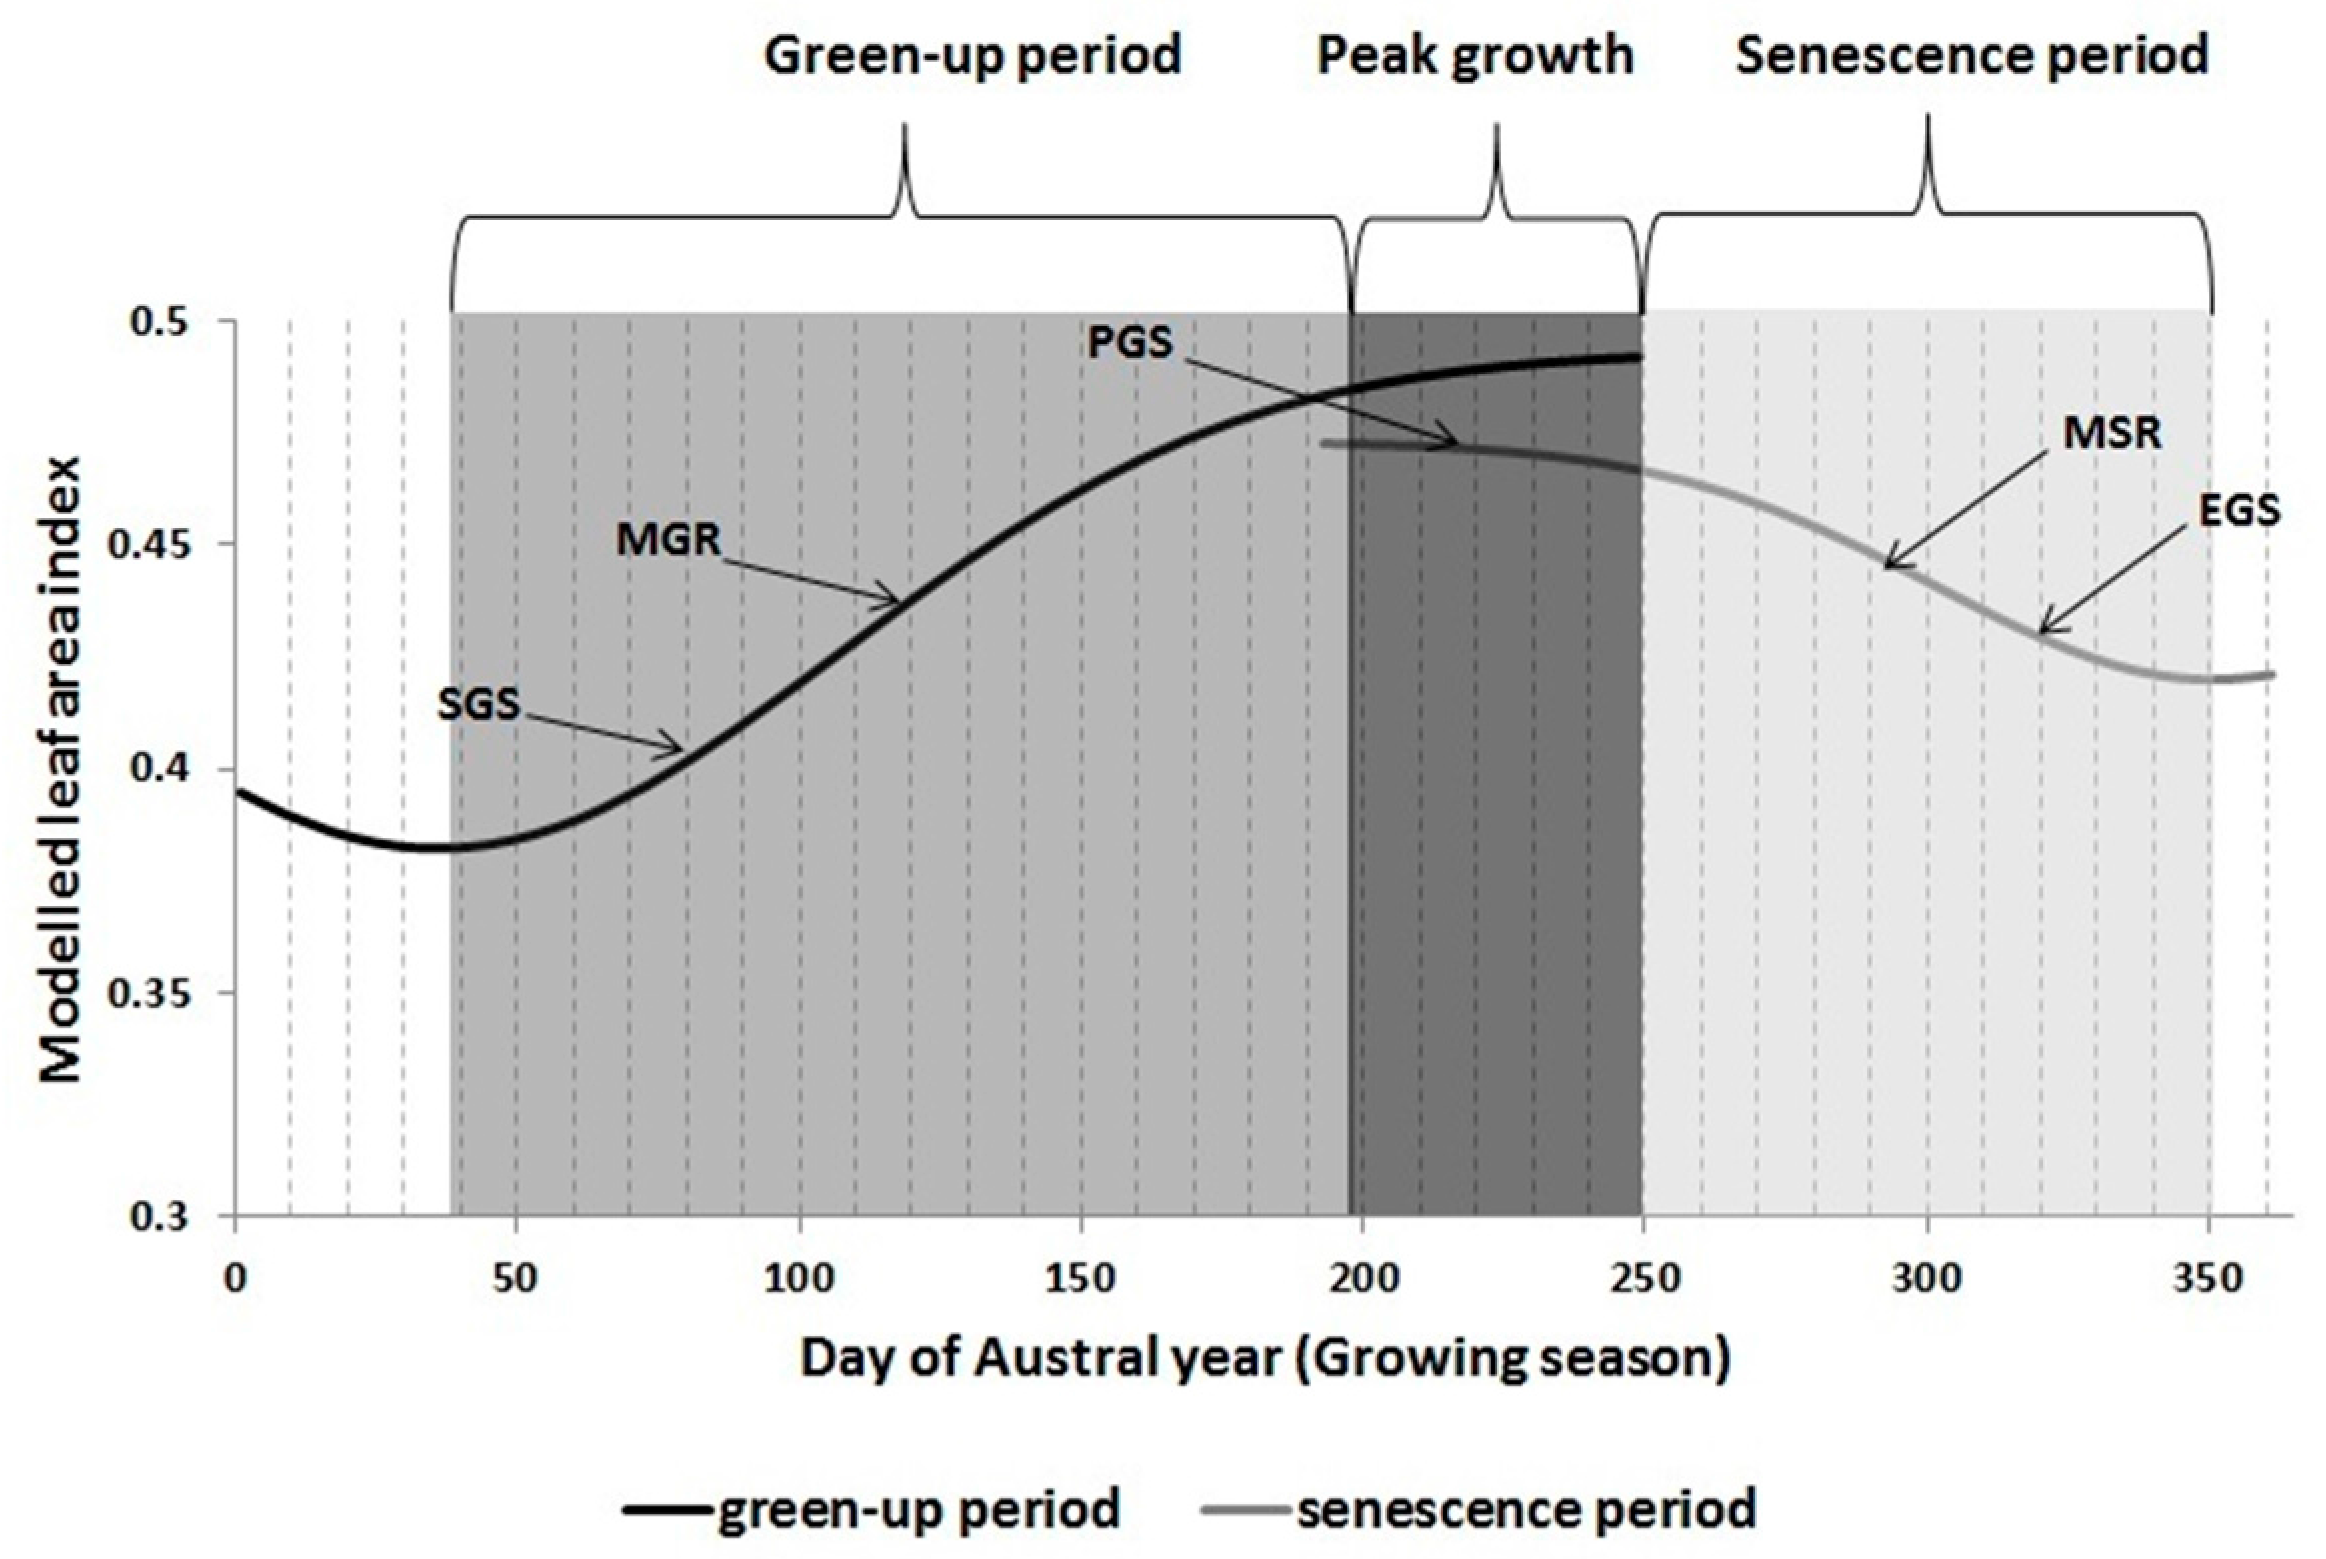
2.4. Determining Land Surface Phenological Metrics from LAI Time Series

Several methods have been used to extract phenological metrics from remotely sensed time series data including linear curve smoothing window and curve fitting methods [2,34,35]. TIMESAT developed by Jonsson and Eklundh [34] is widely used software for deriving land surface phenological metrics. It is an open source software package that provides three smoothing functions to fit time series data for derivation of phenological metric including adaptive Savitzky–Golay filtering, asymmetric Gaussian and double logistic functions. Tan et al. [2] recommended the asymmetric Gaussian function against the other function because it is less sensitive to noise and missing data. In this study, we have used an inverted Gaussian function (f(t)) (Equation (2)), i.e., LAI as a function of date (t) of the growing season, that allows for the extraction of the most widely used phenological metrics as well as includes metrics such as day of maximum growing or senescing rates i.e., inflexion points on the growing (or green-up period) and senescing (senescence period) phases of the annual LAI curve (Figure 5). These include day of austral year at:
  • start of growing season (SGS)
  • end of growing season (EGS)
  • peak or maximum growth (PGS)
  • maximum growing rate (MGR) i.e., the inflexion point on the growing phase
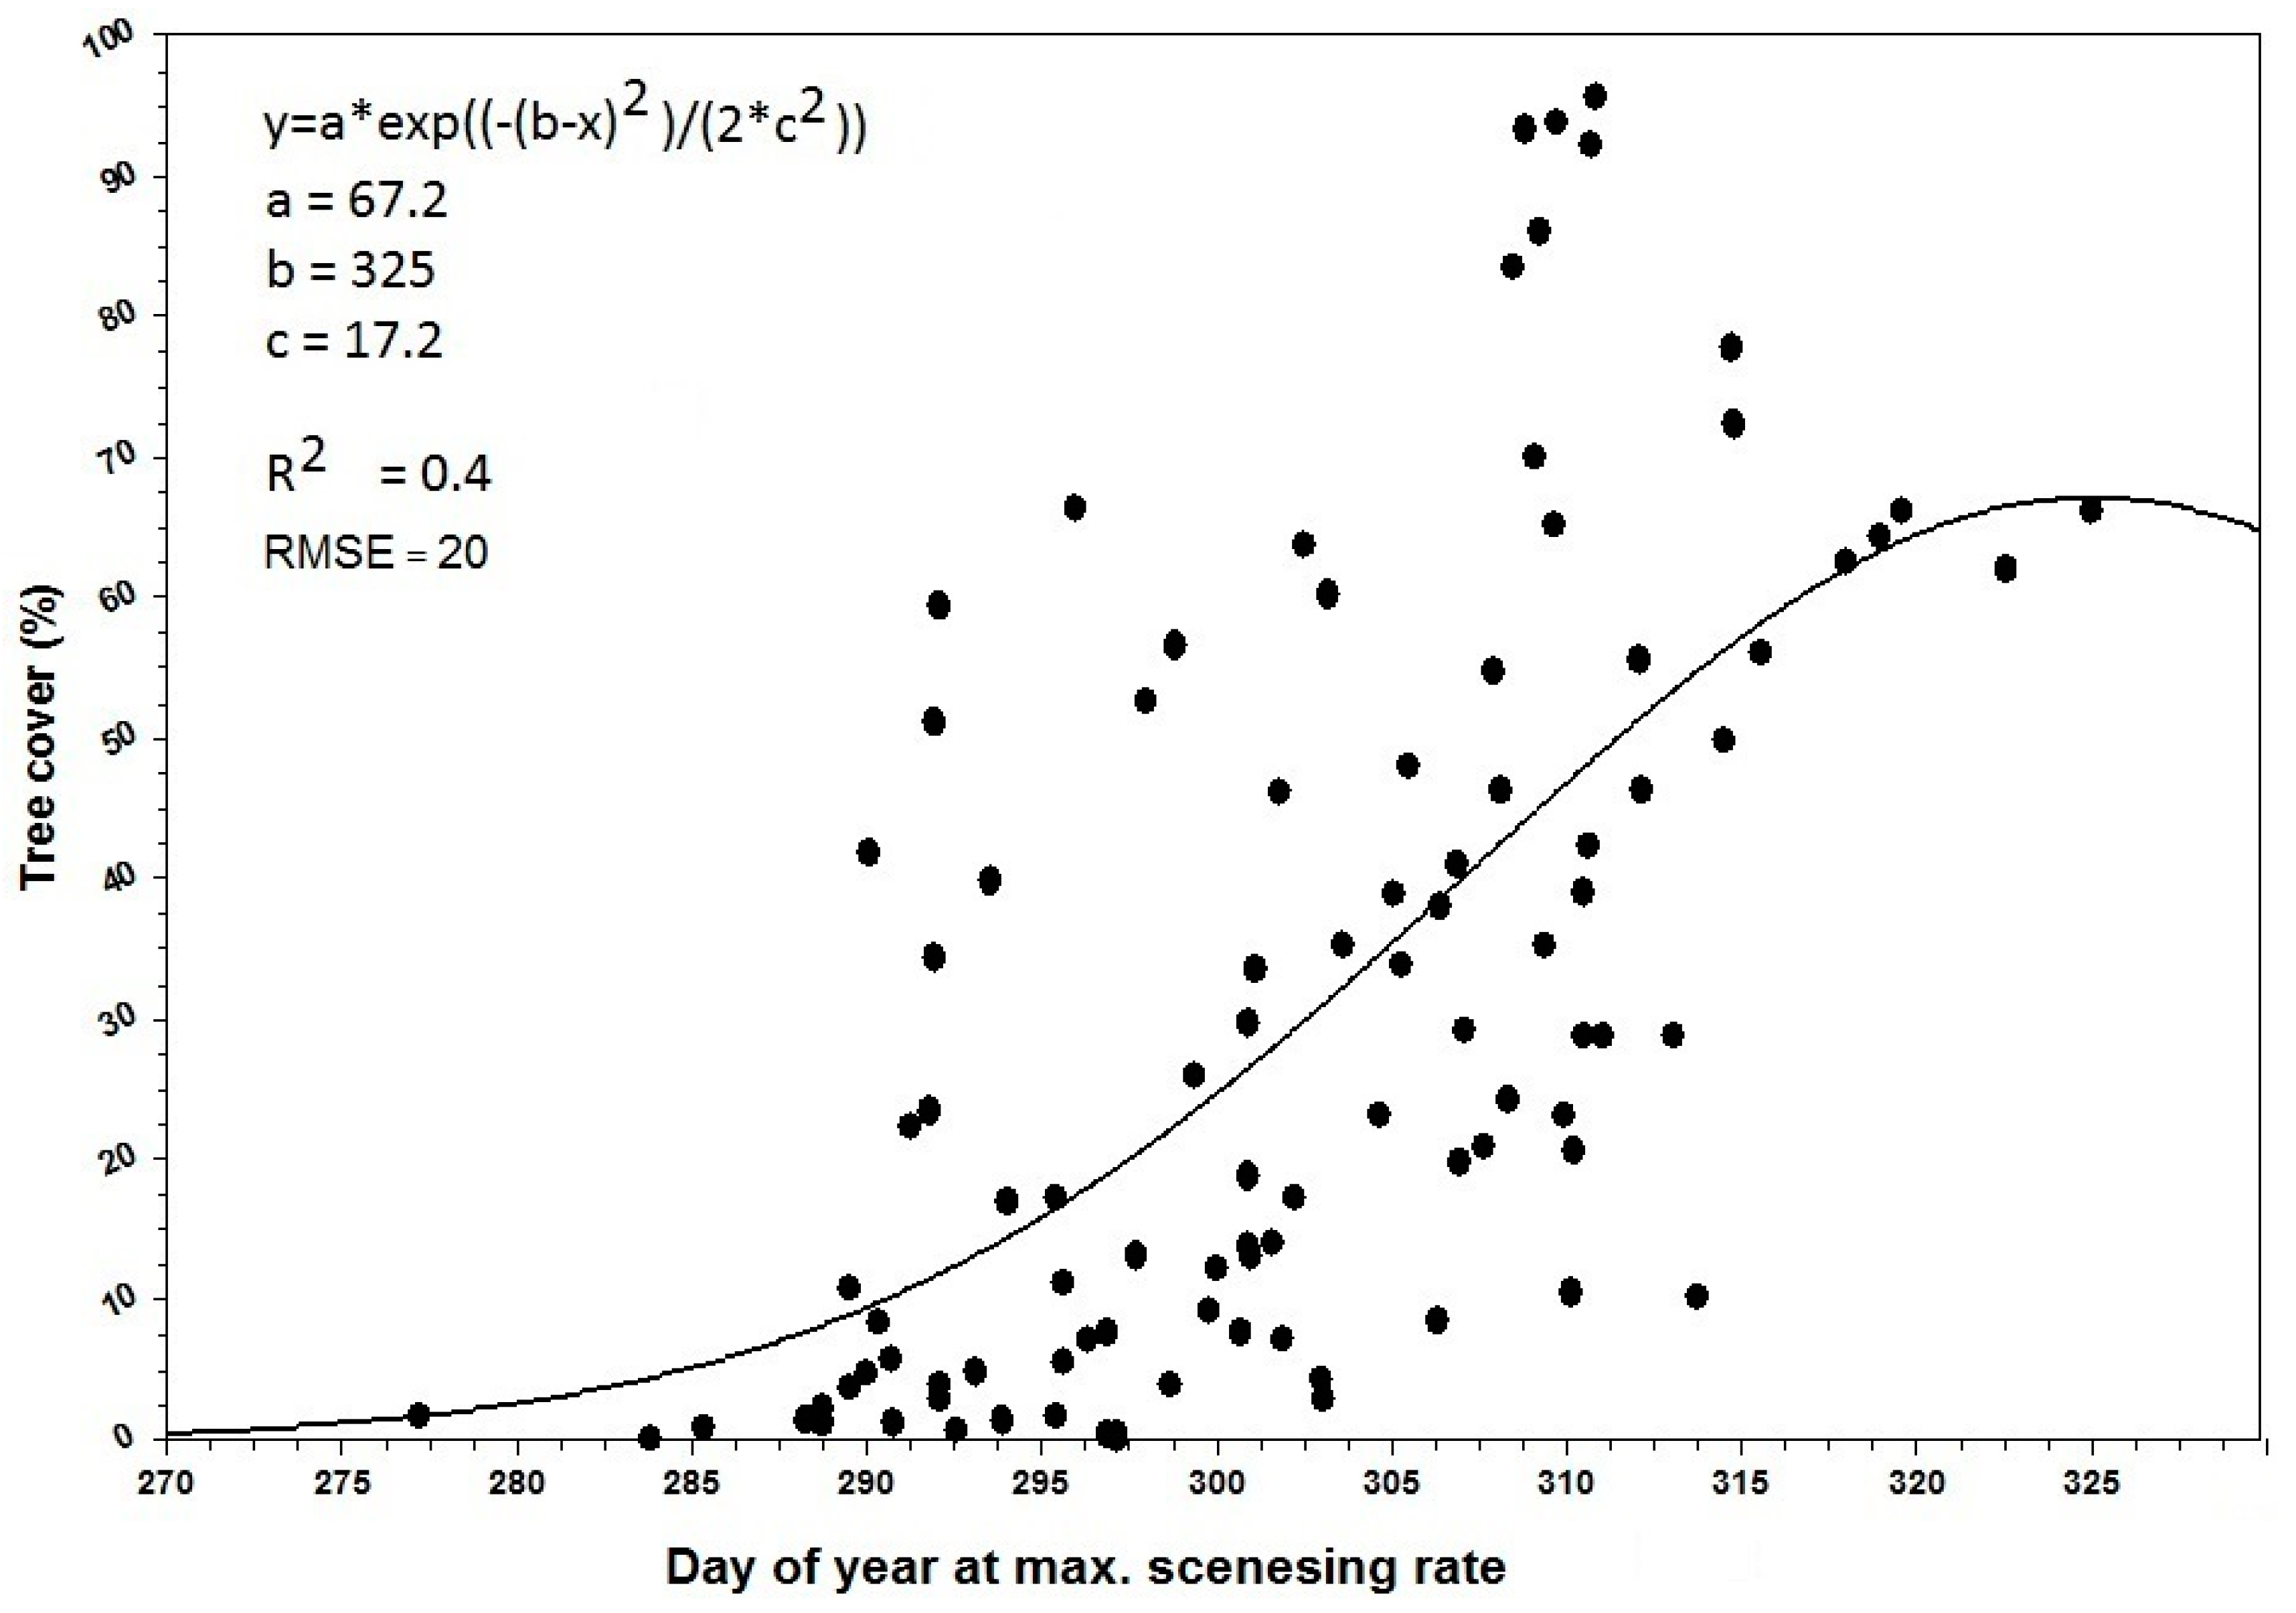
  • maximum senescing rate (MSR) i.e., inflexion point on the senescing phase
f ( t ) = a ( a b ) e ( c t ) 2 2 σ 2
The above Gaussian function was therefore fitted to the entire LAI time series of each growing season which generally starts from 1 July (Julian Day 182, but 4 July in this study because of the MODIS 8-day interval) of one year to 30 June (Day 181; 26 of June in this study) of the following year. a = maximum LAI of the curve, b = left minimum of the LAI curve, c = day corresponding to the minimum LAI of the curve, σ = Gaussian variance and MGR = c + σ. There are no commonly agreed definitions of phenological metrics. For example, Wessel et al. [9] determined day of the year at SGS for the region used in this study as the date corresponding to 20% of season amplitude as measured from the left minimum of the curve. Many other definitions of day of the year at SGS and EGS are summarised in Groten and Ocatre [36]. In this study, we have determined the day of the year at SGS for each growing season as the midpoint between the date of minimum LAI on the left side of the LAI time series and day of the year at MGR i.e., the period generally corresponding to the end of the lag phase of a growth curve. The day of the year at EGS and MSR were determined by using the same fitting procedure except applied in reverse order i.e., from 26 June backwards to 4 July of the previous year. Day of the year at PGS = (MGR + MSR)/2. A script was written in IDL (Interactive Data Language) to determine and map the phenological metrics for the study area. It involved making initial guesses of the model parameters; a, b, c and σ. The initial maps of the phenological metrics contained speckles which were smoothened out to a large degree by using a 3 by 3 window median filter.

2.5. Data Analysis

The 100 tree cover polygons were grouped into three tree cover classes; Low (<20%, n = 44), Medium (20–40%, n = 22) and high (>40%, n = 34) to determine the influence of varying tree cover on the land surface phenological metrics of the semi-arid savanna of South Africa. We have determined the threshold for the tree cover classes based on expert opinion of the region (classification according to [37]), whereby areas with greater that 60% tree canopy cover (i.e., the canopies touch) in the savanna are referred to as forest, 40–60% as woodlands and less than 40% as open savanna. That is why we decided on three classes in the study i.e., evenly dividing 60% by three i.e., high (>40%), medium (20–40%) and low (0–20%). First, a median map (Figure 6) was generated for each metric from the 14 years considered in the study (2001/2002 to 2014/2015). Subsequently, the metric values of the various polygons were extracted from the median maps and the average for each polygon computed. Student’s t-test was used to investigate if significant differences exist between the means of all pair-wise comparisons of tree cover classes i.e., low vs. medium, low vs. high and medium vs. high for all the phenological metrics. In addition, the interannual variabilities in the various metrics were assessed using the coefficient of variation (mean/Standard deviation × 100) for the 14 growing seasons.
Precipitation data of the five meteorological stations (Rustenburg, Marbel Hall, Moosriver, Lephalale, Bloemhof and Escelsior-benchmark) were obtained from the Agricultural Research Council (ARC) of South Africa for the period 2002 to 2015 (13 years) and used to investigate the impact of rainfall on the land surface phenological metrics. The start and end of rainy season have been used in previous studies to determine the impact of rainfall on land surface phenology e.g., Suepa et al. (2016) [3]. However, there is no consensus on the definitions of the start and end of the rainy season [38]. Furthermore, increasing rainfall variability at the start of the rainy season in Southern Africa provides an extra challenge in defining the start of the rainy season. We have therefore used the cumulative monthly mean rainfall in this study as the explanatory variable for variations in land surface phenology. In this respect, the rainfall data for each growing season or Austral year were processed into several categories (Table 1), consisting of cumulative monthly mean rainfall for the green-up phase of the vegetation i.e., July to December and senescence phase in a reverse order i.e., June-January. The relationships between the various rainfall categories and the land surface phenological metrics were subsequently assessed using the Pearson’s correlation coefficient (r).

3. Results

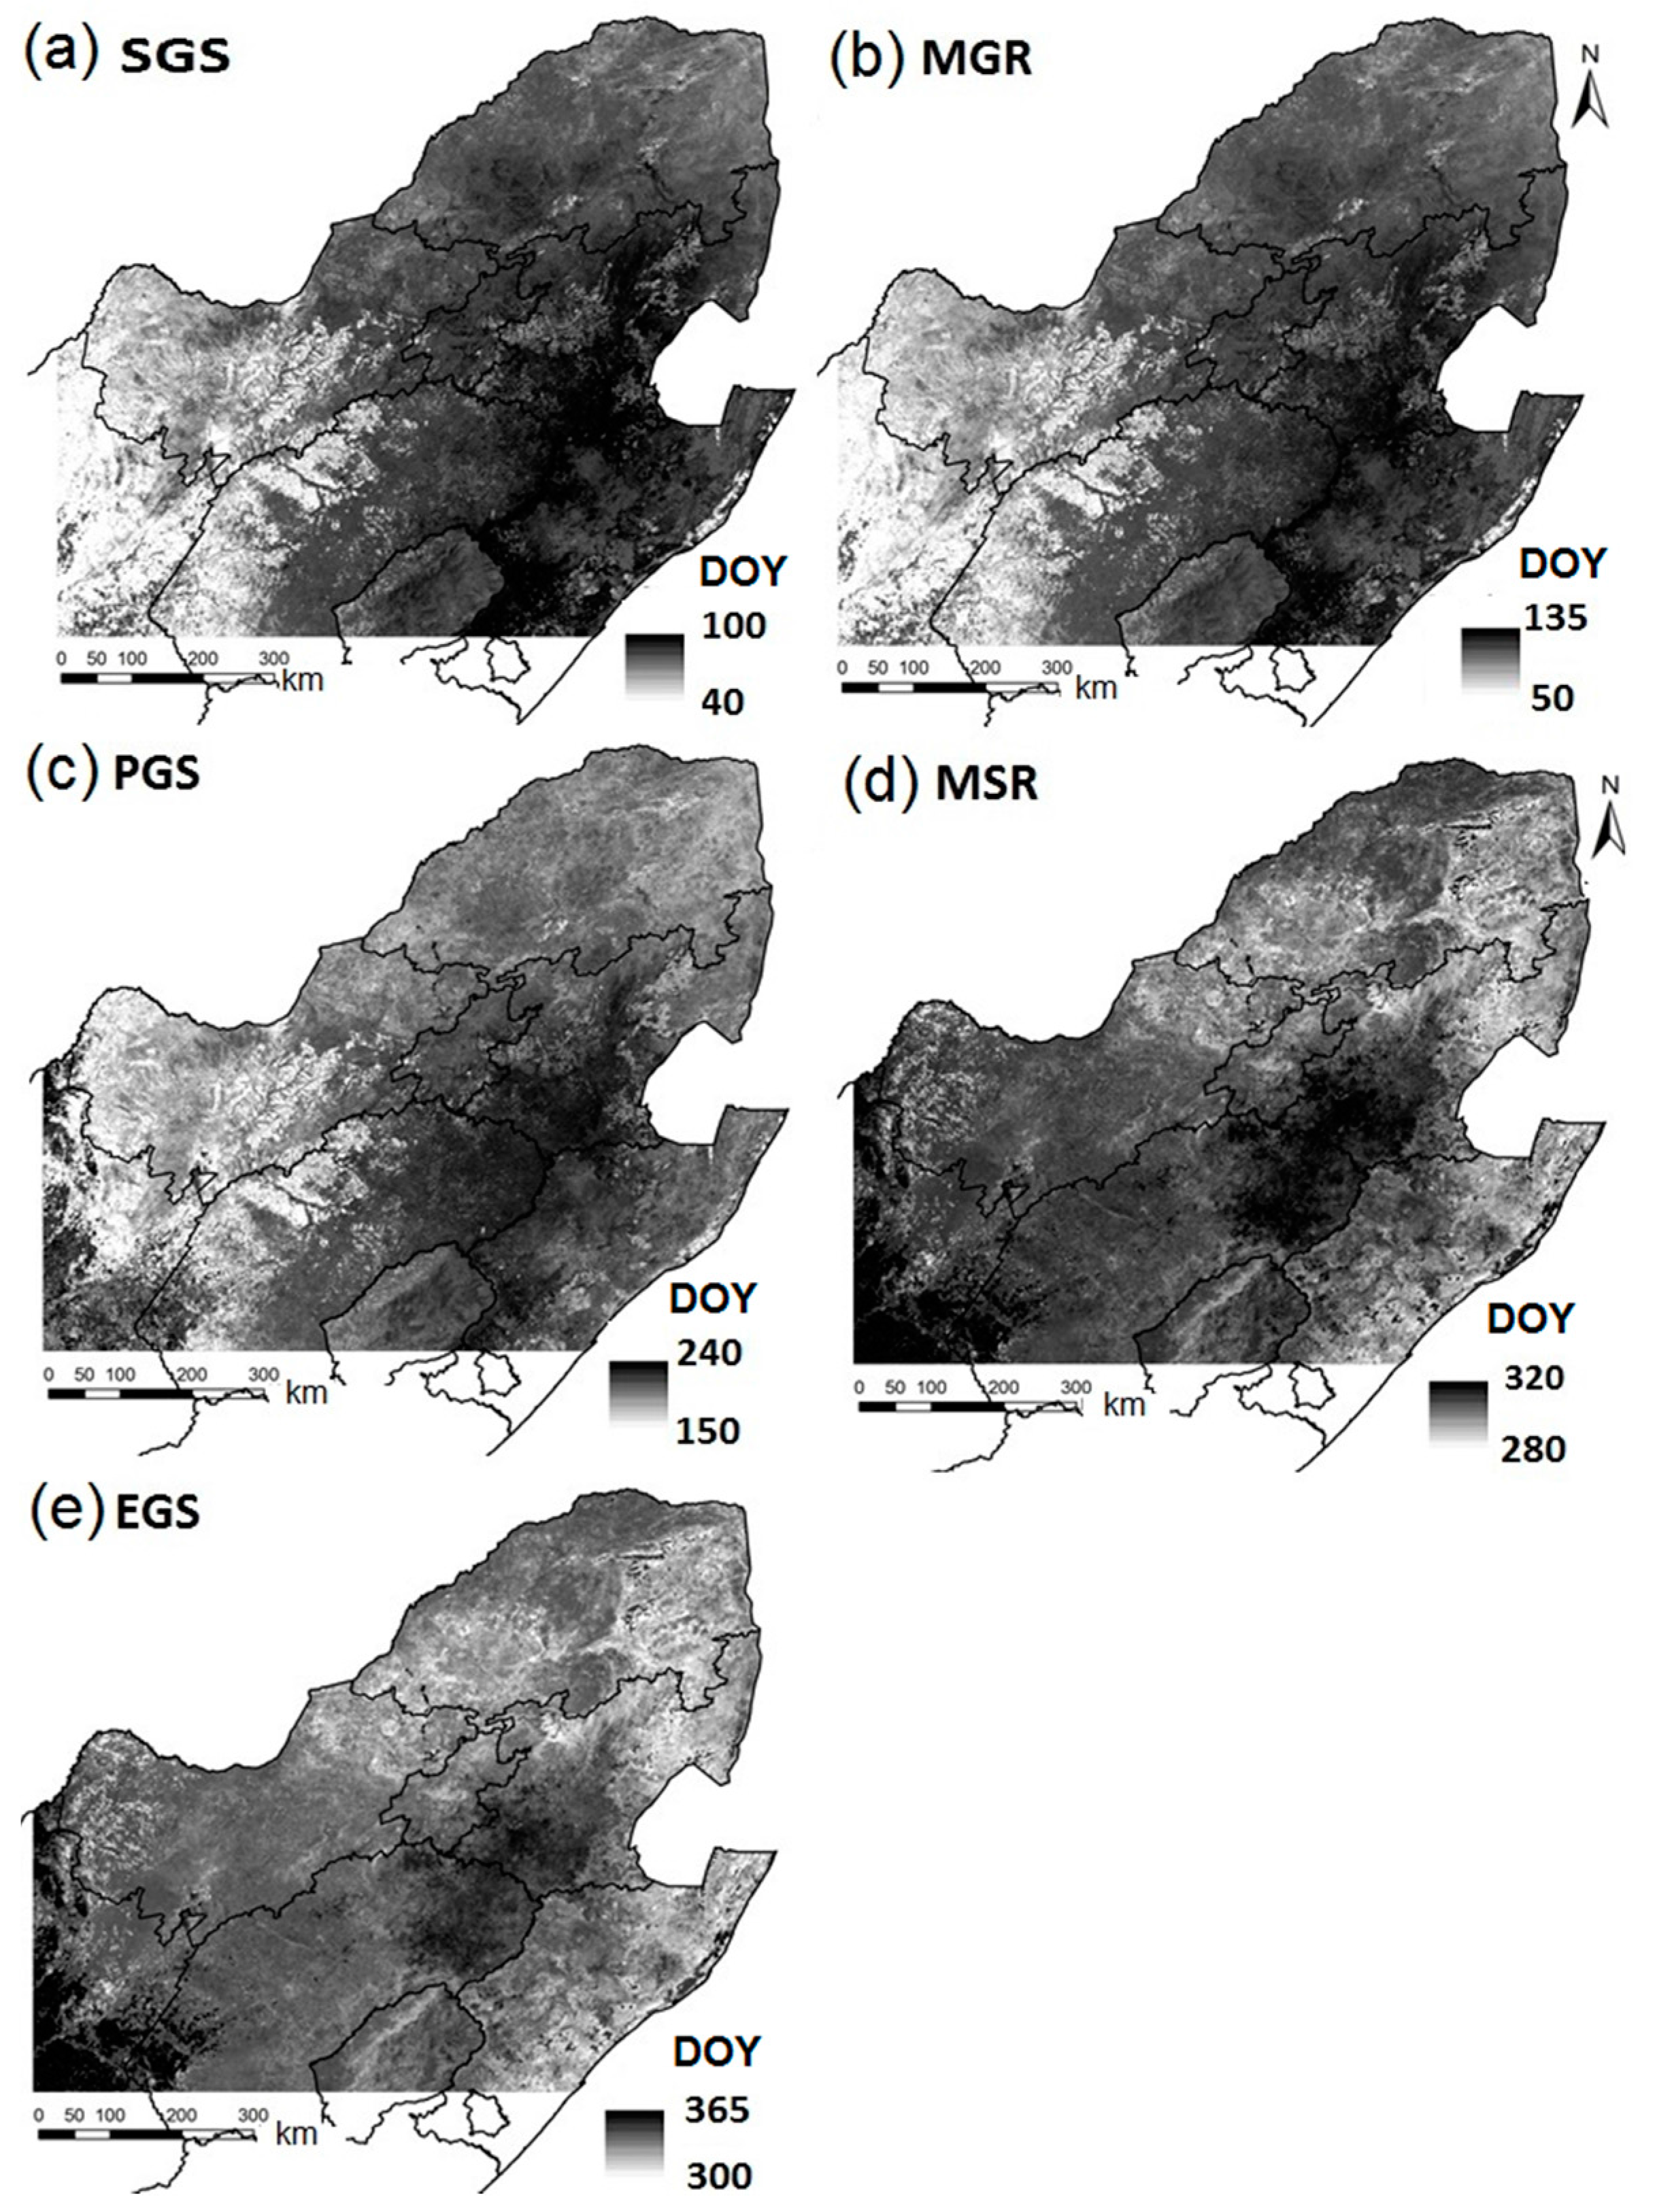
3.1. Spatial Patterns of Land Surface Phenological Metrics and Differences between Tree Cover (%) Classes

The median maps of the land surface phenological metrics show varying spatial patterns between the metrics on the growing (day of the year at SGS, MGR or PGS) and senescing (day of the year at MSR and EGS) phases of the seasonal LAI curve (Figure 6). The spatial patterns of the metrics on the growing phase closely follow the precipitation pattern of the study area, with early day of the year at SGS, MGR or PGS regions associated with the regions of high annual mean precipitation (compare Figure 1 and Figure 6). While the maps of the metrics on the senescing phase show similar patterns to the summer LAI variability across the study area (compare Figure 3 and Figure 6). The following general timings of the growing season can be associated with the study area using analysis of the 100 randomly selected polygons and following our definition of the phenological metrics (Table 2)
-
The vegetated landscape starts to green-up (day of the year at SGS) at about August 31 ± 2 days (95% CI).
-
The vegetated landscape reaches peak production (PGS) at about January 20 ± 3 days (95% CI).
-
The growing season ends (EGS) at about May 11 ± 1 day (95% CI).

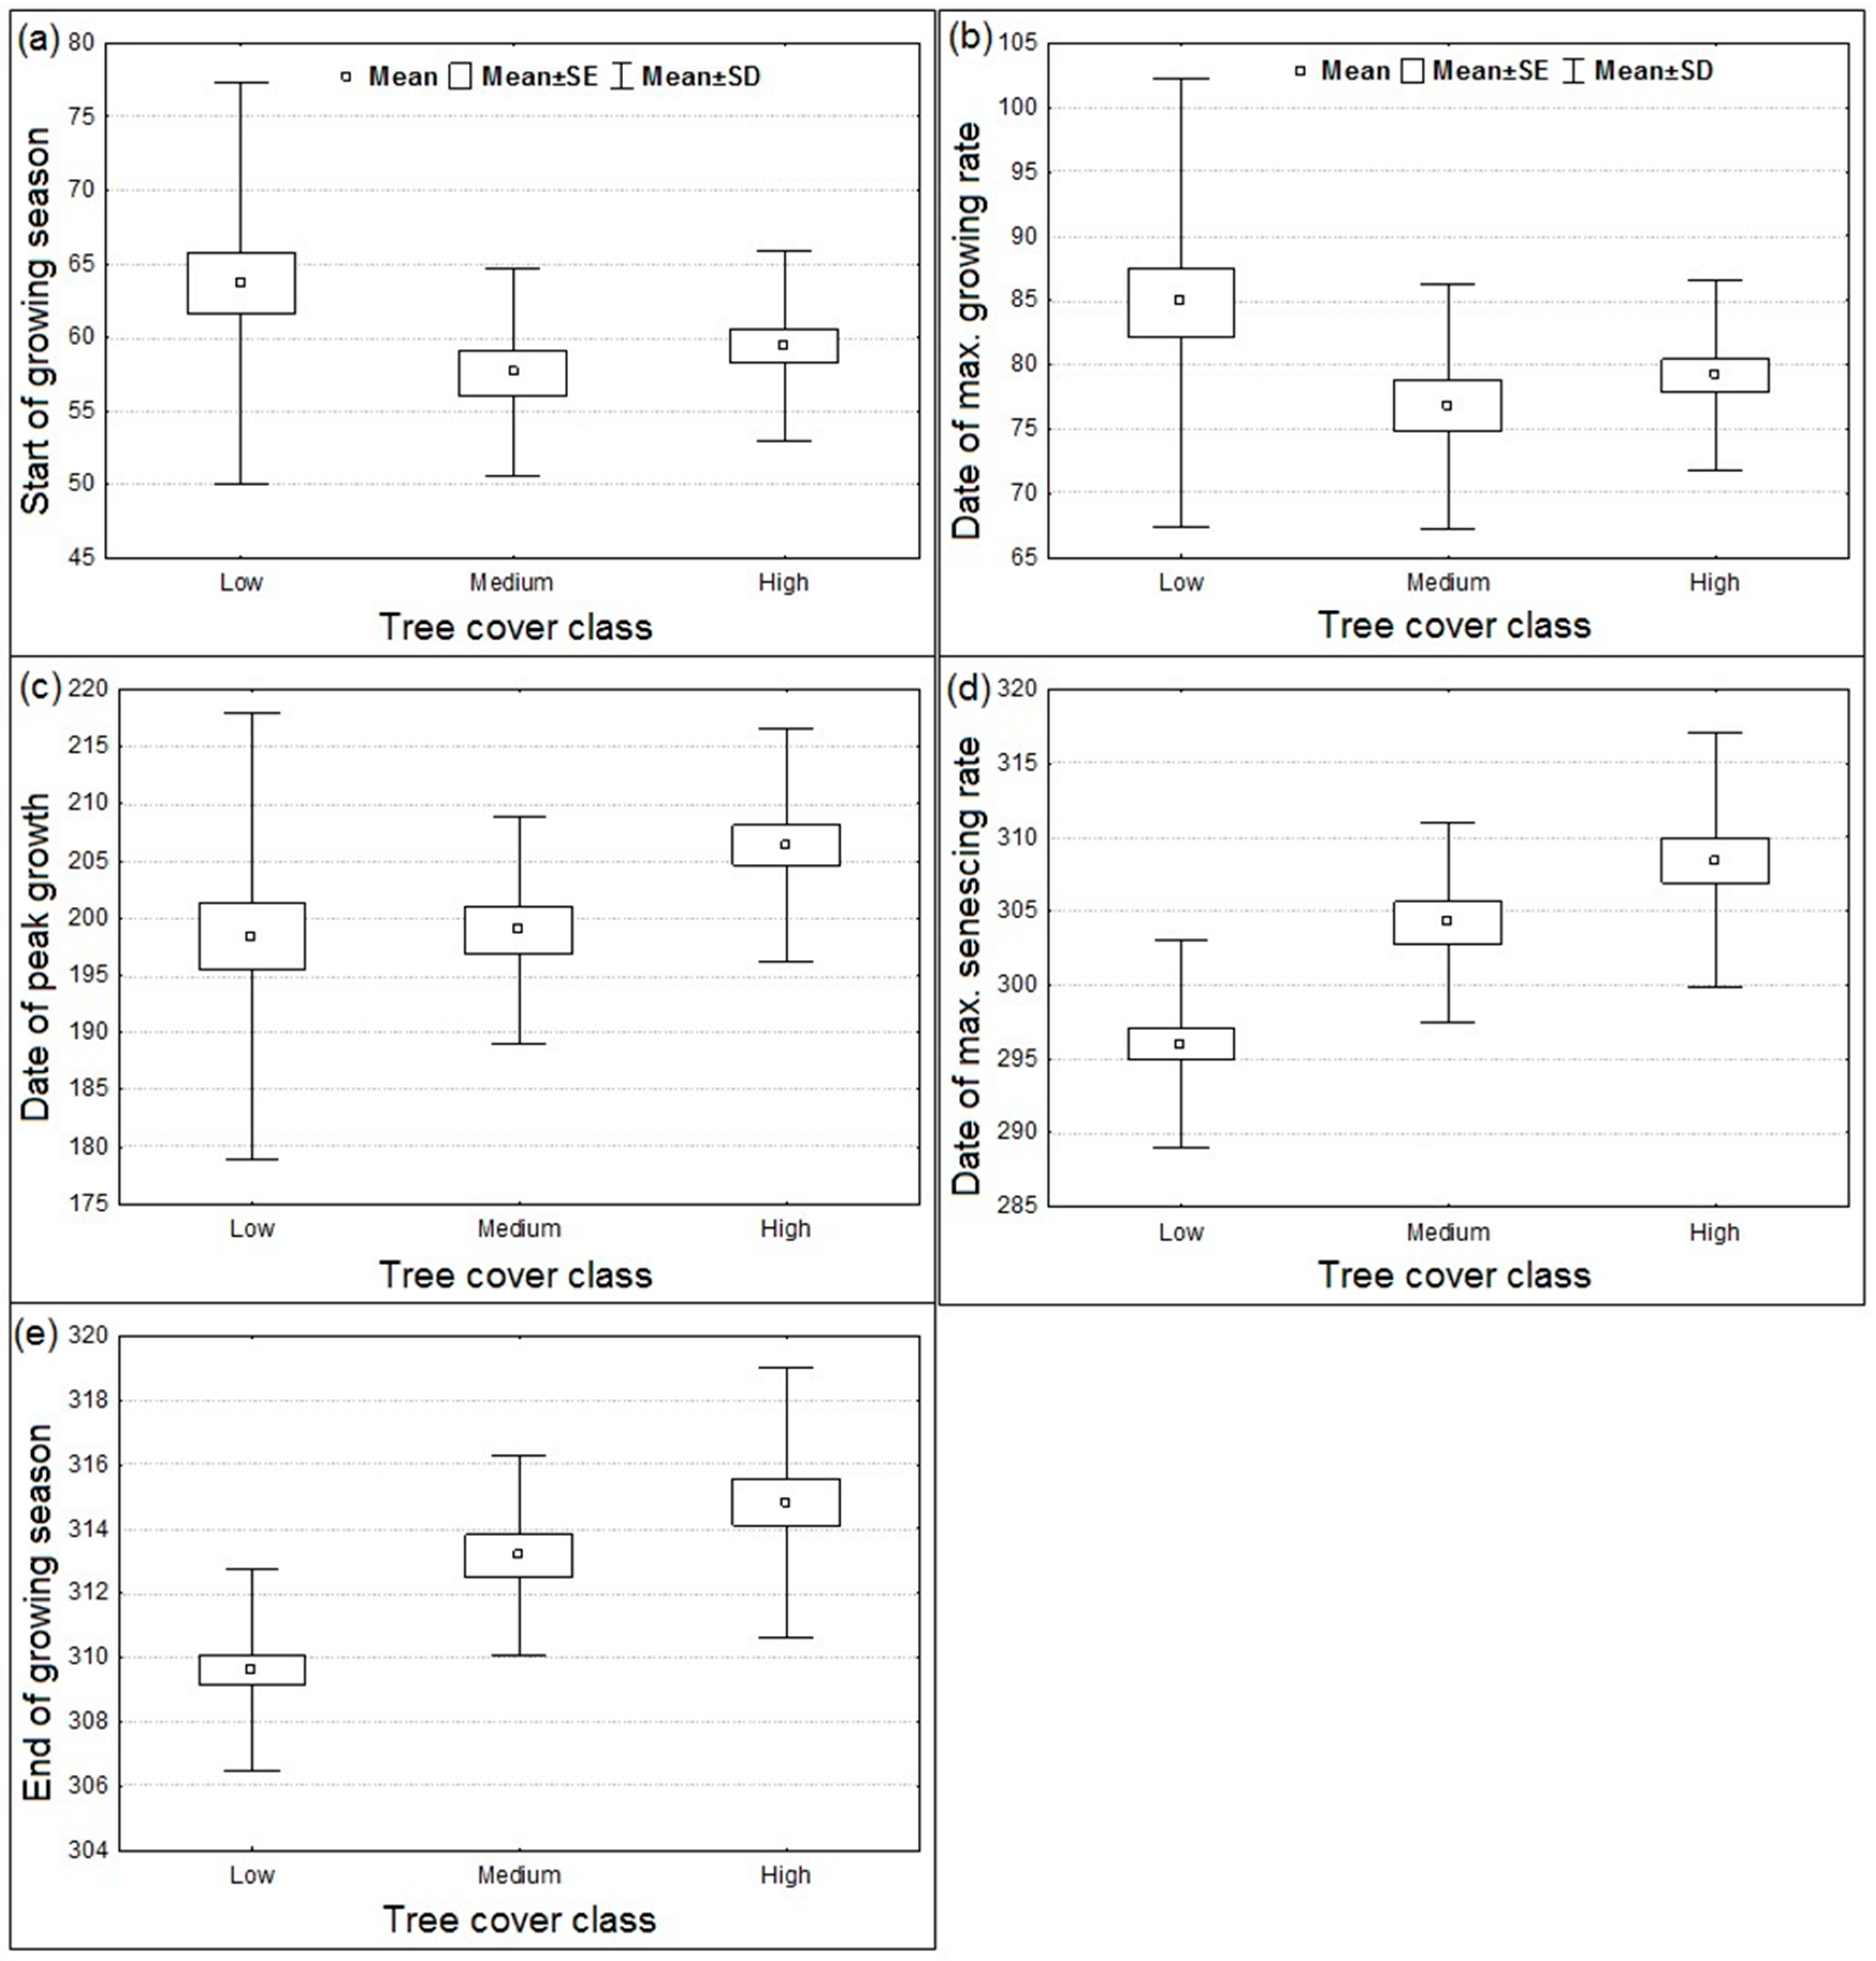
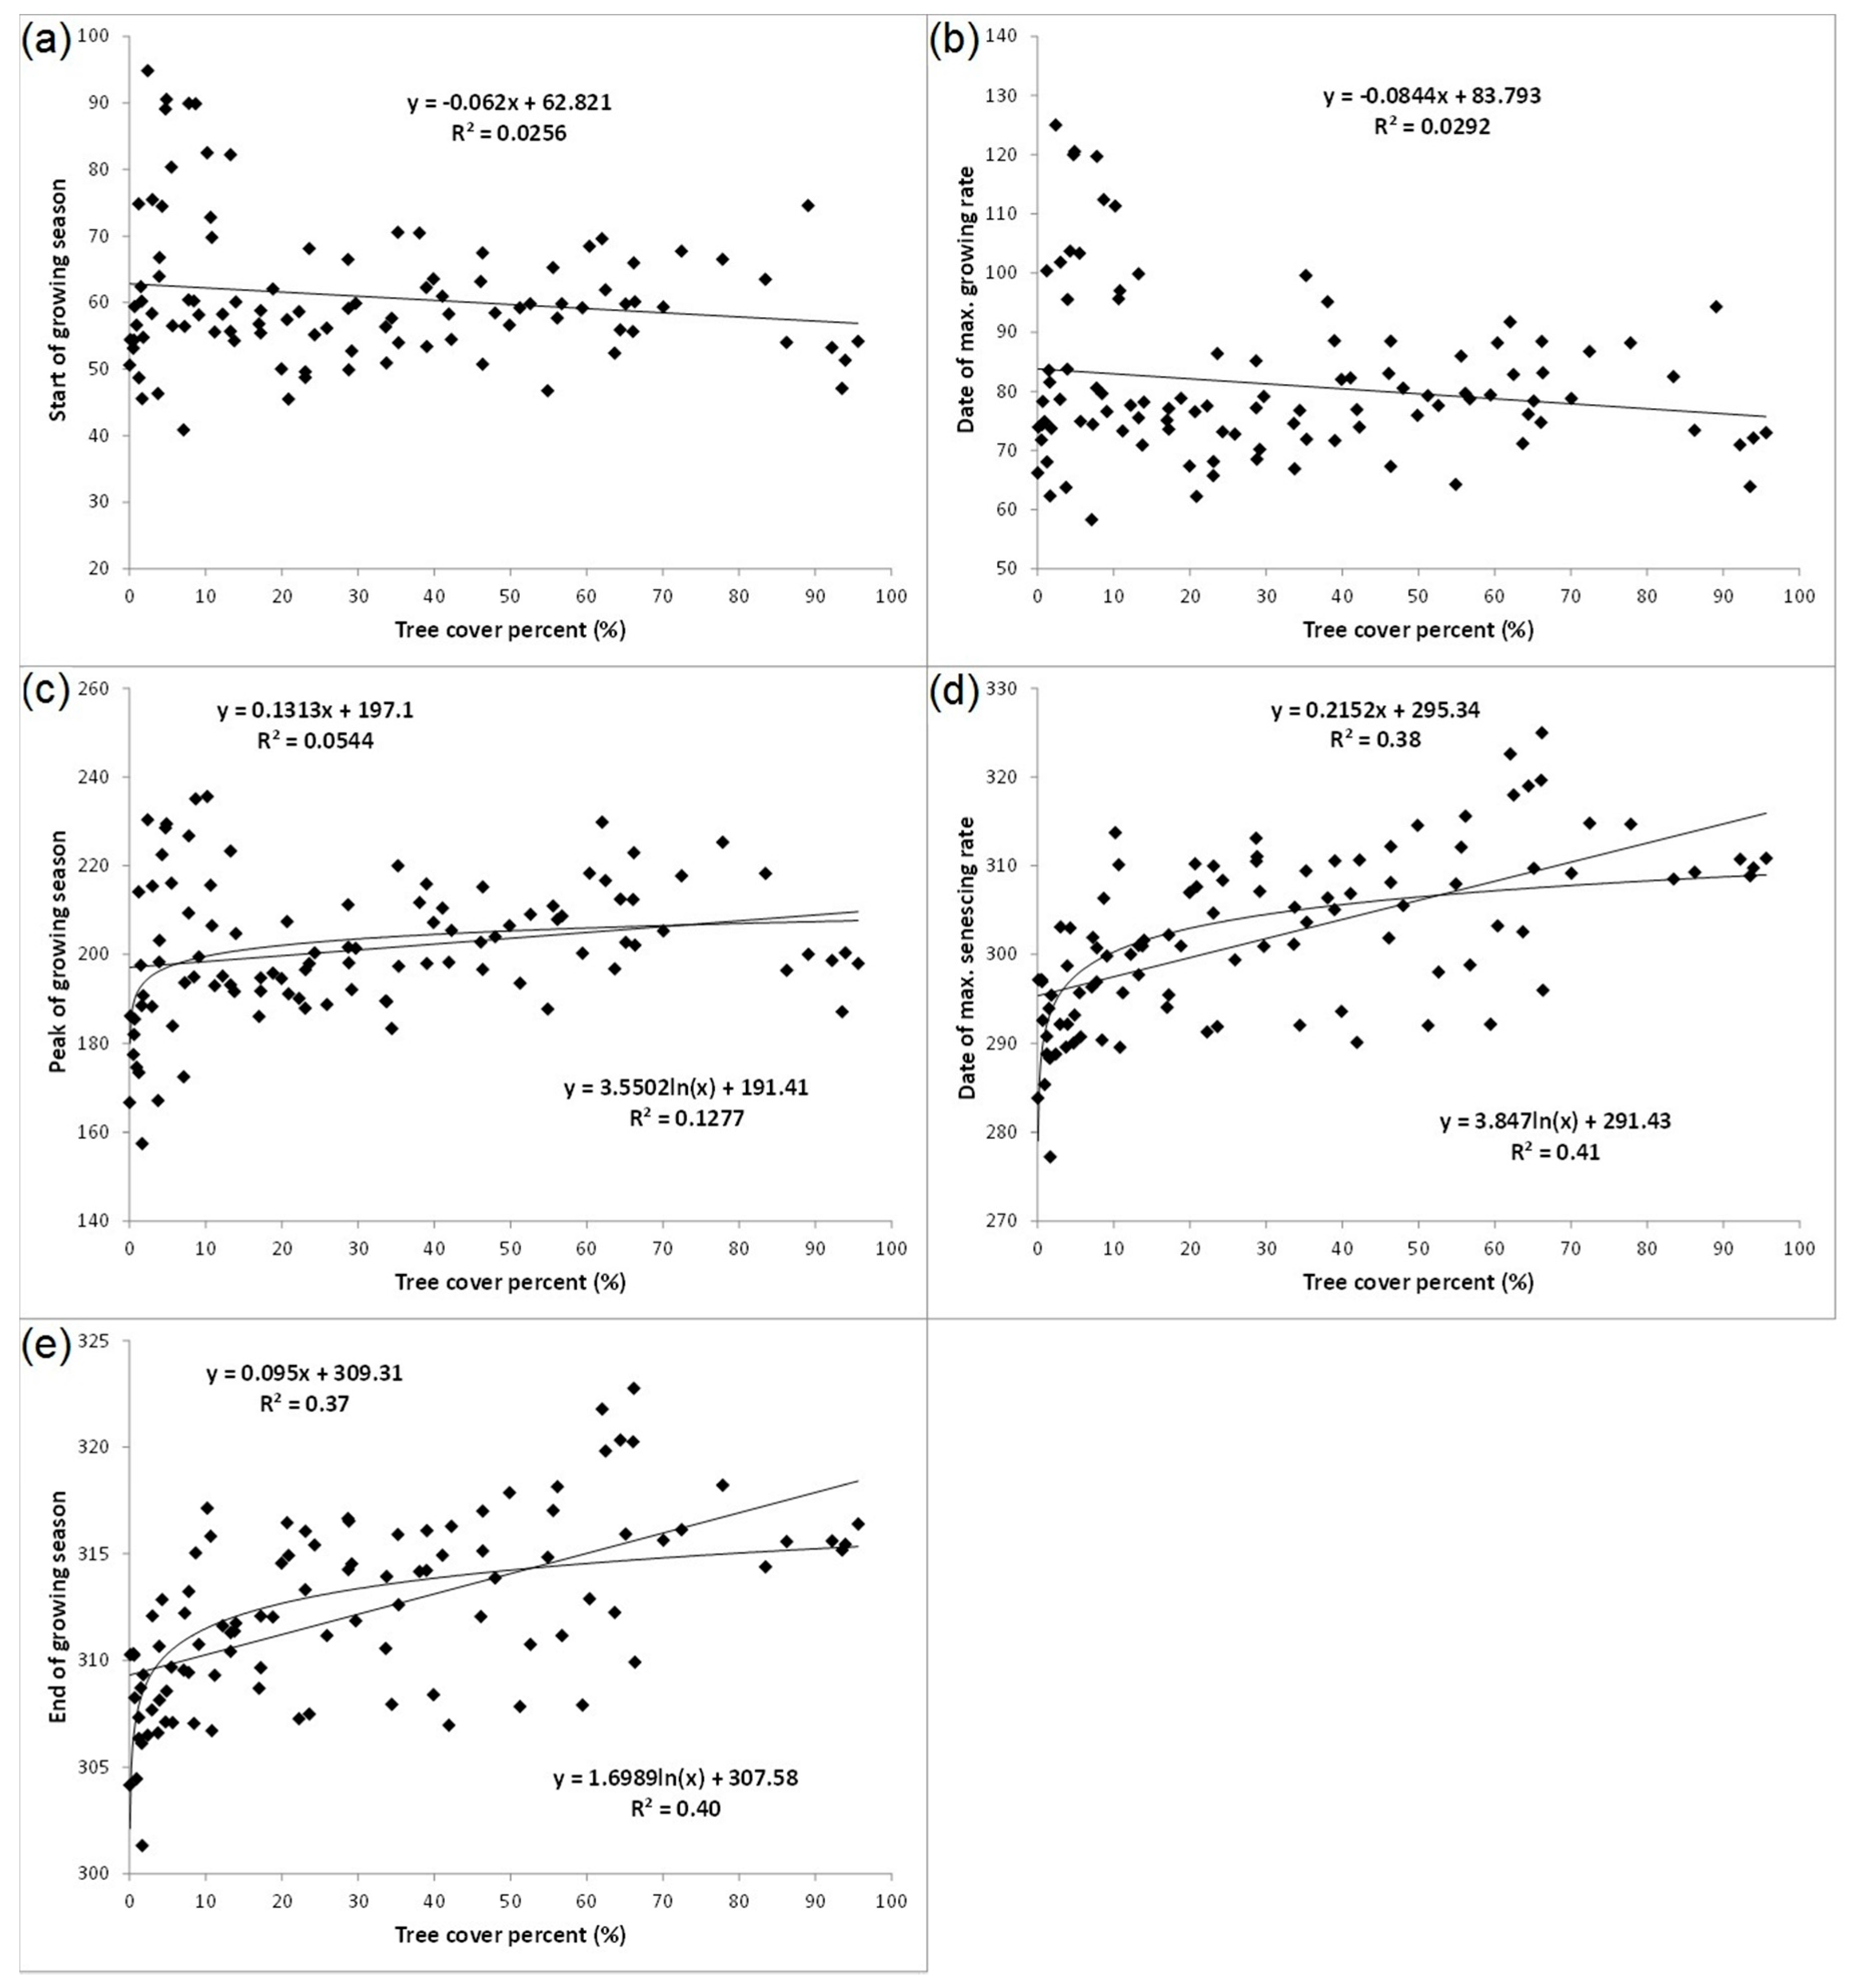
3.2. Differences in Land Surface Phenological Metrics between Tree Cover Classes

The 100 randomly selected polygons grouped into three percentage tree cover classes were used in this analysis. First, the differences in the means between tree cover classes were not statistically significant (t-test p > 0.05) for each of the three growing phase phenological metrics (day of the year at SGS, MGR and PGS) (Table 3, Figure 7), though with higher means for the low tree cover class for day of the year at SGS and MGR in comparison to the medium and high tree cover classes. Secondly, the variability in the low tree cover class for the growing phase metrics was considerably higher (average CV = 19.4%, p variances < 0.05) than in the medium (CV = 11.7%) or high (CV = 9.7%) tree cover class. In fact, the range of values of the low tree class includes the entire range of values for the medium and high tree covers classes. On the other hand, the three tree cover classes were clearly distinguishable (t-test p < 0.01) using the senescing phase metrics (day of the year at MSR and EGS). The coefficients of variation of the senescing phase metrics (average CV = 2%) were far lower than those of the growing phase metrics (average CV = 13.6%).
To further understand the influence of tree cover on the land surface phenological metrics, we conducted linear regression analyses between tree cover and the various land surface phenological metrics (Figure 8). Tree cover (%) showed a slightly non-significant negative correlation with day of the year at SGS, MGR, or PGS (p > 0.05), but a highly positive correlation with day of the year at MSR or EGS (p < 0.01). In fact, the relationship between tree cover and day of the year at MSR or EGS is non-linear, with a sharp rise in day of the year at MSR or EGS between 0% and about 10% tree cover. A Gaussian model was fitted (R2 = 0.40) to the scatter plot between day of the year at MSR and percentage tree cover (Figure 9) and the model parameters were used to produce a tree cover map for the study area (Figure 10).

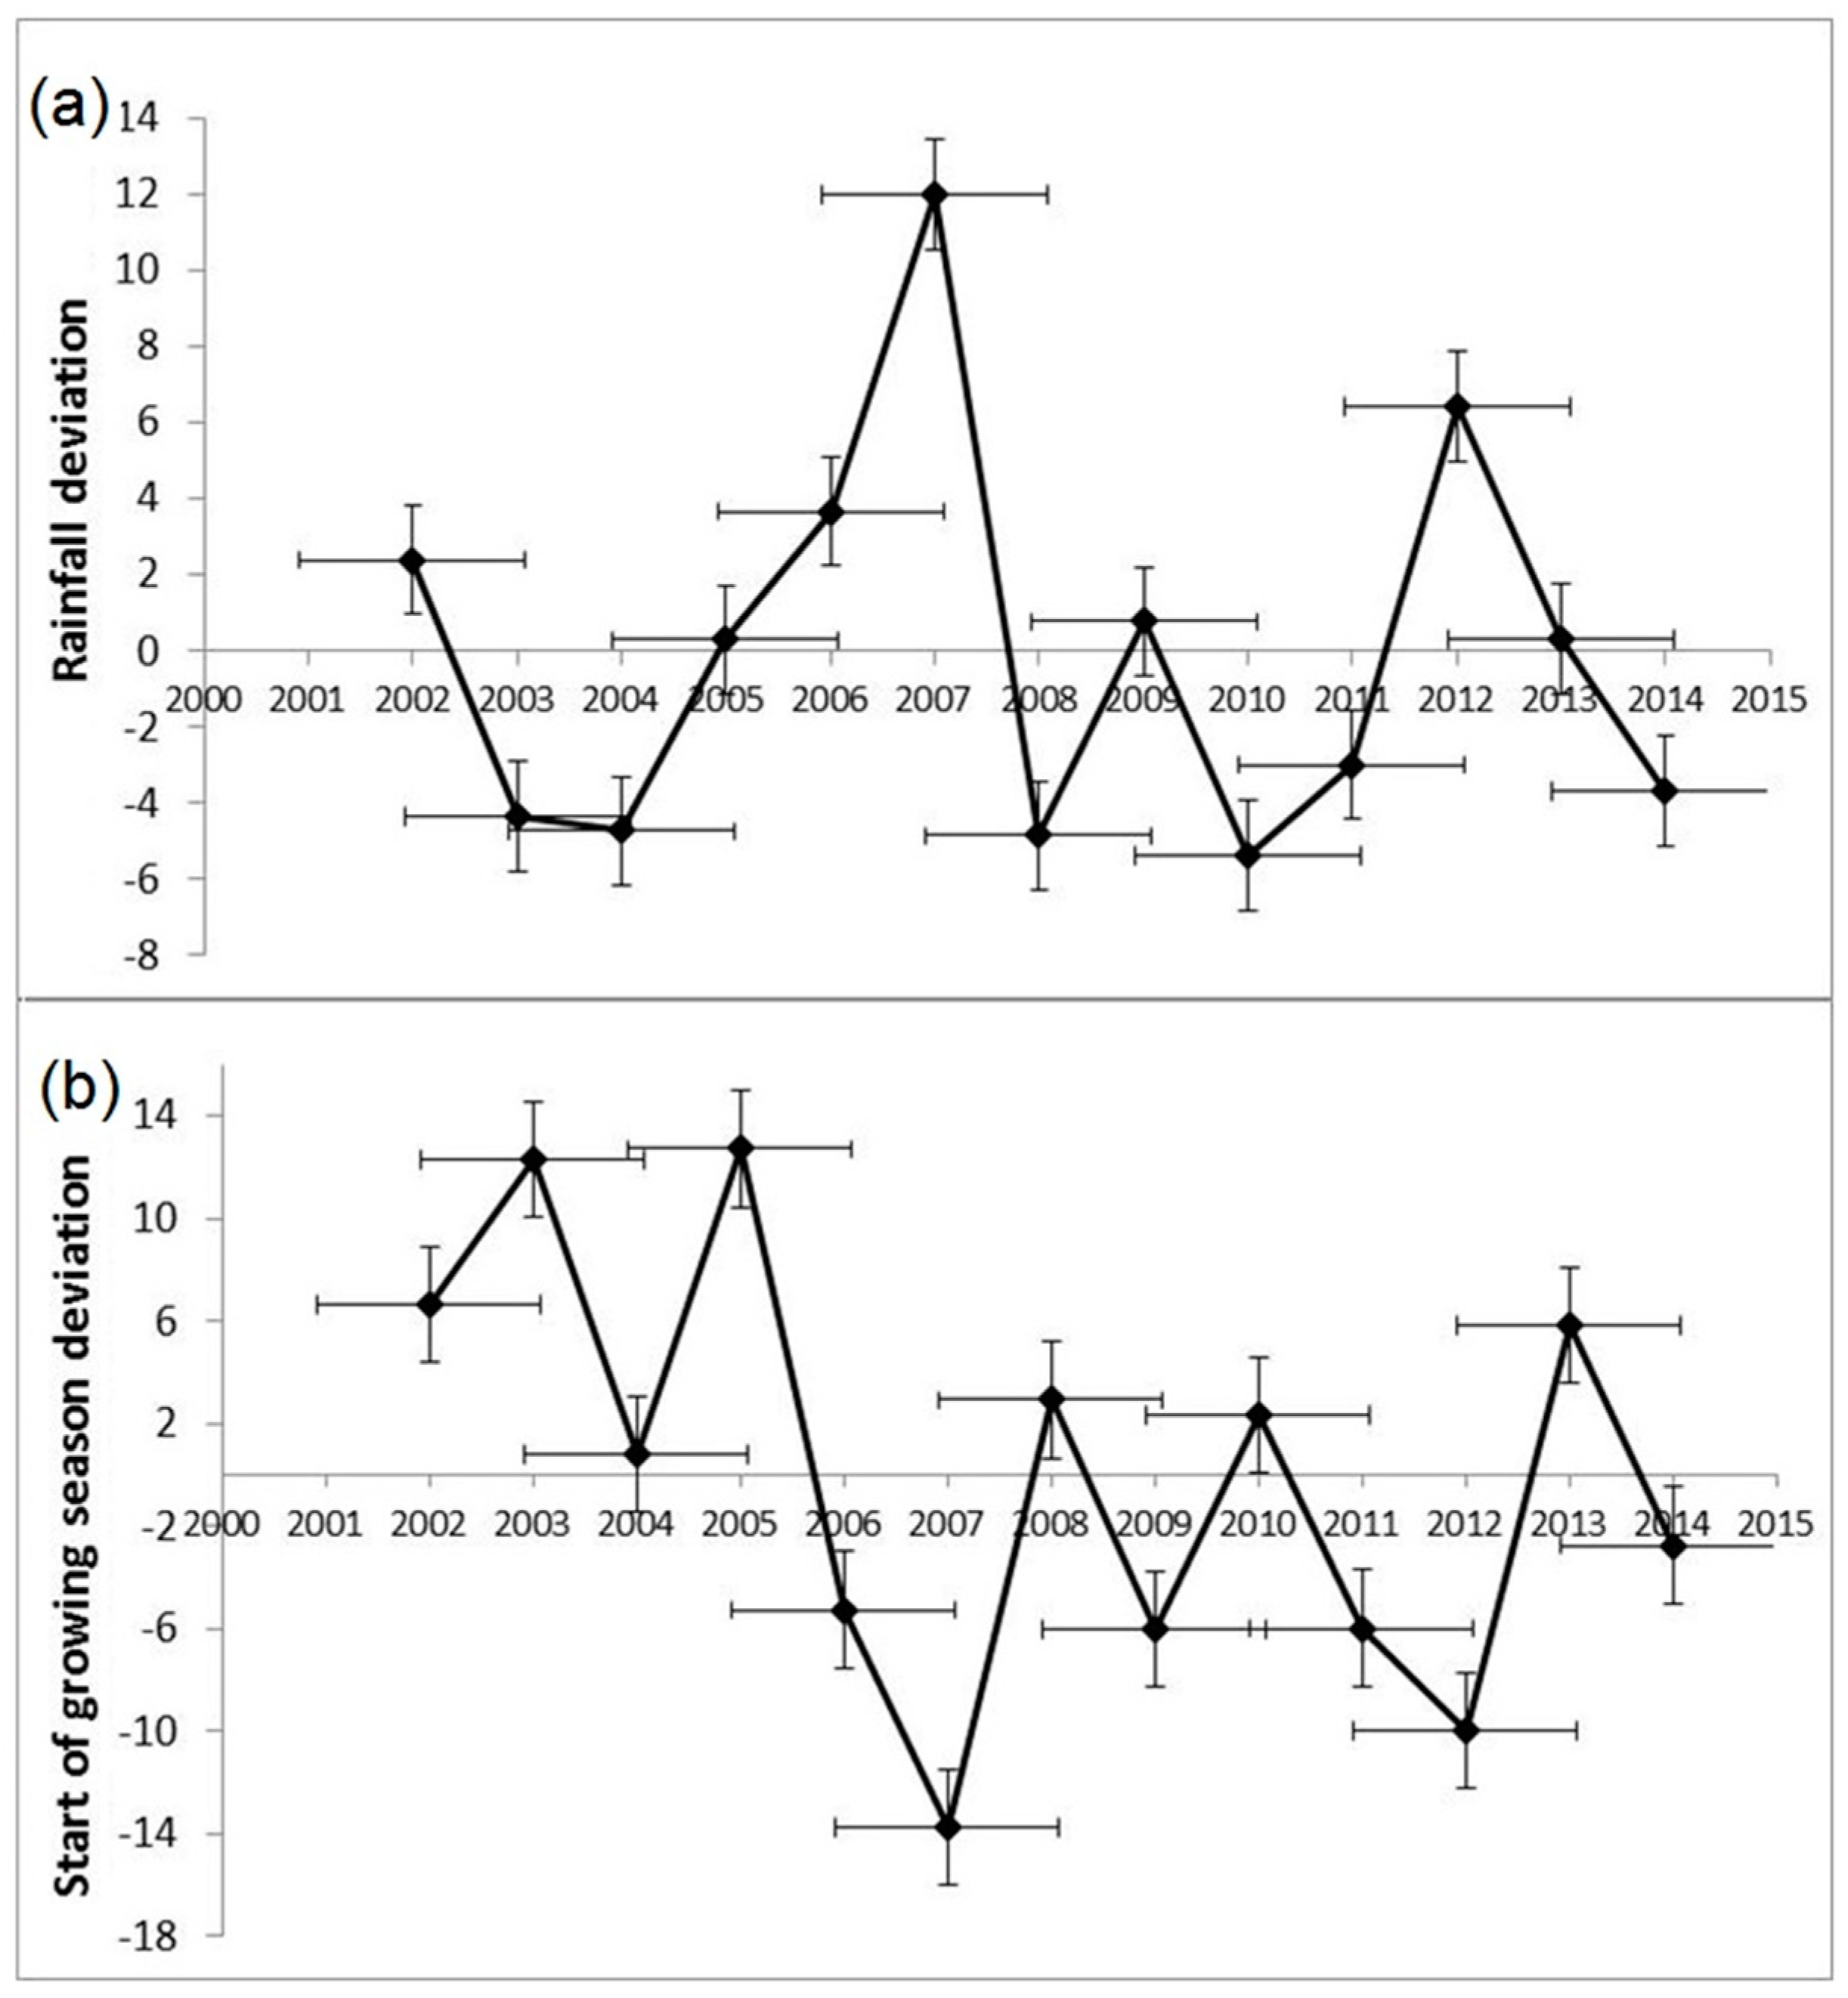
3.3. Inter-Annual Variability in Land Surface Phenology

The growing phase metrics (SGS, MGR or PGS) showed higher (t-test p < 0.05) inter-annual variabilities (CVs) than the senescing phase metrics (MSR or EGS) (Figure 11). In fact, the inter-annual variability decreases from start to the end of the growing season. We found no significant differences when the inter-annual variabilities were compared between the three tree cover classes for each phenological metric.

3.4. Understanding Impact of Precipitation on Land Surface Phenology

Precipitation data (Table 1) of five meteorological stations in the region were used to further investigate the influence of rainfall on the phenological metrics. The various precipitation categories showed negative correlations with the day of year at SGS, MGR and PGS for the 13 years period, 2002–2015 for which precipitation data were available (Table 4). However, only mean rainfall of July–September and July–December showed a significant correlation (p < 0.05) with day of the year at SGS. We may have to recall that day of year at SGS occurs at about the first week of September according to the results of the phenological metrics. Therefore, the reason for the high negative correlation of July–December mean rainfall with day of the year SGS is unclear. The day of the year at PGS was also significantly influenced by mean rainfall for all but one of the rainfall categories (July–August). No phenological metric on the senescing phase of the austral year showed a significant correlation with rainfall (Table 4). The above correlation trends were not different when the analysis was conducted separately for low, medium and high tree cover polygons.
The correlation results corroborate the results obtained from assessing the interannual variability in rainfall and day of the year at SGS (Figure 12). In general, years of lower than average July–September mean rainfall showed a delay in day of the year at SGS, e.g., in 2003 and 2005 by almost 14 days, while the landscape showed an earlier day of the year at SGS in 2007 with an above average July–September mean rainfall.

4. Discussion

The main aim of this study was to determine the influence of varying tree cover on land surface phenology of the semi-arid savanna in South Africa. In other words, what is the impact of variation in tree cover percentage on the phenological response of mixed remotely sensed pixel of the semi-arid savanna?
An important finding of this study is the differential response of the land surface phenology to tree cover during the growing and senescing phases of the vegetated landscape. The influence of tree cover on land surface phenology is far stronger on the senescing phase metrics than on the growing phase metrics, e.g., explaining about 40% of the variance (p < 0.05) in the day of the year at MSR, i.e., point of inflexion on the senescing phase of the austral year. This study thus suggests an alternative method of assessing tree cover fraction in the semi-arid savanna i.e., using senescence period land surface phenological metrics. The varying influence of tree cover on the land surface phenology is most probably dependent on the vegetation response to climatic variables such as rainfall and temperature. Rainfall was shown to have a strong influence on land surface phenological metrics derived from the growing phase of the vegetation, thus overshadowing the impact of tree cover on the phenological response. Moreover, tree green-up has been shown to vary amongst savanna tree species with some tree species greening up before and others after the onset of the rainy season [6]. Thus, the variability in rainfall across the region and the differential behaviour of tree species in the region in relation to the onset of the rainy season might explain the low relationship between tree cover and start of the growing season. Temperature as opposed to rainfall might be the dominant factor controlling senescence of the vegetated landscape.
There were higher variabilities across the region (i.e., using the 100 randomly selected plots), for growing phase metrics when compared to the senescing phase metrics. Again, we believe that the spatial variability of rainfall in the region accounts for the high variabilities in the growing phase metrics. In fact, the low tree cover class showed the highest variabilities in the growing phase metrics. The low tree areas are most probably dominated by grasses and it has been widely established that grass phenology is largely dependent on rainfall [1,17]. Therefore, as asserted by Chidumayo [17], spatial responses of the start of the growing season can be explained by differential responses of phenology to rainfall among grasses and trees. Land surface phenological metrics derived from the growing phase of the annual LAI time series showed higher interannual variability in comparison to the senescence period metrics. Interannual variability of rainfall also explains the interannual variability of the growing phase metrics which were shown to be more sensitive to variation in rainfall. Contrary to expectations, we did not find any differences in the interannual variability between the tree cover classes at any phenological stage. Tree phenology was found to be more stable between years when compared to the phenology of savanna grasses in the Southern part of the Kruger National Park, which is within the study area [6]. Guan et al. [1] also determined that interannual variability in woodland phenological phases is smaller in comparison to African grasslands. The impact of rainfall on the interannual variability of land surface phenological metrics in the region may be site dependent. This however remains to be established. It is also noteworthy to mention that several challenges in retrieving the land surface phenological metrics could have affected the results. These challenges include cloud covered areas which cause distortion in the seasonal profile, no clear season LAI profiles in certain areas e.g., in a close canopy environment or very dry areas or several amplitudes in some areas which may results from subtle green-up events. Furthermore, the LAI time series maps were generated by applying a regression model derived from the red and NIR reflectance bands that were simulated using the PROSAIL radiative transfer model (a 1-D model). We however recommend further investigation into how the results might be different if LAI is generated using other radiative transfer models and inversion techniques.
There was little inter-annual variability in the senescing phase metrics. We speculate that temperature plays a more important role during this later phase than rainfall. There may be less spatial and temporal variation in temperature during the senescing phase thereby impacting less on the senescing dates of the various tree cover classes, reason for which the three tree cover classes were clearly distinguishable during senescence. Chidumayo [17] concluded that the interaction between minimum and maximum temperature was the most important determinant of savanna phenology in Southern Africa. Chidumayo [39] further determined that the interactions between temperature and rainfall explained 60–98% of the variations in diameter at breast height increment in indigenous trees in Zambia. Guan et al. [1] however concluded that potential factors controlling the phenology of African woodlands are not yet clearly understood and suggested further exploration of this subject. The complexity in understanding land surface phenology of savanna woodlands is further compounded by the mixed nature of remotely sensed pixels.
We argue that understanding the contribution of tree cover to land surface phenology could be crucial to understanding ecological processes such as the spread of fire in savanna ecosystems. Fire occurs in the African savanna system mostly at the end of the growing season and its spread is mainly determined by the dry herbaceous biomass and vegetation state e.g., moisture content of the vegetation or the phenological status. We now know that that spatial variability of day of the year at end of growing season is mainly determined by the fraction of tree cover in the savanna system of South Africa. Thus, the map of the spatial variability of day of the year at end of growing season could be important in assessing the spatial variability in fire spread with time. Furthermore, the low interannual variability in the day of the year at end of growing season implies that beyond this day for grass dominated areas (at about Day 300 of the austral year), any further spatial variation in moisture content of the vegetation with time could most probably be attributed to variation in tree cover fraction. We recommend the above assertion for further investigation.

5. Conclusions

The main results of the study can be summarised as follows:
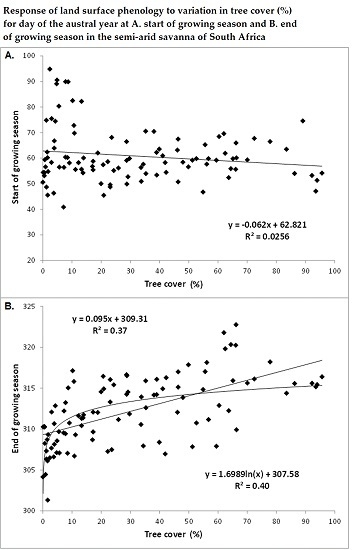
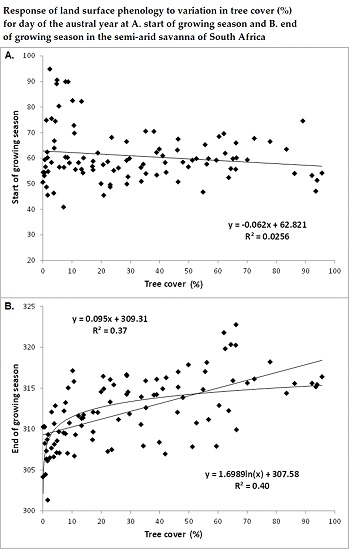
  • Areas with tree cover greater than 20% showed an earlier day of the year at SGS or MGR in comparison to areas with tree cover of less than 20%, although the difference was statistically not significant at p < 0.05 due to the wide variation in day of the year at SGS or MGR among the low tree cover polygons located across the study region.
  • There was a significant positive trend in the phenological metrics computed from the senescing phase, e.g., day of the year at MSR or EGS increases with increasing tree cover.
  • Phenological metrics computed from the growing phase of the annual LAI time series showed higher inter-annual variability in comparison to the senescing phase metrics.
  • Rainfall data for the region explained inter-annual variations in land surface phenological metrics during the green-up period of the vegetation, but not for the senescence period.
In conclusion, land surface phenological metrics derived from the green-up and senescence periods of the semi-arid savanna of Southern Africa exhibit differential response to tree cover variations. Variation in land surface phenology in the green-up period is partly dependent on rainfall and mean annual precipitation varies across the region [40], while tree cover strongly influences senescence period phenological response. The combined information on the contribution of trees to the land surface phenology of savanna and tree cover fractions could be relevant in models of fire risk assessment across the region with time since the spread of fire is determined by fuel load and the state of the vegetation e.g., phenology.

Acknowledgments

Funding for this study was provided by The Council for Industrial and Scientific Research (CSIR) Parliamentary Grant, Southern African Science Service Centre for Climate Change and Adaptive Land Management (SASSCAL) and ECOPOTENTIAL project which received funding from the European Union’s Horizon 2020 Research and Innovation Programme under grant agreement No. 641762. Lastly, we wish to acknowledge the very valuable comments of the anonymous reviewers, which were helpful in shaping the paper in its current form.

Author Contributions

Moses Cho, Abel Ramoelo and Luthando Dziba conceived and designed the experiments; Moses Cho and Abel Ramoelo performed the experiments; Moses Cho analysed the data; and Moses Cho wrote the paper.

Conflicts of Interest

The authors declare no conflict of interest. The founding sponsors had no role in the design of the study; in the collection, analyses, or interpretation of data; in the writing of the manuscript, and in the decision to publish the results.

References

  1. Guan, K.; Wood, E.F.; Medvigy, D.; Kimball, J.; Pan, M.; Caylor, K.K.; Sheffield, J.; Xu, X.; Jones, M.O. Terrestrial hydrological controls on land surface phenology of African savannas and woodlands. J. Geophys. Res. Biogeosci. 2014, 119, 1652–1669. [Google Scholar] [CrossRef]
  2. Tan, B.; Morisette, J.T.; Wolfe, R.E.; Gao, F.; Ederer, G.A.; Nightingale, J.; Pedelty, J.A. An Enhanced TIMESAT Algorithm for Estimating Vegetation Phenology Metrics from MODIS Data. IEEE J. Sel. Top. Appl. Earth Obs. Remote Sens. 2011, 4, 361–371. [Google Scholar] [CrossRef]
  3. Suepa, T.; Qi, J.; Lawawirojwong, S.; Messina, J.P. Understanding spatio-temporal variation of vegetation phenology and rainfall seasonality in the monsoon Southeast Asia. Environ. Res. 2016, 147, 621–629. [Google Scholar] [CrossRef] [PubMed]
  4. Spencer, H.; Weiblen, G.; Flick, B. Phenology of Ficus variegata in a seasonal wet tropical forest at Cape Tribulation, Australia. J. Biogeogr. 1996, 23, 467–475. [Google Scholar] [CrossRef]
  5. Damstra, K.S.J.; Richardson, S.; Reeler, B. Synchronized fruiting between trees of Ficus thonningii in seasonally dry habitats. J. Biogeogr. 1996, 23, 495–500. [Google Scholar] [CrossRef]
  6. Archibald, S.; Scholes, R.J. Leaf green-up in a semi-arid African savanna -separating tree and grass responses to environmental cues. J. Veg. Sci. 2007, 18, 583–594. [Google Scholar]
  7. White, M.A.; Thornton, P.E.; Running, S.W. A continental phenology model for monitoring vegetation responses to interannual climatic variability. Glob. Biogeochem. Cycles 1997, 11, 217–234. [Google Scholar] [CrossRef]
  8. Jin, C.; Xiao, X.; Merbold, L.; Arneth, A.; Veenendaal, E.; Kutsch, W.L. Phenology and gross primary production of two dominant savanna woodland ecosystems in Southern Africa. Remote Sens. Environ. 2013, 135, 189–201. [Google Scholar] [CrossRef]
  9. Wessels, K.; Steenkamp, K.; von Maltitz, G.; Archibald, S. Remotely sensed vegetation phenology for describing and predicting the biomes of South Africa. Appl. Veg. Sci. 2011, 14, 49–66. [Google Scholar] [CrossRef]
  10. Scholes, R.J. Convex Relationships in Ecosystems Containing Mixtures of Trees and Grass. Environ. Resour. Econ. 2003, 26, 559–574. [Google Scholar] [CrossRef]
  11. Wakeling, J.L.; Cramer, M.D.; Bond, W.J. The savanna-grassland ‘treeline’: Why don’t savanna trees occur in upland grasslands? J. Ecol. 2012, 100, 381–391. [Google Scholar] [CrossRef]
  12. Ernst, W.H.O.; Veenendaal, E.M.; Kebakile, M.M. Possibilities for Dispersal in Annual and Perennial Grasses in a Savanna in Botswana. Vegetatio 1992, 102, 1–11. [Google Scholar] [CrossRef]
  13. Ramoelo, A.; Skidmore, A.K.; Cho, M.A.; Schlerf, M.; Mathieu, R.; Heitkönig, I.M.A. Regional estimation of savanna grass nitrogen using the red-edge band of the spaceborne RapidEye sensor. Int. J. Appl. Earth Obs. 2012, 19, 151–162. [Google Scholar] [CrossRef]
  14. Tomlinson, K.W.; Poorter, L.; Bongers, F.; Borghetti, F.; Jacobs, L.; Frank, V.L. Relative growth rate variation of evergreen and deciduous savanna tree species is driven by different traits. Ann. Bot. 2014, 114, 315–324. [Google Scholar] [CrossRef] [PubMed]
  15. Mathieu, R.; Naidoo, L.; Cho, M.A.; Leblon, B.; Main, R.; Wessels, K.; Asner, G.P.; Buckley, J.; Van Aardt, J.; Erasmus, B.F.N.; et al. Toward structural assessment of semi-arid African savannahs and woodlands: The potential of multitemporal polarimetric RADARSAT-2 fine beam images. Remote Sens. Environ. 2013, 138, 215–231. [Google Scholar] [CrossRef]
  16. Cho, M.A.; Debba, P.; Mathieu, R.; Naidoo, L.; Van Aardt, J.; Asner, G.P. Improving discrimination of savanna tree species through a multiple-endmember spectral angle mapper approach: Canopy-level analysis. IEEE Trans. Geosci. Remote 2010, 48, 4133–4142. [Google Scholar] [CrossRef]
  17. Chidumayo, E. Climate and phenology of savanna vegetation in southern Africa. J. Veg. Sci. 2001, 12, 347–354. [Google Scholar] [CrossRef]
  18. Shackleton, C. The main aim of this study was therefore to determine the influence of varying tree cover on the phenology of mixed remotely sensed pixel otherwise known as land surface phenology. Glob. Ecol. Biogeogr. 1999, 8, 125–136. [Google Scholar] [CrossRef]
  19. Sankaran, M.H.N.; Scholes, R.J.; Ratnam, J.; Augustine, D.J.; Cade, B.S.; Gignoux, J.; Higgins, S.I.; Le Roux, X.; Ludwig, F.; Ardo, J.; et al. Determinants of woody cover in African savannas. Nature 2005, 438, 846–849. [Google Scholar] [CrossRef] [PubMed]
  20. Whitecross, M.A.; Witkowski, E.T.F.; Archibald, S. Savanna tree-grass interactions: A phenological investigation of green-up in relation to water availability over three seasons. S. Afr. J. Bot. 2017, 108, 29–40. [Google Scholar] [CrossRef]
  21. Jolly, W.M.; Running, S.W. Effects of precipitation and soil water potential on drought deciduous phenology in the Kalahari. Glob. Chang. Biol. 2004, 10, 303–308. [Google Scholar] [CrossRef]
  22. Fuller, D.O. Canopy phenology of some mopane and miombo woodlands in eastern Zambia. Glob. Ecol. Biogeogr. 1999, 8, 199–209. [Google Scholar] [CrossRef]
  23. Verbesselt, J.; Somers, B.; Lhermitte, J.; van Aardt, J.; Jonckheere, I.; Coppin, P. Fire risk assessment in savanna ecosystems with multi-temporal satellite data. Commun. Agric. Appl. Biol. Sci. 2005, 70, 23–26. [Google Scholar] [PubMed]
  24. Verbesselt, J.; Jönsson, P.; Lhermitte, J.; van Aardt, J.; Jonckheere, I.; Coppin, P. Evaluating satellite and climate data-derived indices as fire risk indicators in savanna ecosystems. IEEE Trans. Geosci. Remote Sens. 2006, 44, 1622–1632. [Google Scholar] [CrossRef]
  25. Bajocco, S.; Dragoz, E.; Gitas, I.; Smiraglia, D.; Salvati, L.; Ricotta, C. Mapping Forest Fuels through Vegetation Phenology: The Role of Coarse-Resolution Satellite Time-Series. PLoS ONE 2015, 10, e0119811. [Google Scholar] [CrossRef] [PubMed]
  26. Staver, A.C.; Archibald, S.; Levin, S. Tree cover in sub-Saharan Africa: rainfall and fire constrain forest and savanna as alternative states. Ecology 2011, 92, 1063–1072. [Google Scholar] [CrossRef] [PubMed]
  27. Mucina, L.; Rutherford, M.C. The Vegetation of South Africa, Lesotho and Swaziland; South African Biodiversity Institute: Pretoria, South Africa, 2006; Volume 19. [Google Scholar]
  28. Duhl, T.R.; Guenther, A.; Helmig, D. Estimating urban vegetation cover fraction using Google Earth® images. J. Land Use Sci. 2012, 7, 311–329. [Google Scholar] [CrossRef]
  29. Ludwig, A.; Meyer, H.; Nauss, T. Automatic classification of Google Earth images for a larger scale monitoring of bush encroachment in South Africa. Int. J. Appl. Earth Obs. 2016, 50, 89–94. [Google Scholar] [CrossRef]
  30. Pan, Z.; Huang, J.; Zhou, Q.; Wang, L.; Cheng, Y.; Zhang, H.; Blackburn, G.A.; Yan, J.; Liu, J. Mapping crop phenology using NDVI time-series derived from HJ-1 A/B data. Int. J. Appl. Earth Obs. 2015, 34, 188–197. [Google Scholar] [CrossRef]
  31. Wu, C.; Peng, D.; Soudani, K.; Siebicke, L.; Gough, C.M.; Arain, M.A.; Bohrer, G.; Lafleur, P.M.; Peichl, M.; Gonsamo, A.; et al. Land surface phenology derived from normalized difference vegetation index (NDVI) at global FLUXNET sites. Agric. For. Meteorol. 2017, 233, 171–182. [Google Scholar] [CrossRef]
  32. Hmimina, G.; Dufrêne, E.; Pontailler, J.Y.; Delpierre, N.; Aubinet, M.; Caquet, B.; de Grandcourt, A.; Burban, B.; Flechard, C.; Granier, A.; et al. Evaluation of the potential of MODIS satellite data to predict vegetation phenology in different biomes: An investigation using ground-based NDVI measurements. Remote Sens. Environ. 2013, 132, 145–158. [Google Scholar] [CrossRef]
  33. Cho, M.A.; Ramoelo, A.; Mathieu, R. Estimation of leaf area index (LAI) of South Africa from MODIS imager by inversion of PROSAIL radiative transfer model. In Proceedings of the 2014 IEEE International Geoscience and Remote Sensing Symposium (IGARSS), Quebec City, QC, Canada, 13–18 July 2014; pp. 2590–2593. [Google Scholar]
  34. Jonsson, P.; Eklundh, L. Seasonality extraction by function fitting to time-series of satellite sensor data. IEEE Trans. Geosci. Remote Sens. 2002, 40, 1824–1832. [Google Scholar] [CrossRef]
  35. Bradley, B.A.; Jacob, R.W.; Hermance, J.F.; Mustard, J.F. A curve fitting procedure to derive inter-annual phenologies from time series of noisy satellite NDVI data. Remote Sens. Environ. 2007, 106, 137–145. [Google Scholar] [CrossRef]
  36. Groten, S.M.E.; Ocatre, R. Monitoring the length of the growing season with NOAA. Int. J. Remote Sens. 2002, 23, 2797–2815. [Google Scholar] [CrossRef]
  37. Scholes, R.J. Woodlands of South Africa. In Indigenous Forest and Woodlands in South Africa: Policy People and Practices; Lawes, M.J., Eeley, H.A.C., Shackleton, C.M., Geach, B.G.S., Eds.; University of KwaZulu-Natal Press: Pietermaritzburg, South Africa, 2004. [Google Scholar]
  38. Guan, K.; Medvigy, D.; Wood, E.F.; Caylor, K.K.; Li, S.; Jeong, S.J. Deriving Vegetation Phenological Time and Trajectory Information Over Africa Using SEVIRI Daily LAI. IEEE Trans. Geosci. Remote Sens. 2014, 52, 1113–1130. [Google Scholar] [CrossRef]
  39. Chidumayo, E.N. Effects of climate on the growth of exotic and indigenous trees in central Zambia. J. Biogeogr. 2005, 32, 111–120. [Google Scholar] [CrossRef]
  40. Schulze, R.E. South African Atlas of Climatology and Agrohydrology; WRC Report 1489/06; Water Research Commission: Pretoria, South Africa, 2007. [Google Scholar]
Figure 1. Biomes of South Africa (a) (Mucina and Rutherford, 2006); and mean annual precipitation (b) (Schulze, 2007). One hundred random plots selected to analyse spatial and temporal patterns in land surface phenological metrics (c).
Remotesensing 09 00689 g001
Figure 2. Tree cover (%) estimation using classification of high resolution Google Earth imagery (a) into tree and background classes (b). The polygon boundary is indicated in black on image (a).
Remotesensing 09 00689 g002
Figure 3. Sample time series of two spectral indices extracted from MODIS imagery of the study area, (a) the Normalised Difference Vegetation Index (NDVI) and Enhanced Vegetation Index (EVI), and (b) leaf area index (LAI) derived from the red and near-infrared bands.
Remotesensing 09 00689 g003
Figure 4. Leaf area index map of South Africa (Julian day 73) generated by inversion of PROSAIL radiative transfer model on MODIS imagery.
Remotesensing 09 00689 g004
Figure 5. Land surface phenological metrics resulting from fitting an inverted Gaussian model to the LAI austral year curve on the green-up and senescence periods of the vegetated landscape. SGS, MGR, PGS, MSR and EGS denote dates corresponding to start, maximum growing rate, peak growth, maximum senescing rate and end of growing season, respectively.
Remotesensing 09 00689 g005
Figure 6. Fourteen-year median maps of the various phenological metrics: (ae) the day of the austral year at start (SGS), maximum growing rate (MGR), peak growth (PGS), maximum senescing rate (MSR) and end of growing season (EGS), respectively. The austral year used in the study ranges from 4 July (Julian Day 185) of one year to 26 June (Day 177) of the following year.
Remotesensing 09 00689 g006
Figure 7. Differences in land surface phenology between three tree cover (%) classes (low, medium and high) for day of the year at: (a) start of growing season; (b) maximum growing rate; (c) peak growth; (d) maximum senescing rate; and (e) end of growing season. The Austral used in the study ranges from 4 July (Julian Day 185) of one year to 26 June (Day 177) of the following year.
Remotesensing 09 00689 g007
Figure 8. Linear regression analyses between tree cover (%) and landscape phenological metrics for day of the year at: (a) start of growing season; (b) maximum growing rate; (c) peak production; (d) maximum senescing rate; and (e) end of growing season. The growing season used in the study ranges from 4 July (Julian Day 185) of one year to 26 June (Day 177) of the following year.
Remotesensing 09 00689 g008
Figure 9. Model used to map tree cover (%) in the study area.
Remotesensing 09 00689 g009
Figure 10. Tree cover (%) derived from the day of the austral year at maximum senescing rate (a land surface phenological metric).
Remotesensing 09 00689 g010
Figure 11. Inter-annual variability in land surface phenological metrics. Vertical bars denote ±95% confidence interval. SGS, MGR, PGS, MSR and EGS denote day of year at Start of growing season, maximum growing rate, peak growth, maximum senescing rate and end of growing season, respectively.
Remotesensing 09 00689 g011
Figure 12. Yearly deviation of July-September mean rainfall (5 meteorological stations) from the 13 year (2002–2014) mean (a); and yearly deviation of start of growing season date for 100 randomly selected polygons in the study area (b).
Remotesensing 09 00689 g012
Table 1. Rainfall data of five meteorological stations in the study area (Rustenburg, Marbel Hall Moosriver, Lephalale, Bloemhof and Escelsior-benchmark), showing mean (mm) rainfall for the green-up and senescence periods of the vegetated landscape.
Austral YearGreen-Up PeriodSenescence Period (in Reverse Order)
July–AugustJuly–SeptemberJuly–OctoberJuly–NovemberJuly–DecemberJune–MayJune–AprilJune–MarchJune–FebruaryJune–January
2001–2002 15.321.624.428.532.5
2002–20038.010.127.230.943.414.110.418.723.237.0
2003–20040.33.310.822.326.52.412.636.345.062.6
2004–20051.82.92.28.035.64.617.526.326.742.0
2005–20067.68.012.430.834.211.749.737.349.774.2
2006–200715.111.315.128.041.77.322.422.223.329.9
2007–20088.119.748.062.469.324.626.537.037.761.5
2008–20093.62.822.236.145.112.118.838.132.177.7
2009–20108.98.420.936.349.19.843.248.550.765.1
2010–20113.02.313.228.942.33.123.626.026.146.6
2011–20124.84.717.827.347.22.87.720.221.343.1
2012–20130.914.126.636.254.32.922.928.032.147.9
2013–20142.48.017.826.246.22.011.544.639.461.5
2014–20155.74.012.522.043.35.212.831.036.848.0
2015–20162.67.09.712.923.4
Table 2. Statistics of land surface phenological metrics for three tree cover (%) classes; Low (<20%, n = 44), Medium (20–40%, n = 22) and high (>40%, n = 34), derived from 14-year median maps. The austral year used in the study ranges from 4 July (Julian Day 185) of one year to 26 June (Day 177) of the following year.
Tree Cover ClassMean ± 95% CIStandard DeviationCoefficient of Variation (%)
a. Day of year at start of growing season
Low64 ± 4.11422
Medium58 ± 2.6712
High59 ± 3.3610
Mean 60 ± 2.1915
b. Day of year at maximum growth rate
Low85 ± 5.21720
Medium77 ± 3.6912
High79 ± 3.979
Mean80 ± 2.71114
c. Day of year at peak growth
Low198 ± 5.52010
Medium199 ± 3.9105
High206 ± 4.9105
Mean201 ± 2.7137
d. Day of year at maximum senescing rate
Low296 ± 2.272
Medium304 ± 2.972
High308 ± 3.593
Mean303 ± 1.783
e. Day of year at end of growing season
Low310 ± 1.031
Medium313 ± 1.331
High315 ± 1.741
Mean313 ± 0.831
Table 3. Differences in the means and variances between tree cover (%) classes using t and f tests.
Phenological Metricst-Value for Differences in Meansp for Differences in MeansF-Ratio for Differences in Variancesp for Differences Variances
a. Day of year at start of growing season
Low vs. Medium1.9720.0533.7180.002
Low vs. High1.6950.0944.4380.001
Medium vs. High−0.9910.3261.1940.634
b. Day of the year at maximum growth rate
Low vs. Medium2.0120.0483.3760.004
Low vs. High1.7740.0805.5310.001
Medium vs. High−1.0440.3011.6380.199
c. Day of the year at peak growth
Low vs. Medium−0.1220.9043.9180.001
Low vs. High−2.1710.0333.6660.001
Medium vs. High−2.7110.0091.0680.892
d. Day of the year at maximum senescence rate
Low vs. Medium−4.4950.0011.0710.890
Low vs. High−6.9440.0011.4920.220
Medium vs. High−1.9280.0591.5980.263
e. Day of the year at end of growing season
Low vs. Medium−4.3240.0011.0300.972
Low vs. High−6.2610.0011.7870.074
Medium vs. High−1.6050.1141.8410.145
Bold p values are significant at p < 0.05.
Table 4. Pearson’s correlations (r) between mean rainfall of five meteorological stations in the study area (Rustenburg, Marbel Hall Moosriver, Lephalale, Bloemhof and Escelsior-benchmark) and green-up or senescence period phenological metrics for 100 randomly selected plots in the study area.
  A. Green-Up PeriodJuly–AugustJuly–SeptemberJuly–OctoberJuly–NovemberJuly–December
a. Start of growing season−0.27−0.57 *−0.55−0.50−0.82 *
b. Date of max. growth rate−0.28−0.53−0.50−0.46−0.80 *
c. Date of peak production−0.43−0.62 *−0.75 *−0.71 *−0.83 *
  B. Senescence PeriodJune–MayJune–AprilJune–MarchJune–FebruaryJune–January
d. Date of max. senescing rate−0.410.150.100.12−0.02
e. End of growing season −0.350.120.090.09−0.02
* p < 0.05.

