Article

Regional-Scale High Spatial Resolution Mapping of Aboveground Net Primary Productivity (ANPP) from Field Survey and Landsat Data: A Case Study for the Country of Wales

1
Centre for Ecology and Hydrology, Lancaster Environment Centre, Library Avenue, Bailrigg, Lancaster LA1 4AP, UK
2
Department of Geography, King’s College London, Strand Campus, London WC2R 2LS, UK
*
Author to whom correspondence should be addressed.
Remote Sens. 2017, 9(8), 801; https://doi.org/10.3390/rs9080801
Submission received: 25 May 2017 / Revised: 28 July 2017 / Accepted: 1 August 2017 / Published: 4 August 2017
(This article belongs to the Section Remote Sensing in Agriculture and Vegetation)

Abstract

:
This paper presents an alternative approach for high spatial resolution vegetation productivity mapping at a regional scale, using a combination of Normalised Difference Vegetation Index (NDVI) imagery and widely distributed ground-based Above-ground Net Primary Production (ANPP) estimates. Our method searches through all available single-date NDVI imagery to identify the images which give the best NDVI–ANPP relationship. The derived relationships are then used to predict ANPP values outside of field survey plots. This approach enables the use of the high spatial resolution (30 m) Landsat 8 sensor, despite its low revisit frequency that is further reduced by cloud cover. This is one of few studies to investigate the NDVI–ANPP relationship across a wide range of temperate habitats and strong relationships were observed (R2 = 0.706), which increased when only grasslands were considered (R2 = 0.833). The strongest NDVI–ANPP relationships occurred during the spring “green-up” period. A reserved subset of 20% of ground-based ANPP estimates was used for validation and results showed that our method was able to estimate ANPP with a RMSE of 15–21%. This work is important because we demonstrate a general methodological framework for mapping of ANPP from local to regional scales, with the potential to be applied to any temperate ecosystems with a pronounced green up period. Our approach allows spatial extrapolation outside of field survey plots to produce a continuous surface product, useful for capturing spatial patterns and representing small-scale heterogeneity, and well-suited for modelling applications. The data requirements for implementing this approach are also discussed.

Graphical Abstract

1. Introduction

Terrestrial organisms, including humans, are dependent upon the fixation of carbon from the atmosphere into accumulated dry matter per unit area. The rate at which this occurs is Net Primary Production (NPP). This is a fundamental ecosystem function that supports food production, climate regulation and the formation and stability of soils, and has also been mechanistically and empirically linked to various forms of biodiversity [1,2]. Modelling, mapping and prediction of NPP at fine-resolution but across large domains is important because of human dependence on NPP. For example, an estimated 28.8% of global NPP [3] is appropriated by humans as food, fibre and fuel. NPP is, however, difficult to measure and predict accurately [4,5] but there is a pressing need to do so because global change drivers such as land-use, climate change, novel pests and atmospheric pollution are all likely to change NPP in the coming decades. Here, we combine remotely-sensed data with ground-based measurements of annual above-ground NPP (ANPP) and associated plant traits to develop and test a new capability for estimating terrestrial ANPP at fine resolution. The advantage of such an approach is that ANPP can be estimated at spatial resolutions fine enough to accommodate variation imposed by land-use across farmed and fragmented habitat mosaics. This is in contrast to models that simulate NPP at larger grid cell resolution and then apportion sub-grid NPP in a non-spatially explicit way between Plant Functional Types (e.g., [5]). We focus on ANPP rather than total NPP due to practicalities of measurement and because this is the fraction that is most readily consumed by humans as food, timber and fibre and that contributes to and impacts above-ground biodiversity [1]. Furthermore, ANPP is a sensitive response variable to land use and climate change.
While the need for a high-resolution ANPP product is clear, this work was also motivated by the demand for new approaches for representing the landscape to produce products that meet the needs of a wide range of users. Traditional remote-sensing classification is a categorical process that identifies a single land cover type for each pixel or parcel of land (e.g., [6]), rarely capturing the complexity of the landscape. Fuzzy classification methods capture heterogeneity by identifying a number of classes for a particular pixel or parcel [7,8]. This enables a more sophisticated description of the spatial distribution and co-occurrence of different classes, but is still categorical and fails to capture within-class variability. For example, both the traditional and fuzzy classifications would map a large area of grassland spanning an environmental gradient, as a single land-cover type, despite vegetation productivity varying widely. For some applications, this lack of sensitivity to environmental condition/quality may be acceptable, however, users of environmental datasets are increasingly demanding a more nuanced picture of the landscape to enable remote sensing to routinely be used to monitor changes in both the extent and condition of land cover/habitat [9]. To meet these emerging requirements, novel methods are required to enhance and supplement traditional land cover products.
Continuous field biophysical products provide an alternative approach to representing the land surface [10,11,12]. The advantage of these products is that they: (i) capture within-class variability, so gradients in grassland productivity across a specific field will be mapped, as will the wider variations across a region, or across different regions; and (ii) are a key requirement of condition monitoring and early detection gradual of land cover change.
Methods for remote sensing of ANPP have been investigated extensively, mainly at a small-scale (i.e., site-level) or at a global scale from MODIS data [13]. The extreme difference in the two spatial scales (site compared to global) is due to the different methods underpinning estimation/modelling of NPP. At the site-scale an empirical relationship is created, typically between a vegetation index and field estimates of NPP or gross primary productivity (GPP) [14,15], such relationships are generally image-specific, site-specific and specific to a particular vegetation type, which limits their application over wide areas. Typically, the key constraint is the limited availability of field data to generate the empirical relationships against, whereas at the global scale NPP is estimated using a combination of satellite data, meteorological data and modelling [13]. Country-scale NPP products from MODIS have also been explored for China [16] and recently methods have been developed to estimate Net Ecosystem Exchange from Landsat data via an upscaling approach that utilises flux tower observations [17]; however, this requires flux tower data for calibration. Prior to this, AVHRR data were used to produce ANPP estimates for large areas of grassland in the US [18]. However, for many applications the spatial resolution of the MODIS-, or earlier AVHRR-based products, is too coarse, especially for countries that are highly heterogeneous, such as the UK [19].
A widely-used indicator for deriving vegetation productivity from remotely sensed imagery is the Normalised Difference Vegetation Index (NDVI). Empirical models relating annually-integrated NDVI and ANPP have been shown to be relatively accurate in most environments [20]. NDVI is sensitive to the fraction of Absorbed Photosynthetically Active Radiation (fAPAR) and the exact relationship between NDVI and ANPP is dependent on several factors including the vegetation type and the climatological conditions. For this reason, physically-based, light use efficiency (LUE) models are commonly used for mapping vegetation productivity at a global scale, to deal with regional differences and a lack of sufficient in situ data for model calibration [21,22]. Using this approach, Gross Primary Production (GPP) is estimated as:
GPP = ε × fAPAR × PAR,
where ε is the efficiency of the conversion of absorbed PAR into dry biomass and fAPAR is estimated from NDVI imagery. NPP is then estimated as GPP minus autotrophic respiration losses. This approach requires accurate knowledge of ε, which varies in response to environmental stressors such as drought and temperature extremes. Estimation of these variables from available coarse-scale meteorological data can introduce significant errors [23]. Hence, in cases where in situ ANPP data are available, simple empirical models relating vegetation indices and ANPP can be more robust than the LUE approach [15], particularly when mapping areas where climatic gradients are minimal.
Typically, annually-integrated NDVI values are used for estimating vegetation productivity from sensors with high temporal sampling but low spatial resolution [20,21]. To generate a product capable of mapping within-field variability in ANPP, high spatial resolution data are required and these typically have low revisit frequencies, which are further reduced by cloud cover. Estimating ANPP from annually-integrated NDVI precludes the use of Landsat-like sensors (with high spatial resolution and low revisit frequency), particularly in cloudy regions, because it is impossible to get cloud free imagery from enough time points in the year to produce a reliable estimate of integrated NDVI. Hence, a novel approach was developed in this study by using single-date NDVI imagery (rather than annually-integrated values) to overcome this challenge. We derive empirical models relating single-date NDVI to ANPP to demonstrate the feasibility of this approach. We also present results showing how the strength of this relationship varies with season and illustrating why the best relationships occurred during a narrow time window coinciding with the vegetation green up period, identifying for the first time, as far as the authors can ascertain, the optimum time period for predicting ANPP from single-date NDVI.
This study combines detailed field survey data and broad scale remote sensing data to produce a map of ANPP for Wales. The aim was to develop a method for creating high quality, operational NPP products that are consistent, repeatable and validated. Our proposed approach is based on a more robust application of empirical methods, utilizing representative field data that cover a large area, rather than a single site, allowing the resulting model to be applied at a regional scale. The objectives of this work were to:
  • Develop a method for using field-based ANPP estimates, distributed across Wales, to produce regression relationships with NDVI imagery that can be used to estimate ANPP across Wales.
  • Identify and assess the impact of issues, such as the timing of the images and the type of habitat, which may affect the accuracy of the estimated ANPP.
  • Discuss the limitations and potential for implementing an operational system for mapping ANPP using field measurements and remote sensing data.
As far as the authors can determine, this is the first countrywide mapping of ANPP from Landsat-data. It is also one of very few studies that has investigated the relationship between finely resolved NDVI and observed ANPP measurements across a broad range of habitat types [20].

2. Materials and Methods
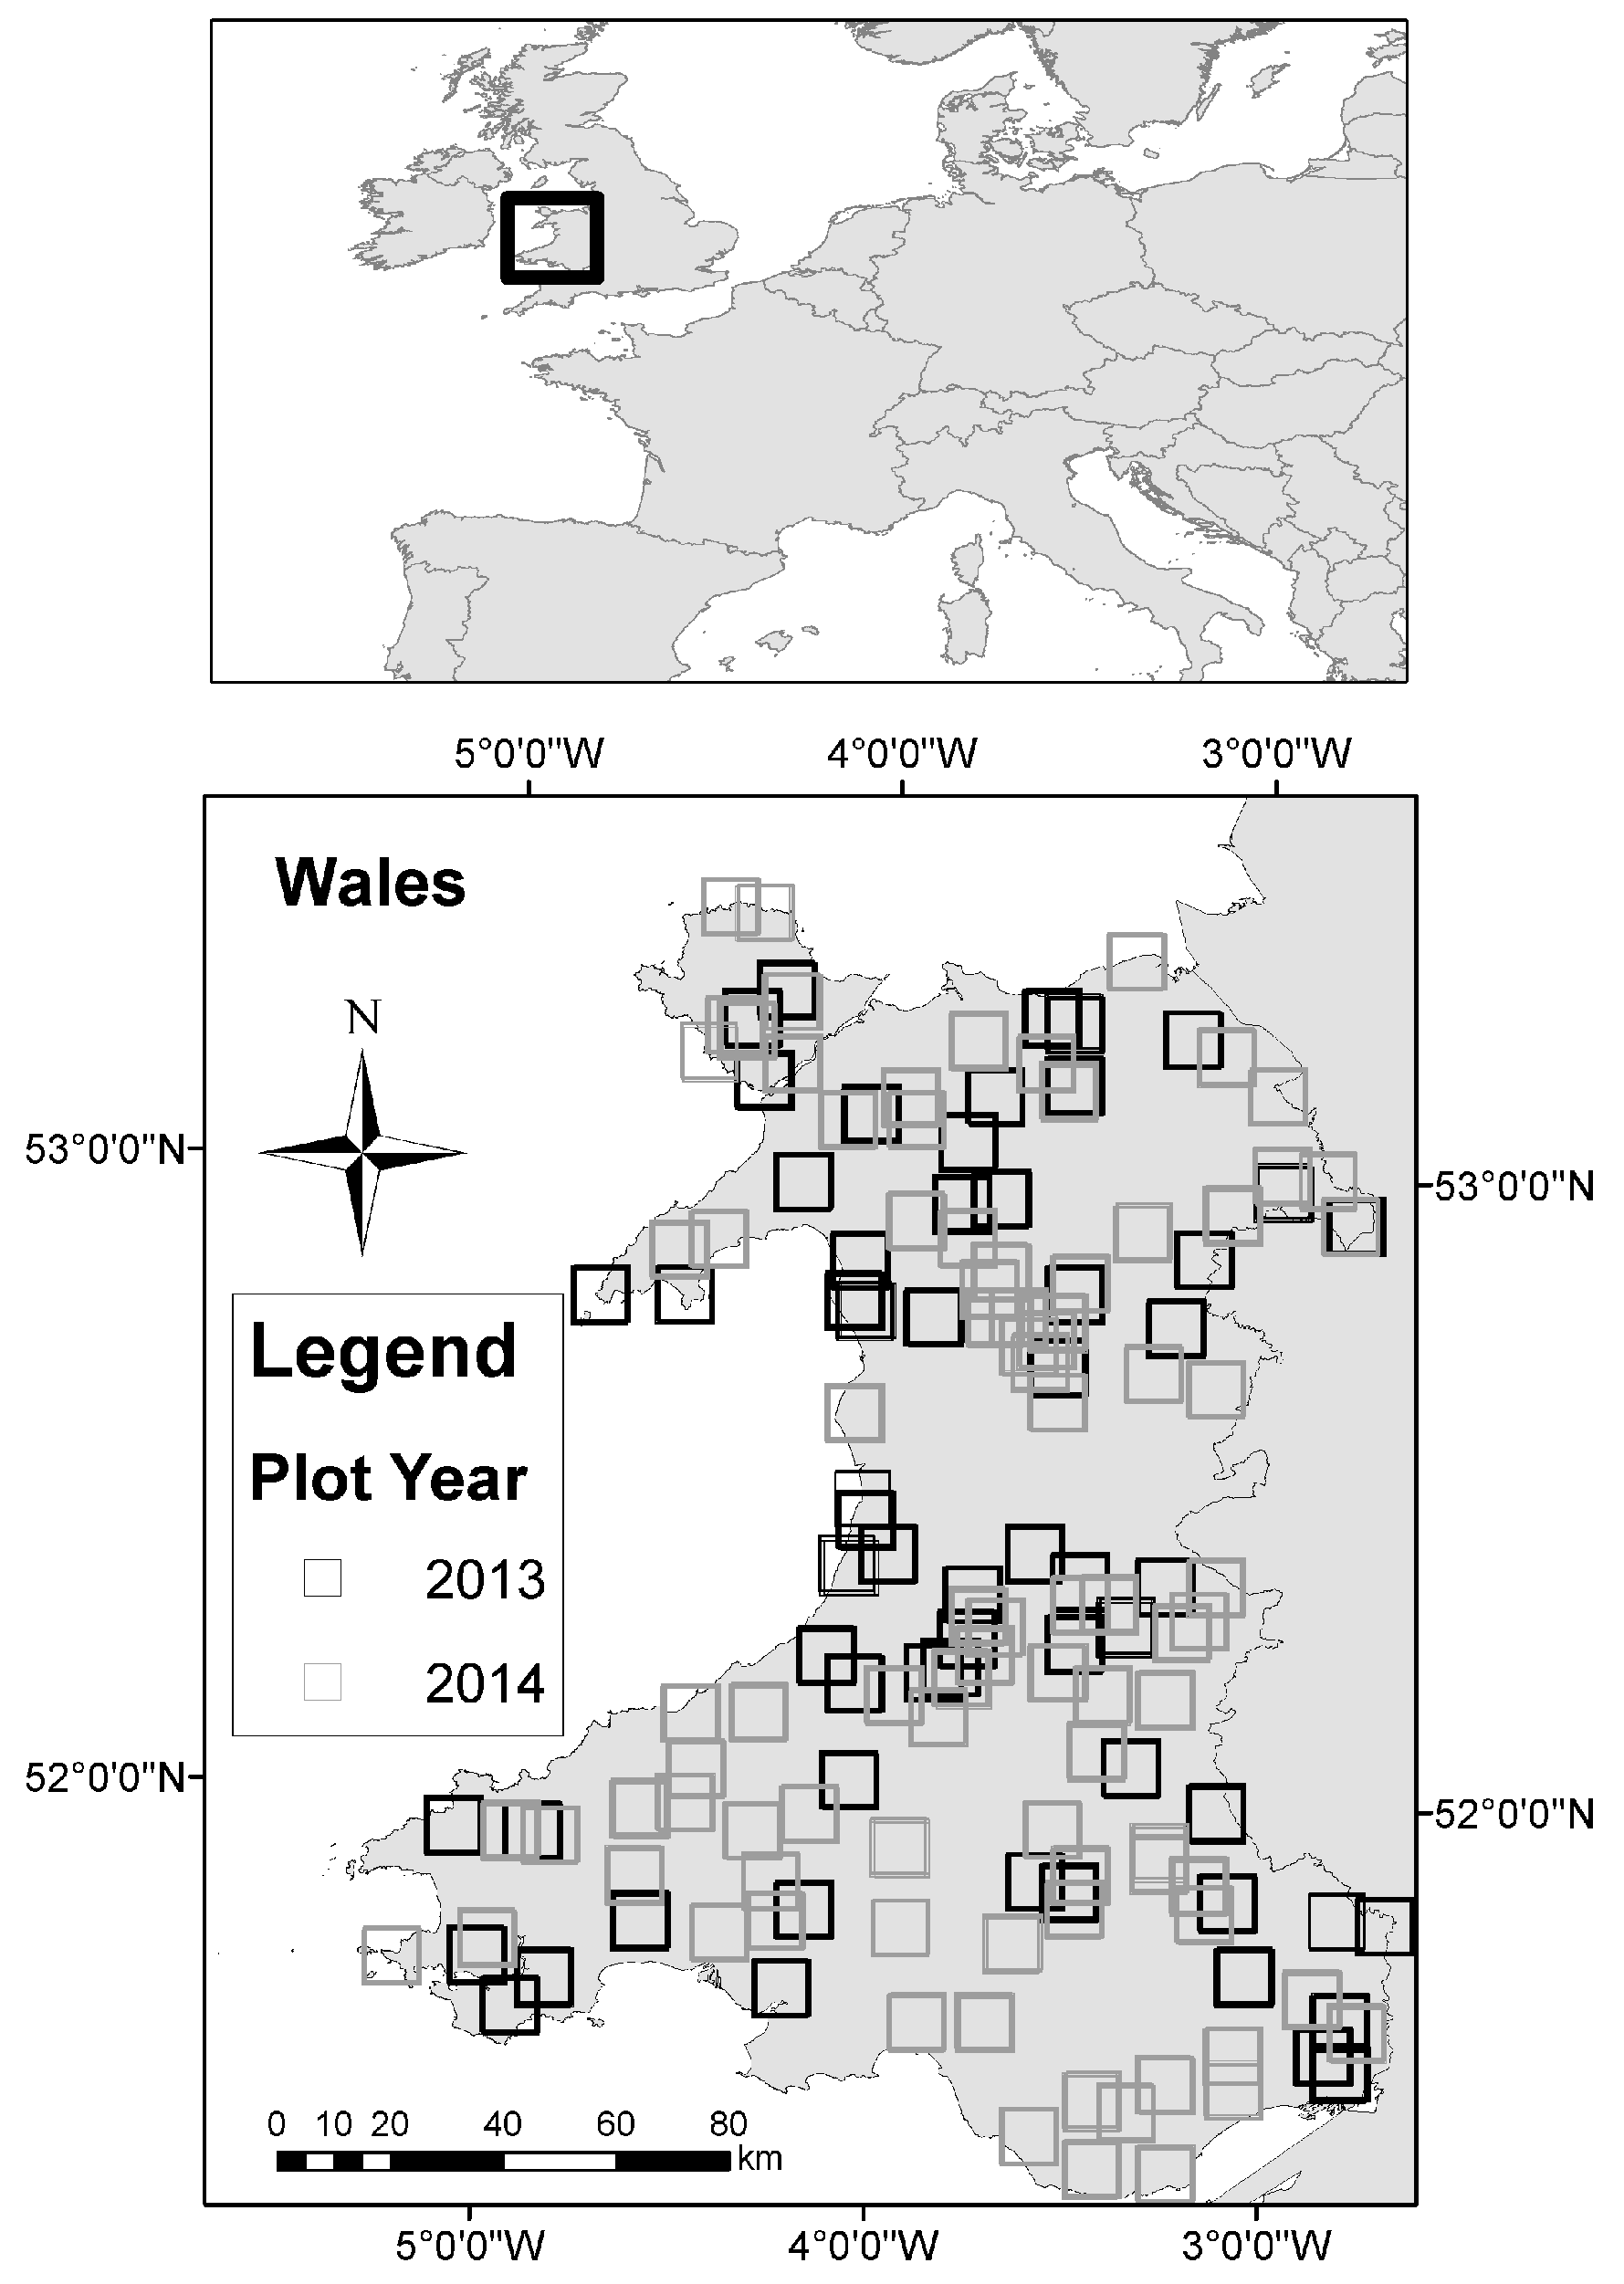
2.1. Study Area

With a terrestrial area of 2,077,900 ha, Wales is a largely farmed territory subjected to a cool, temperate climate with a regime of cool summers and mild winters. Substantial variation in altitude and topography result in marked micro-climatic variation from grass-growing enclosed farmlands in the lowlands and river valley bottoms to mountains and hills that occupy much of the interior of the country. Geology and climate have contributed to the inherently low agricultural productivity of soils yet most utilisable land has been amenable to varying levels of agricultural improvement, the intensity of which has gathered pace over the last 100 years. Currently, the habitat composition of Wales reflects much human modification, comprising 52% enclosed farmland; 13% semi-natural grasslands typically grazed by sheep; 11% mountain, bog and heath; and 14% woodland covering semi-natural and ancient broadleaf plus conifer plantation [24].

2.2. ANPP Estimates from Field Observations

Studies based on the LUE approach typically use eddy covariance observations to estimate NPP in g C m−2 year−1 [17,23]. In this study, however, in situ ANPP estimates (in g dry matter m−2 year−1) were used. Field survey data for Wales were collected as part of the Welsh Government funded Glastir Monitoring and Evaluation Program (https://gmep.wales/). This is a national-scale, monitoring program designed to measure change in the extent and condition of ecosystems across Wales. Cover-weighted Leaf Dry Matter Content (cLDMC) was calculated for 707 (14.14 m × 14.14 m) square vegetation sampling quadrats located at random within 150 (1 km × 1 km) squares across Wales (Figure 1) and recorded over the growing seasons of 2013 and 2014. The resulting quadrat data sampled the complete range of temperate terrestrial habitats including woodland, various types of grassland and upland habitats. Database values for LDMC for vascular plant species encountered in quadrats were extracted from LEDA [25]. The cLDMC values were used to predict above-ground NPP (g dry matter m−2 year−1) by applying an empirical model of the relationship between cLDMC and directly-measured NPP. This model quantifies the regression relationship between intensive in situ measurements of both LDMC and NPP carried out across a range of temperate ecosystems considered to represent productivity and biodiversity gradients in NW Europe [26]. Given cLDMC in each GMEP quadrat, ANPP was predicted by sampling from the posterior parameter distributions of the best-performing regression model in [26] and solving for each quadrat.

2.3. Satellite Image Processing

Landsat 8 Operational Land Imager (hereafter referred to as Landsat 8) imagery for Wales was downloaded from the USGS Global Visualisation Viewer (http://glovis.usgs.gov/index.shtml) for 2013 and 2014 (Table 1). The raw pixel values (digital numbers) were calibrated to top-of-atmosphere (TOA) reflectance [27]. For comparison, Landsat 8 Surface Reflectance Products were also downloaded from the USGS Earth Resources Observation and Science (EROS) Center Science Processing Architecture (ESPA) On Demand Interface (https://espa.cr.usgs.gov/).
Clouds were masked from the imagery by using the Quality Assessment (QA) band to identify pixels flagged as cloud or cirrus with a medium confidence level [27]. A buffer of 10 pixels was added to capture cloud edges. A geometry based cloud shadow mask was applied, which estimated the location of cloud shadow using the solar zenith and azimuth angle for the image and an assumed cloud height of 1.5 km, and adding a buffer of 10 pixels to account for variability in cloud height.
The reflectance values in the red and near-infrared (NIR) bands, ρRed and ρNIR, respectively, were used to produce NDVI images, where:
N D V I = ( ρ N I R ρ R e d ) ( ρ N I R + ρ R e d ) ,
The NDVI values at the coordinates of each of the GMEP vegetation sampling quadrats were then extracted from the Landsat 8 imagery. Two 100% cloud free Landsat 5 TM surface reflectance NDVI images, acquired on 28 April 2011, were also used to illustrate what is possible under ideal conditions [28].

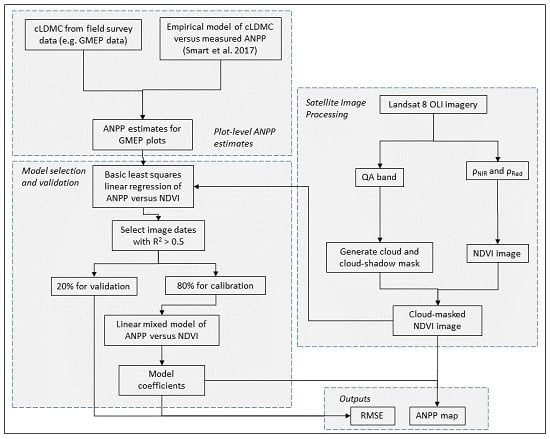
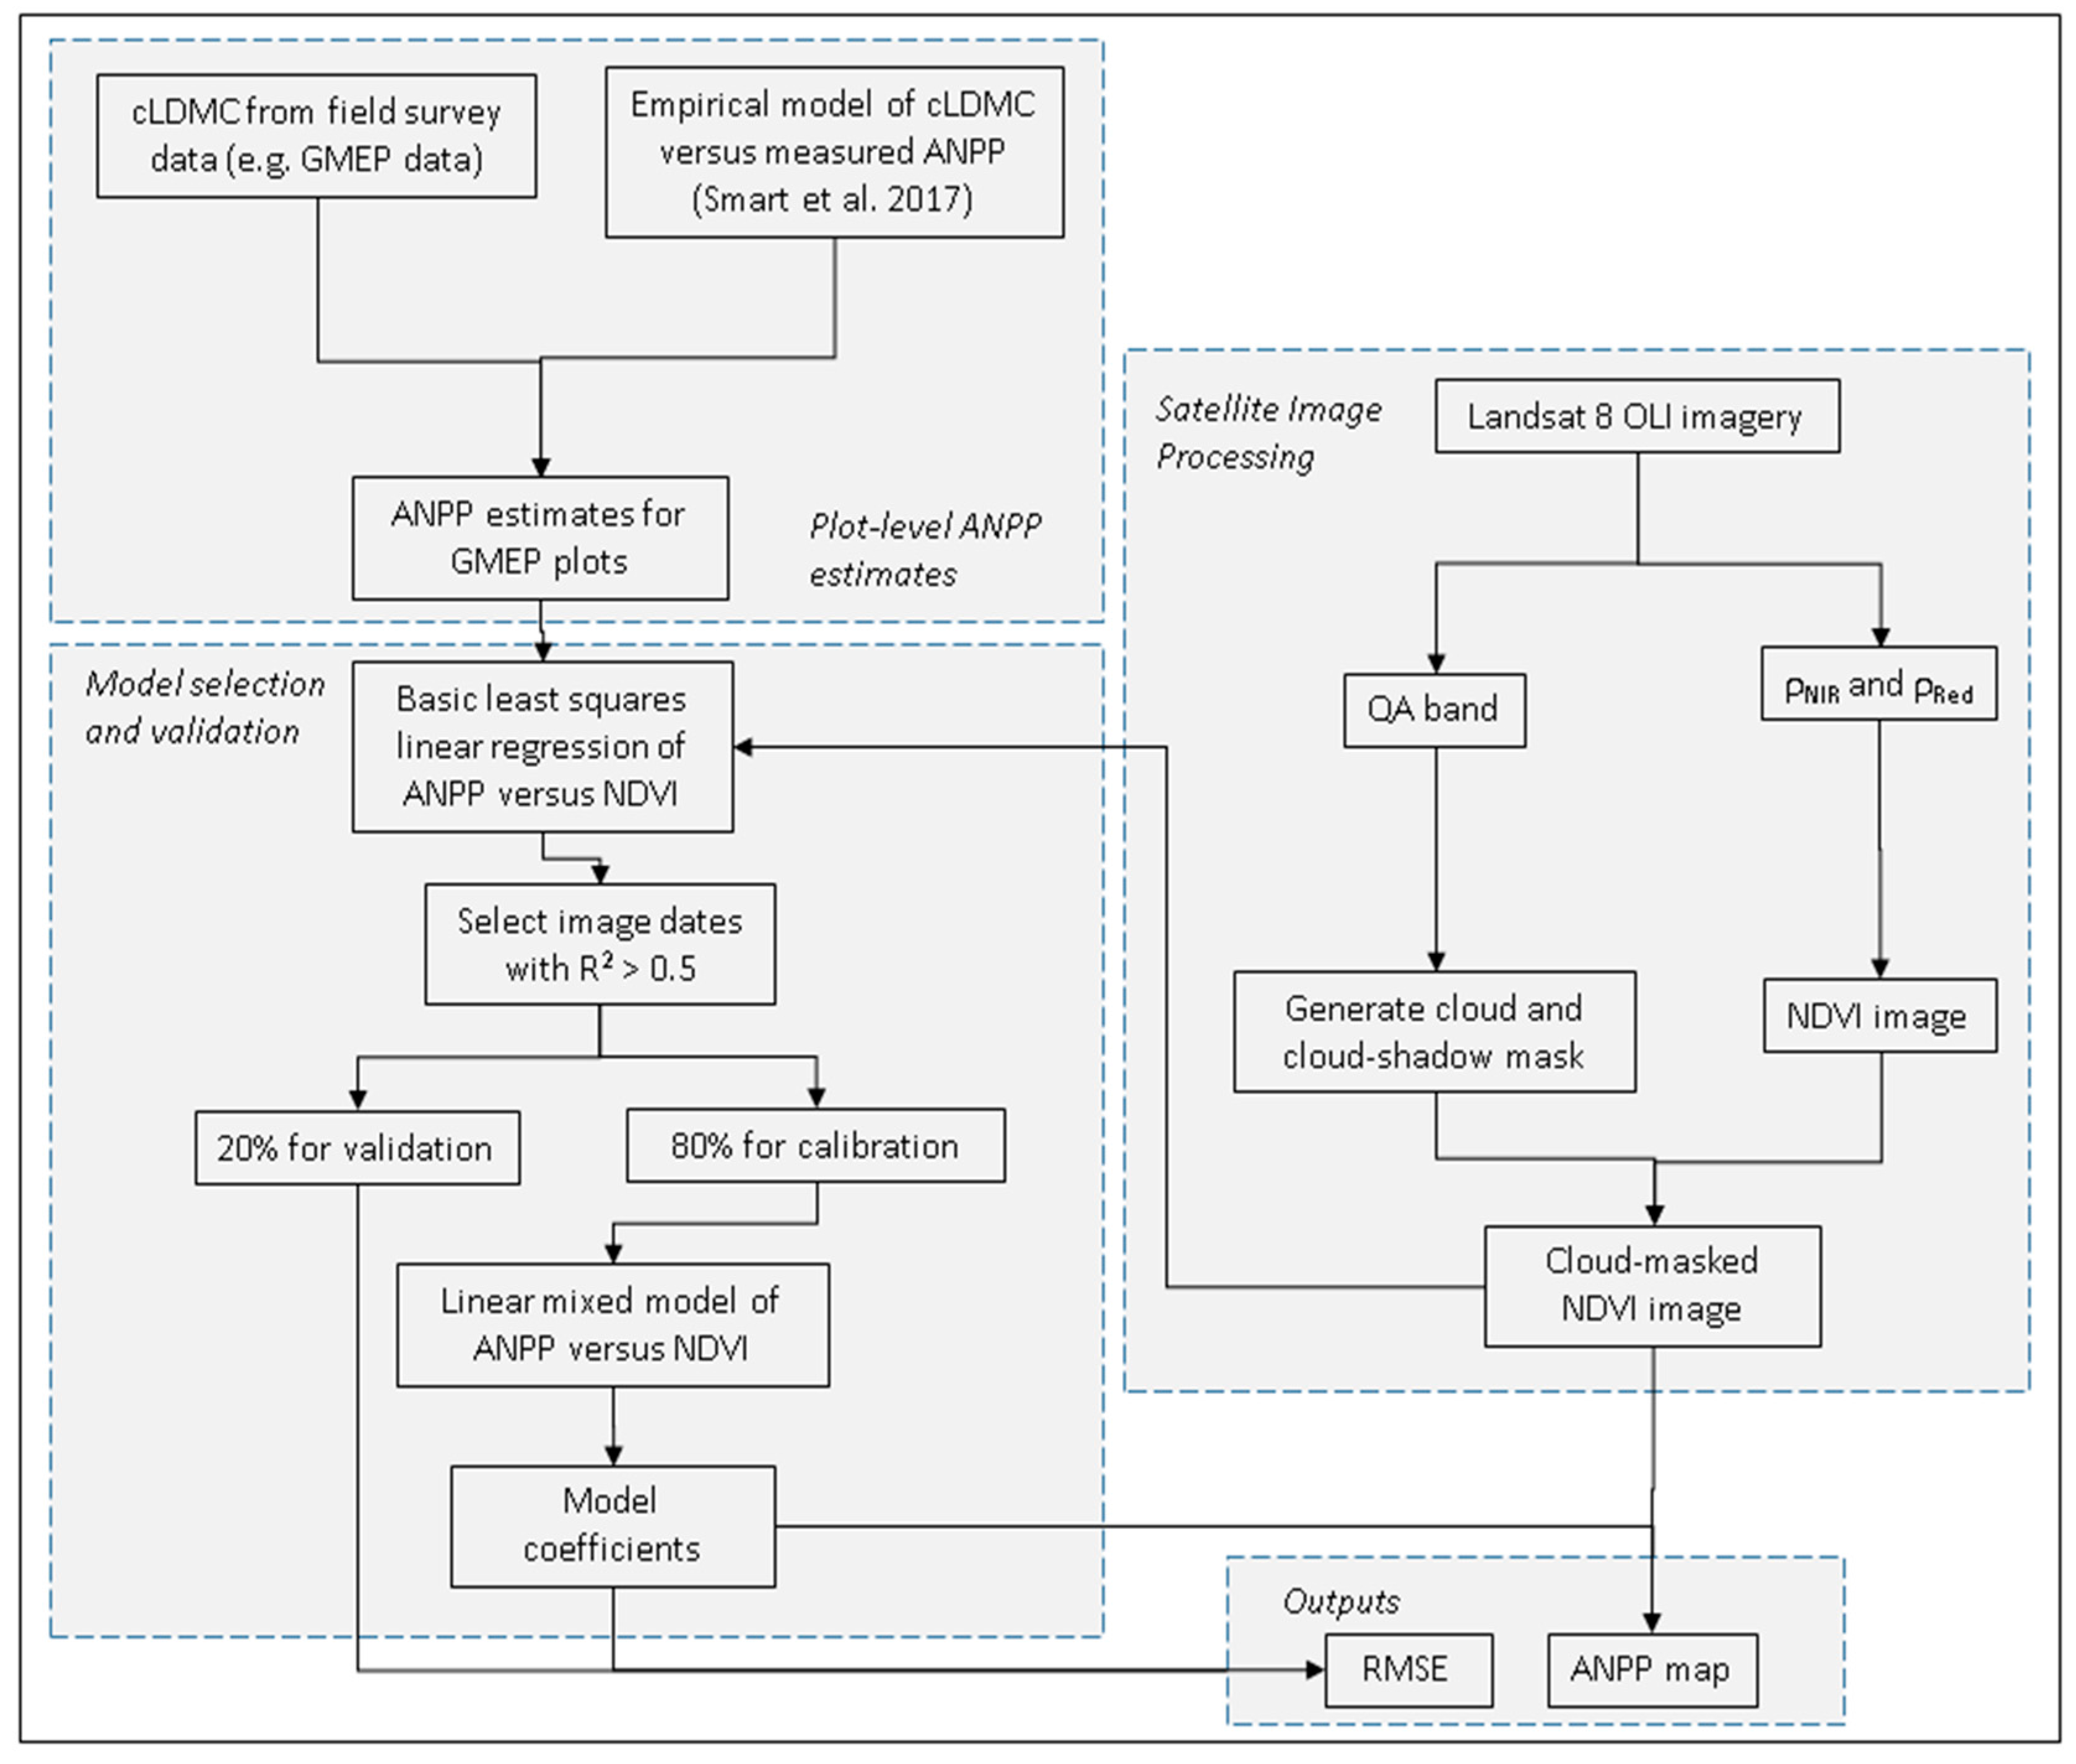
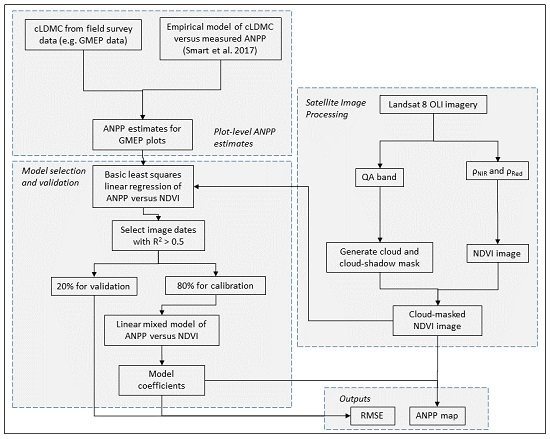
2.4. Methodological Framework

The overall approach was to use ANPP values derived from field survey data in combination with single-date NDVI imagery to derive a relationship between ANPP and NDVI, which could then be used to extrapolate beyond the survey squares to produce a map of ANPP for Wales. Frequent cloud cover over Wales severely limited the number of cloud free observations and necessitated the use of single-date NDVI imagery rather than annually integrated NDVI. Therefore, the first step was to investigate the time dependence of the relationship between single-date NDVI and ANPP. The methodological framework developed here can be seen in Figure 2.

2.5. Model Selection

The modelling was approached in two stages: First, least squares linear regression was used to investigate the strength and form of the image-specific relationship between NDVI and ANPP. This was initially done for all habitat types and then for just grassland habitats, as these were expected to give the strongest relationships. The image dates that gave a coefficient of determination, R2, greater than 0.5 were selected for further analysis. Second, a linear mixed model, including a random effect to account for the clustering of the plots within the survey squares, was used to determine the relationship between ANPP and NDVI for each image. This model was derived using 80% of the available data, with the remaining 20% being reserved for validation and uncertainty estimation. The number of field plots/pixels used to derive the relationships varied depending on the image, as shown in the Results Section. The derived relationships were applied to the NDVI imagery to produce maps of ANPP for Wales. Land Cover Map 2007 [6] was used to mask all arable, inland water, urban and coastal areas from the resulting map.

2.6. Model Validation and Uncertainty Estimation

The derived models were applied to the validation datasets and the root-mean-square error (RMSE) between NDVI-based ANPP estimates and cLDMC-based ANPP was calculated in each case. The derived RMSE value was then used as an estimate of the image-specific uncertainty in ANPP measurements.

3. Results

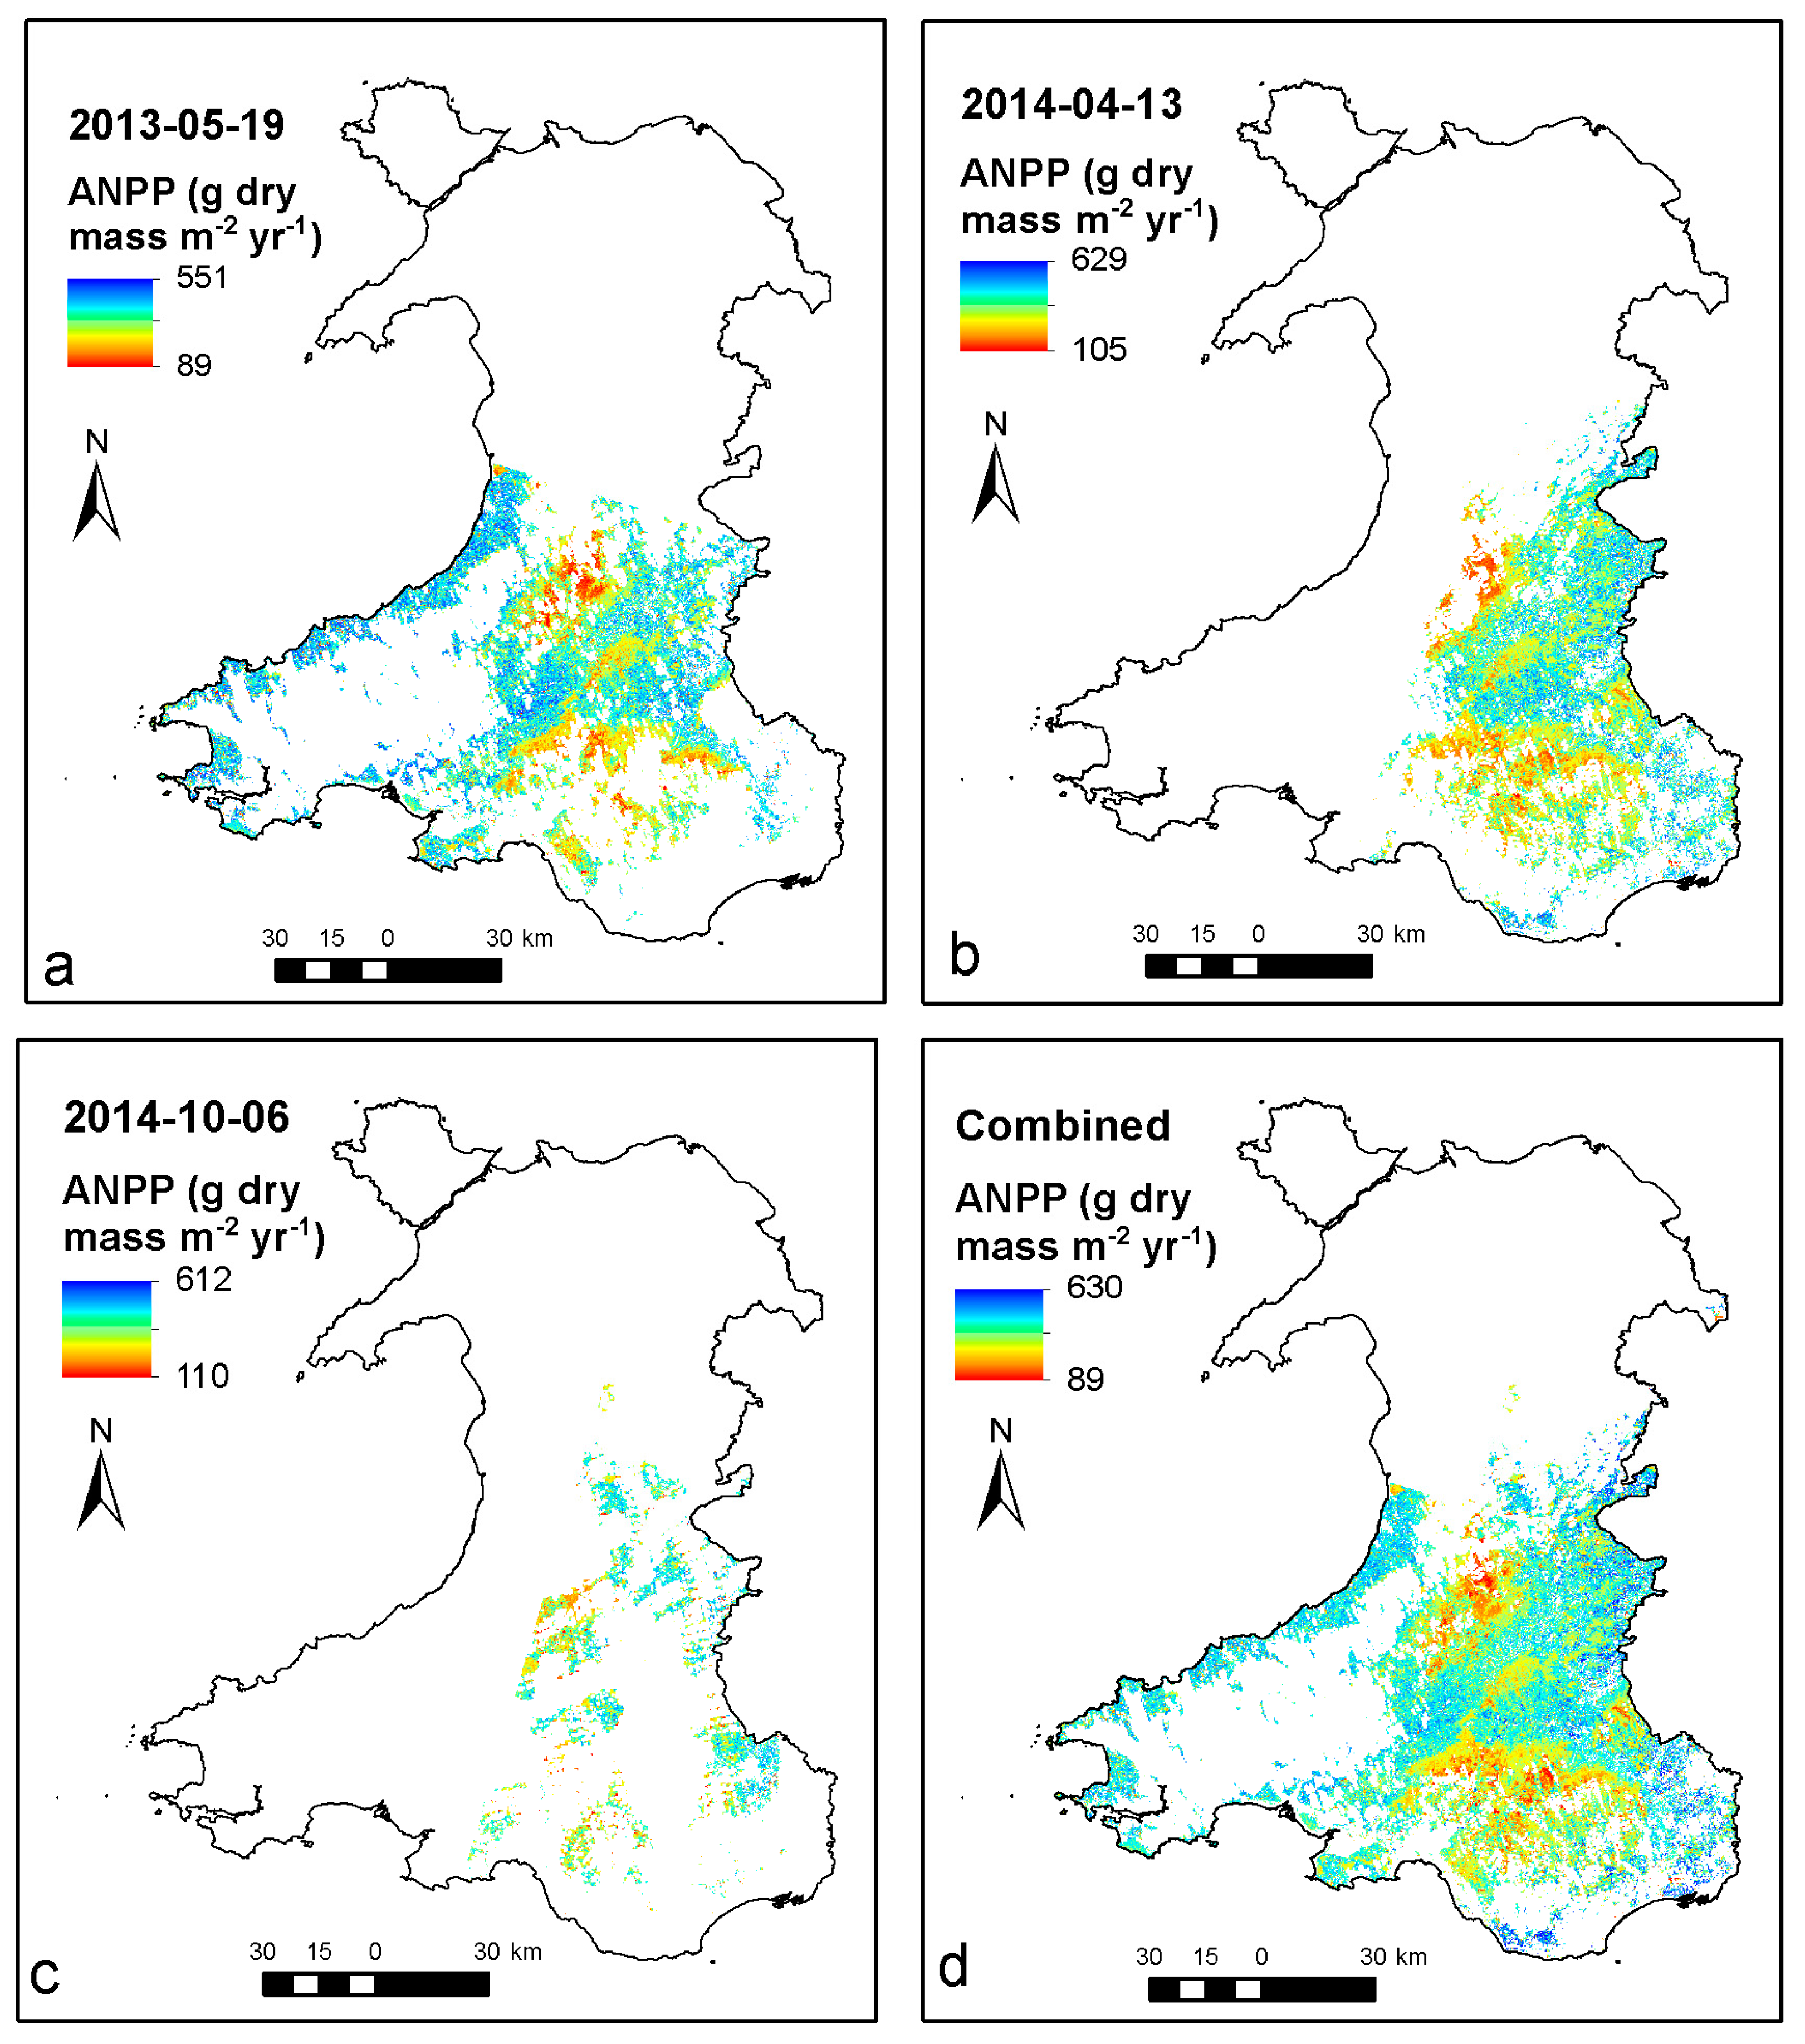
3.1. Mean ANPP Values across Wales

Table 2 summarises the mean ANPP values, estimated from GMEP cLDMC, across Wales for the broad habitats that were used in this study.

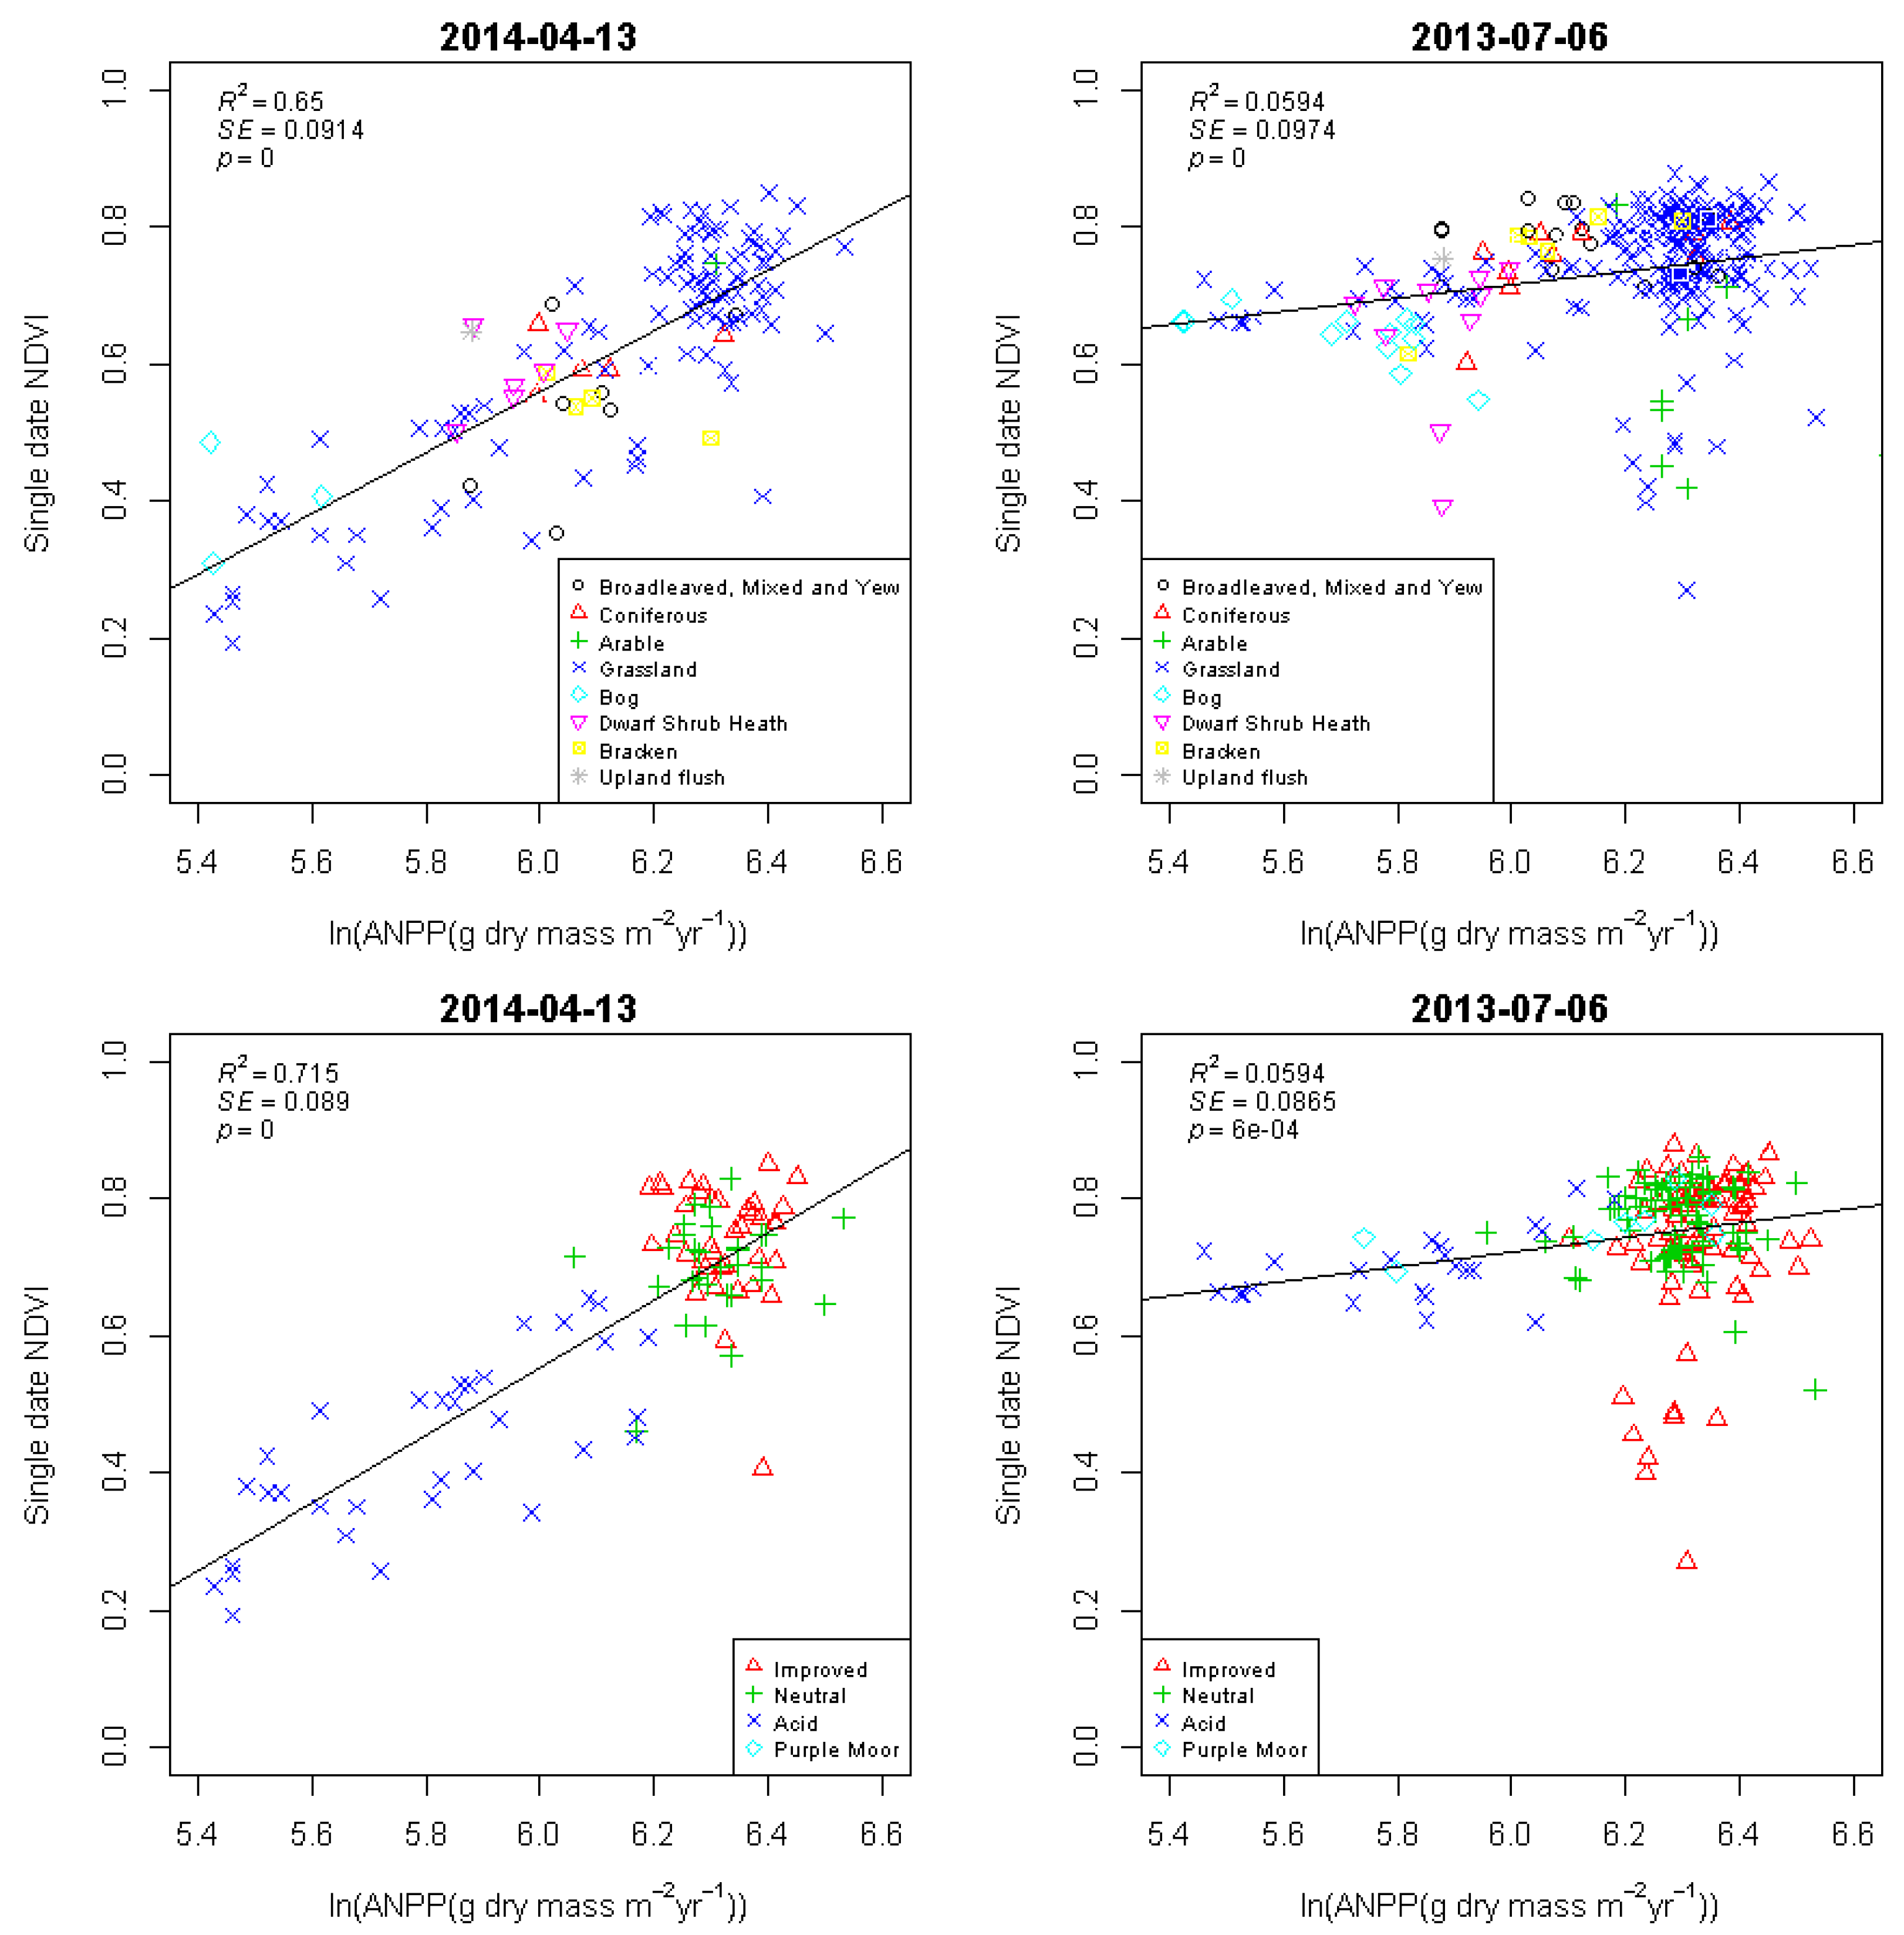
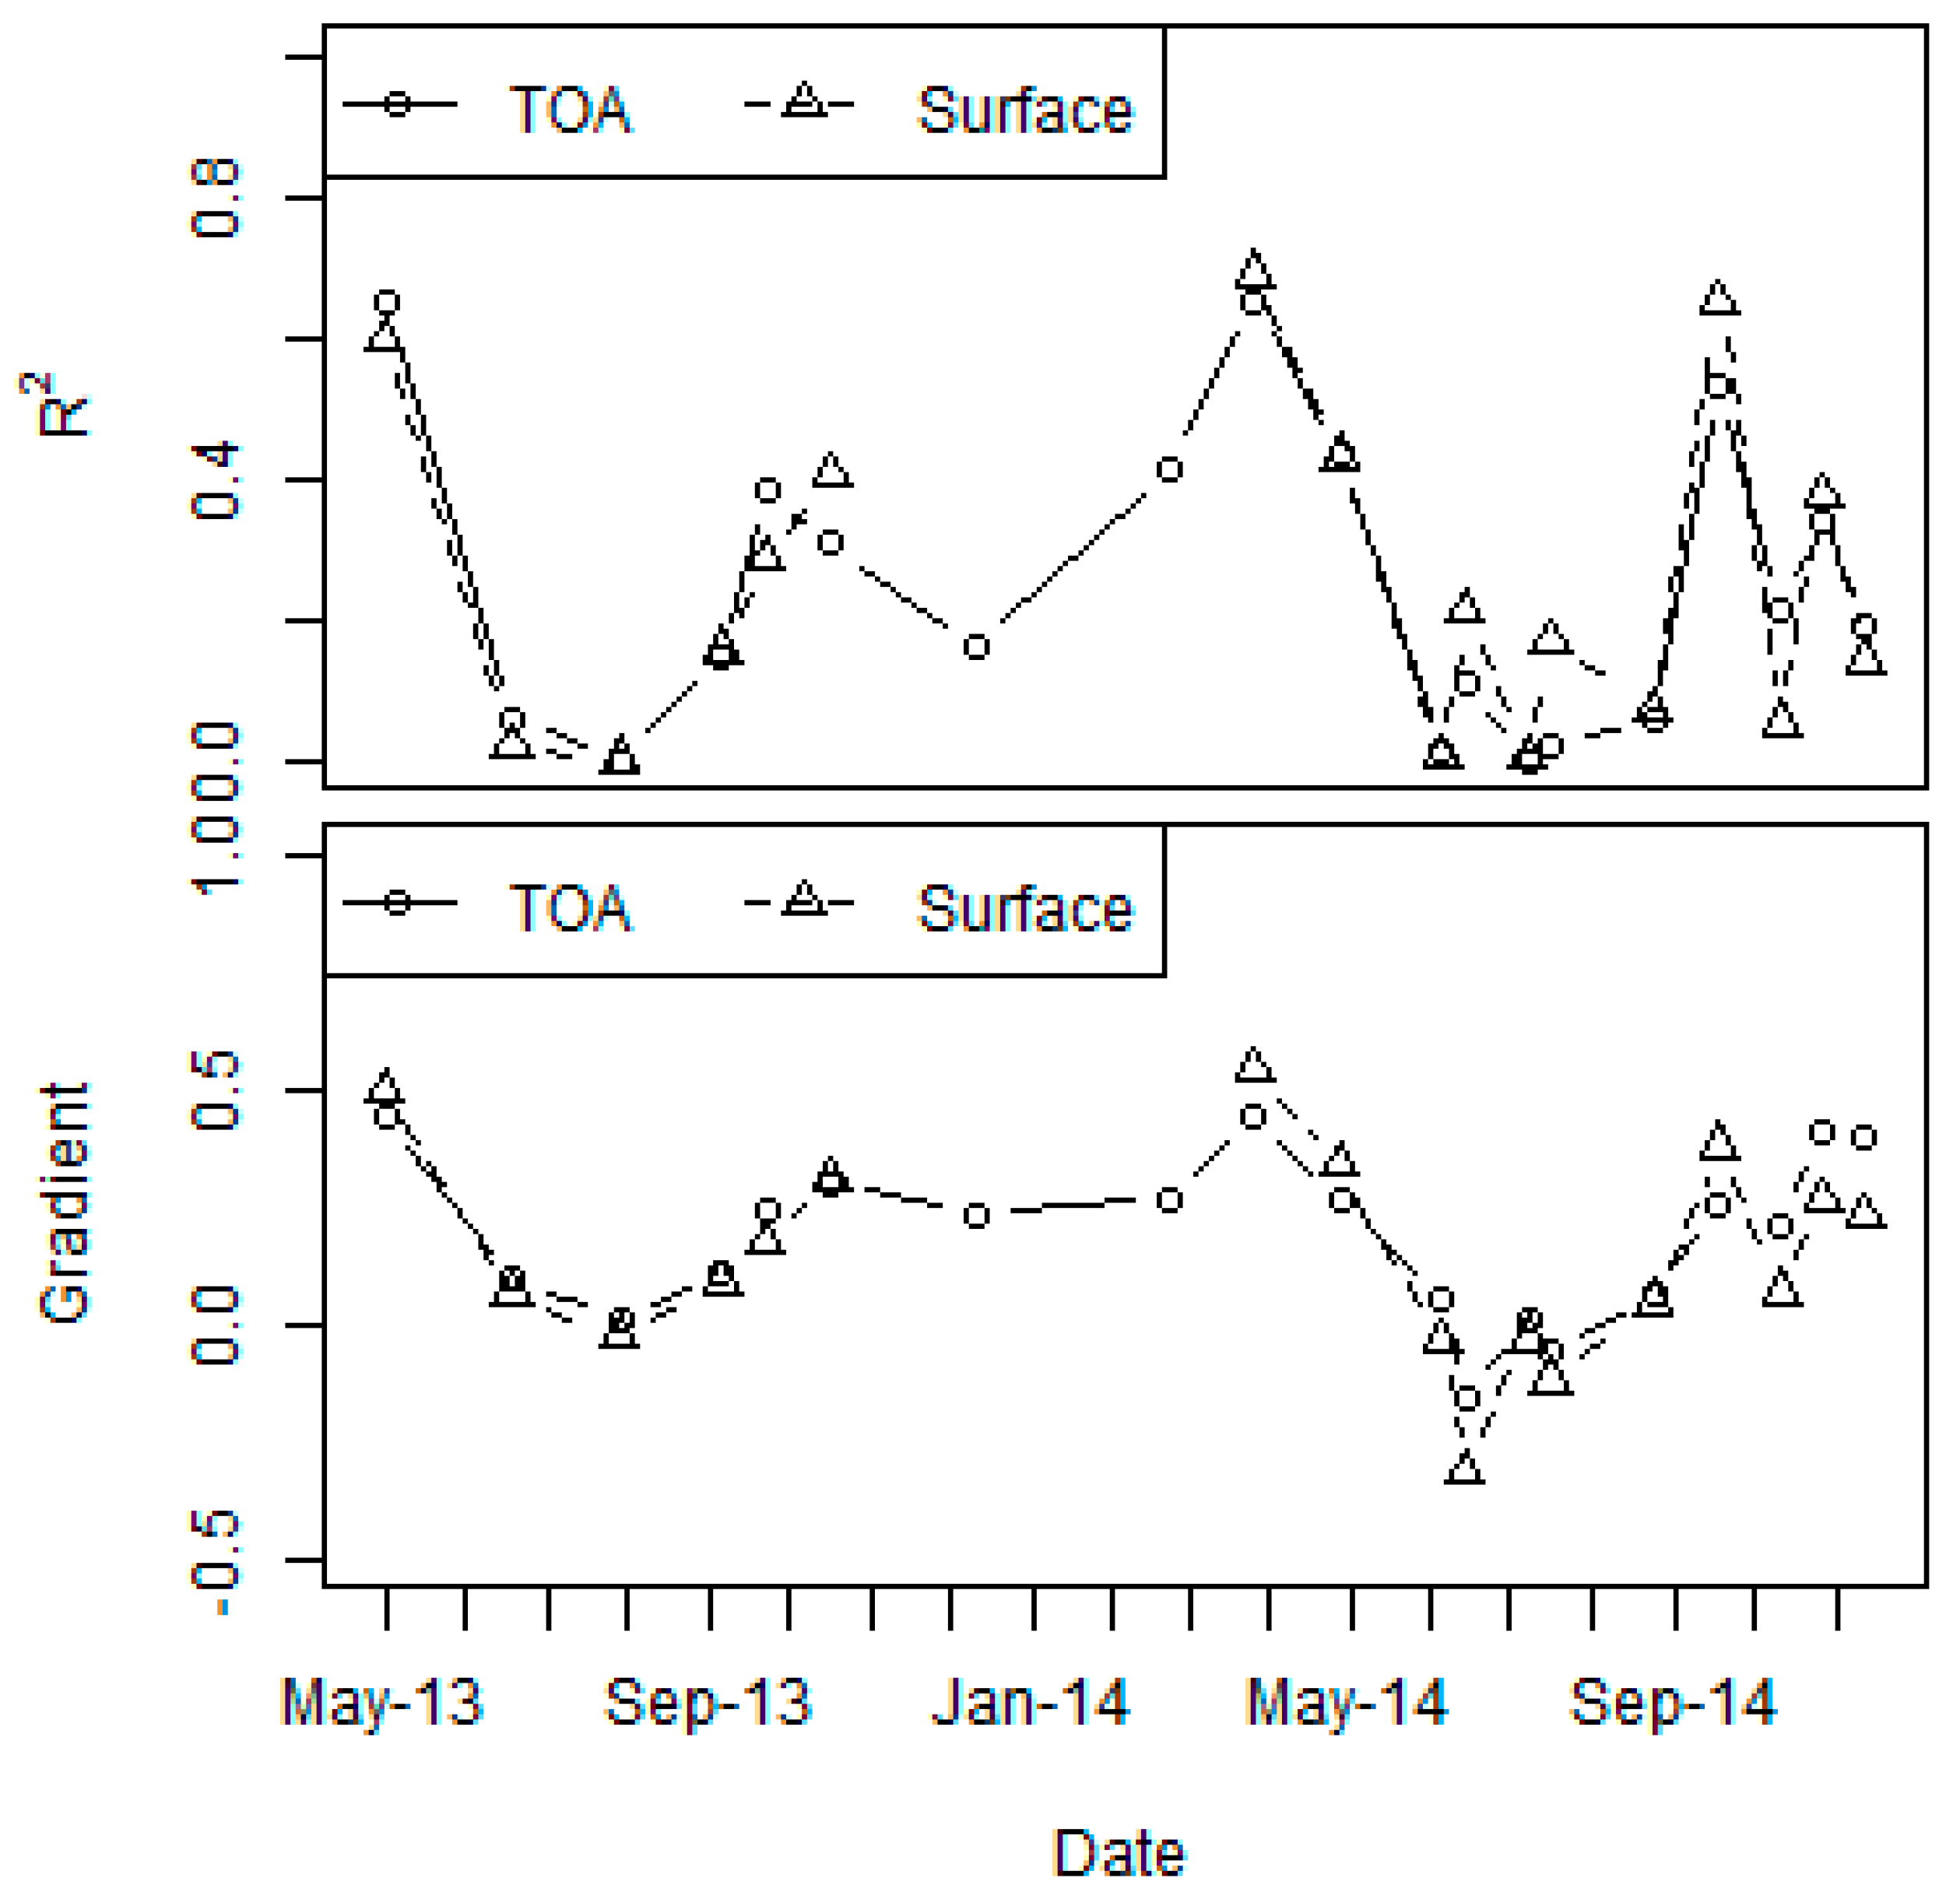
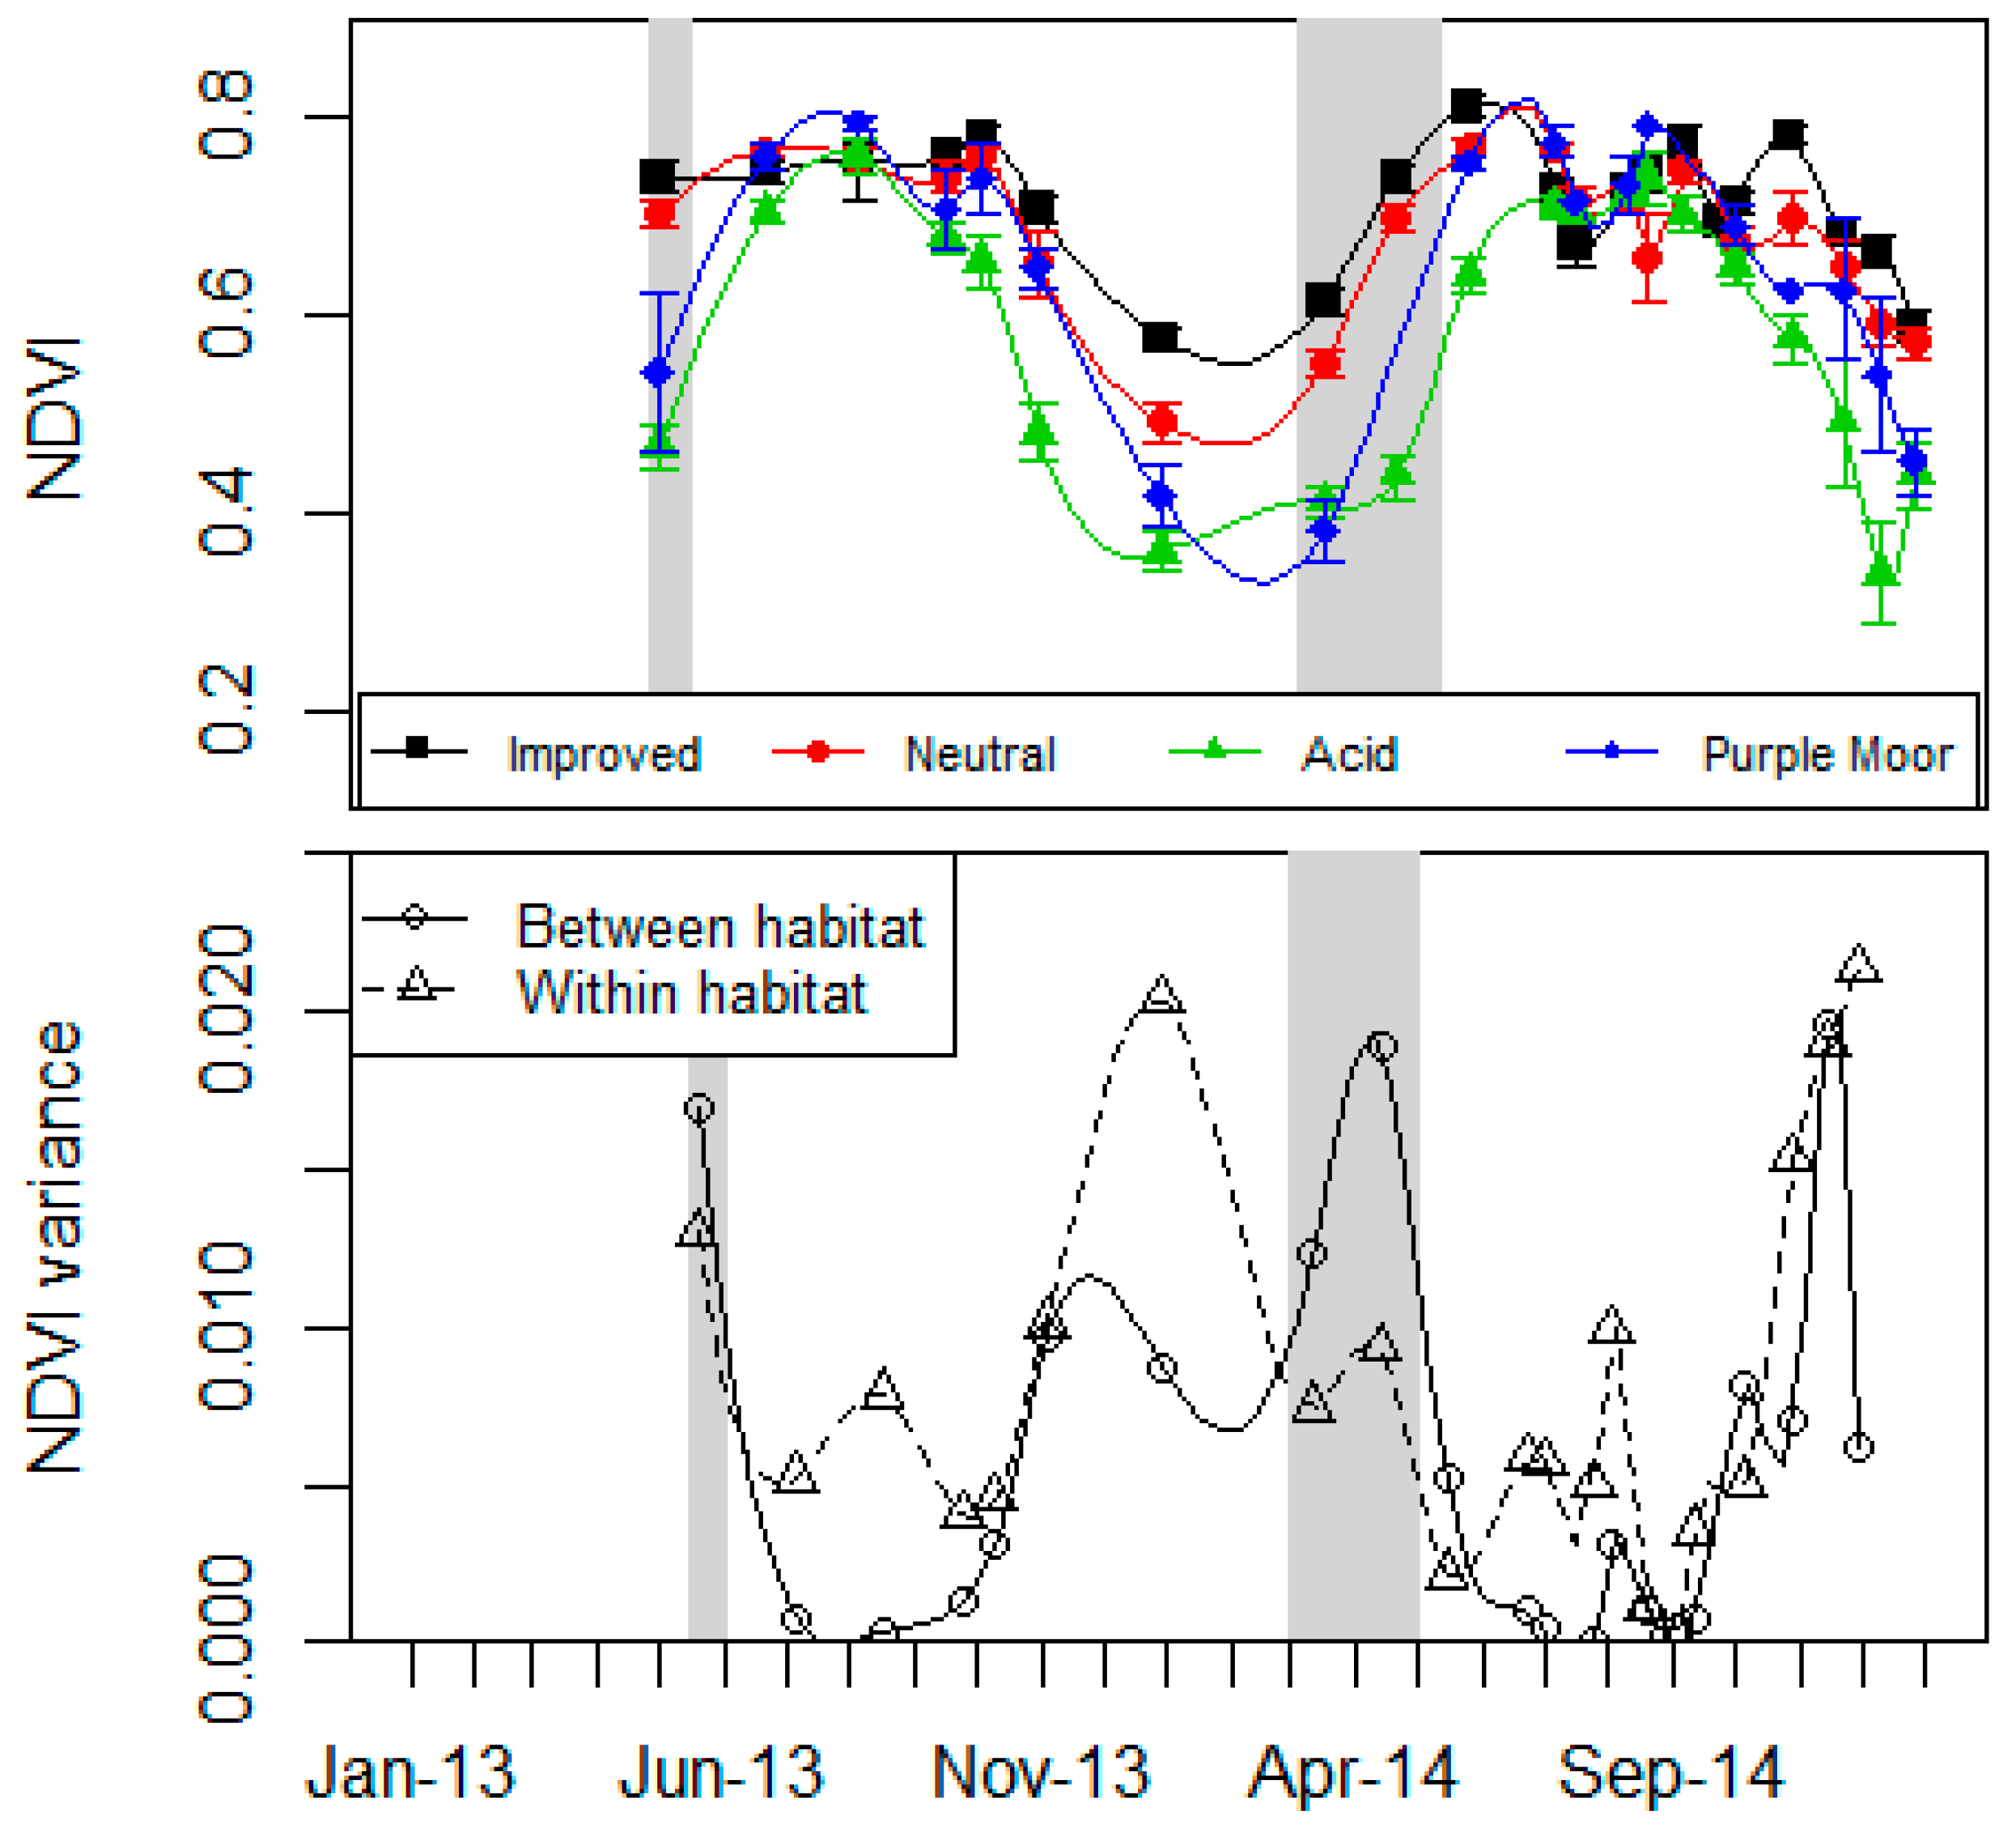
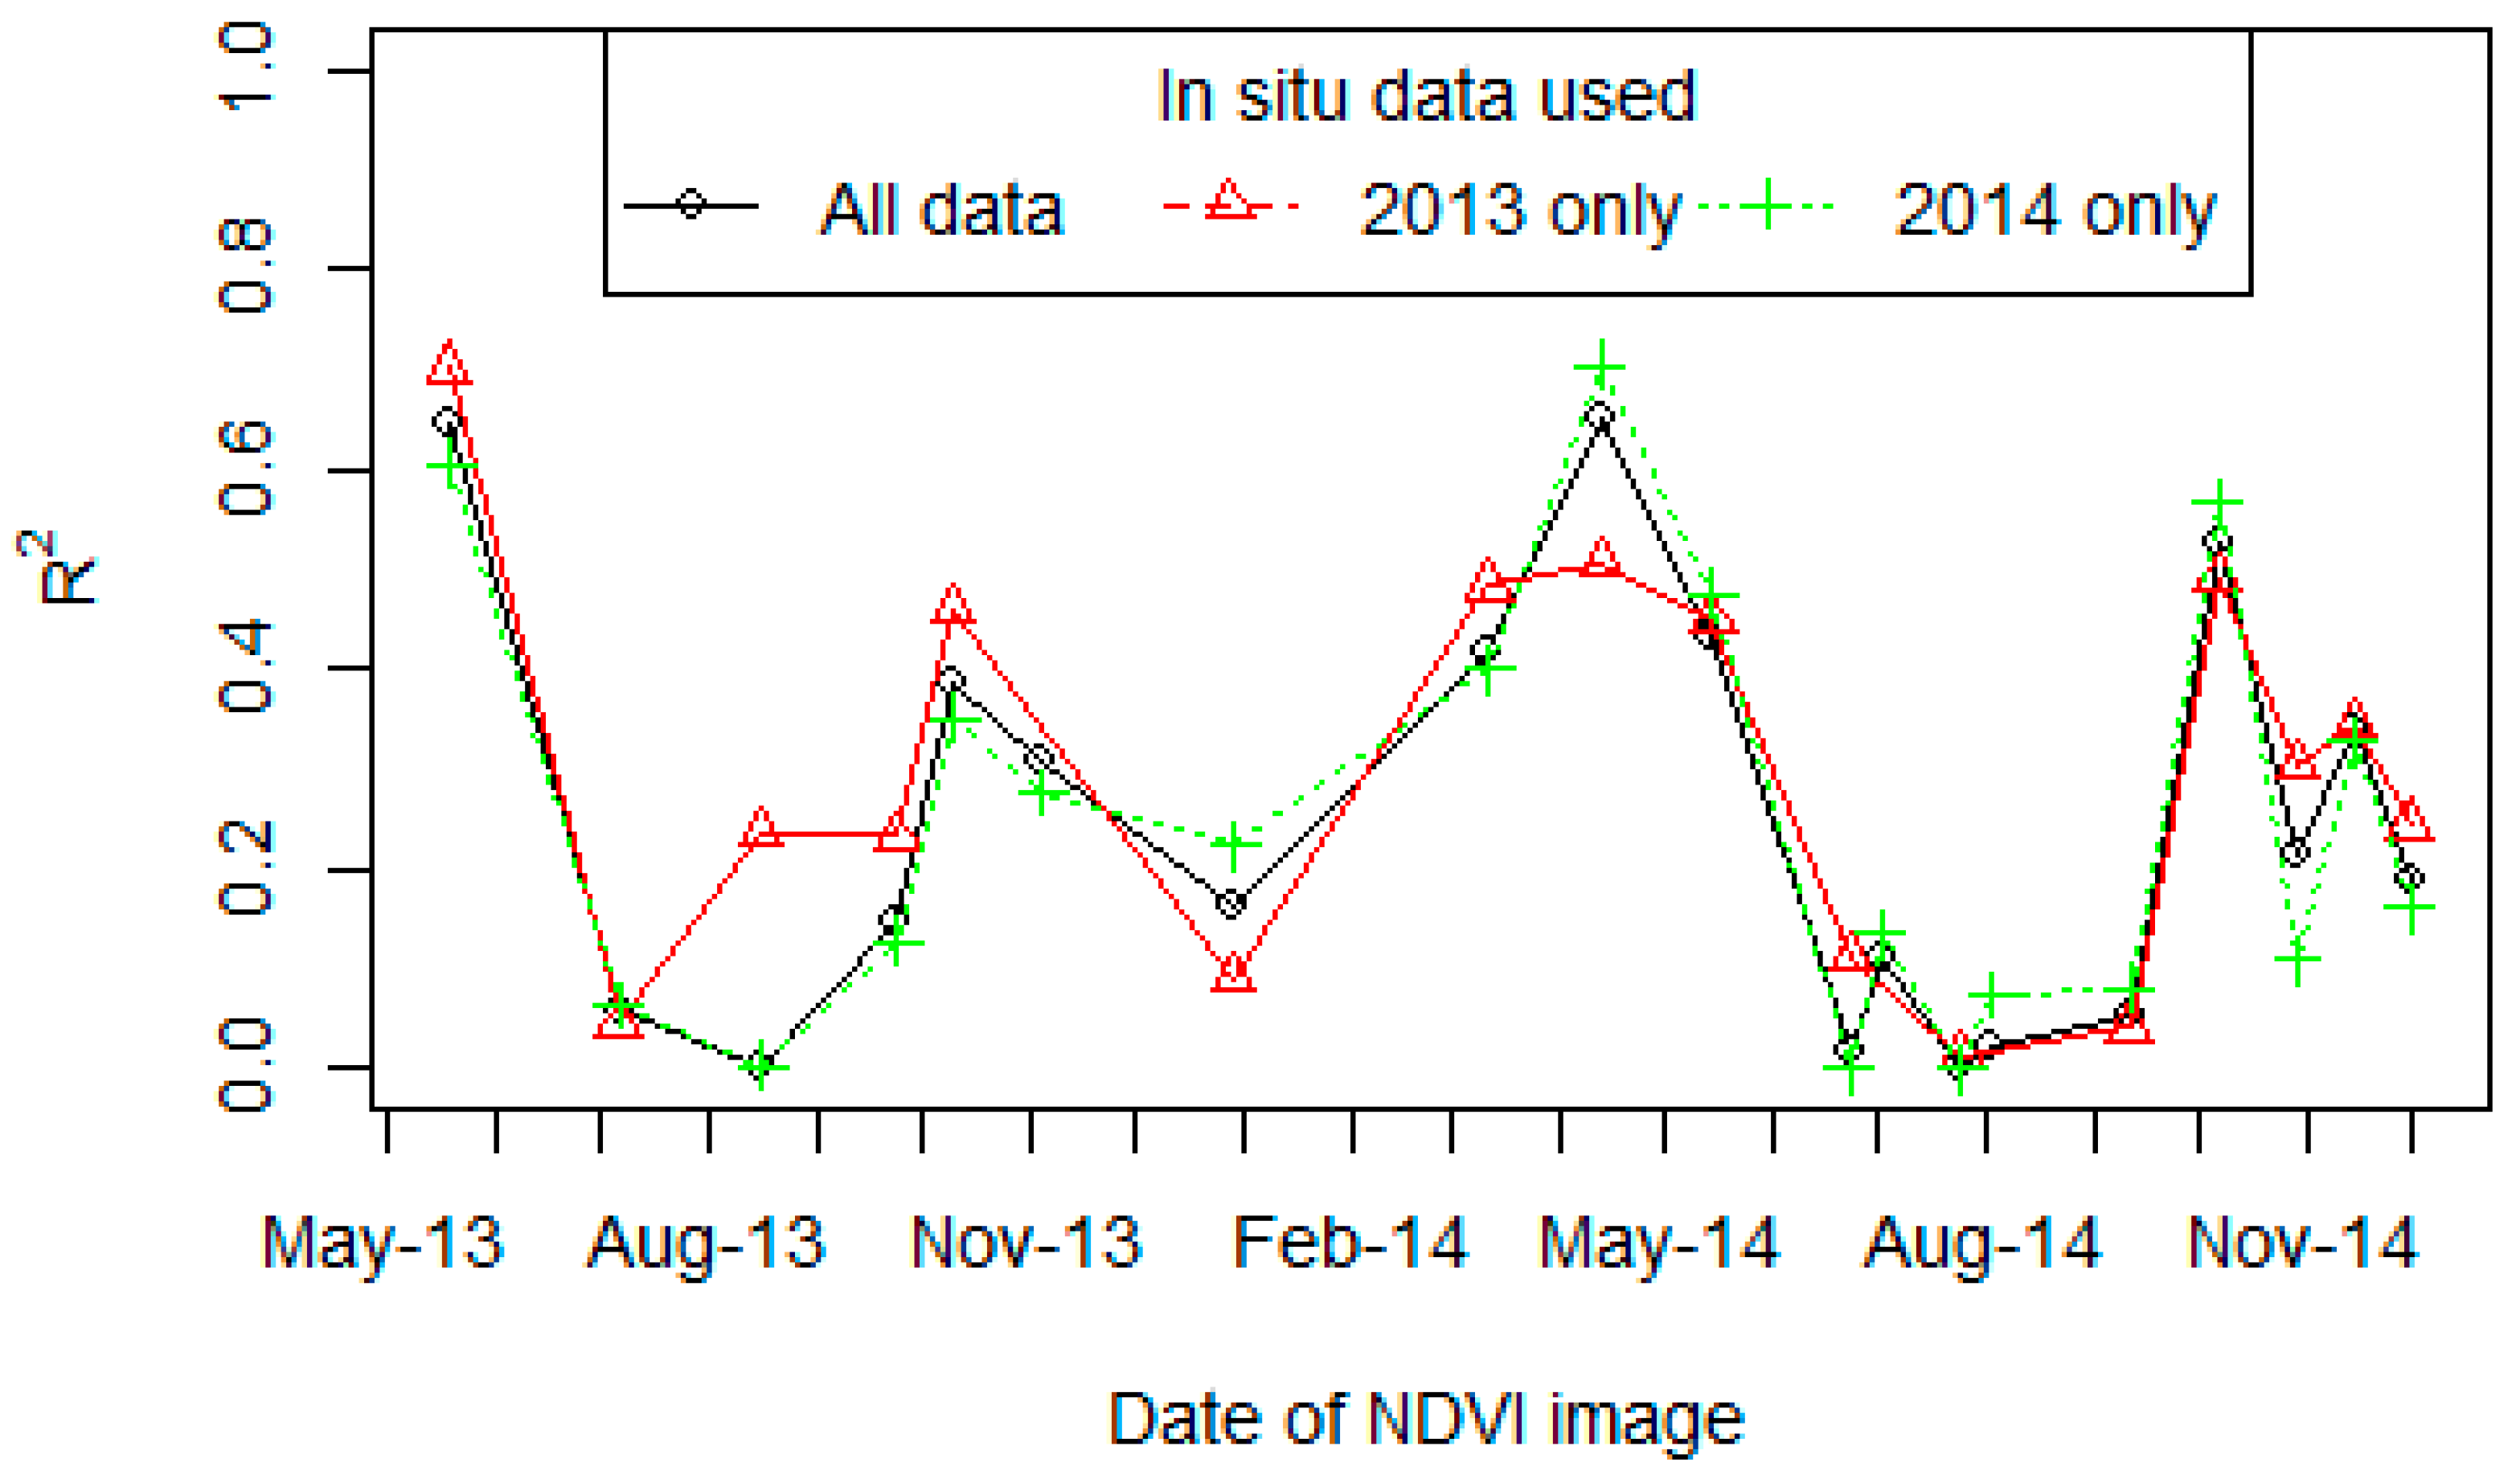
3.2. Seasonal Dependence of the Relationship between NDVI and ANPP

In order to use NDVI as a predictor of ANPP, it was first necessary to investigate the form and strength of the relationship between Landsat 8 single-date NDVI and in situ ANPP. The relationship for all habitats showed a strong seasonal dependence, with the strongest relationship in the spring and autumn, while in the summer and winter months, the correlation was very weak (Figure 3). When only grassland habitats were considered, the R2 values were higher and there was less scatter in the relationship. A similar seasonal dependence was observed, with the strongest relationship occurring in the spring and the weakest in summer and winter (Figure 3). The weak relationship between NDVI and ln(ANPP) in the July images (Figure 3) is consistent with saturation. Saturation occurs when changes in the variable of interest (in this case ln(ANPP)) no longer result in obvious changes to the variable being observed (in this case single-date NDVI).
Variation in the slope and the R2 value for the relationship between NDVI and ANPP is shown in Figure 4. This analysis was done for both TOA NDVI and surface NDVI and the results showed very little difference in the strength and form of the relationship between NDVI and ANPP (Figure 4; Table 3). This suggests that using the Landsat 8 surface reflectance product did not have a significant effect on the uncertainty of the NDVI values. Hence, the rest of the analysis uses TOA values.
The strong correlations observed for spring images were due to differences in the “greening up” times of the different plots, i.e., the more productive habitats greened up earlier in the year than less productive ones. This can be seen in Figure 5, which shows the time series of NDVI for different grassland habitats. Sites with higher productivity had higher NDVI values during the green-up period (MarchMay) than lower productivity sites. Similarly, in the autumn, the highly productive habitats continued to be photosynthetically active later into the season than the lower productivity grasslands. In the summer images all grasslands reached a similar level of “greenness” and, hence, there was little variation in NDVI across the productivity gradient resulting in low correlations between NDVI and ANPP. The bottom panel of Figure 5 shows the within-habitat and between-habitat variance for grasslands. It also shows the optimum time window for relating NDVI to vegetation productivity (grey shaded areas), which occurs when there is high between habitat and low within habitat variability. The saturation effect observed in the summer images in Figure 3 is apparent in Figure 4 as low gradient and low R2 values, and in Figure 5 as a low between habitat variance. For the time period observed in this study, the optimum window occurred in the months MarchMay. Phenological differences between different years will shift the exact timing of the optimum period. The regression relationships between NDVI and NPP are image-specific and the strength of these relationships will vary considerably between years depending on the availability of suitable data, as demonstrated by the variability in R2 shown in Figure 4.

3.3. Temporal Matching between the In Situ Data and Satellite Imagery

To investigate the impact of timing of field data collection on the strength of the derived relationships, regression analysis was performed using different sets of in situ data; including “all data”, “data from 2013 only” and “data from 2014 only”. The highest R2 values were obtained when the in situ data and the satellite image came from the same year (Figure 6; Table 3). In situ data and satellite data from the same year are used in all subsequent analysis, except where otherwise stated.

3.4. Models for Predicting ANPP from NDVI Imagery

For all images which had a simple linear regression R2 > 0.5 (Table 4), the relationship between ln(ANPP) and NDVI was derived using a linear mixed model, for predicting ANPP outside the field survey plots from NDVI imagery. The model included a random effect to account for the clustering of the plots within the survey squares. The form of the model was:
ln(ANPP) = m × NDVIL8 TOA + c,
where NDVIL8 TOA is the NDVI value calculated from Landsat 8 top-of-atmosphere reflectance, and m and c are the model coefficients, which are given in Table 5.
Figure 7 shows the ANPP maps produced by applying the derived models to the NDVI imagery. Since the NDVI–ANPP relationships are image-date specific, different model coefficients were applied depending on the date the image was captured, as shown in Table 5. These maps illustrate the problem of cloud cover, as large portions of the image were obscured by cloud.

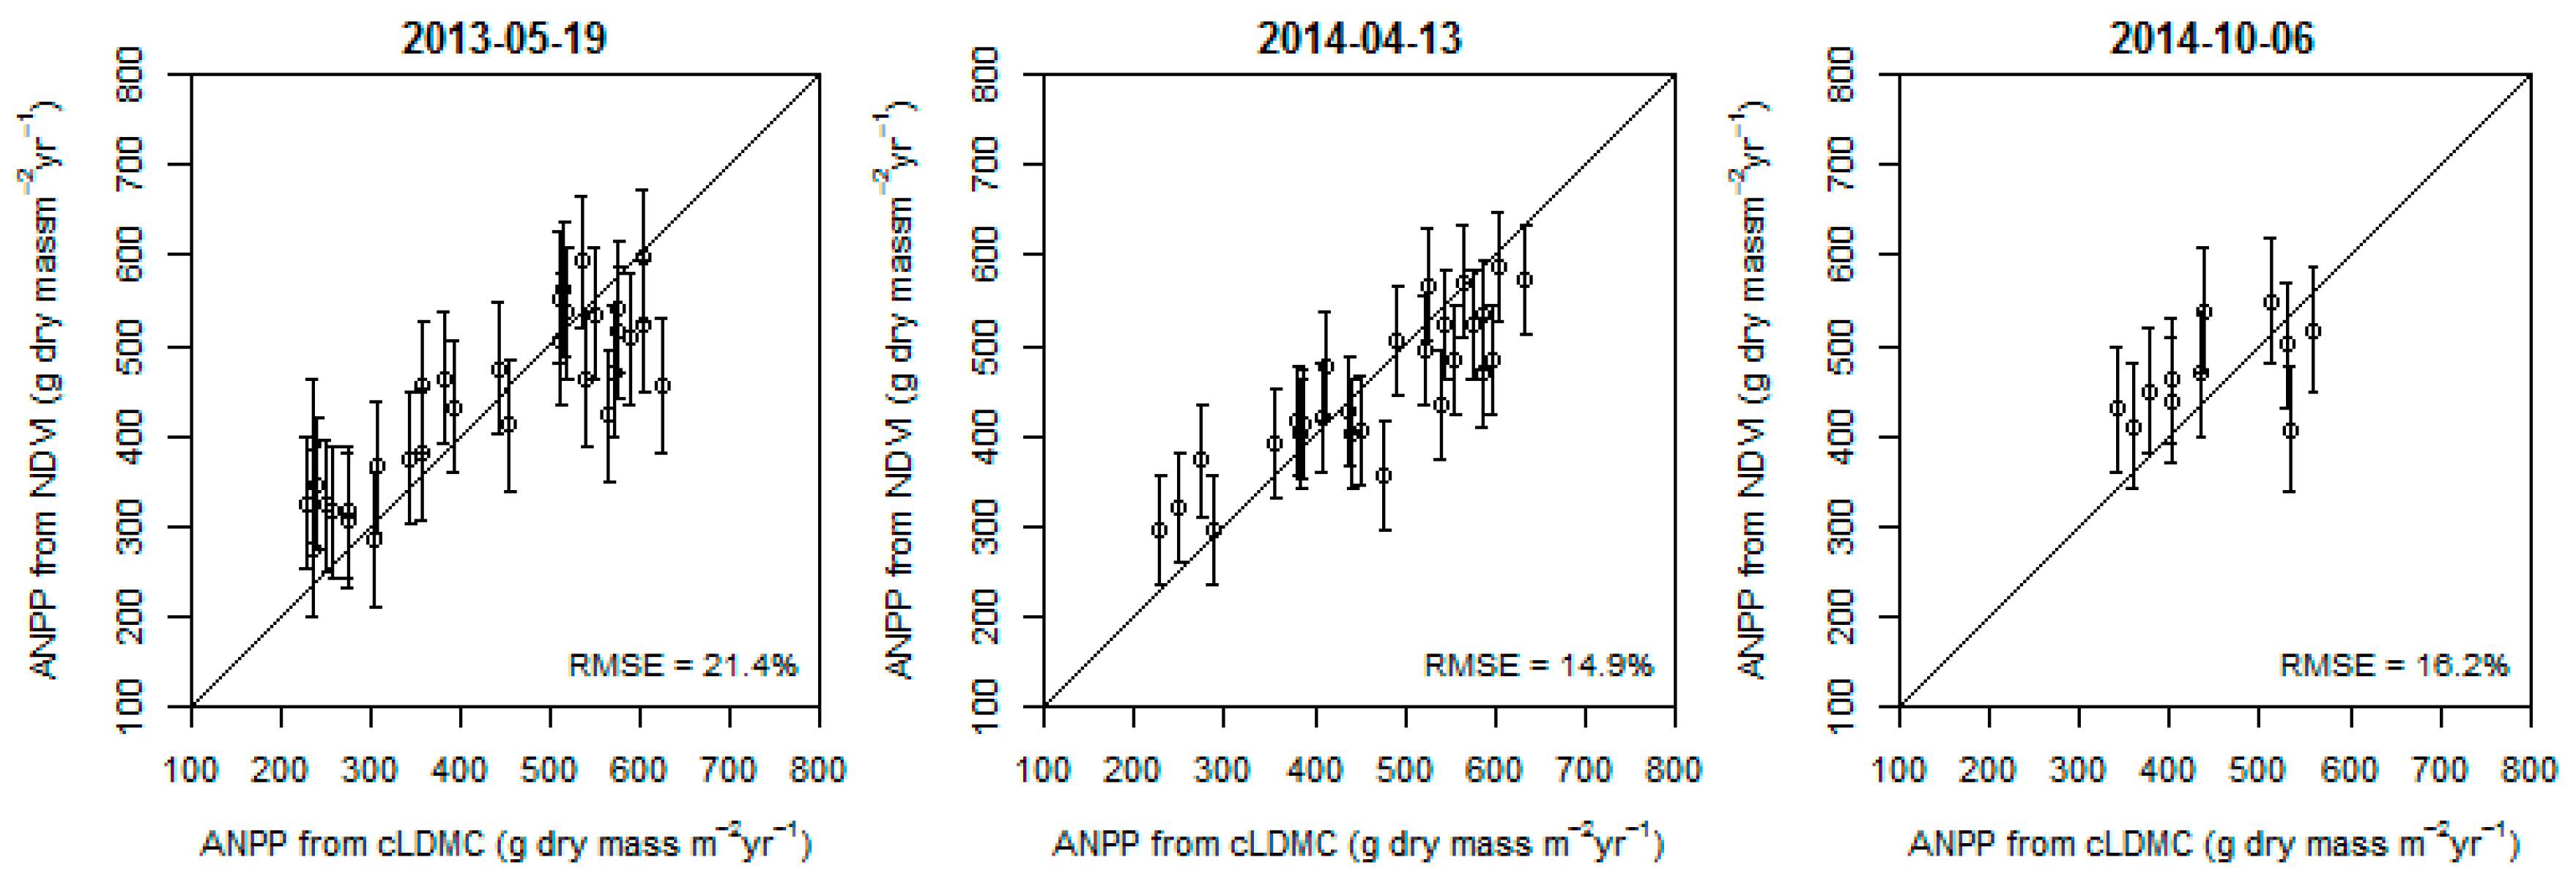
3.5. Accuracy Assessment and Validation

Figure 8 shows validation results for the three models summarised in Table 5, which was carried out by applying the model coefficients to the 20% reserved dataset and comparing the cLDMC based model estimate of ANPP at each plot against the Landsat NDVI based estimate. For the two spring images, the RMSE was less than 20% while the autumn 2014 image had a slightly higher RMSE (21.6%).

3.6. What Is Possible with Cloud-Free Imagery

In cloudy regions, the best imagery for some years will still contain some cloud, especially since imagery is required for a narrow window during the green up period in order to produce a strong relationship. This was the case for Landsat 8 in 2013 and 2014 which meant that the resulting ANPP maps included gaps due to cloud cover. To illustrate what is possible under ideal conditions, two cloud-free Landsat 5 images acquired on 28 April 2011 covering most of Wales were downloaded (Figure 9). The images gave an R2 of 0.507 and exhibited more scatter than previous relationships, which is probably a consequence of using Landsat-5 and the time lag between the in situ data collection and the satellite imagery. However, the relationship was still significant and had the form:
ln(ANPP) = 0.888 × NDVILT5 + 5.50,

4. Discussion

4.1. General Experimental Framework

This work is important because we present a general method for mapping ANPP from field data and satellite data, which can be adapted to many parts of the world. The general experimental framework we propose (which has been explored here) is outlined schematically in Figure 2, and involves the following steps:
  • Collect field data for ANPP across a productivity gradient for the habitats in question (future work will explore the use of the satellite data for targeting field work).
  • Acquire and pre-process satellite NDVI data.
  • Search through available satellite data to identify the image which gives the best relationship with ANPP (highest R2).
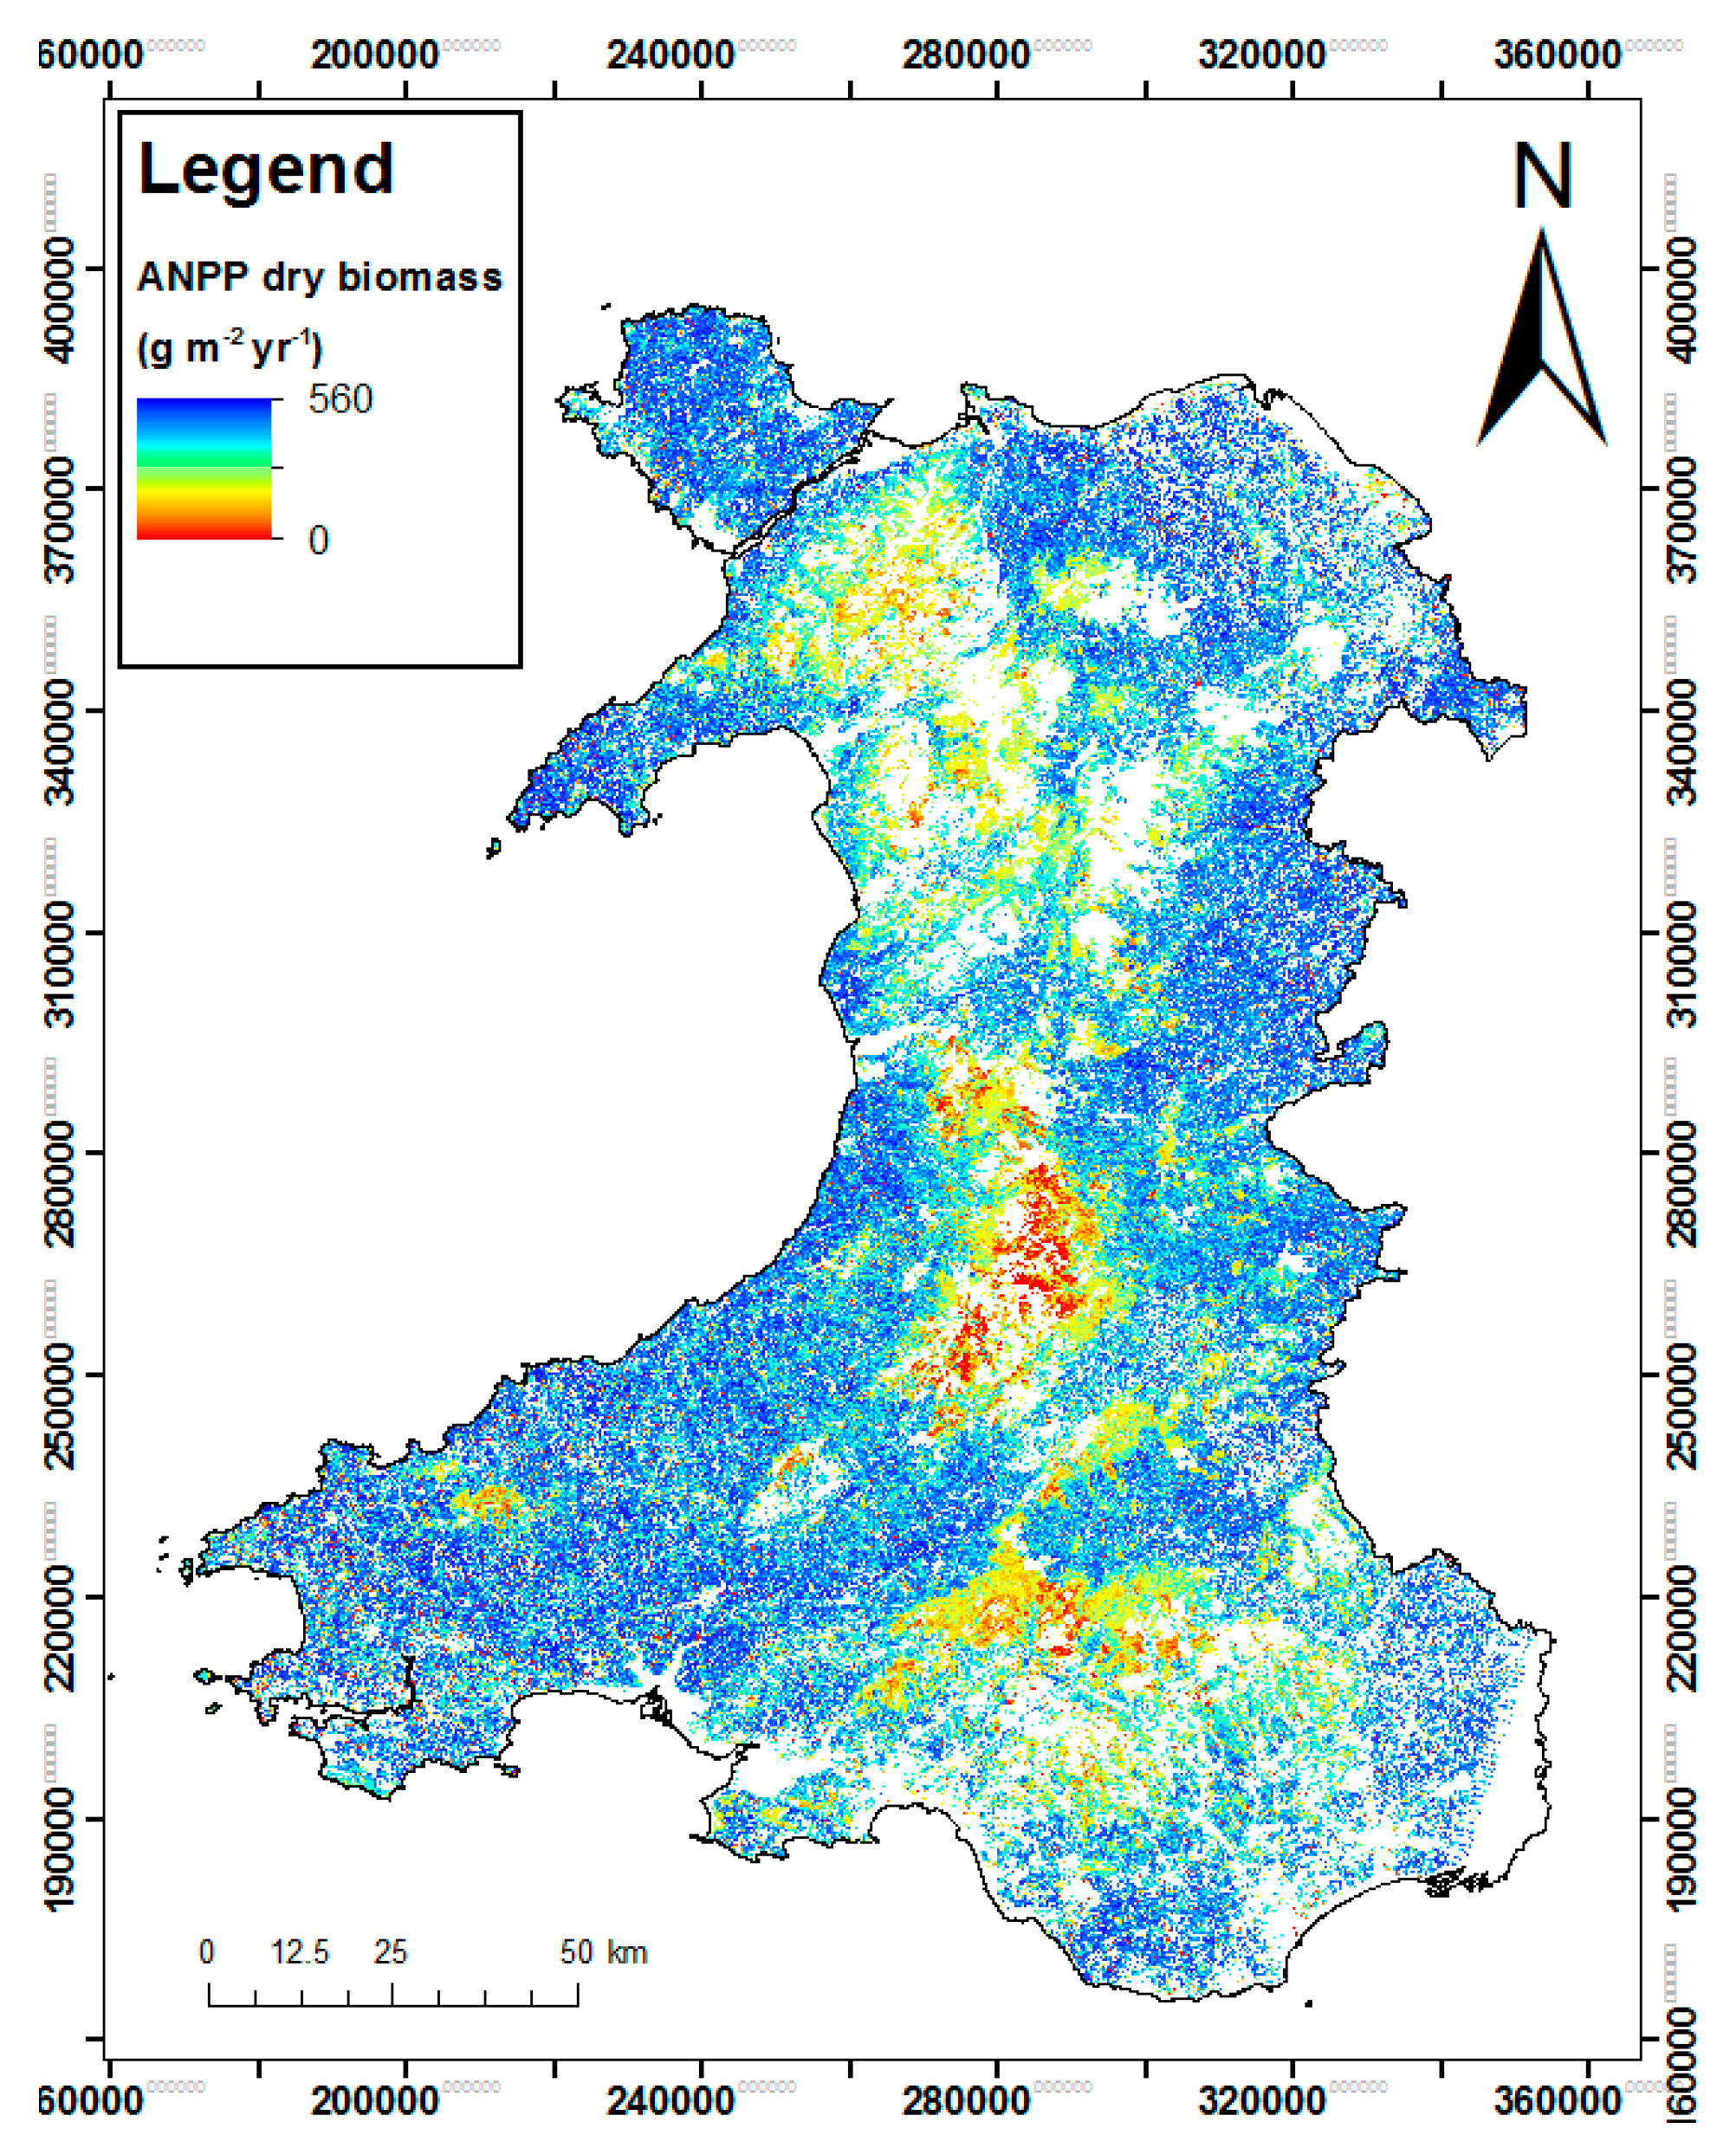
  • Apply the best model to NDVI imagery to map ANPP outside the field survey plots.
  • Evaluate the derived model using a reserved validation dataset to calculate the image-specific uncertainty (RMSE) in ANPP estimates.
This paper examined the relationship between ANPP and NDVI for a wide range of habitats (one of the few papers to do so). Our results showed that it was possible to derive a strong NDVI–ANPP relationship across a wide range of temperate habitats (R2 = 0.706); however, the method has most potential for grassland habitats (R2 = 0.833, Figure 3). Temperate grasslands are particularly well suited to estimation of ANPP from NDVI because canopy development and photosynthetic activity are in synchrony [18]. Although arable habitats were included in the analysis, and overall followed the same general patterns as other habitat types, the methodology presented here is not suitable for estimating the productivity of arable land, as this would require annually-integrated NDVI over the growing season. Moreover, there is evidence to suggest that the leaf trait variation in crop species that have been subjected to selective breeding can deviate substantially from wild species [29], which could result in less reliable trait versus productivity relationships.
The framework developed here offers a number of advantages over existing approaches. For example, most current remotely-sensed NPP products use low resolution satellite imagery (e.g., MODIS [13]) and hence do not capture variability at the field scale. Some previous studies have used higher resolution sensors for mapping NPP (e.g., Landsat ETM+ for maize crops [15]), but this study is the first to do so across a wide range of habitat types. Through the combination of single-date NDVI imagery and extensively distributed ground-truth data, representative of a wide range of habitat types, the approach developed here allows both high resolution mapping and a regional scale product. The use of single-date NDVI imagery removes the need for frequent overpasses making high spatial resolution sensors such as Landsat and Sentinel-2 practical. Furthermore, our approach allows spatial extrapolation outside of field survey plots to produce a continuous surface ANPP product, particularly useful for capturing spatial patterns and representing small scale heterogeneity; the resulting maps are well suited for modelling applications and without discrete jumps in parameters across habitat boundaries. Conversely, our approach allows the calibration of spectral data from satellites into physically meaningful parameters. Hence, this framework delivers a valuable product for a wide range of users that would not be possible from EO or field data alone but instead requires careful integration of these two types of data.

4.2. Data Requirements for This Approach

The ANPP-NDVI relationships derived here are image-specific and hence, must be calibrated for each image using available data. Our approach differs from other empirical methods, which are usually developed at single sites, by using field data from multiple sites, selected using stratified sampling. This avoids a typical limitation of empirical methods—that scaling-up from site level to wider spatial scales involves extrapolating beyond the conditions on which the model has been trained. Because our model is trained using widely-distributed, representative field data, when it is used to predict ANPP outside of the field survey squares, we are still interpolating within the bounds of the training data.
Consequentially, this novel approach for regional scale mapping requires:
(1)
Widespread plot level field data that cover a range of habitats and ANPP values. Such datasets already exist in the UK, due to the Countryside Survey [30] and GMEP [31] projects, and for many countries across the world (see http://www.givd.info/). Similar datasets are likely to become increasing available as countries implement more fine-scale monitoring of their natural capital.
(2)
The field data need to provide sufficient plots per image to enable the production of a robust relationship. It is important to note that cloud-cover will tend to decrease the number of available plots within the image. The relationships presented here were based on between 42 and 128 plots (Table 5), with the best relationships using 109 plots; however, in this work, we have not attempted to determine the optimum number of plots.
(3)
Cloud-free data within a relatively narrow time window (March–May). Currently, the availability of suitable cloud free imagery for some regions, such as the UK, is limited; however, since the launch of the Sentinel-2 satellites, suitable optical imagery is being more frequently collected, thereby increasing the likelihood that cloud free imagery will be acquired. Hence, it is conceivable that regional scale vegetation productivity maps could be produced and updated every few years.

4.3. Potential Applications

The high-resolution continuous surface ANPP maps generated here have many possible applications; in particular, as an indicator of habitat condition and for mapping spatial patterns of biodiversity, since biodiversity and productivity are strongly (often unimodally) related [2,32]. Previous studies have demonstrated the close agreement between biodiversity and NDVI (e.g., tree species richness [33]). Other potential applications of the ANPP maps include: mapping ecosystem services and natural capital; improving estimation of above ground carbon and the terrestrial carbon cycle [34]; estimating forage yield; modelling land surface processes; and species distribution modelling. Many of the applications listed above may already incorporate NDVI imagery, but the advantage of using ANPP maps over NDVI imagery is that the influence of seasonal effects is reduced. This is because the NDVI values vary depending on the time of year the images are captured. By calibrating NDVI imagery to ANPP this provides a more consistent indicator for monitoring change, allowing images from different dates to be more readily compared.

4.4. Limitations and Future Work

The framework developed here and applied to Wales will be extended and applied to the whole of Great Britain using data from the Centre for Ecology and Hydrology’s Countryside Survey [30]. The same general method could also be applied to produce high-resolution continuous surface maps of other biophysical parameters. For example, in situ moisture data could be used to calibrate Normalised Difference Water Index (NDWI) imagery [35] to produce a regional scale soil and vegetation moisture product. Future work will also explore how dense the field data set needs to be, as well as assessing whether suitable field plots can be identified using the EO data. This will enable a more detailed experimental framework to be developed and will increase the accessibility of the method to other users.
When relating NDVI to vegetation parameters, including Leaf Area Index, biomass and production, saturation in the relationship can occur [36,37]. Saturation of the NDVI–ANPP relationship was observed in the summer images and is shown by the lack of relationship between NDVI and ln(ANPP) (Figure 3 July images) and the lack of spread of NDVI values in the summer (Figure 5). However, using the spring green-up window (Figure 5) allows separation of the sites pre-saturation. Other studies have observed saturation at high ANPP levels, particularly above 1000 dry mass g m−2 year−1 g [20]. Therefore, the methodology outlined here is not suitable for reliably predicting ANPP in highly productive ecosystems such as tropical forests or in areas without a prominent green-up period.
The NDVI–ANPP relationships are image-date specific and so ideally a new relationship should be derived for each time period. The derived relationships could potentially be applied to images from the same month in different years, however, due to differences in the green up time between years this could introduce additional uncertainties. Further work is needed to quantify this uncertainty and investigate ways of accounting for differences in vegetation phenology between years.

5. Conclusions

This paper has demonstrated an alternative approach for the operational regional-scale mapping of vegetation productivity at high spatial resolution, allowing between- and within-field spatial patterns in ANPP to be observed. A combination of NDVI imagery and ground-based ANPP estimates were used to develop models which were then applied to predict ANPP values outside of field survey squares. Our approach differs from other empirical methods as it uses widely-distributed, stratified field data to ensure that the derived models can be applied over large spatial scales. Furthermore, we use single-date rather than annually-integrated NDVI so that the high-spatial resolution sensor Landsat 8 can be utilised, despite its limited revisit frequency and high levels of cloud cover in the study area. Our methodological framework is limited by the need for in situ data for model calibration, however, we have demonstrated that ground-truth ANPP values can be estimated from simply measured plant trait variables. The increasing requirement for countries to keep track of their natural capital will result in similar spatially representative vegetation plot data becoming available for other countries, as well as better links between field and EO monitoring, as demonstrated here, rather than reliance on large scale models which can be meaningless for management. The method generates a high-resolution product that would not be feasible with LUE-based approaches, as these require meteorological data which are only available at coarse scale spatial resolution; hence, our approach offers significant advantages for applications that require fine-scale information such as for habitat condition monitoring.
The timing of the NDVI images determined the strength of the relationship, with results from a narrow temporal window providing the most accurate ANPP estimates. The optimum time period occurred during the spring green-up when within-habitat variability in NDVI was low and between-habitat variability was high. The exact timing of this green-up will vary from year to year [38]; however, our approach accounts for this by searching for images that give the best agreement between the ground-truth data and the satellite data. This study investigated the NDVI–ANPP relationship across a broad range of temperate habitats and strong relationships were achieved (R2 = 0.706), which were higher when only grasslands were considered (R2 = 0.833). When tested against the validation dataset, the derived models were able to predict ANPP from NDVI imagery with an RMSE of 15–21% (Figure 8).
The approach developed here for high resolution ANPP mapping has a huge range of potential applications and it opens up new ways of representing the landscape as a continuous surface, providing a valuable product for users and in particular for modelling applications. Our methodological framework, demonstrated here for temperate regions, has potential to be applied to any terrestrial ecosystem with a pronounced green up period, such as tropical grasslands; however, further work would be needed to confirm its reliability in these regions. Utilizing this method in different locations and for other time periods would require sufficient NDVI imagery during the vegetation green up period and widely distributed, representative ground-based ANPP estimates, in order to derive a robust relationship. Application of this method is limited by the availability of cloud free imagery; however, the launch of new satellites such as Sentinel-2A (2015) and 2B (2017) has increased availability of suitable imagery, making annual ANPP maps feasible in future.

Supplementary Materials

Supplementary File 1

Acknowledgments

Fieldwork and preliminary analysis were funded by GMEP (Glastir Monitoring & Evaluation Programme) (contract reference: C147/2010/11) and NERC/Centre for Ecology & Hydrology (CEH Project: NEC05782). Remaining analysis and writing of the paper were funded by NERC/CEH National Capability Project “Land Cover Monitoring with Satellites” (NEC05567). Measurement of ANPP and leaf trait data was funded by the NERC Macronutrients program as part of the Turf2Surf project (NE/J011991/1).

Author Contributions

Emma J. Tebbs and Clare S. Rowland conceived and designed the methodological framework; Emma J. Tebbs performed the processing and analysis, and generated the data visualizations; Simon M. Smart contributed the methodology for estimating ANPP from cLDMC; and Emma J. Tebbs led the paper writing and all authors contributed to writing and editing of the text.

Conflicts of Interest

The authors declare no conflict of interest. The funders had no role in the design of the study; in the collection, analyses, or interpretation of data; in the writing of the manuscript, and in the decision to publish the results.

References

  1. Cardinale, B.J.; Matulich, K.L.; Hooper, D.U.; Byrnes, J.E.; Duffy, E.; Gamfeldt, L.; Balvanera, P.; O’Connor, M.I. The functional role of producer diversity in ecosystems. Am. J. Bot. 2011, 98, 572–592. [Google Scholar] [CrossRef] [PubMed]
  2. Fraser, L.H.; Pither, J.; Jentsch, A.; Sternberg, M.; Zobel, M.; Askarizadeh, D.; Bartha, S.; Beierkuhnlein, C.; Bennett, J.A.; Bittel, A.; et al. Worldwide evidence of a unimodal relationship between productivity and plant species richness. Science 2015, 349, 302–306. [Google Scholar] [CrossRef] [PubMed] [Green Version]
  3. Haberl, H.; Erb, K.-H.; Krausmann, F.; Gaube, V.; Bondeau, A.; Plutzar, C.; Gingrich, S.; Lucht, W.; Fischer-Kowalski, M. Quantifying and mapping the human appropriation of net primary production in earth’s terrestrial ecosystems. Proc. Natl. Acad. Sci. USA 2007, 104, 12942–12947. [Google Scholar] [CrossRef] [PubMed]
  4. Scurlock, J.M.O.; Johnson, K.; Olson, R.J. Estimating net primary productivity from grassland biomass dynamics measurements. Glob. Chang. Biol. 2002, 8, 736–753. [Google Scholar] [CrossRef]
  5. Jung, M.; Vetter, M.; Herold, M.; Churkina, G.; Reichstein, M.; Zaehle, S.; Ciais, P.; Viovy, N.; Bondeau, A.; Chen, Y.; et al. Uncertainties of modeling gross primary productivity over Europe: A systematic study on the effects of using different drivers and terrestrial biosphere models. Glob. Biogeochem. Cycles 2007, 21, GB4021. [Google Scholar] [CrossRef]
  6. Morton, D.; Rowland, C.; Wood, C.; Meek, L.; Marston, C.; Smith, G.; Wadsworth, R.; Simpson, I. Countryside Survey: Final Report for LCM2007—The New UK Land Cover Map; CS Technical Report No 11/07; Centre for Ecology & Hydrology: Bailrigg, UK, 2011. [Google Scholar]
  7. Hansen, M.; Egorov, A.; Roy, D.P.; Potapov, P.; Ju, J.; Turubanova, S.; Kommareddy, I.; Loveland, T.R. Continuous fields of land cover for the conterminous United States using Landsat data: First results from the Web-Enabled Landsat Data (WELD) project. Remote Sens. Lett. 2011, 2, 279–288. [Google Scholar] [CrossRef]
  8. Benz, U.C.; Hofmann, P.; Willhauck, G.; Lingenfelder, I.; Heynen, M. Multi-resolution, object-oriented fuzzy analysis of remote sensing data for GIS-ready information. ISPRS J. Photogram. Remote Sens. 2004, 58, 239–258. [Google Scholar] [CrossRef]
  9. Morton, R.D.; Rowland, C.S. Developing and Evaluating an Earth Observation-Enabled Ecological Land Cover Time Series System; JNCC Report No. 563; JNCC: Peterborough, ON, Canada, 2015; 69p.
  10. Running, S.W.; Nemani, R.R.; Heinsch, F.A.; Zhao, M.; Reeves, M.; Hashimoto, H. A continuous satellite-derived measure of global terrestrial primary production. BioScience 2004, 54, 547–560. [Google Scholar] [CrossRef]
  11. Hansen, M.C.; DeFries, R.S.; Townshend, J.R.G.; Sohlberg, R.; Dimiceli, C.; Carroll, M. Towards an operational MODIS continuous field of percent tree cover algorithm: Examples using AVHRR and MODIS data. Remote Sens. Environ. 2002, 83, 303–319. [Google Scholar] [CrossRef]
  12. Lambin, E. Monitoring forest degradation in tropical regions by remote sensing: Some methodological issues. Glob. Ecol. Biogeogr. 2013, 8, 191–198. [Google Scholar] [CrossRef]
  13. Zhao, M.; Heinsch, F.A.; Nemani, R.R.; Running, S.W. Improvements of the MODIS terrestrial gross and net primary production global data set. Remote Sens. Environ. 2005, 95, 164–176. [Google Scholar] [CrossRef]
  14. Tucker, C.J.; Vanpraet, C.L.; Sharman, M.J.; van Ittersum, G. Satellite remote sensing of total herbaceous biomass production in the Senegalese Sahel: 1980–1984. Remote Sens. Environ. 1985, 17, 233–250. [Google Scholar] [CrossRef]
  15. Gitelson, A.A.; Viña, A.; Masek, J.G.; Verma, S.B.; Suyker, A.E. Synoptic monitoring of gross primary productivity of maize using Landsat data. IEEE Geosci. Remote Sens. Lett. 2008, 5, 133–137. [Google Scholar] [CrossRef]
  16. Liu, Y.; Ju, W.; He, H.; Wang, S.; Sun, R.; Zhang, Y. Changes of net primary productivity in China during recent 11 years detected using an ecological model driven by MODIS. Front. Earth Sci. 2013, 7, 112–127. [Google Scholar] [CrossRef]
  17. Fu, D.; Chen, B.; Zhang, H.; Wang, J.; Black, T.A.; Amiro, B.D.; Bohrer, G.; Bolstad, P.; Coulter, R.; Rahman, A.F.; et al. Estimating landscape net ecosystem exchange at high spatial-temporal resolution based on Landsat data, an improved upscaling model framework, and eddy covariance flux measurements. Remote Sens. Environ. 2014, 141, 90–104. [Google Scholar] [CrossRef]
  18. Paruelo, J.M.; Epstein, H.E.; Lauenroth, W.K.; Burke, I.C. ANPP Estimates from NDVI for the Central Grassland Region of the United States. Ecology 1997, 78, 953–958. [Google Scholar] [CrossRef]
  19. Hill, R.A.; Smith, G.M. Land cover heterogeneity in Great Britain as identified in Land Cover Map 2000. Int. J. Remote Sens. 2005, 26, 5467–5473. [Google Scholar] [CrossRef]
  20. Box, E.O.; Holben, B.N.; Kalb, V. Accuracy of the AVHRR vegetation index as a predictor of biomass, primary productivity and net CO2 flux. Vegetatio 1989, 80, 71–89. [Google Scholar] [CrossRef]
  21. Seaquist, J.W.; Olsson, L.; Ardö, J. A remote sensing-based primary production model for grassland biomes. Ecol. Model. 2003, 169, 131–155. [Google Scholar] [CrossRef]
  22. Monteith, J.L. Solar radiation and productivity in tropical ecosystems. J. Appl. Ecol. 1972, 9, 747–766. [Google Scholar] [CrossRef]
  23. Turner, D.P.; Ritts, W.D.; Cohen, W.B.; Maeirsperger, T.K.; Gower, S.T.; Kirschbaum, A.A.; Running, S.W.; Zhao, M.; Wofsy, S.C.; Dunn, A.L.; et al. Site-level evaluation of satellite-based global terrestrial gross primary production and net primary production monitoring. Glob. Chang. Biol. 2005, 11, 666–684. [Google Scholar] [CrossRef]
  24. Russell, S.; Jones, L.; Reynolds, B.; Robinson, D.; Blackstock, T. Status and changes in the UK ecosystems and their services to society: Wales. In The UK National Ecosystem Assessment: Synthesis of the Key Findings; Watson, B., Albon, S., Eds.; UNEP-WCMC: Cambridge, UK, 2011. [Google Scholar]
  25. Kleyer, M.; Bekker, R.M.; Knevel, I.C.; Bakker, J.P.; Thompson, K.; Sonnenschein, M.; Poschlod, P.; van Groenandael, J.M.; Klimes, L.; Klimesova, J.; et al. The LEDA traitbase: A database of life-history traits of the NW European flora. J. Ecol. 2008, 96, 1266–1274. [Google Scholar] [CrossRef]
  26. Smart, S.M.; Glanville, H.C.; del Carmen Blanes, M.; Mercado, L.M.; Emmett, B.A.; Jones, D.L.; Jackson, C.B.; Marrs, R.H.; Butler, A.; Marshall, M.R.; et al. Leaf Dry Matter Content is better at predicting above-ground Net Primary Production than Specific Leaf Area. Funct. Ecol. 2017, 38, 42–49. [Google Scholar] [CrossRef]
  27. Zanter, K. Landsat 8 (L8) Data Users Handbook; Version 2; 2016; LSDS-1574; Department of the Interior U.S. Geological Survey. Available online: https://landsat.usgs.gov/landsat-8-l8-data-users-handbook (accessed on 2 August 2017).
  28. USGS. Product Guide Landsat 4–7 Climate Data Record (CDR) Surface Reflectance; Version 7.2; Department of the Interior U.S. Geological Survey: Reston, VA, USA, 2017.
  29. Martin, A.R.; Rapidel, B.; Roupsard, O.; Van den Meersche, K.; Virginio Filho, M.; Barrios, M.; Isaac, M.E. Intraspecific trait variation across multiple scales: The leaf economics spectrum in coffee. Funct. Ecol. 2016, 31, 604–612. [Google Scholar] [CrossRef]
  30. Smart, S.; Maskell, L.C.; Dunbar, M.J.; Emmett, B.A.; Marks, S.; Norton, L.R.; Rose, P.; Simpson, I.C. An Integrated Assessment of Countryside Survey Data to Investigate Ecosystem Services in Great Britain; Countryside Survey Technical Report No. 10/07; Centre for Ecology & Hydrology: Bailrigg, UK, 2010. [Google Scholar]
  31. Emmett, B.E.; the GMEP Team. Glastir Monitoring & Evaluation Programme. Second Year Annual Report to Welsh Government (Contract Reference: C147/2010/11). NERC/Centre for Ecology & Hydrology (CEH Project: NEC04780). 2015. Available online: https://core.ac.uk/download/pdf/33453746.pdf (accessed on 2 August 2017).
  32. Maskell, L.C.; Crowe, A.; Dunbar, M.J.; Emmett, B.; Henrys, P.; Keith, A.M.; Norton, L.R.; Scholefield, P.; Clark, D.B.; Simpson, I.C.; et al. Exploring the ecological constraints to multiple ecosystem service delivery and biodiversity. J. Appl. Ecol. 2013, 50, 561–571. [Google Scholar] [CrossRef]
  33. Bawa, K.; Rose, J.; Ganeshaiah, K.N.; Barve, N.; Kiran, M.C.; Umashaanker, R. Assessing biodiversity from space: An example from the Western Ghats, India. Conserv. Ecol. 2002, 6, 7. [Google Scholar] [CrossRef]
  34. Reichstein, M.; Bahn, M.; Ciais, P.; Frank, D.; Mahecha, M.D.; Seneviratne, S.I.; Zscheischler, J.; Beer, C.; Buchmann, N.; Frank, D.C.; et al. Climate extremes and the carbon cycle. Nature 2013, 500, 287–295. [Google Scholar] [CrossRef] [PubMed]
  35. Gao, B.C. NDWI—A normalized difference water index for remote sensing of vegetation liquid water from space. Remote Sens. Environ. 1996, 58, 257–266. [Google Scholar] [CrossRef]
  36. Wang, Q.; Adiku, S.; Tenhunen, J.; Granier, A. On the relationship of NDVI with leaf area index in a deciduous forest site. Remote Sens. Environ. 2005, 94, 244–255. [Google Scholar] [CrossRef]
  37. Goswami, S.; Gamon, J.; Vargas, S.; Tweedie, C. Relationships of NDVI, Biomass, and Leaf Area Index (LAI) for six key plant species in Barrow, Alaska. PeerJ Prepr. 2015, 3, e913v1. [Google Scholar] [CrossRef]
  38. Pettorelli, N. The Normalised Difference Vegetation Index; Oxford University Press: Oxford, UK, 2013. [Google Scholar]
Figure 1. Map showing the location of the study area within Europe (top); and the location of field survey plots sampled in 2013 and 2014 across Wales (bottom).
Remotesensing 09 00801 g001
Figure 2. Methodological framework for producing high-resolution regional scale ANPP maps from ground-based measurements and EO data. GMEP is the Glastir Monitoring and Evaluation Program and cLDMC is cover-weighted Leaf Dry Matter Content.
Remotesensing 09 00801 g002
Figure 3. Scatter plots of Landsat 8 NDVI versus ln(ANPP) for all habitat types for: a spring image (top left); and a summer image (top right); and for grassland habitats in: spring (bottom left); and summer (bottom right).
Remotesensing 09 00801 g003
Figure 4. Time series of gradient and R2 values for the relationship between ANPP (g dry mass m−2 year−1) and NDVI (all habitats) for NDVI imagery produced using both top-of-atmosphere reflectance and surface reflectance.
Remotesensing 09 00801 g004
Figure 5. Time series of Landsat 8 top-of-atmosphere NDVI for different grassland types that correspond to different productivity levels (Table 2) (top); and time series of within habitat and between habitat variance in NDVI (bottom). The optimum time window (grey shaded areas) was defined as when “between habitat variance” > 0.01 AND “between habitat variance” > “within habitat variance”, where “between habitat variance” was calculated as the variance of the mean NDVI value for each habitat and “within habitat variance” was calculated as the mean of the variance in NDVI for each habitat.
Remotesensing 09 00801 g005
Figure 6. Time series of R2 values for the regression of single date NDVI and in situ ANPP (g dry mass m−2 year−1) using in situ data from both years, 2013 only or 2014 only.
Remotesensing 09 00801 g006
Figure 7. Maps of ANPP (g dry mass m−2 year−1) for Wales (all habitats listed in Table 2) produced using Landsat 8 NDVI imagery captured on: 19 May 2013 (a); 13 April 2014 (b); and 6 October 2014 (c); and (d) a combined ANPP map, produced by mosaicking together the first three maps.
Remotesensing 09 00801 g007
Figure 8. Scatter plots showing the validation of the three models summarised in Table 5 Solid line shows the 1:1 line and error bars represent ± root-mean-square error.
Remotesensing 09 00801 g008
Figure 9. ANPP (g dry mass m−2 year−1) map for Wales for all habitat types listed in Table 1 produced using Landsat 5 TM imagery captured on 28 April 2011.
Remotesensing 09 00801 g009
Table 1. List of Landsat 8 OLI scenes used in this study.
DateLandsat Scene IDs
19 May 2013LC82040242013139LGN01
6 July 2013LC82040232013187LGN00, LC82040242013187LGN00
16 August 2013LC82030242013228LGN00
24 September 2013LC82040232013267LGN00
10 October 2013LC82040242013283LGN00
4 November 2013LC82030242013308LGN00
29 December 2013LC82040232013363LGN00, LC82040242013363LGN00
12 March 2014LC82030242014071LGN00
13 April 2014LC82030242014103LGN00
15 May 2014LC82030242014135LGN00
23 June 2014LC82040232014174LGN00, LC82040242014174LGN00
2 July 2014LC82030242014183LGN00
25 July 2014LC82040232014206LGN00, LC82040242014206LGN00
3 August 2014LC82030242014215LGN00
19 August 2014LC82030242014231LGN00
4 September 2014LC82030242014247LGN00
11 September 2014LC82040232014254LGN00, LC82040242014254LGN00
6 October 2014LC82030242014279LGN00
29 October 2014LC82040232014302LGN00
14 November 2014LC82040232014318LGN00
30 November 2014LC82040232014334LGN00, LC82040242014334LGN00
Table 2. Mean plot-level ANPP values (mean ± standard deviation) for each broad habitat type, from GMEP data for 2013 and 2014.
Broad HabitatNo. SamplesMean ANPP (Dry Mass g·m2·year1)
Broadleaved Mixed and Yew Woodland44438 ± 67
Coniferous Woodland43399 ± 50
Arable and Horticulture14664 ± 230
Improved Grassland204561 ± 49
Neutral Grassland166542 ± 55
Acid Grassland88354 ± 80
Bracken15430 ± 55
Dwarf Shrub Heath25363 ± 39
Fen, Marsh, Swamp30412 ± 97
Bog51299 ± 45
Table 3. Coefficient of determination, R2, and standard errors, SE, for the relationship between single-date NDVI and ANPP (all habitats). Only results where R2 > 0.5 are shown. Results are shown for NDVI imagery produced using both top-of-atmosphere reflectance and surface reflectance products.
TOA ReflectanceSurface Reflectance
DateR2SER2SE
19 May 20130.6070.1630.6000.165
13 April 20140.7060.1570.6900.157
6 October 20140.5660.1760.6480.155
Table 4. Coefficient of determination, R2, for the regression between single date NDVI and in situ ANPP (g dry mass m−2 year−1) using in situ data from both years, 2013 only and 2014 only. Bold values show the best R2 value achieved for each image.
R2
DateAll Data2013 Only2014 Only
19 May 20130.6480.7030.607
13 April 20140.650.5070.706
6 October 20140.5290.4920.566
Table 5. Model coefficients and variance determined using a linear mixed-effects model, and the number of field plots used to calibrate each model.
DateGradient, mIntercept, cVariance Explained by the SquareResidual VarianceNo. of Field Plots
19 May 20131.105.420.01030.0210128
13 April 20141.315.320.01500.0168109
6 October 20141.814.850.01300.031642

