1. Introduction
Geophysics is ever more considered an essential and reliable tool for the detection of traces of past human frequentation or relics buried in the subsoil. The awareness of the usefulness of geophysics in archaeological investigations strongly increased in the last two decades (especially in Europe and Northern America) due to technological advances of instrumentation, availability of friendly data processing tools, and improvement in result visualization [
1,
2]. Despite the increased reliability of geophysics in archaeology, the results are not always up to archaeologists’ expectations As known, the capability in detecting archaeological targets, including walls, cavities, burials, depends on the physical characteristics of the targets and their matrix. Lower is the difference of physical characteristics between targets and matrix, lower is the probability in discriminating them by using any geophysical prospecting technique, including Geomagnetometry [
3], Electrical resistivity tomography (ERT), Ground Penetrating Radar (GPR) [
4]. This is the case of Henan and Shaanxi, where flood alluvial deposits conserve at very high depths most of the Chinese ancient cultural heritage, including buried capital cities in Luoyang, Kaifeng, and Chang’An (the current Xi’An), mainly built with rammed earth whose identification is all but easy.
In China, still today, most of the archaeological findings are made using destructive methods or by change as was in the case of the terracotta army discovered in 1974 by farmers, digging a water well nearby the Qin Emperor’s tomb mound [
5]. In Henan, for the detection of subsurface archaeological remains [
6] mainly composed of rammed earth, archaeologists generally used and still today use to:
- (a)
excavate trenches;
- (b)
observe profiles in test pits
- (c)
extract continuous sections of sediments by coring and augering, using hollow cylinders and devices respectively to cut the sediment in a helical motion.
The first two techniques are destructive and time consuming. Moreover, they are little effective without the availability of ancillary data [
7]. The third is less destructive but invasive. Their limit is the difficulty in differentiating cultural deposits from the rest [
7].
In Henan up to now, little attention has been paid to non-invasive geophysical techniques due to limiting factors that generally reduce the detection capability of any technology:
- (d)
the building material generally consist of rammed earth, mostly composed of clay
- (e)
the alluvial deposit are mainly composed of clay and silt;
the depth where the first anthropogenic layers (including ruins, canals and moats) are located is usually very high (>2 m).
In these conditions, ERT or any other geophysical techniques (based on electrical resistivity measurements) could be a valuable solution for imaging sub-surface structures also for deep archaeological remains. This is, for example, the case of the ruins of the city walls of East Zhou Dynasty in Shangqiu that were investigated by high density resistivity techniques [
8] (probably the only scientific application of geophysics in archaeology in Henan).
With respect to electrical resistivity-based method, it should be considered that: (i) the detection capability depends on the difference in electrical resistivity observed between archaeological target and its matrix; (ii) the size of features detectable using ERT does not fit with the usual dimensions of archaeological remains.
Since 2013, in the context of a Sino-Italian bilateral project, Earth Observation technologies (including geophysics) have been applied to assess their capability in detecting shallow and buried remains made in rammed earth. Three test sites were investigated in Henan (
http://www.unesco-hist.org/en-us/research-progress/387.html accessed 28 June 2017). Two of them (already published) Ding Ding gate [
9] and Han Wei Capital city [
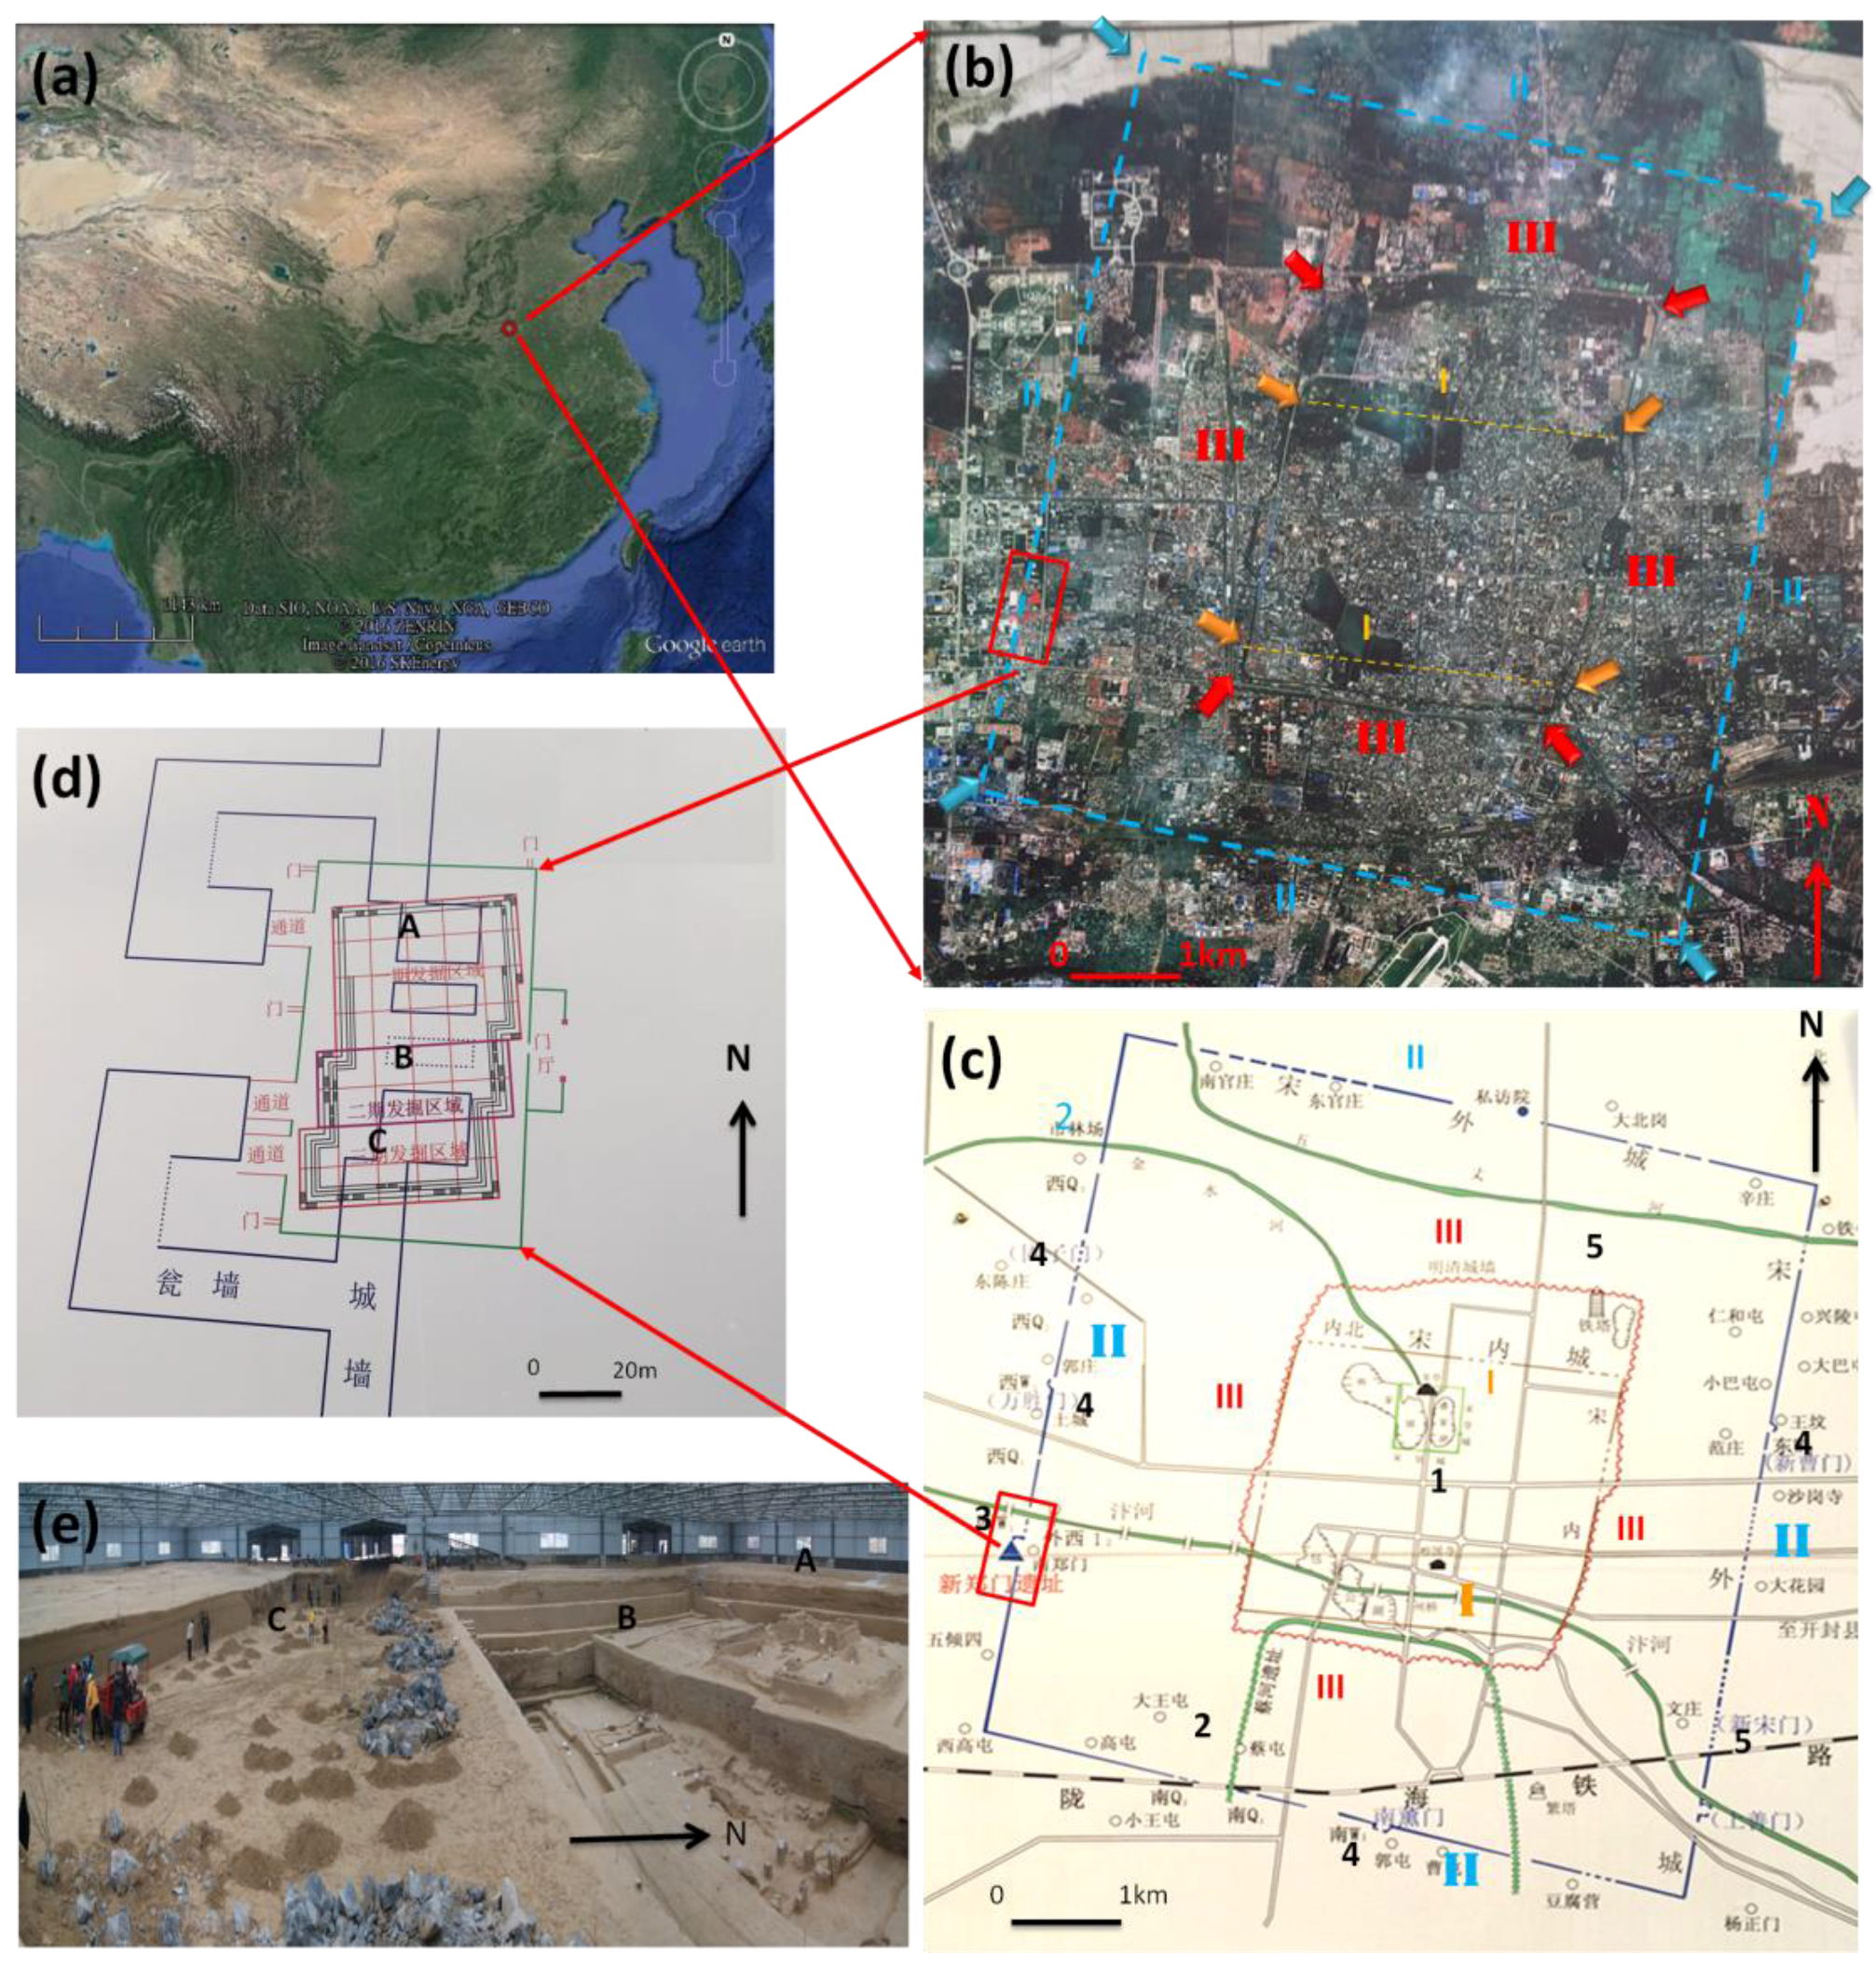
10] are located in Luoyang. The third test site, focused in this paper, is located in Kaifeng in an area that includes the Xinzheng gate of the City walls built during Northern Song Dynasty (
Figure 1).
In particular, geophysical investigations including ERT and GPR have been performed in Luoyang and in Han Wei Capital city, to verify the presence of archaeological features previously identified from SAR-based analyses [
10]. In the test site located in Kaifeng, both ERT and GPR prospection were carried out where archaeologists planned to conduct excavations. The aim was to assess the capability of GPR and ERT in detecting rammed earth remains at different depths: less and deeper than 2 m.
On the basis of the knowledge of what was found by archaeologists in the first two meters of excavations, the discussion of geophysical results has been performed in a comparative also using laser scanner survey performed on unearthed remains. Below the excavated stratum, the discussion of geophysical results has been oriented to understand the presence of features of potential archaeological interest.
2. Study Area
Kaifeng, located in the east of Henan province, has been one of the most important Chinese capitals [
11]. The current city is located on the Yellow River alluvial landforms where the soil is composed of 6 to 10 m of flood alluvial deposits (
Figure 1a and
Figure 2). Archaeological excavations unearthed several anthropogenic layers related to a long past human frequentation characterized by one or more foundations of the city, several destructions, and re-buildings for more than two millennia.
In 364 BCE, during the Warring States period (453–221 BCE), Kaifeng was founded and named Daliang, to be the capital of the State of Wei. The town was built close to the Cai river which was connected to the Yellow River by a canal. In 225 BCE it was destroyed after a three month siege by the Qin army who flooded the city re-directing the waters of the Yellow river and the canal. The siege also marked the end of the State of Wei which was included in the State of Qin.
The town was rebuilt around to a nucleus of buildings not destroyed by Qin army. In a few centuries it became a commercial hub connected to the Grand Canal through several channels constructed to serve both Henan and the bordering province of Shandong. During Tang Dynasty (618–907 AD), Kaifeng (whose name changed from Daliang to Bian) played a leading role in the trade economy of a vast region including the current Henan, Shanxi and Shadong provinces [
12].
Its importance further increased after Tang Dynasty, when it became capital during the Five Dynasties and the Ten Kingdoms period (936–960). The city followed to be capital under the Northern Song dynasty (960–1127) during which it was known as Dongjing or Bianjing [
11]. In this period it had a further expansion reaching an extension both inside and outside the city walls to accommodate a population of around 400,000 living (
Figure 1b,c). Thanks to its position, at the intersection of four canals, Kaifeng became the most important commercial and industrial center in China and, consequently, it was further expanded [
12]. In the 11th century it was surrounded by two rings of city walls inside which 600,000 to 700,000 inhabitants lived (see I and II in
Figure 1b,c). Its expansion was interrupted in 1127 when the city was besieged and sacked by Jurchen armies. Subsequently Kaifeng came under the rule of the Jurchen Jin dynasty who won the Jin-Song Wars and conquered most of North China [
6,
12].
After the siege of the Jurchen armies, the population dramatically decreased, despite the fact that Kaifeng remained an important commercial and administrative center, chosen by Jurchen as Southern Capital. Consequently, the urban area also decreased: only the area inside the first city wall ring was inhabited (reconstructed after the last destructions by the Jurchen siege). Whereas, the remaining other areas, surrounded by the Song Dynasty walls (see II in
Figure 1b,c), were abandoned. The city was capital until 1214 after that the Jurchen moved the imperial court southwards to Kaifeng to flee from the attack of Mongolian forces. In 1232, the city fell under the attack of the Mongol and Song and was destroyed again. During Yuan dynasty (1271–1368) Kaifeng experienced a period of decline, as confirmed by the scarcity of archaeological data [
6].
The city recovered during the Ming dynasty (1368–1644), when it was made the capital of Henan province. The position of Kaifeng on the floodplains of the Yellow River, near the Grand Canal, was from one hand the reason of its wellness and strategic importance, but from the other hand it was also a problem, being exposed to flooding such as those occurred in 1375, 1384, 1390, 1410 and 1416, five times in about forty years [
11].
Moreover, additional floods were induced to destroy Kaifeng during conflicts and sieges. The largest man made flood disaster was in 1642, when the Ming army flooded the city with waters from the Yellow River to prevent peasant rebellions. Because of this flooding, 300,000 people died, the city was abandoned again and rebuilt twenty years after, during the reign of the Kangxi Emperor of the Qing dynasty. Finally, once again, it underwent a flood in 1841, followed by the reconstruction a few years later.
The different phases of building, destructions and reconstructions of Kaifeng, are visible from the archaeological records. Since the 1980s [
13], some archaeological investigations on the ancient Kaifeng city have been going on. In particular, the archaeological research on Northern Song Dynasty city has greatly paid the attention of archaeologists, being that the city achieved the maximum extension of its history before the 20th century.
One of the studies areas is the Xinzheng Gate, located at west of modern city (see
Figure 1b–d). Since 2012, Xinzheng Gate has been investigating with two archaeological excavations which unearthed remains of ancient walls, yards, roads and a large number of ancient relics, covering different historical phases including not only Song Dynasty (960–1279) but also Ming (1368–1644) and Qing Dynasty (1644–1912). In particular, in the northern part of the investigated area (labeled A in
Figure 1d,e) the archaeological excavations unearthed a quadrangular rural house, dated to Qing Dynasty, with several material including vessels and iron artifacts. In the central part (labeled B in
Figure 1d,e) the archaeologist deepened the excavations which evidenced the entire archaeological stratigraphy including Ming, Yuan (1260–1368), Jun Dynasty (see
Figure 2) and Northern Song city walls [
13].
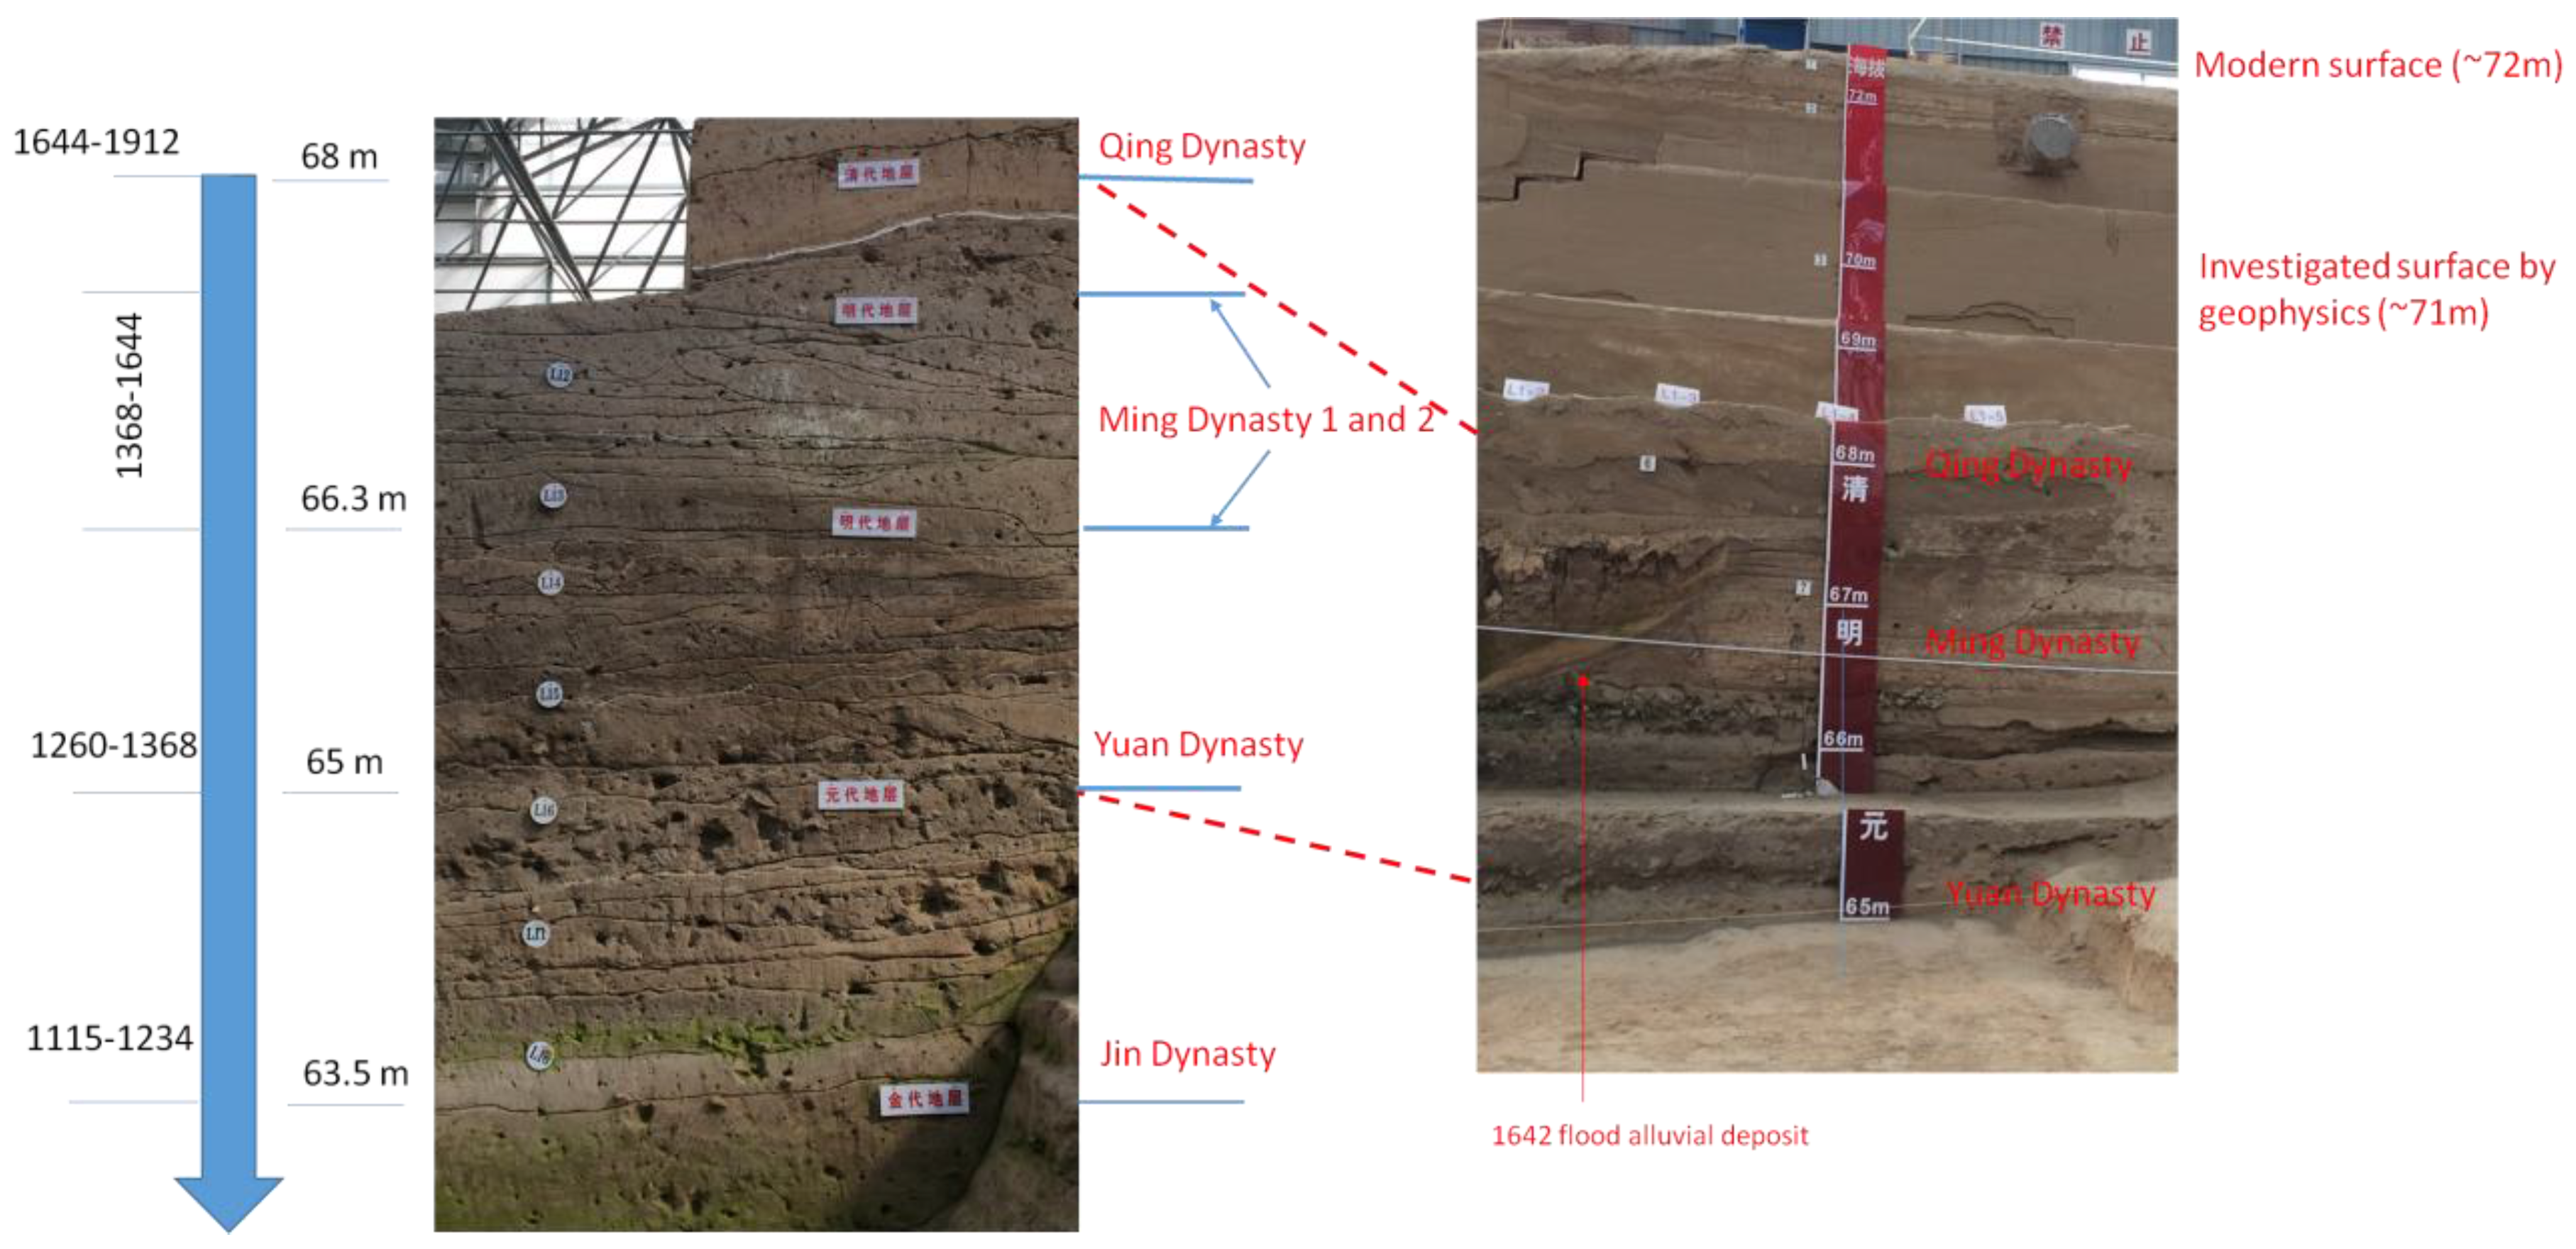
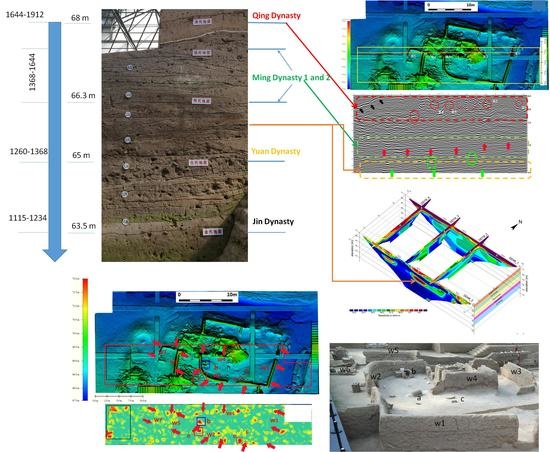
The interpretation, jointly made with the local archaeologists and based on the outputs from laser scanner and topographical survey, allowed us to identify and survey the different archaeological layers from Qing to Jin Dynasty [
13] (see
Figure 2). With respect to the modern surface (72 m above sea level), the first ancient stratum, dated to the Qing Dynasty, is located at 4 m below (68 m asl). The following two meters (66 m asl) are relates with two phases of Ming Dynasty. Finally, the layers of Yuan and Jin Dynasty are at 65 and 63.5 m asl, respectively. An older phase was found and dated to Northern Song Dynasty. It is related to some remains of the city walls located between sectors A and B.
In November 2015, some archaeogeophysical investigations, conducted by the Italian Mission of the CNR in cooperation with the Henan Academy of Sciences and RADI-CAS, were performed in an area adjacent to the archaeological excavations. GPR and ERT prospections were conducted in the investigated area, indicated with letter C in
Figure 1d, at the height of 71 m asl (before geophysical investigations one meter of soil was removed).
3. Archaeo-Geophysical Investigations: Aims, Methodology, Data Acquisition and Processing
Geophysical investigations were conducted with twofold aims: operational and scientific. The first was the detection of features of potential archaeological interest ex ante the scheduled archaeological excavations, performed from March to May 2016. The second was the evaluation of GPR and ERT capability in the imaging of the archaeological features, made by a comparison between geophysical results and the excavated remains, surveyed by laser scanner.
GPR with three antennas at 100, 200 and 600 MHz was used to characterize the first two meter depth, later excavated (see paragraph
Section 3.2.1), and to detect potential deeper remains. ERT prospections (
Section 3.2.2) were performed for a deeper exploration to detect further anthropogenic layers.
The medium that has been investigated is prevailingly composed of clayey silt with a low water content especially in the first two-three meters, due to the fact that the area is protected by a metallic shelter and walls.
Considering that after the geophysical survey the investigated area was excavated for the first two meters, the discussion (see
Section 4) mainly focuses on the comparative analysis of geophysical results (in particular the GPR) with archaeological finding to understand the relation cause-effect between remains and geophysical response. To this end, a laser scanner survey (see
Section 3.3) was also carried out to have a detailed digital model of the unearthed walls and artifacts.
3.1. Geophysical Methods Used for the Study Area
3.1.1. GPR Method
GPR is a non-invasive geophysical method used to detect and characterize subsurface targets by analyzing changes in the electro-magnetic (EM) properties of the medium, including the target and its surrounding [
4]. In particular, GPR radiates short EM pulses into the ground and detects reflected signals generated in presence of a dielectric contrast between potential targets and surrounding soil.
The EM-wave frequencies along with the electrical characteristics of the subsoil (permittivity and electrical conductivity) determine the resolution and the depth of investigation. The lower the frequency, the greater is the penetration depth of EM pulses, and the less is the resolution. Today the possibility to acquire data at different frequencies allows the imaging of the subsoil at different details and penetration depths.
The handily of the instrument and its versatility in terms of penetration capability and resolutions, depends on the antenna frequency and allows the application of GPR in many different areas, as civil and geotechnical engineering [
14,
15]; geological and sedimentological studies [
16,
17], environmental contamination [
18], monitoring of monuments [
19,
20] and artifacts [
21], and archaeological research [
1,
22,
23].
Though the first GPR applications in Archaeology date to the 1970s, only since the 1990s it has been using in archaeological investigations in a systematic way [
22]. From a strictly operative point of view, GPR measurements are performed by using a device which consists in a receiver and transmitter antenna, a control unit, battery supply and a survey cart. The control unit produces EM pulses that propagate into ground by a transmitting antenna. When radar waves are reflected off buried ‘objects’ and archaeological and/or depositional layers, they are recorded back by the receiving antenna, thus measuring the two way travel time of radar wave. This, suitably processed, is than converted into the subsoil depth. The digital acquisition allows us to represent the acquired data in 2d-profiles. They can be filtered and enhanced to detect, accurately locate and estimate size as well as to identify shape of archaeological features or changes in the matrix referable to different phases of use/frequentation of the site. To understand the spatial extend of targets it is essential to observe the development along the profiles usually acquired at 0.25 to 2.0 m of distance between each other, depending on the size of the expected target. Additional information on the morphology of the targets could be obtained using a series of 2-D profiles to arrange a pseudo 3-D volume. Horizontal sections producing depth slices are the most common and easy way to visualize the pattern of targets, especially for large areas [
24]. Sometimes, the ease of viewing comes at the expense of reliability of the information, especially in the case of archaeological contexts characterized by morphologically irregular surfaces as well as complex structures located at different depths [
25].
3.1.2. ERT Method
The Electrical Resistivity Tomography (ERT) is a non invasive geophysical technique for imaging the distribution of electrical properties (bulk resistivity) within the subsoil. It is based on the injection of an electrical current into the ground by means of a couple of electrodes (current electrodes) and on the measurement of the resulting potential field by another couple of electrodes (potential electrodes). By varying the relative distance between electrodes, which compose both the current and potential pairs, and by modifying the relative position of the couples of electrodes, it is possible to build up a pseudo cross-section of the apparent resistivity beneath the survey line. The investigation depth and the spatial resolution depends on the electrode separation and geometry [
26]; a greater electrode separation allows a bulk resistivity measurements form a greater depth but with a lower resolution.
Nowadays, thanks to the instrumental evolution and to the multi-electrodes cables, ERT investigations are routinely used for a wide range of applications from hydrological and geological studies [
27] to soil-plants interaction [
28].
For archeological purposes, ERT proved to be a very useful tool. Buried structures may be characterized by different bulk resistivity in respect to the soil in which they are located. Hence, in the best conditions, ERT can be used for (i) a preliminary identification of area of archaeological interest and for (ii) supporting the archeologists in planning their activities [
29,
30].
3.2. Geophysical Data Acquisition and Processing
3.2.1. GPR Data Acquisition and Processing
GPR surveys were performed with a RIS MF Hi-Mod GPR System of IDS equipped with an array of two multi-frequency antennas using simultaneously 200 and 600 MHz antennas mounted on a survey cart equipped with an incremental encoder. The 200 MHz and 600 MHz data were acquired in continuous and reflection mode with a time window of 130 ns and 60 ns respectively, samples per scan set at 512 with a resolution of 16 bits and a transmit rate of 100 KHz.
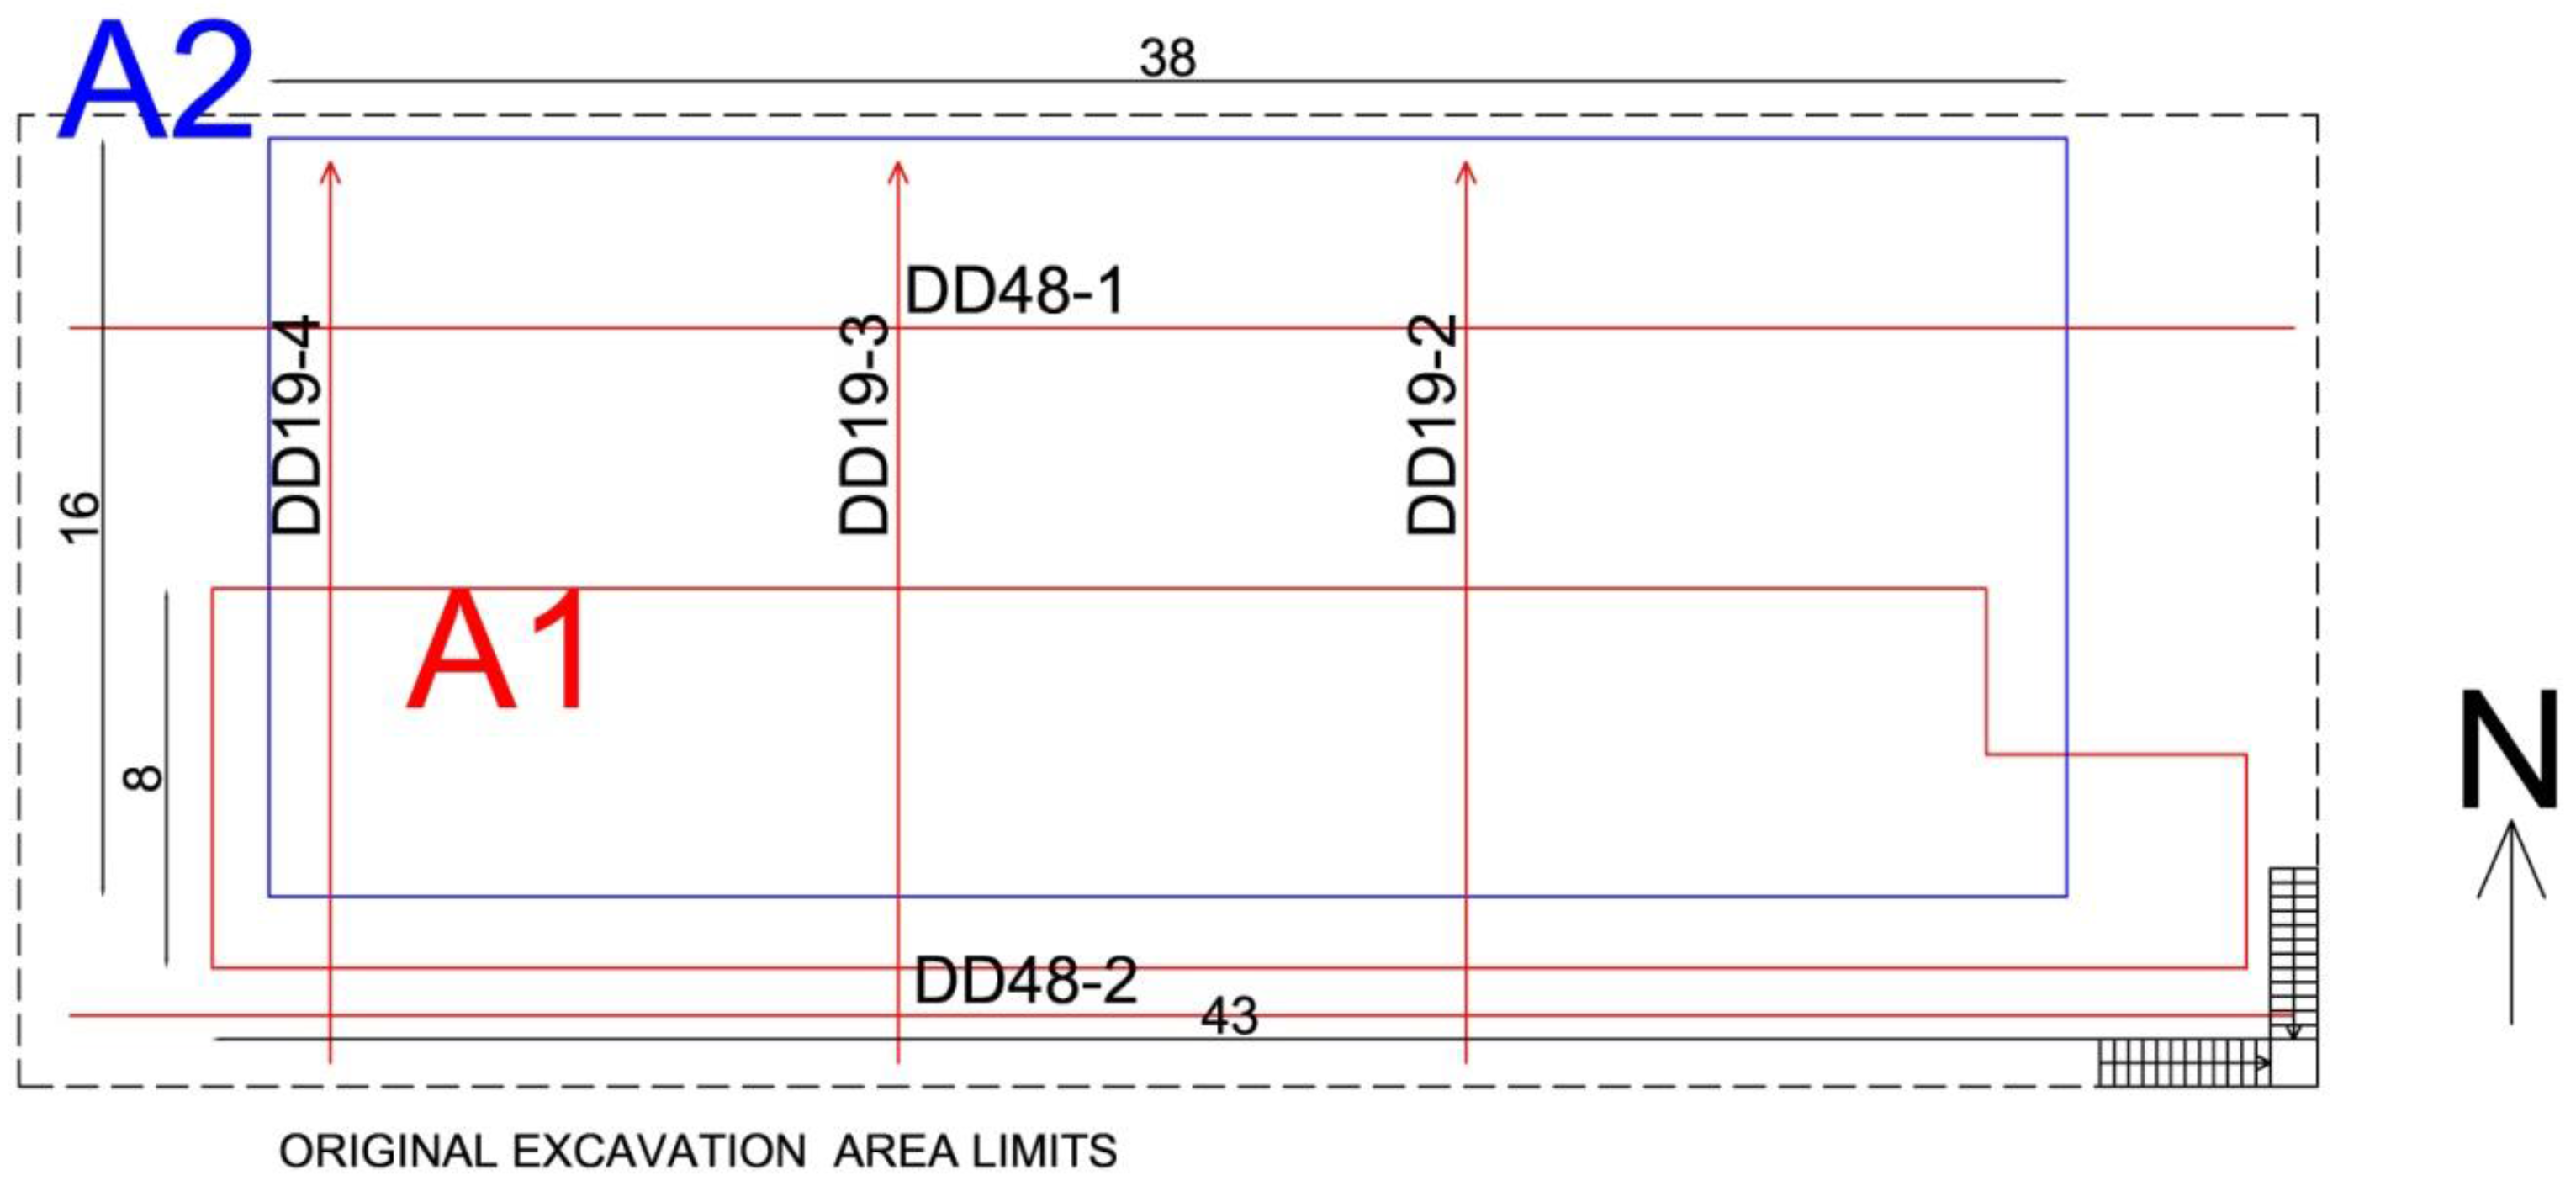
With this array the investigated surface has been A1 rectangle of 8 × 37.5 m (see
Figure 3) which covered half of the area to be excavated, due to the presence of stones and other building materials which constrained the GPR prospecting. GPR surveys were carried out using a reference grid where the distance from each line was 50 cm and the investigations were made along the greater direction. After removal of the demolition material several acquisitions with a 100 MHz antenna were also made covering the greater surface A2 (see
Figure 3) dragging the antenna along the only the main direction fixing a time window of 230 ns and increasing the samples per scan to 1024. The area was finally investigated with ERTs placed as showed in
Figure 3 (about ERT data acquisition see
Section 3.2.2).
The quality of the raw data required an appropriate processing for improving the signal noise ratio and making the interpretation easier. Therefore, the data were processed using standard two-dimensional processing techniques by means of the Reflex-W software [
31]. The acquired data were used to obtain accurate 3D models of the subsurface at different frequencies to image buried structures expected similar as those unearthed in the adjacent excavated area (indicated A in
Figure 1d,e).
The processing steps are summarized as follows:
- (1)
amplitude normalisation aimed at de-clipping saturated traces by means of a polynomial interpolation procedure (the normalization is made on the mean amplitude value of the complete profile);
- (2)
dewow filter used to eliminate a possible low frequency part of the signal;
- (3)
background removal consisting in summing all the amplitudes of reflections that were recorded at the same time along a profile divided by the number of traces summed. The result is an average of all background noise which has been subtracted from the data;
- (4)
energy decay based on a mean amplitude decay curve determined from all existing traces;
- (5)
declipping to reduce too high amplitudes values;
- (6)
a bandpass frequency filter to reduce the increase of noise affecting the radargram caused by the gain function previously adopted;
- (7)
Kirchhoff 2D-velocity migration with a velocity estimated quantitatively using the diffraction hyperbolas generated by potential archaeological features [
4,
25].
No topographic correction was applied because the surface topography was almost flat.
After these steps, a 3D model was built interpolating data of the processed 2D-lines. A linear interpolation was made analyzing an area equal to 1.5 times the minimum distance between the radargrams. Then the envelope of each trace of the 3D-file was calculated and showed in horizontal depth slices where the greater amplitude was highlighted to identify archaeological features [
32].
3.2.2. ERT Data Acquisition and Processing
In the present study, ERT investigation was performed by using a Super sting AGI R8 system. Five ERT profiles (DD48_2, DD19_1, DD19_2, DD19_3 and DD19_4, see
Figure 3 for location) were acquired with an electrode spacing of 1 m in order to have a good compromise between investigation depth and spatial resolution. Among all the available electrode arrangements, the acquisitions were performed with the classic dipole-dipole (D-D) array which generally provides a good lateral resolution [
33]. The number of electrodes used for profiles DD48_1 and DD48_2 was 48 laid out along a W-E profiles. Profiles DD19_2, DD19_3 and DD19_4 were acquired by using 20 electrodes deployed in the S-N direction (red arrows in
Figure 3).
The quality of the data acquired was good and only few obvious outliers were removed before running the inversion. The resistivity of each dataset were inverted using RES2DINV (Geotomo Software, [
34]). Due to the flatness of the investigated areas, no topographic information were included in the inversion process. After data rejection, the percentage error associated to the geoelectrical investigation are: for DD48_1 2.61%, for DD48_2 2.64%, for DD19_2 1.59%, for DD19_3 2.51%, and for DD19_4 1.52%.
3.3. Laser Scanner Survey
Laser scanning is an active geometric sensing technique capable to collect vast amounts of points with high resolution within a short amount of time. This made it a very popular tool for documenting monuments and archaeological areas.
In Kaifeng the survey of rammed earth remains excavated by archaeologists was performed by using VZ-400 laser scanner of Riegl Company (see
Figure 4 middle). The 3D laser-point cloud data of the archaeological excavation region was captured. It includes surface points and relic points which were used for building 3D model of the archaeological excavation layer surface. Six scan stations were set to capture the point cloud data of whole archaeological site. The resolution of laser-point cloud data was 0.005 m to obtain a detailed 3D model useful to compare unearthed archaeological remains with geophysical results.
The laser-point clouds were processed using the following steps:
- (1)
Coordinate matching. The coordinate of base station point cloud was transformed into the coordinates of archaeological excavation by using control point target.
- (2)
Point cloud registration. The point cloud of other scan stations was automatic registered to base station coordinates by using the same points.
- (3)
Point cloud data filtering. The useless points were deleted from the 3D laser-point cloud model.
- (4)
Surface model building. The 3D model of archaeological excavation layer surface was built by the remaining useful point clouds. The 3D model provided the detailed spatial information of archaeological layers and relics.
4. Results and Discussion
This paragraph shows and discusses the results obtained from the GPR and ERT prospection.
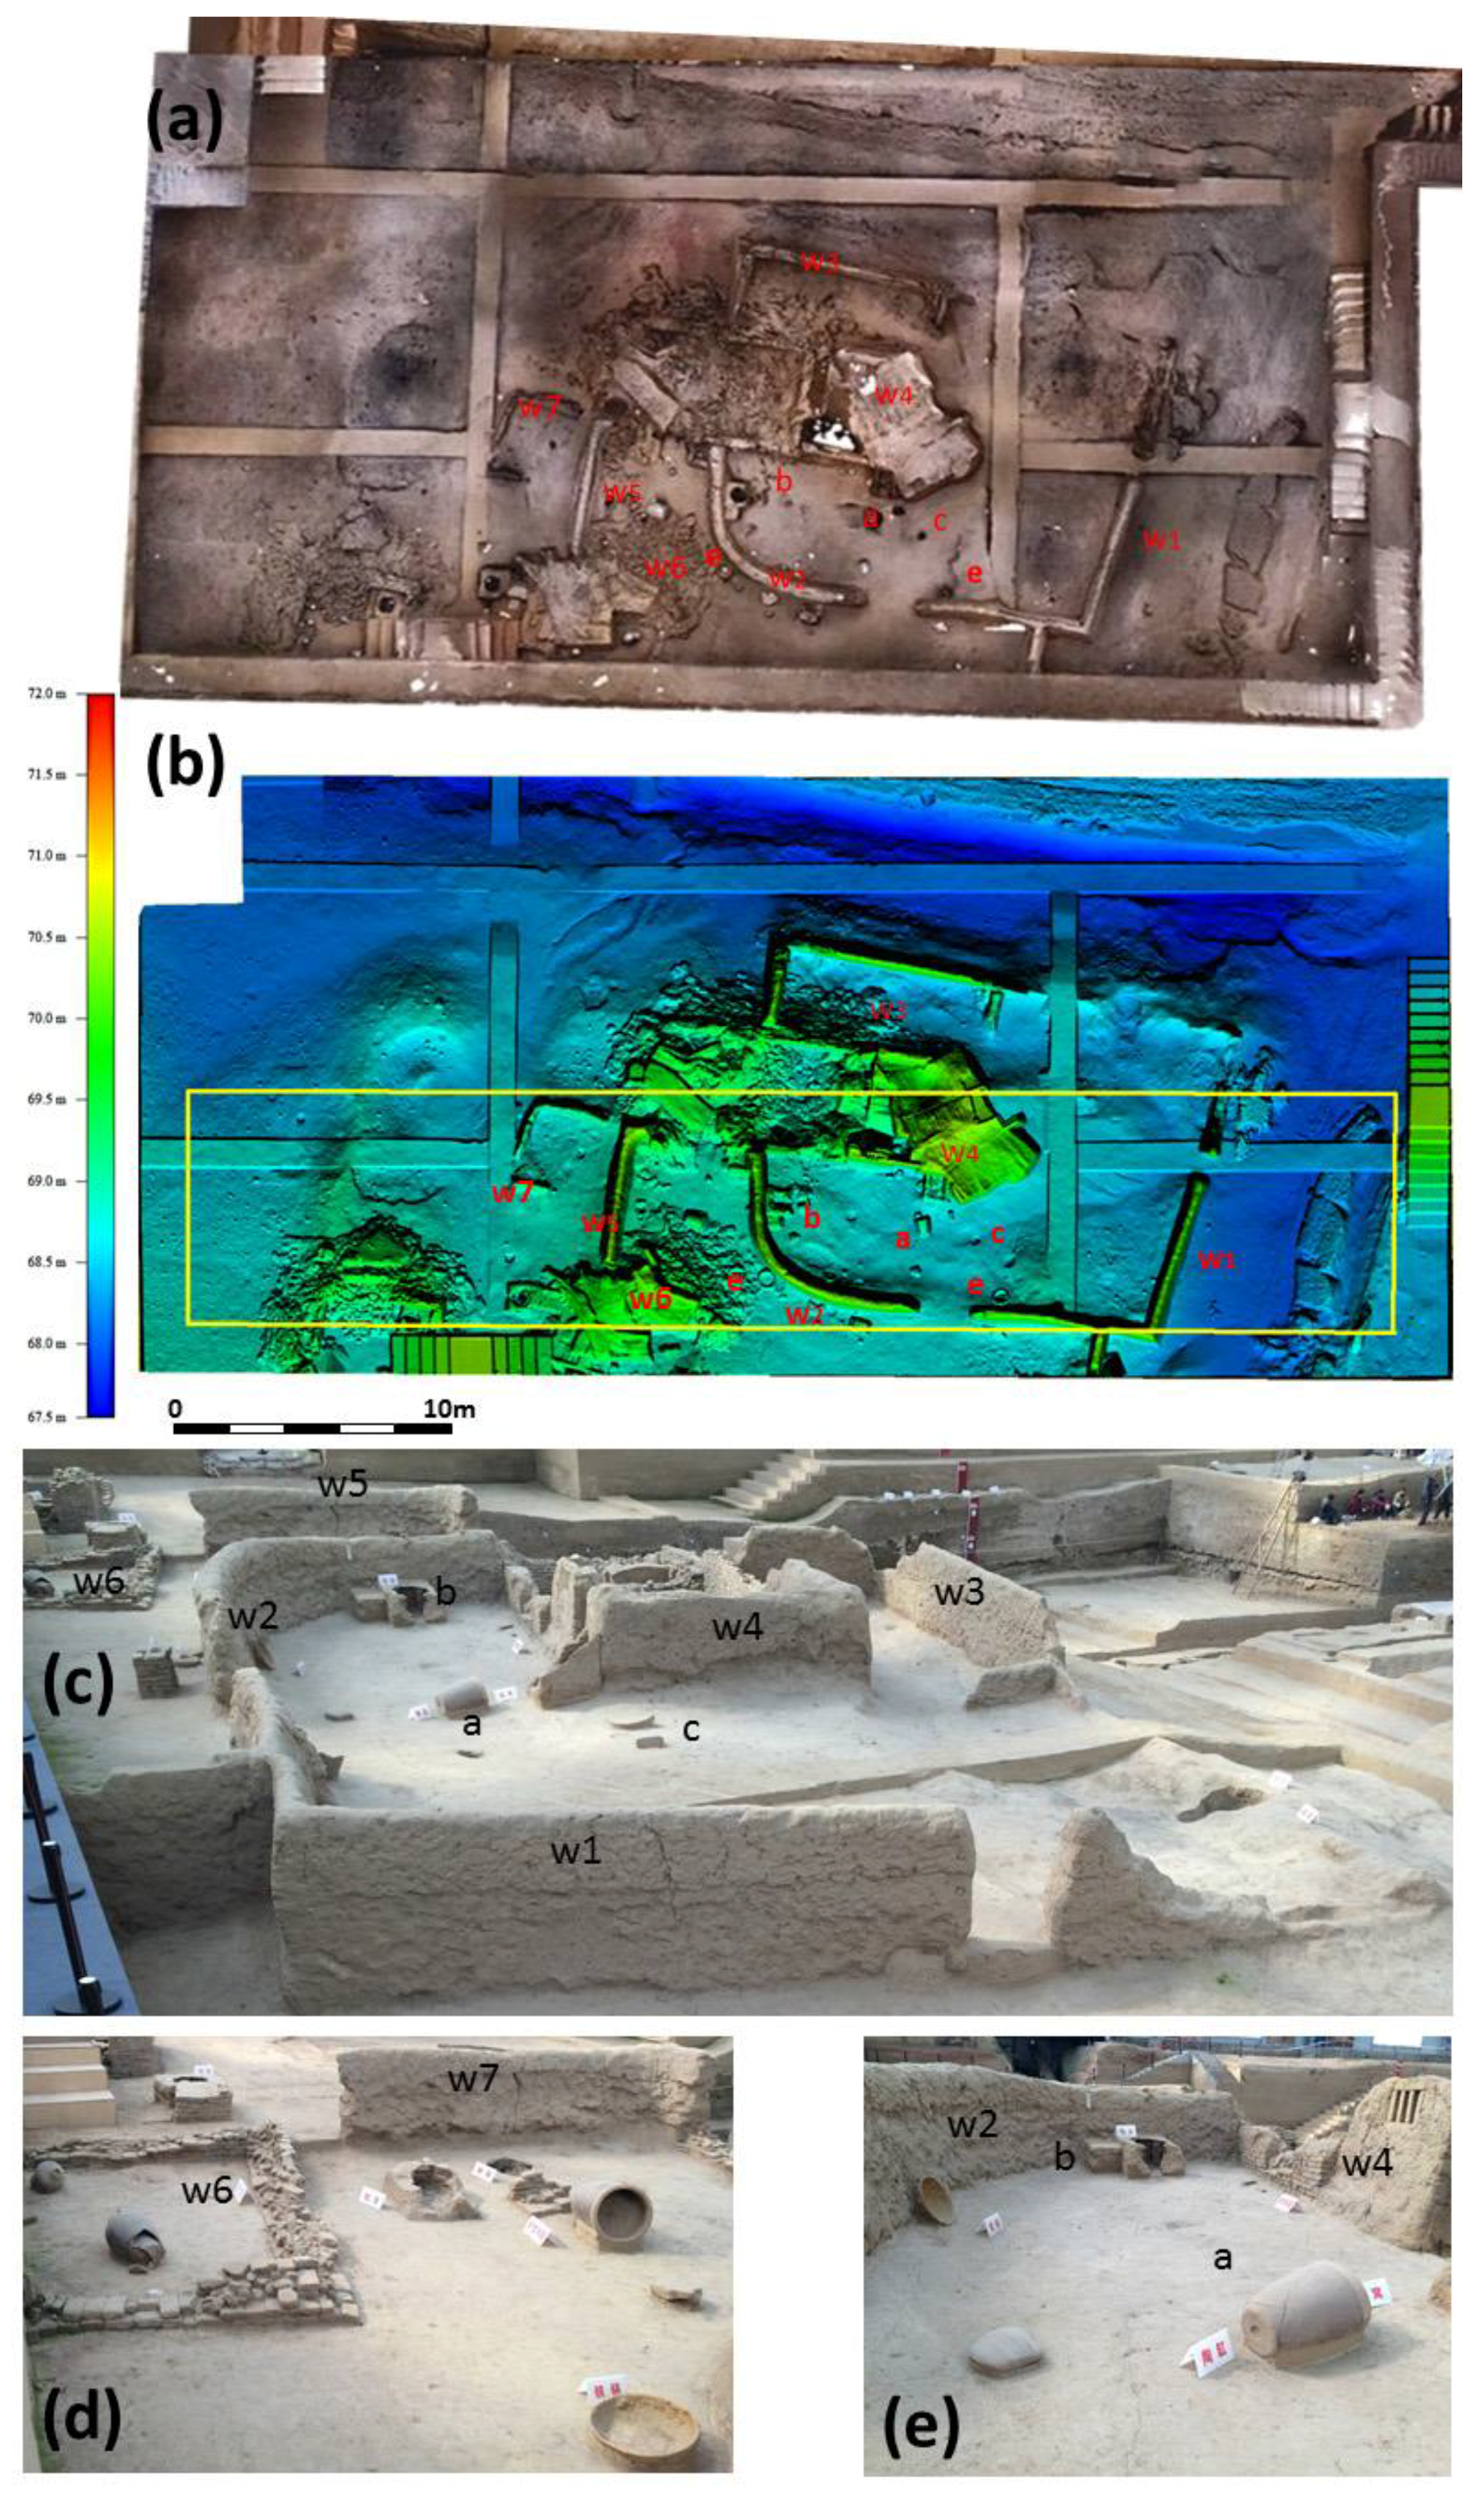
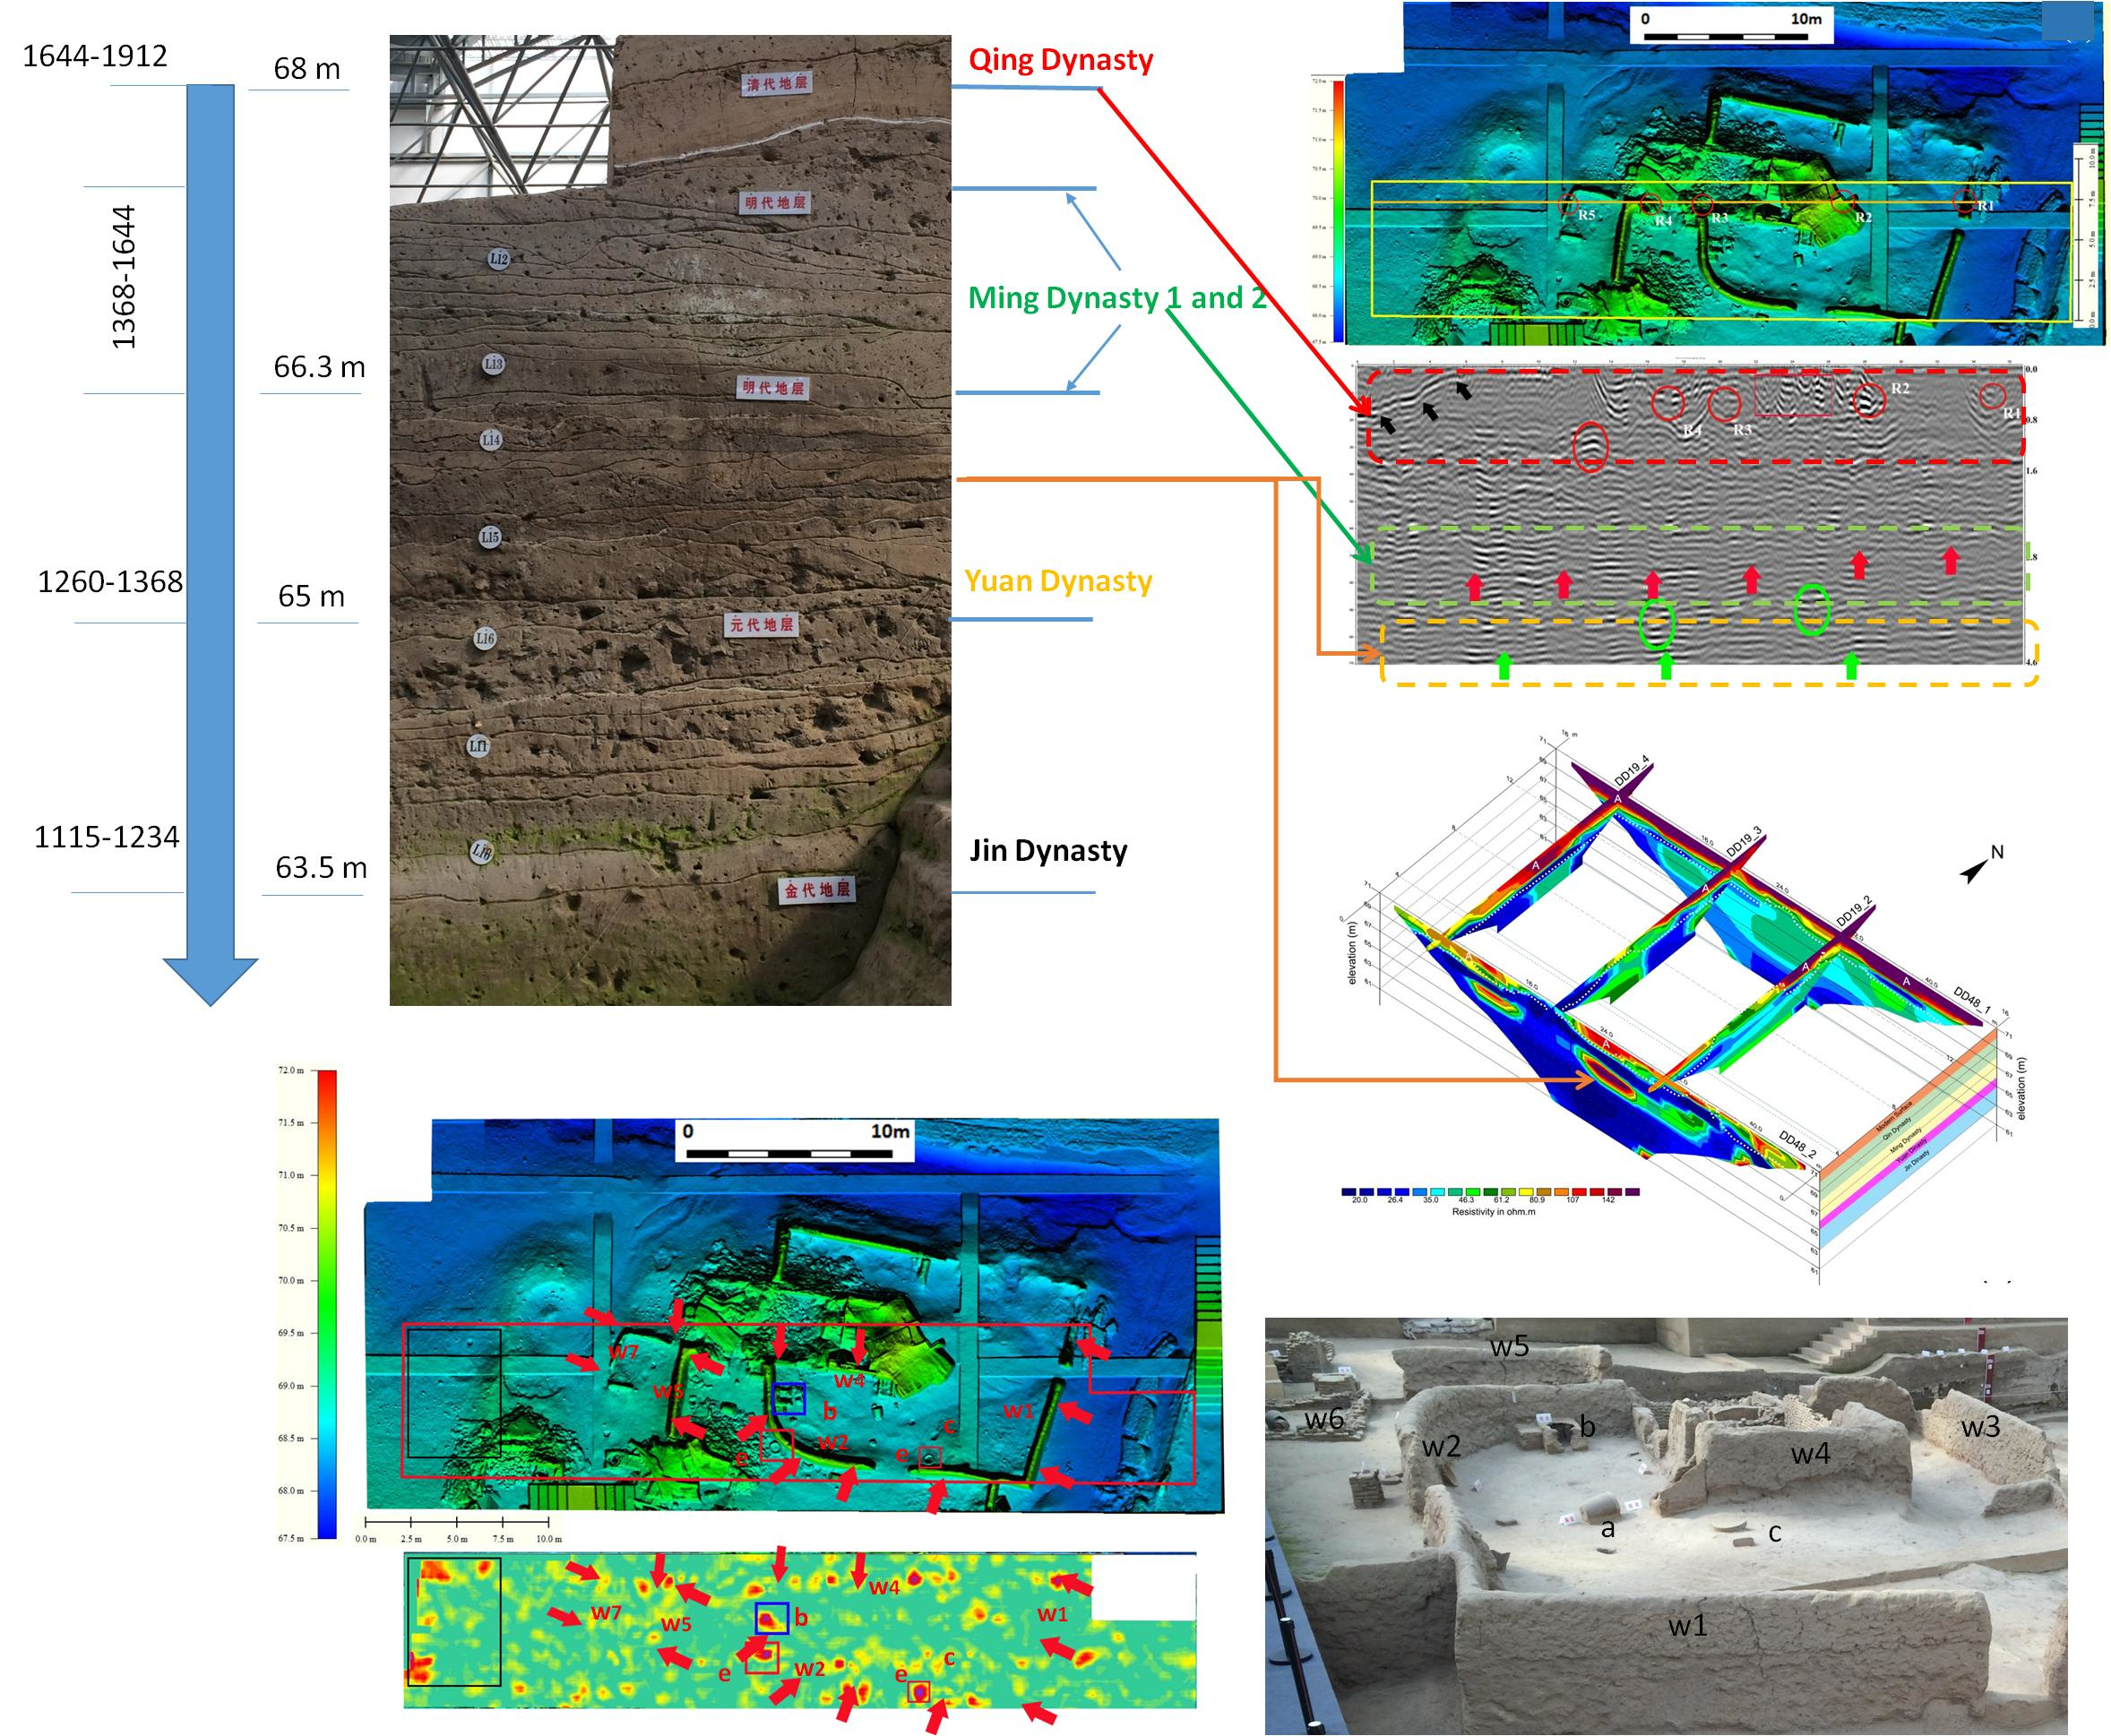
The orthophoto and the DEM, provided by laser scanning survey (
Figure 4a,b), documents the remains (unearthed by archaeologists). They consist of a quadrangular fence with a rounded corner, composed of rammed earth walls (see w1 to w7 in
Figure 4c–e), including an internal division. This fence is very similar to that found in the adjacent excavation (see A in
Figure 1d,e) and is dated to Qing dynasty (1644–1912). Other walls bordering smaller rooms are connected to the southwest corner of the fence. Finally a rich amount of pottery, an iron vessel, an oven and a millstone were found (see
Figure 4a–c,e).
GPR results were mainly analyzed: (1) as comparative feedback respect to archaeological remains unearthed after the geophysical investigations; (2) to detect further archaeological features located under the excavation level.
The comparative analysis was carried out for a depth of about 2 m, corresponding to the excavation level. At depths greater than 2 m GPR results were analysed and interpreted to detect features of potential archaeological interest.
Finally, ERT have been analyzed with the aim to characterize the subsoil as well as to identify further anthropogenic layers.
4.1. Comparison Feedback between GPR Survey and Excavated Archaeological Remains Dated to Qin Dynasty
Most of the unearthed findings (see
Figure 4), dated to Qing Dynasty, consist of walls, pottery, and residual materials of collapsed walls which, along with pavement or other artifacts (an oven, a millstone), are the possible causes of radar wave reflections. The comparative feedback has been made by analyzing radargrams acquired by antennas at 100, 200 and 600 MHz.
In particular,
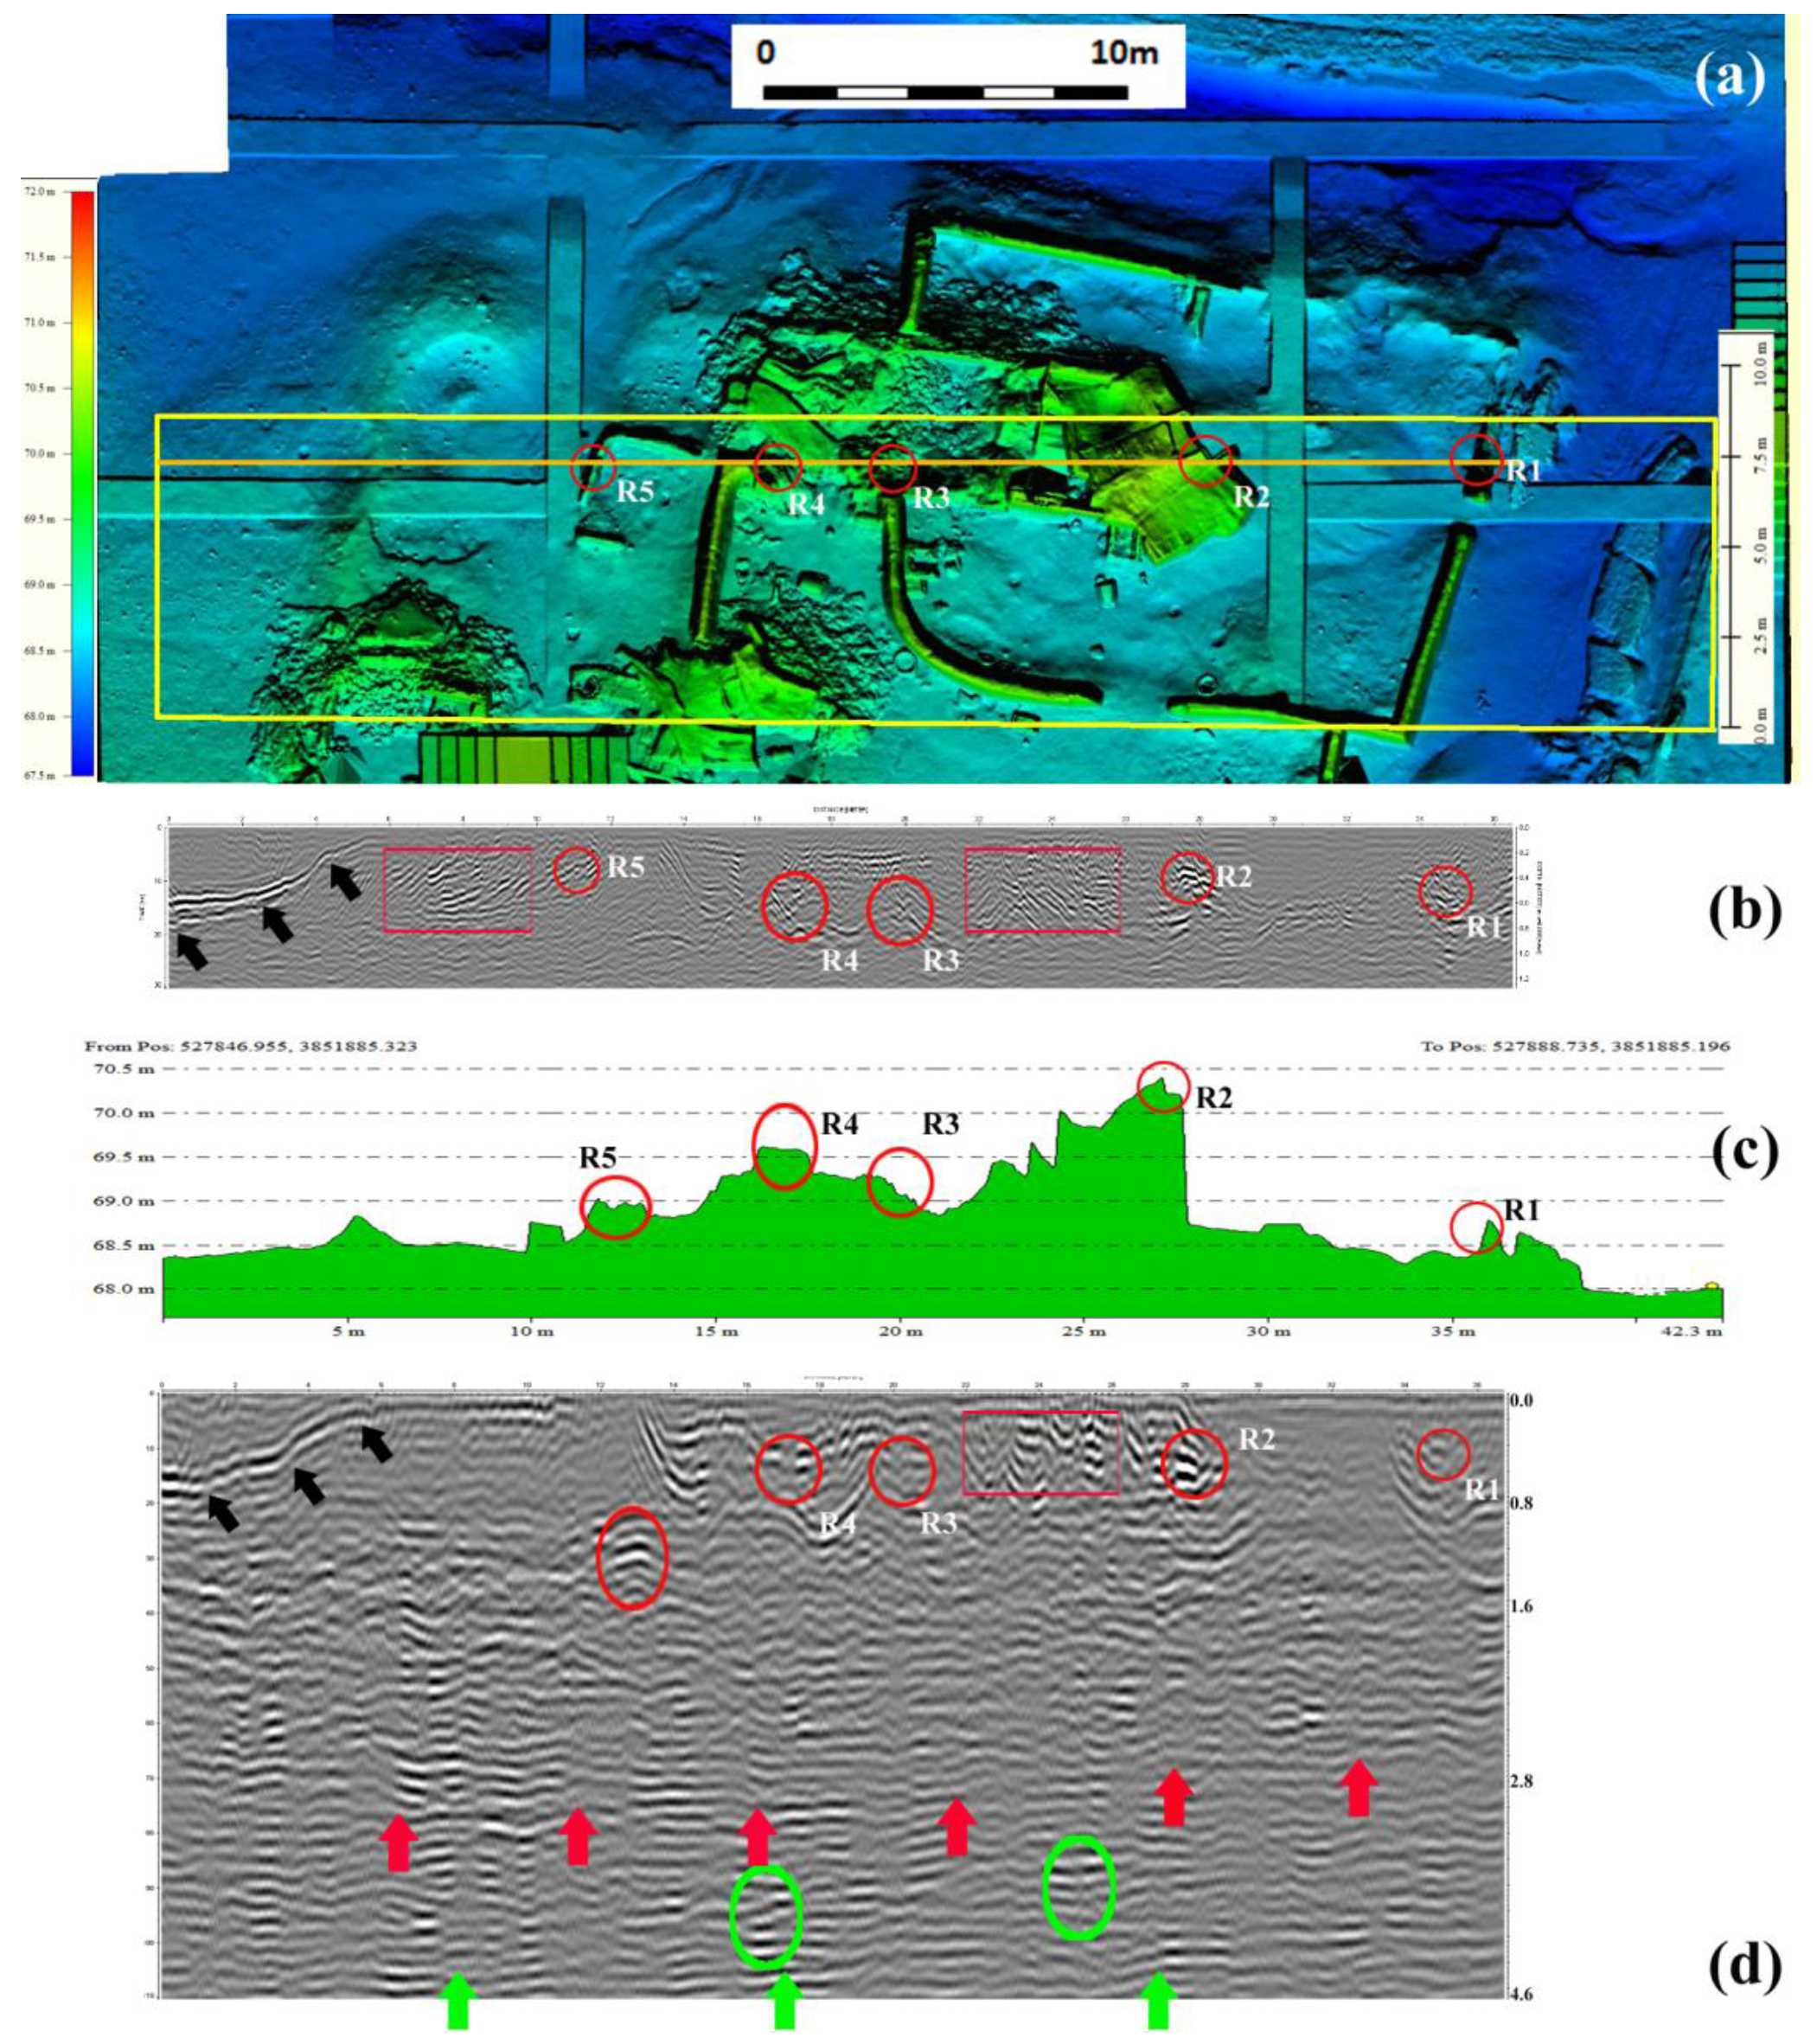
Figure 5 allows the comparison of GPR results with archaeological findings along the investigated profile at 7 m from the origin of the prospection. In upper position of the
Figure 5a, there is the DEM with indication of possible reflectors (R1 to R5), better visible from the profile in
Figure 5c. The migrated radargram (
Figure 5b), acquired by 600 MHz frequency antenna, evidences a number of reflections, some of them are due to reflections caused by walls of the fence (R1, R2 and R5 in
Figure 5c). Other reflections are scattered by a concentration of pottery (R3) and chaotic residues of walls (R4) likely demolished or destroyed by flood. An interface on the left referable to a floor (denoted by black arrows) is also visible.
The radargram acquired by 200 MHz antenna (
Figure 5d) allows the identification of the same reflection features as those obtained by the 600 MHz antenna, but with a minor detail. Furthermore, this radargram puts in evidence continuous reflectances referable surfaces or floor of Qing and Ming Dynasty at around 2.6–3.0 m and 4.5 m, respectively. Some other local reflectors could be found at about 4 m of depth (indicated with green ellipses).
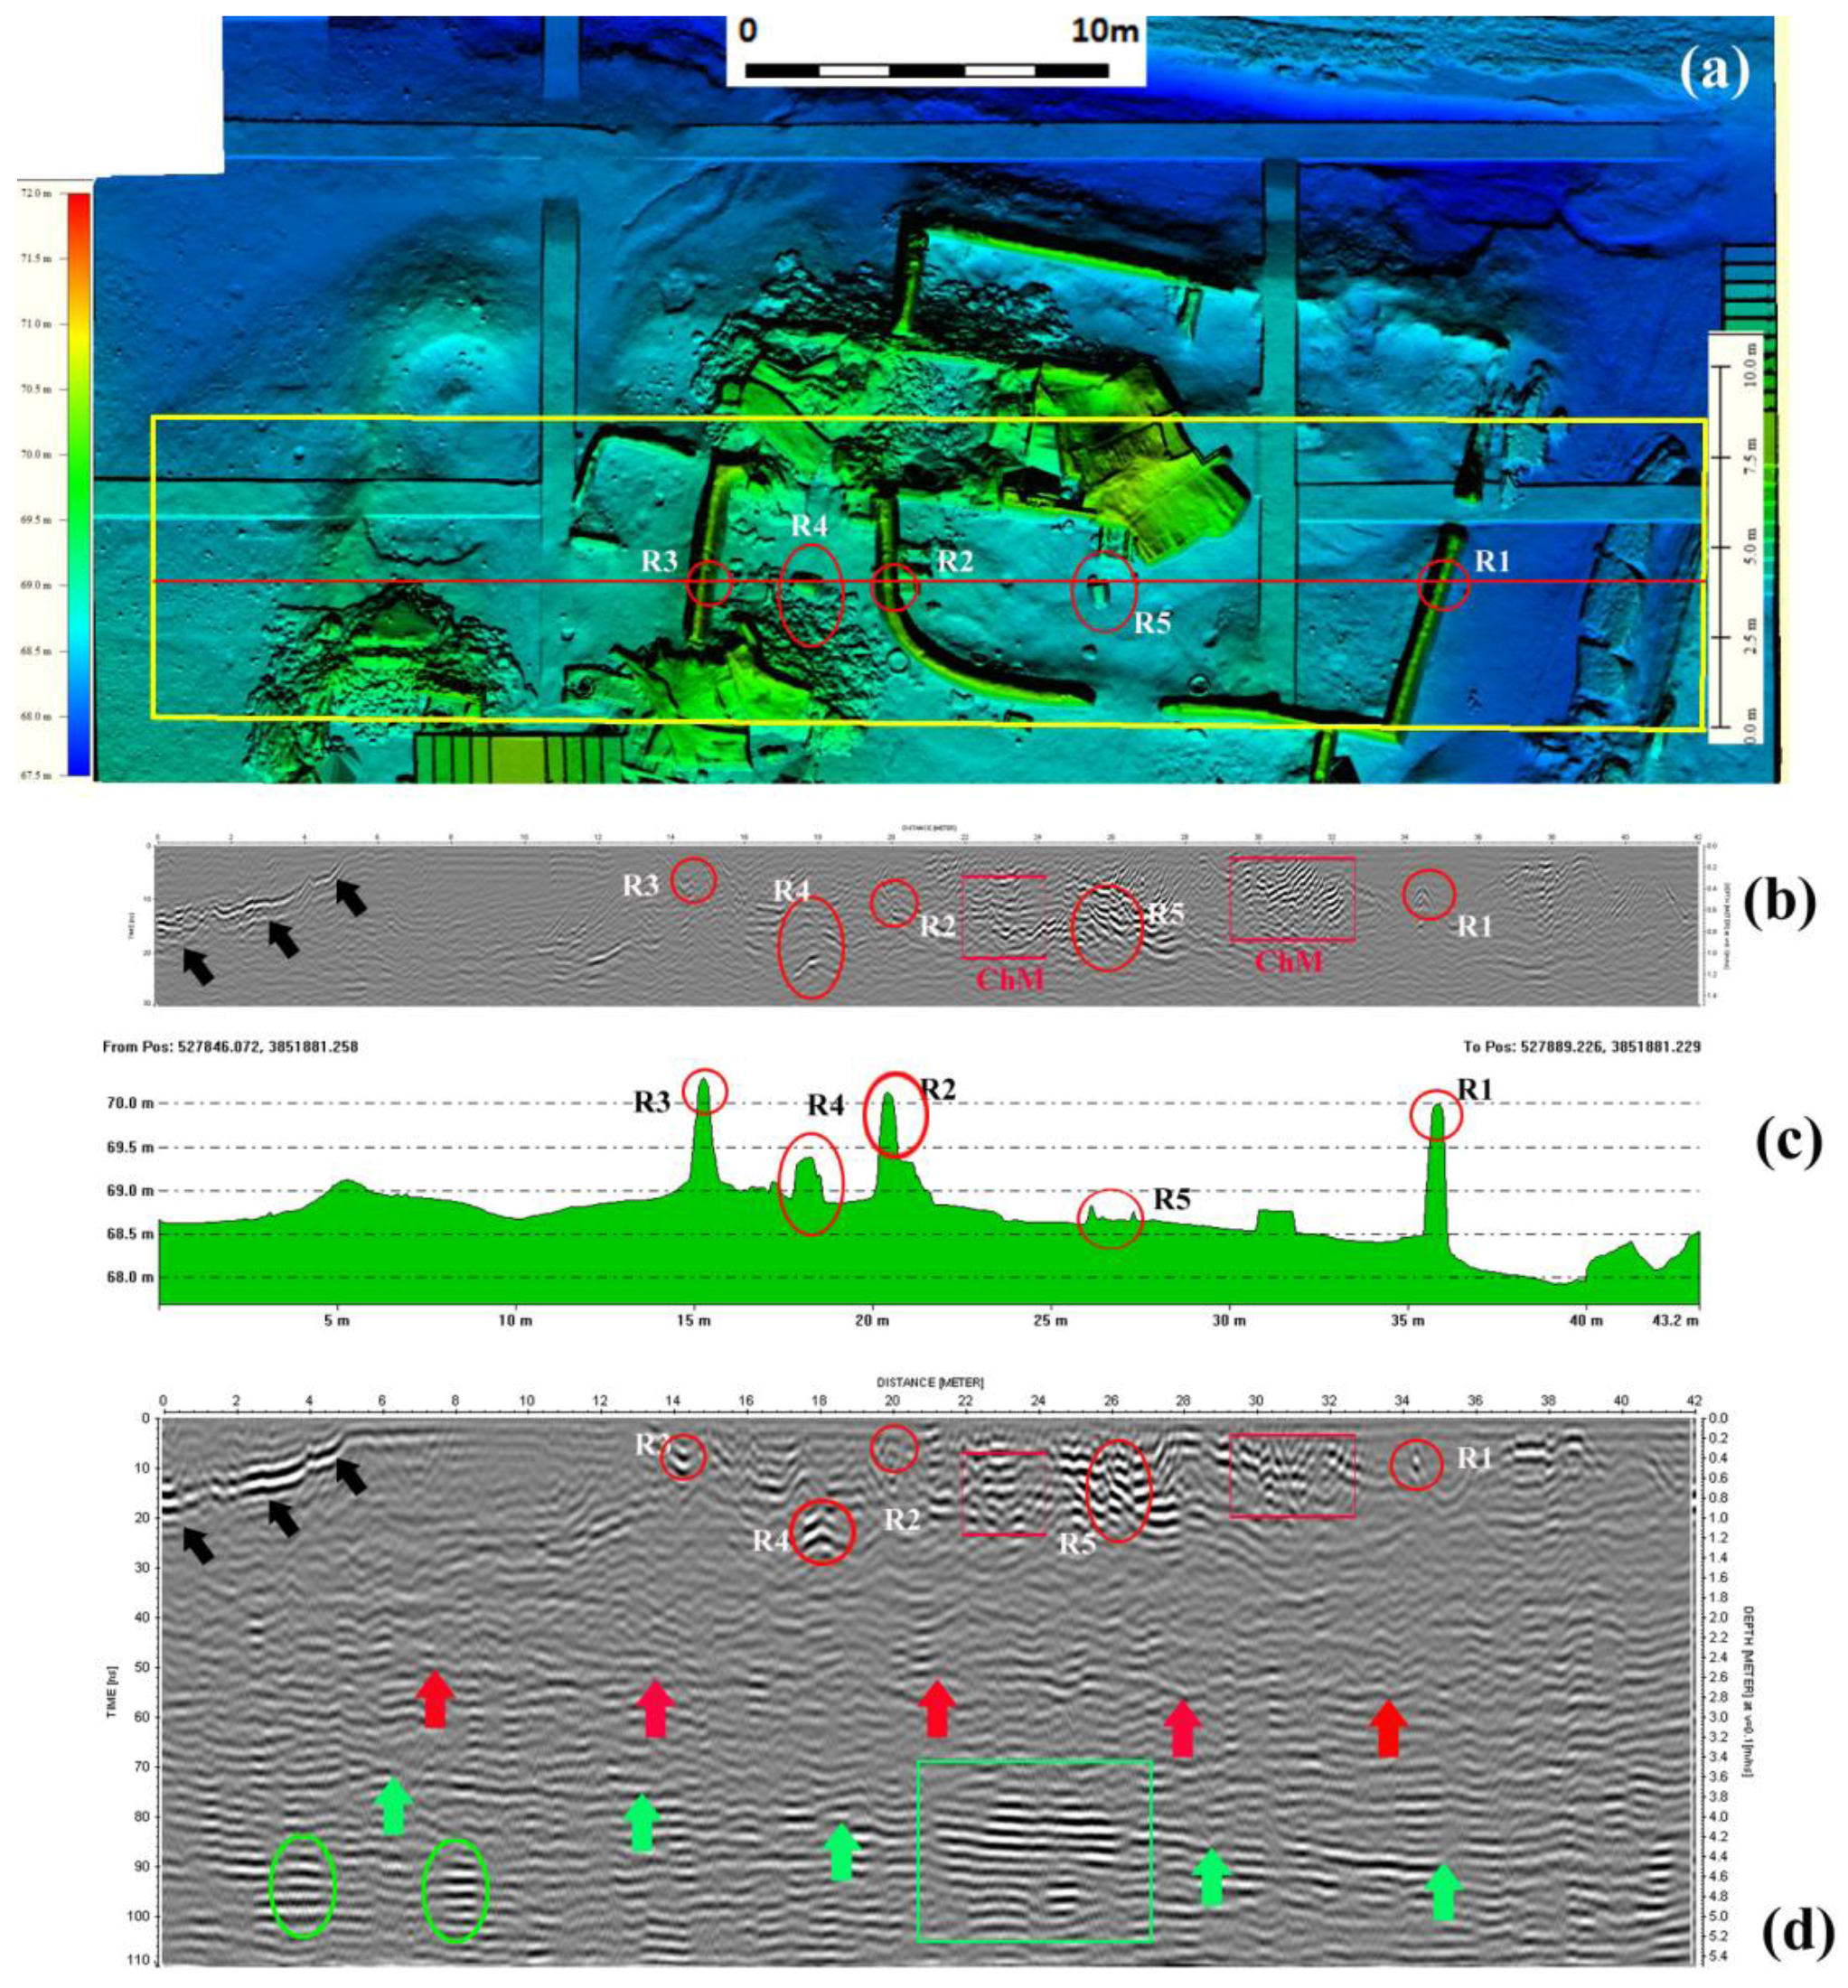
Figure 6 are related to GPR prospection acquired at 4 m abscissa from the origin.
Figure 6b show the migrated radargram at 600 MHz which exhibits reflections (
Figure 6b) which well fit with archaeological remains, including the walls (indicated with R1, R2, R3 and R5), pottery and remains of a collapsed wall (R4). The radargram acquired by using 200 MHz frequency antenna (
Figure 6d) exhibits most of the reflections observed at 600 MHz. Furthermore, it evidences two reflectance surfaces referable to floor of Qing and Ming Dynasty (see red and green arrows, in
Figure 6d, respectively).
Although GPR reflectors observed in the radargrams well fit with archaeological remains (see
Figure 5 and
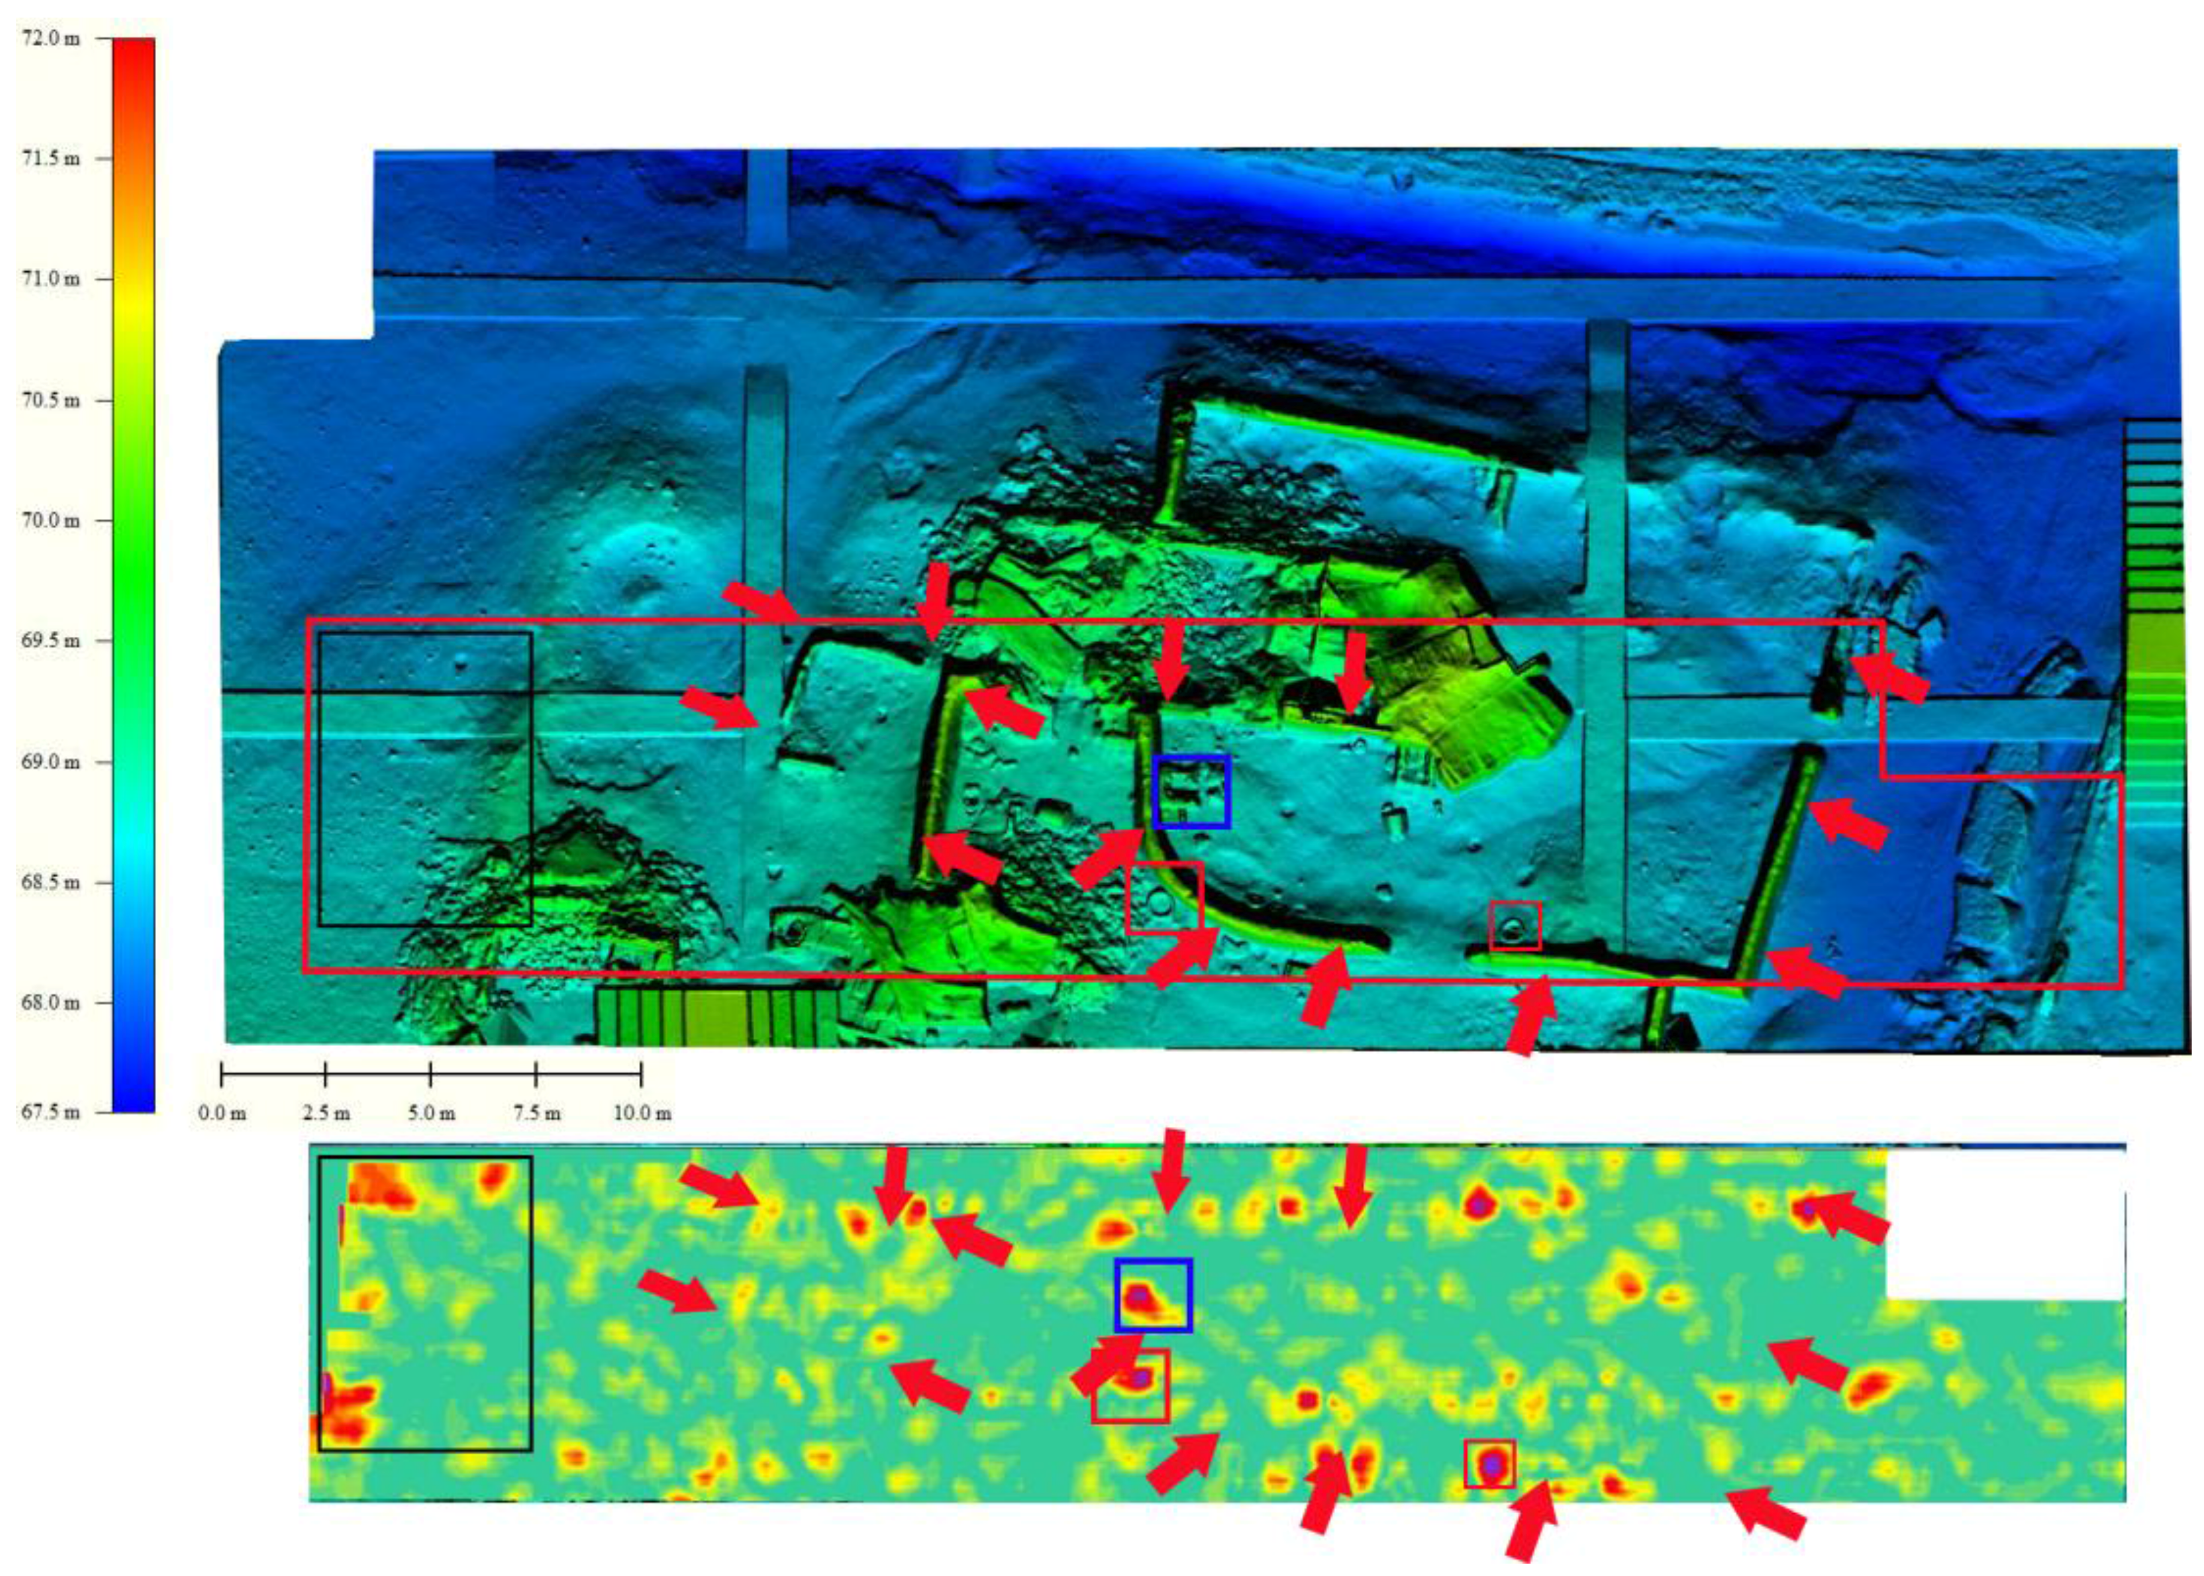
Figure 6), the time slices are less informative (
Figure 7). Only a few alignments of GPR amplitude are noticeable (red dotted lines) in depth slices. This is due to the fact that in Kaifeng the archaeological structures and the soil covering them have similar physical characteristics, therefore, the targets (buried walls) do not reflect in a homogeneous way. So, it is reasonable to argue that only in some parts of the rammed earth walls the dielectrical value is significantly different respect to its surrounding to cause a high amplitude value but not enough to reveal the ‘geometry’ of the same walls due to the large lacunae. Moreover, the presence of chaotic material, residues of collapsed walls, cover the structures investigated by GPR; thus reducing the possibility to extract the linear features related to walls.
Figure 7 clearly evidences high amplitude values corresponding to strong reflectors such as an oven and two iron vessels.
Finally, some GPR amplitude anomalies do not refer to features of archaeological interest but to scattered materials due to collapsed structures. Some of them where removed after the excavation and before the laser scanner survey
4.2. GPR and ERT for the Identification of Archaeological Features below the Excavated Area
The archaeological stratigraphy, showed in
Figure 2, puts in evidence the presence of diverse historical phases dated from Qing (1644–1912) to Jin Dynasty (1115–1234). The excavations only investigated the Qin Dynasty layer at around 68 m asl. To image deeper potential cultural layers, ERT and lower frequency GPR (100 MHz) were conducted considering that radargrams acquired using the 200 MHz antenna put also in evidence reflectors referable to possible anthropogenic layers at around 4.5 m (see
Figure 5d and
Figure 6d).
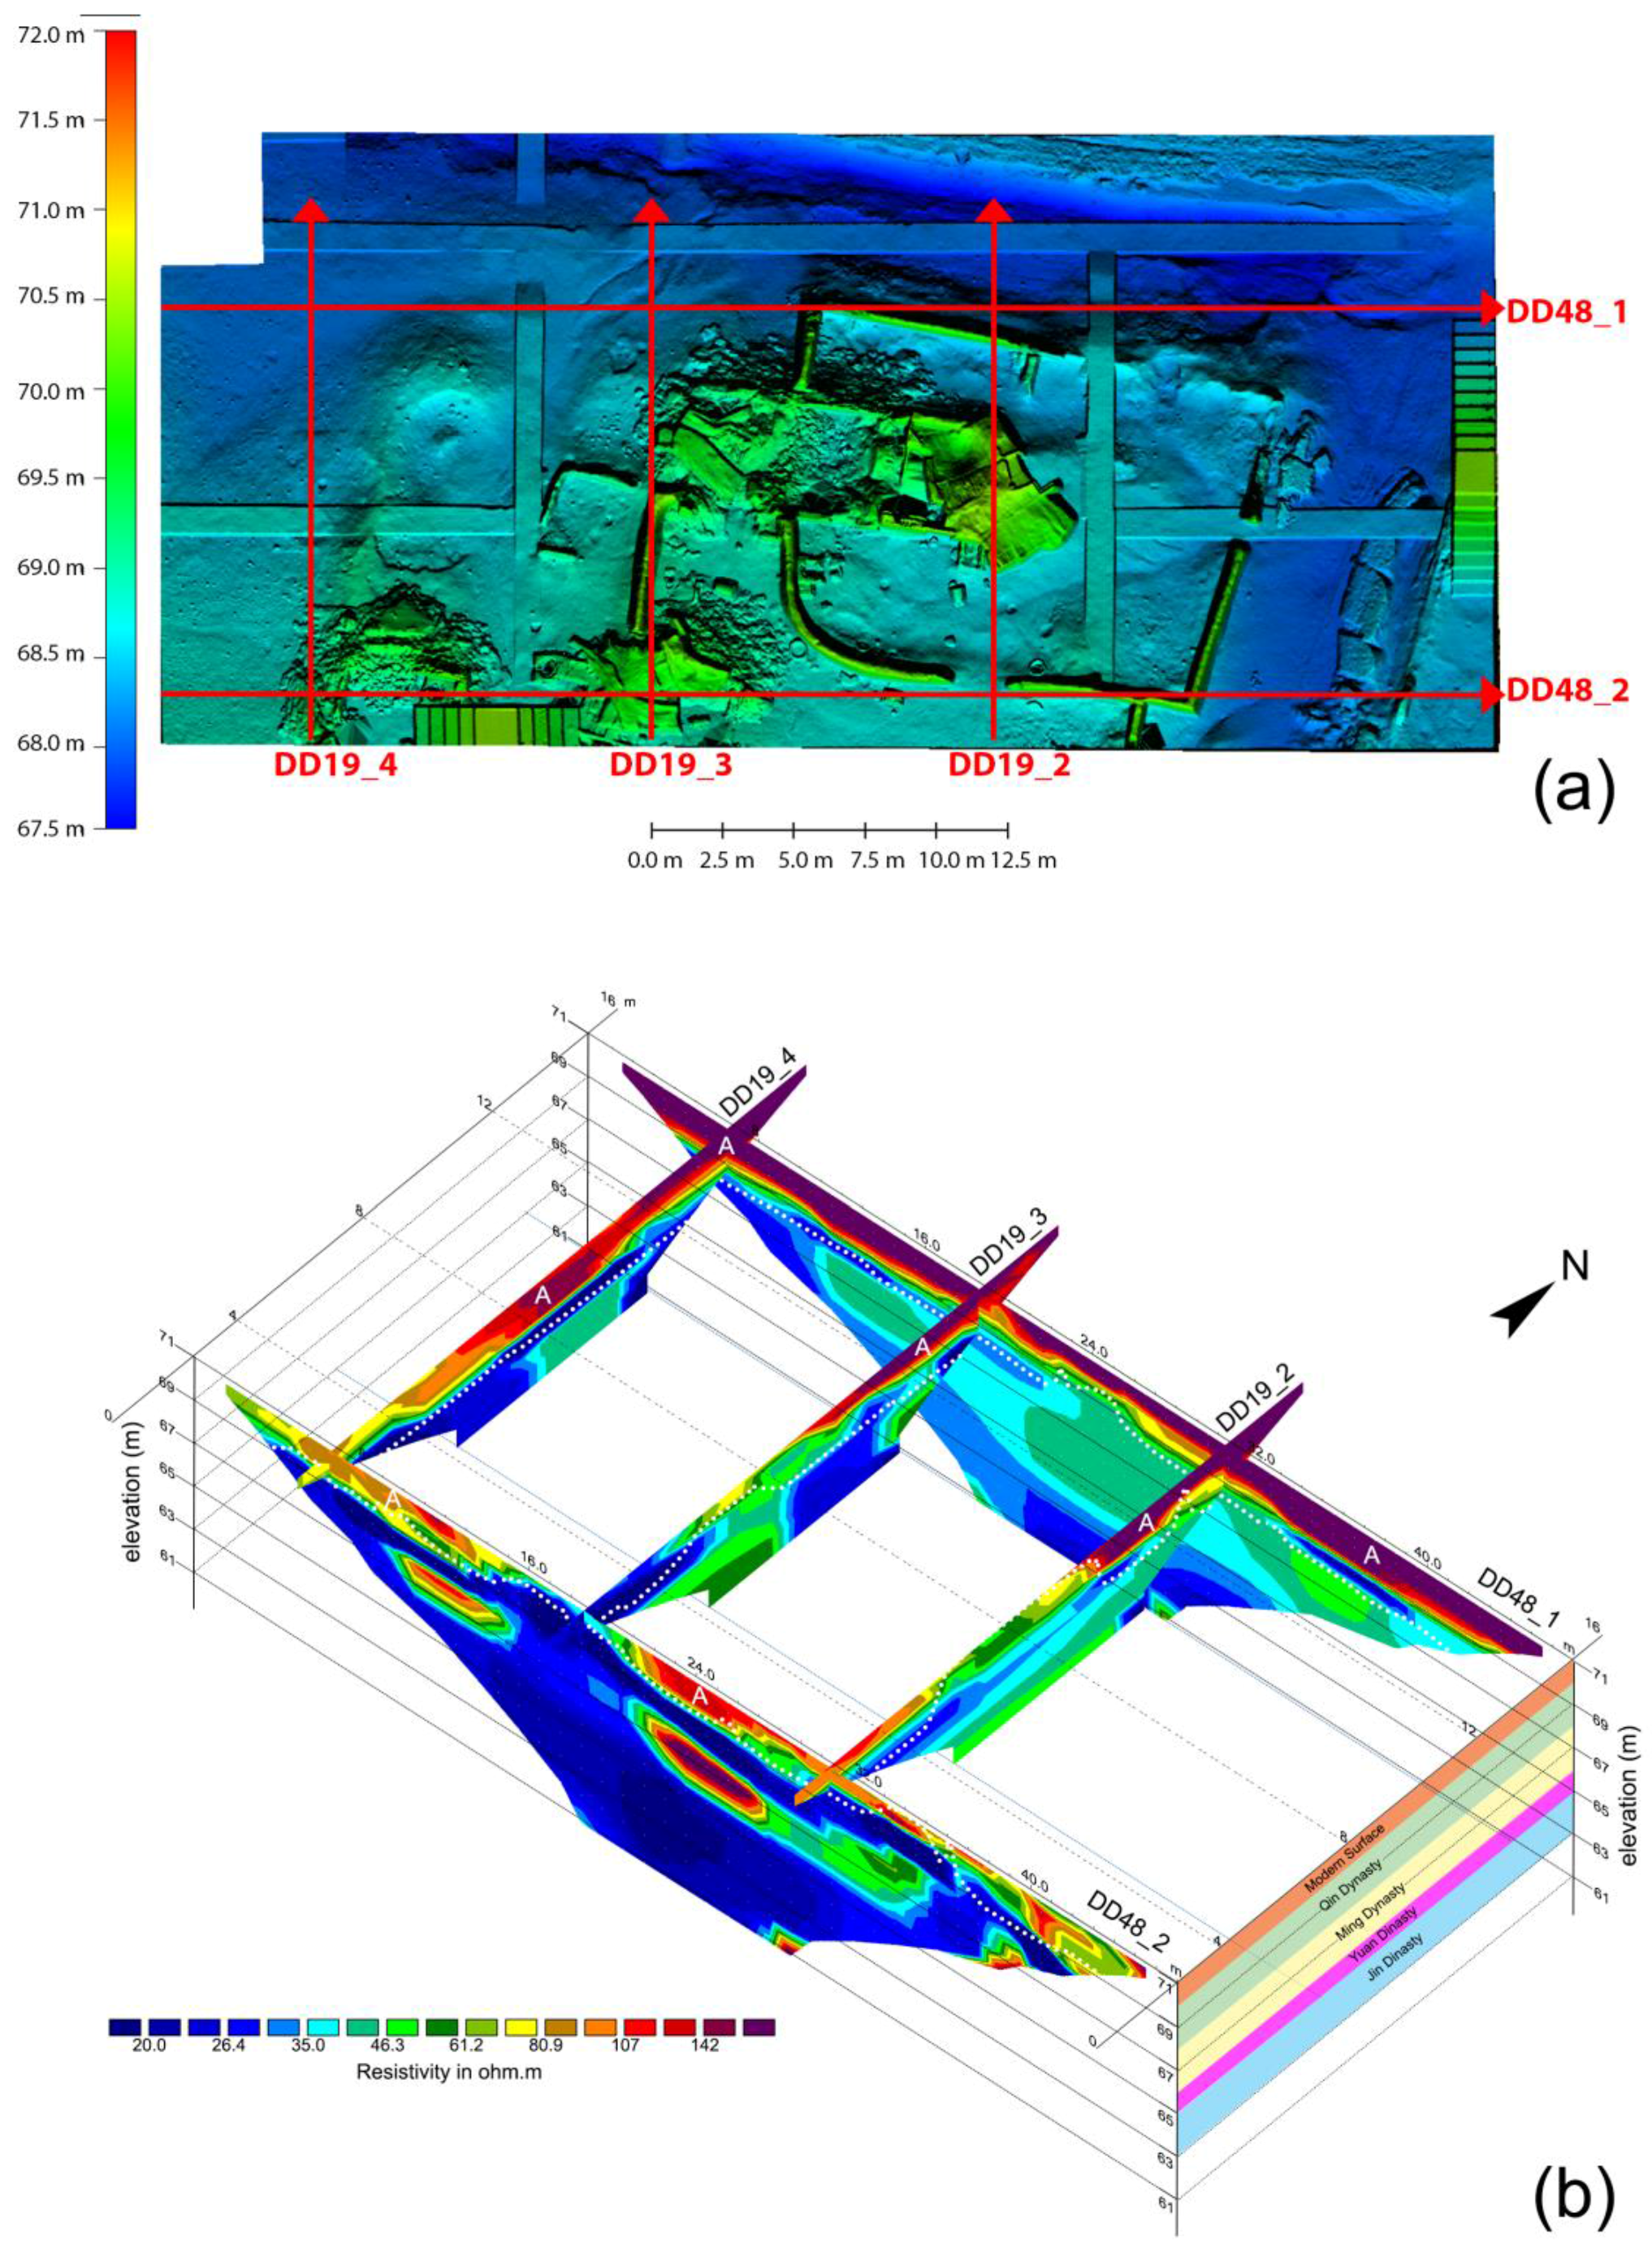
We start the discussion of the results of ERT investigations (
Figure 8) conducted on area A2 (see
Figure 3) which includes A1 and the excavated area. The root mean square error associated to each ERT section is good and, generally, lower than 2.60%. The investigation depth varies from 10 m (for DD48_1 and DD48_2) to 5 m (for DD19_2-4). Where the profiles intersect each other a good fit of the two ERTs can be found and the spatial continuity of the electrical resistivity anomalies can be easily inferred.
In particular, it is clearly visible a shallow resistive layer (marked in
Figure 8b as zone “A”), which extends from the surface to around 2.5 m depth, and, therefore, covering the anthropogenic layer excavated by archaeologists. The resistivity values of this layer tend to increase moving from South to North.
From 2.5 to 3.5 m of depth a more conductive layer is evident, straightforwardly detectable in DD48_2, DD19_2 and DD19_4. Considering the homogeneity of the materials composing the shallow strata of the subsoil (confirmed by the excavations), the directional increase of resistivity can be ascribed to a different level of soil moisture content. The investigated area was, in fact, a rectangular terrace recessed into the ground on three sides (South, West and East) and exposed on the last one. This last side was delimited by an already excavated area whose “free area” was located 2 m below. As a result of this setting, the northern side was more exposed to moisture drainage processes.
Finally from 4 to 6 m (67 to 65 m asl) some resistive bodies could be observed.
In
Figure 8b, it is also shown the topographic level extrapolated from the DEM (white dotted line). Even if the low resolution of ERT does not allow a one-to-one comparison, as it has been done for GPR, with DEM of the excavated layer and the characterization of the shape of possible deeper cultural features, some general consideration can be done:
- (1)
the depth of the excavated area, as shown from the DEM, generally well match with the bottom border of the resistive layer “A”.
- (2)
the most relevant topographic highs of the DEM spatially coincide with discontinuities in the shallow resistive layer “A” (i.e., profile DD19_2 and profile DD48_2).
- (3)
The deeper resistive anomalies, between 67 and 65 m asl may be related to the presence of buried anthropogenic structures. The lateral discontinuity of the anomalies, in fact, allows to exclude any relations with geological features. The archaeological stratigraphy (already shown in
Figure 2), reported on the right of
Figure 8b, makes possible to appreciate the good match between the electrostrata of the ERT profiles and the archaeological cultural layers. Which such respect, it is reasonable to argue that the resistive anthropogenic layers likely date back to Ming and Yuan Dynasty.
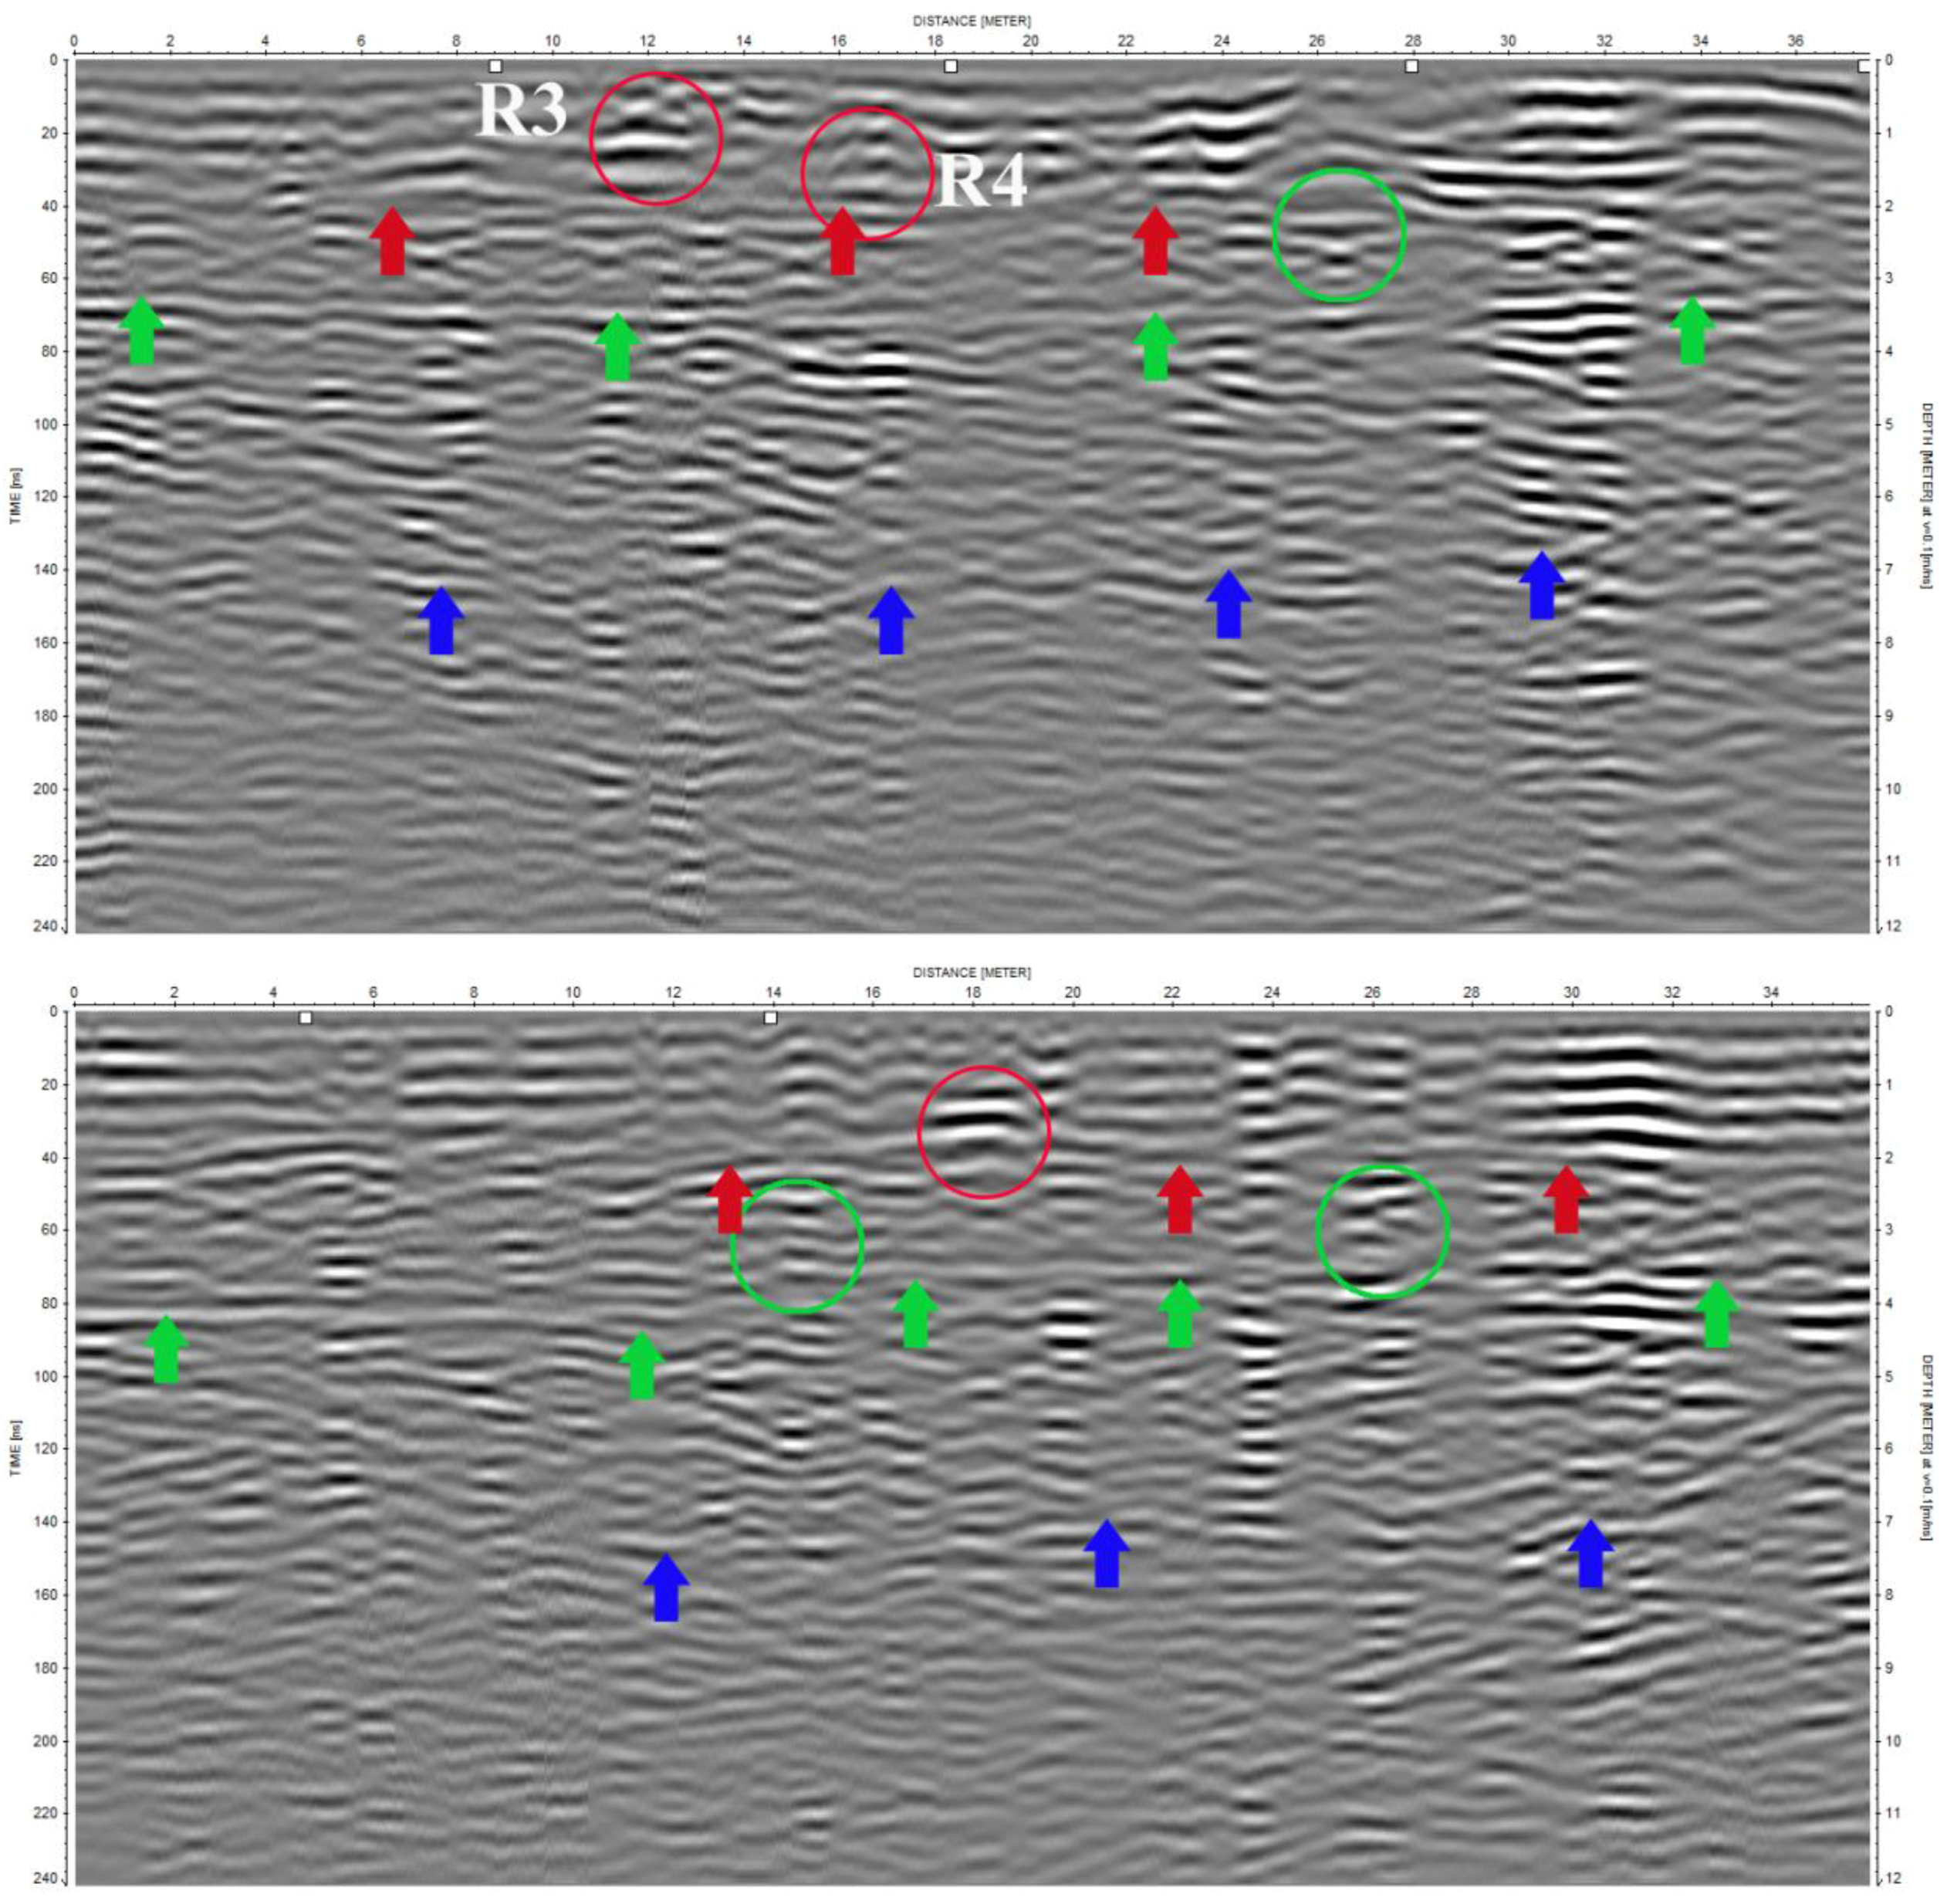
Some results of GPR data acquired at 100 MHz are shown in
Figure 9. They enable us to perform investigations at depths comparable to those made using the geoelectrical method. From
Figure 9 it is possible to clearly identify e.m. anomalies associable to potential anthropogenic layers highlighted from the ERT prospection. Below the shallower layer, approximately ranging between 3 and 7 m, there are a lot of reflections that could be due to the presence of structures belonging to other historical phases.
Three distinct reflecting surfaces or interfaces are recognizable as highlighted with the red, green and blue arrows. They correspond most likely to three distinct archaeological phases. The first, indicated with red arrows, is located at 2 m below the investigated surface (68 m asl) and likely referable to floor dated to Qing Dynasty. The second reflecting surface is located at depth from 3 to 4 m (at 67 and 66 m asl, respectively) and according the archaeological stratigraphy of
Figure 2 could refer to Ming Dynasty phase.
The third and last interface recognizable is between 7 and 8 m below the investigated surface corresponding to 63 and 62 m asl which could refer to Jin Dynasty or an older phase (Northern Song?).
Between these interfaces there are some reflections linked to archaeological structures between 1.5 and 3 m (indicated with red and green circles), consequently likely dating back to Qing and Ming Dynasty.
5. Conclusions and Future Perspectives
Henan has been the cradle of the most important civilizations in China for a long time and the region where more than ten capitals settled. Most of them need to be investigated. All of them have not been excavated up to now, except for small parts as in Luoyang and Kaifeng. The advance in archaeological research in Henan can open new exciting perspectives in the study of ancient Chinese human past.
Most of the ancient capitals settled in the Yellow river drainage basin were strongly affected by repetitive floods and destructions during armed conflicts for conquering the power over time. Therefore, the excavations generally show a long and deep archaeological stratifications ranging from 6 to 12 m [
35]. Moreover, the most common building material consists of rammed earth and wood also used for imperial palaces of the forbidden cities. The high depth of buried remains, the alluvial deposits covering them [
36] and the building materials make the earth observations sciences, including geophysics, a big challenge.
Kaifeng is an emblematic case study due to the presence of several historical phases, from Song to Ming Dynasty, during which played a leading role in the history of Henan and China, and, anytime, it was an important economic and administrative center. The archaeological research in Kaifeng is particularly complex also because it was many times destroyed and rebuilt in the same place. Such issues strongly limited the use of geophysical prospecting in Kaifeng as in general in Henan and in other similar contexts in China, including Shanxi.
This paper deals with our pioneering application in Kaifeng of GPR and ERTfor the detection of rammed earth buried structures covered by alluvial deposit. The area is extremely important for the study of the ancient history of China, in particular during Song Dynasty, when Kaifeng was the imperial capital.
In the context of a Sino-Italian project some geophysical investigations have been carried out with the twofold aims: (1) to provide a contribution for better understanding the presence of buried remains before excavations planned from 0 to 2 m; (2) and to evaluate the applicability of geophysical surveys also for deeper layers.
ERT prospections and GPR surveys acquired at different frequencies (100, 200 and 600 MHz) allowed to maximize the penetration capability and resolution for the detection of cultural features/layers at different depths.
The availability of archaeological stratigraphy suitably discussed with archaeologists enable to exploit the geophysical also for the dating.
In particular, for the first two meters investigated, GPR results at 200 and 600 MHz exhibit a good match with archaeological remains in detail surveyed by laser scanner. With this respect the radargrams provide a better match respect to time slices between georadar results and archaeological remains.
Deeper anthropogenic layers of archaeological interest, reasonably datable from Ming to Jin Dynasty, have been identified by ERT and GPR data acquired at 100 MHz.
The obtained results represent a useful discussion base for archaeologists who will have to decide if: (i) continue to excavate to reach more ancient relics, including the Northern Song one, or (ii) stop preserving the most recent phase.
In conclusion the use of geophysical techniques, including ERT and GPR and a robust knowledge of archaeological records make geophysics a very effective tool for predicting the presence of archaeological remains and for supporting the decisions also in presence of a multi layered and complex site as Xinzheng gate of Kaifeng city walls.


 ,
, 


