Mapping Aboveground Carbon in Oil Palm Plantations Using LiDAR: A Comparison of Tree-Centric versus Area-Based Approaches


1
Forest Ecology and Conservation Group, Department of Plant Sciences, University of Cambridge, Downing Street, Cambridge CB2 3EA, UK
2
Silwood Park Campus, Imperial College London, Buckhusrt Road, Ascot SL5 7PY, UK
3
Department of Zoology, University of Cambridge, Downing Street, Cambridge CB2 3EJ, UK
*
Author to whom correspondence should be addressed.
Remote Sens. 2017, 9(8), 816; https://doi.org/10.3390/rs9080816
Submission received: 19 June 2017
/
Revised: 23 July 2017
/
Accepted: 4 August 2017
/
Published: 9 August 2017
(This article belongs to the Section Forest Remote Sensing)
Abstract
:Southeast Asia is the epicentre of world palm oil production. Plantations in Malaysia have increased 150% in area within the last decade, mostly at the expense of tropical forests. Maps of the aboveground carbon density (ACD) of vegetation generated by remote sensing technologies, such as airborne LiDAR, are vital for quantifying the effects of land use change for greenhouse gas emissions, and many papers have developed methods for mapping forests. However, nobody has yet mapped oil palm ACD from LiDAR. The development of carbon prediction models would open doors to remote monitoring of plantations as part of efforts to make the industry more environmentally sustainable. This paper compares the performance of tree-centric and area-based approaches to mapping ACD in oil palm plantations. We find that an area-based approach gave more accurate estimates of carbon density than tree-centric methods and that the most accurate estimation model includes LiDAR measurements of top-of-canopy height and canopy cover. We show that tree crown segmentation is sensitive to crown density, resulting in less accurate tree density and ACD predictions, but argue that tree-centric approach can nevertheless be useful for monitoring purposes, providing a method to detect, extract and count oil palm trees automatically from images.
1. Introduction
Southeast Asia has been the epicentre of the oil palm industry for over 50 years [1]. Oil palm is one of the most profitable land uses in the humid tropics [2]. Malaysia has increased its planted area by 150% over the last decade [3] and, along with Indonesia, currently represents over 80% of global palm oil production [3,4]. The planted area increased from 6 to 16 million hectares between 1990 and 2010, an area which now accounts for about 10 percent of the world’s permanent cropland [5]. Conversion of forests to plantation agriculture represents a substantial source of greenhouse gas (GHG) emissions, especially in tropical peatlands [6], generating 10–20% of net global emissions [7]. Although oil palm plantations continue to expand, the government of Malaysia has pledged to reduce their projected GHG emissions by 45% by 2030 [8].
High-resolution forest biomass maps can provide detailed and spatially explicit estimates of aboveground carbon density (ACD, units of Mg C ha−1) to assist natural resource management and assess emissions from deforestation. LiDAR (light detection and ranging) has become a commonly used technology to remotely predict ACD in many forest types [9,10,11,12]. Carbon mapping by airborne LiDAR is significantly more accurate than approaches based on radar or passive optical measurements from space [13,14,15]. Oil palm trees have been counted using airborne imaging spectrometry [16] and their biomass estimated from satellite images [17,18,19,20], but nobody has yet developed equations to estimate carbon density in oil palm plantations from airborne LiDAR data. The development of carbon prediction models provides opportunities to assess the aboveground carbon density of oil palm plantations, which is essential for assessments of the environmental sustainability of human modified tropical landscapes.
Airborne LiDAR provides detailed information about forest structure within scanned areas, which can extend over hundreds of square kilometres [21,22,23], but it also poses the challenge of how best to use these data to estimate aboveground carbon [24]. It has been demonstrated that top of canopy height (TCH), as measured by LiDAR, is a useful metric for estimating ACD of natural tropical forests and is relatively insensitive to sensor and flight specifications [10]. However, the generality of TCH-based approaches to plot-aggregate carbon stock estimation has not been examined for oil palm plantations. There is current interest in developing individual-tree-based approaches to make greater use of the 3D information contained in airborne LiDAR data [25,26,27]. The tree-centric method is fundamentally similar to field-based approaches based on inventory plots [28,29], so individual-based modelling has a strong theoretical basis [30]. Nevertheless, over- or under-segmentation of trees can lead to biases in biomass estimation [12]. To our knowledge, no study has used tree-centric approaches to map carbon in tropical plantations.
This paper develops methods for mapping the aboveground carbon density of oil palm plantations using LiDAR. Sabah has a larger percentage of oil palm plantation than any other state in the world [5], so has become an important testbed to examine the effects of oil palm plantations within human modified tropical landscapes. We compare the Dalponte and Coomes (2016) tree-centric approach with area-based methods [10,12,31], and critically evaluate whether the advantages of working with individual trees outweigh any disadvantages associated with the accuracy of tree detection. We also explore the relationship between ACD and canopy gap fraction measured by LiDAR, and then use this finding to refine the area-based approach. Our study site contained plots with oil palm plantation that varied in age from 8 to 14 years at the time of sampling, providing an opportunity to test the generality of the approaches used.
2. Methods
2.1. The SAFE Degradation Landscape
The oil palm plantations are within the Stability of Altered Forest Ecosystem (SAFE) Project (4°38′N to 4°46′N, 116°57′E to 117°42′E), located within lowland dipterocarp forest regions of East Sabah in Malaysian Borneo (Figure 1). SAFE reflects Sabah’s predominant land use change over the past decades, characterised by industrial harvesting and large-scale forest-to-palm conversions [32]. The region has a tropical climate with high rainfall (>2000 mm/year) and varying topography, although all study plots are below 800 m altitude. The geology comprises a mixture of sedimentary rocks, including siltstones, sandstones and others that are easily eroded [33].
2.2. Field Data
Twenty-seven vegetation plots (25 m × 25 m, 0.0625 ha) with North–South orientation were set out at SAFE in 2010 using a Garmin GPSMap60 device. Vegetation plots were established according to a hierarchical sampling design based around a triangular pattern to assess regional forest attributes [34]. Plots were located at roughly equal altitude = 400 m and oriented to minimise potentially confounding factors such as slope. Oil palm is generally grown on fairly flat surfaces under Roundtable on Sustainable Palm Oil guidelines, recommendations from the Malaysian Palm Oil Board, and Standards for Oil Palm Production. On top of that, production on flat surfaces is higher. Therefore, these conditions will commonly be shared in oil palm plantations across SE Asia and are therefore valid. Plots were distributed among three oil palm plantation blocks of two different ages (OP1 and OP2 planted in 2006 and OP3 planted in 2000), henceforth referred to as 8-year-old and 14-year-old plots. In each 0.0625 ha plot, all oil palm individuals had their stem height measured in 2013 and remeasured in 2015; we used the average height between these years (Figure 2). The average height and standard deviation (in metres) was 6.1 ± 2.3 for OP1, 5.4 m ± 1.5 for OP2 and 8.5 ± 2.0 for OP3. Palms have vascular bundles embedded in their trunks, in contrast to most tree species which have meristem cells just beneath their bark, so trunks do not increase in diameter as the trees grow taller. Thus, as secondary thickening does not occur in palm trees, we did not include tree diameter in our field measurements or biomass equation.
A 1-ha plot was created that was centred on each 0.0625-ha plot, to expand the plot size for aboveground carbon density calculations and minimize plot size effects on LiDAR model performance [15]. We then used Earth Imaging data from the Pléiades satellite constellation (EADS Astrium), acquired over the SAFE landscape in June 2016, to visually count the tree density within each 1-ha plot. Pléiades data comprises a 0.5-m resolution panchromatic band, and four spectral bands (blue, green, red, and near infrared) with a 2.8 m spatial resolution, resampled to 2 m (Figure 3a). The panchromatic band has sufficiently high resolution to distinguish the rows of trees in oil palm stands, as interrow spacing is approximately 8 m. The average height of each 1-ha plot was assumed to be the same as in the 0.0625 ha plots, embedded at the centre. We recognise that spatial autocorrelation magnitude could impact the 1-ha plot data; however, we emphasize that the plots are not being used for landscape sampling, rather they are intended for calibration and validation purposes only. Areas within oil palm are all planted at the same time and managed in the same way, and are therefore likely to be extremely homogeneous.
2.3. LiDAR Data Acquisition and Processing
Airborne LiDAR data were acquired on 5 November 2014 using a Leica LiDAR50-II flown at 1850 m altitude on a Dornier 228–201 travelling at 135 knots. The LiDAR sensor emitted pulses at 83.1 Hz with a field of view of 12.0°, and a footprint of about 40 cm diameter. The average pulse density was 7.3/m2. The Leica LiDAR50-II sensor records full waveform LiDAR, but for the purposes of this study the data were discretised, with up to four returns recorded per pulse. Accurate georeferencing of LiDAR point cloud was ensured by incorporating data from a Leica base station running in the study area concurrently to the flight. The LiDAR data were pre-processed by NERC’s Data Analysis Node and delivered in standard LAS format. All further processing was undertaken using LAStools [35]. Points were classified as ground and non-ground, and a digital elevation model (DEM) was fitted to the ground returns, producing a raster of 1 m resolution. The DEM elevations were subtracted from elevations of all non-ground returns to produce a normalised point cloud, and a canopy height model (CHM) was constructed from this on a 0.5 m raster by averaging the first returns. Finally, holes in the raster were filled by averaging neighbouring cells (Figure 3b).
2.4. Estimating Tree- and Plot-Level Aboveground Carbon Density
Oil palm aboveground biomass (AGBpalm) was computed as dry mass in kg for each palm tree from its height (H) in metres using the equation of [17]:
Note, as explained above, palm trees do not increase in diameter as they increase in height, so the formula is based only on height. The average AGBpalm within the field plot was multiplied by the number of individuals counted in the 1-ha plots from the Pléiades images to give the total AGB within each 1 ha plot. A carbon content conversion factor of 0.47 was then applied, following [36].
2.5. Area-Based Approach
The authors of [10] proposed a generalised approach to estimate ACD using top of canopy height estimated by LiDAR. As recommended by [10], least squares regression was used to relate field measured TCH and ACD as follows:
This model was fitted to data from the 27 1-ha SAFE plots and the estimates were obtained by leave-one-out cross validation. TCH was the mean height of CHM pixels within each 1-ha plot extracted using the raster package of R, while a and b are the parameters of the nonlinear model.
We also tested whether canopy cover (CC)—the proportion of area occupied by crowns at a given height aboveground—could be used as an alternative LiDAR metric to predict ACD. CC is calculated by creating a horizontal plane in the canopy height model (CHM) at height h above ground, and calculating the number of pixels for which the CHM lies beneath the plane divided by the total number of pixels in the plot. CC was calculated for h from 1 m to the maximum canopy height encountered in the plots (23 m). There were a few individuals of other tree species encountered in the 1-ha plots.
We also tested whether TCH and canopy cover could both be included as a predictor of ACD [12,31]. The model requires accounting for multicollinearity, considering that TCH is closely correlated to CC. This can be done by regressing one variable against the other, and replacing the variable with the residuals from the regression [37]. We therefore first modelled the relationship between CC and TCH using logistic regression, validated the model using a leave-one-out procedure, and then used the residuals of this model (CCres in Equation (4)) to identify plots that have higher or lower than expected canopy cover for a given TCH. Equation (5) was used following [31], who carefully compared alternative functional forms.
where lowercase letters indicate regression coefficients. To aid interpretation, Spearman rank correlation coefficients (r) between structural variables and area-based approach metrics were calculated to investigate the relationship of both average tree height and tree density with both TCH and CC LiDAR metrics.
2.6. Tree-Centric Approach
As an alternative to area-based approaches, we tested whether ACD could be estimated accurately by summing the biomass of individual tree crowns (ITCs; Figure 1). The itcSegment algorithm was used to delineate trees within each of the 27 plots and determine the tree heights and individual crown areas. itcSegment is implemented in R and made freely available on CRAN [38]. It works by finding local maxima in the raster CHM, regarding these maxima as tree tops, then growing crowns around them by local searching of the raster CHM and point cloud. This approach was initially developed for coniferous forests [27,39,40,41] following the concept of [42], and modified in this manuscript to adapt to forests with low variation in height (i.e., oil palm plantations). The tree-centric approach consists of three stages [43]: (1) a Guassian low-pass filter to smooth the canopy height model; (2) an iterative search for local maximum in the CHM, which are assumed to represent the tops of tree crown, using a window size that varied with the height of the CHM; we included a weighting exponent in the itcSegment function to increase the contrast in the CHM and found this greatly improved the accuracy of segmentation; (3) a region-growing step then searches for crowns around each local maximum, constraining the search with pre-determined crown width and depth information. The itcSegment algorithm has been upgraded in R after inclusion of the weighting exponent.
The next step was to calculate a correction factor to account for the fact that the individual tree heights obtained by the ITC approach overestimated the oil palm tree heights, because large oil palm fronds arch up beyond the meristem at the top of the trunk, which were not accounted for in field measurements. This correction factor was obtained by fitting a nonlinear regression as follows:
where is the mean field-estimated height within the 27 0.0625 ha plots and is the mean LiDAR-esimated height within the surrounding 1-ha plots, and a and b are parameters estimated by nonlinear least squares regression. The model was validated using the leave-one-out procedure.
The next step was to estimate individual biomass, by entering values into equation 1. We then summed the AGB of segmented trees, and multiplied by a carbon density of 0.47 to obtain ACD estimates as before. The accuracy of the ITC delineation was assessed by comparing the numbers of delineated trees with the numbers observed in the field plots and ACD predicted from the summed individual biomasses.
3. Results
3.1. Relating LiDAR Metrics to Oil Palm Plantation Structure
Both LiDAR area-based approach metrics, top of canopy height and canopy cover, are correlated to tree density and average plot tree height (Figure 4a–d). Canopy cover (CC) at 3 m height was chosen after a comparison of different models that included heights between 1 and 23 m, to include a few individuals other than oil palm trees within the 1-ha plots. Top of canopy height was more strongly influenced by height, whereas CC at 3 m was more influenced by tree density.
3.2. Area-Based Approaches
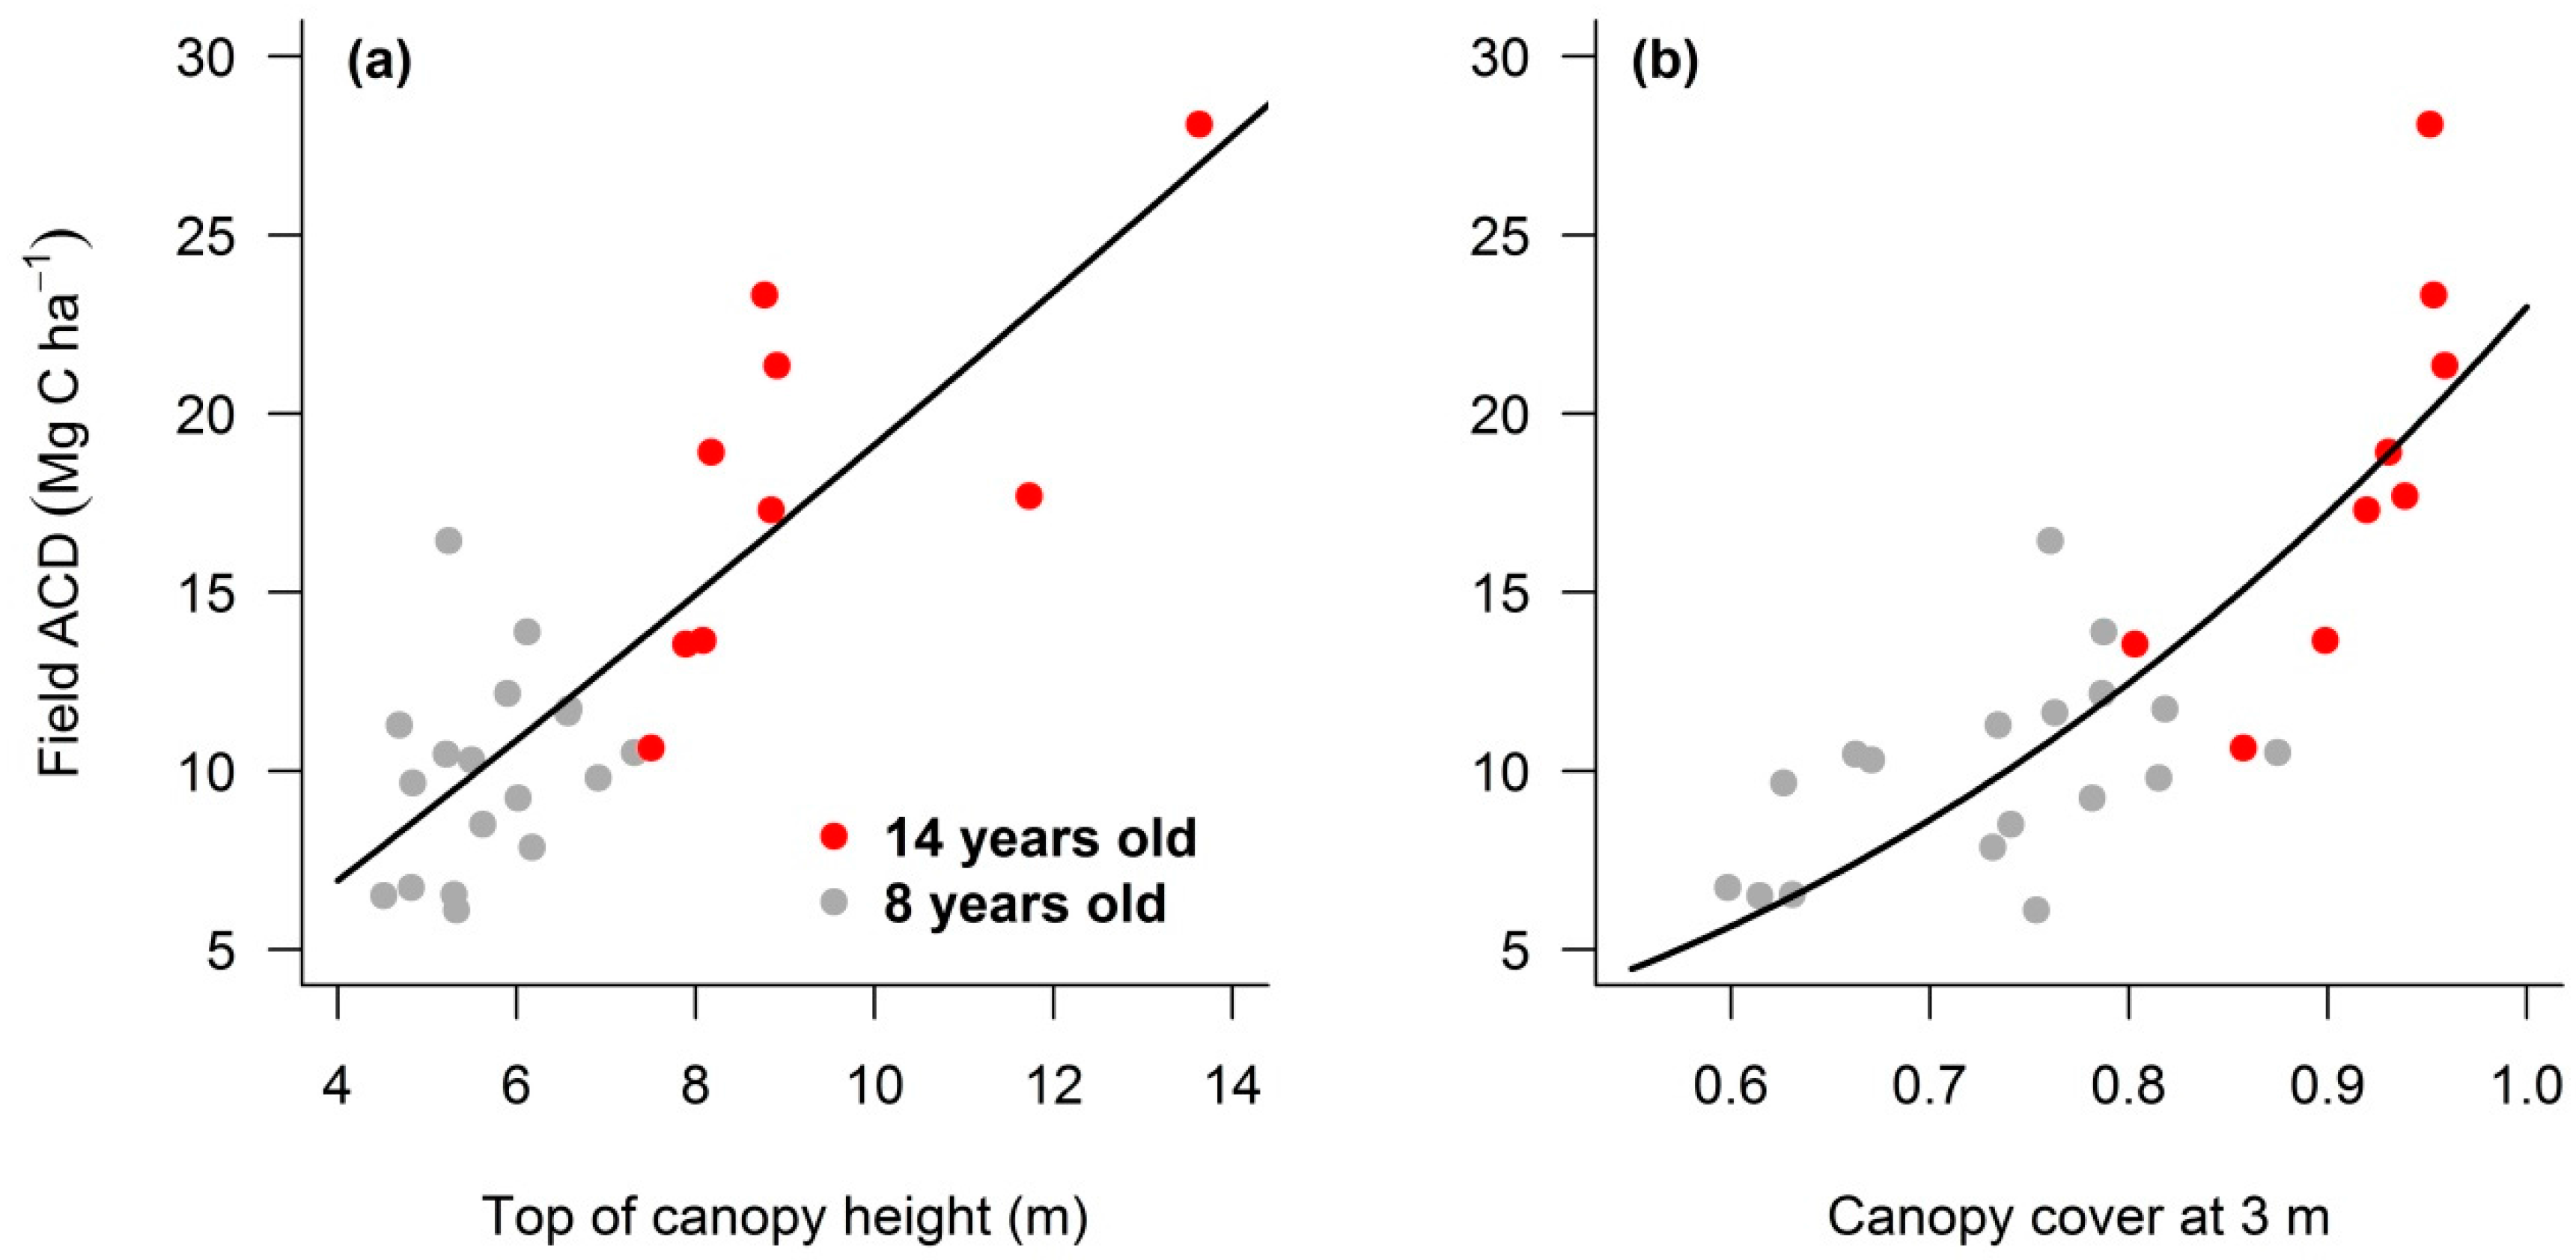
The local model obtained by fitting a power-law model to the data available from SAFE oil palm plantations yielded the following relationship between top of canopy height (TCH) and aboveground carbon density (Figure 5a):
ACDHTC = 1.494TCH1.107
A TCH exponent of just over 1 indicates a near-linear relationship between TCH and carbon density in oil palm plantations, as expected from the straight-line relationship between individual biomass and height (i.e., Equation (1)). The relationship between ACD and CC follows instead an exponential relationship (Figure 5b):
ACDcc = 22.991CC2.744
In comparison, when ACD was expressed a function of both TCH and residual CC, we obtained the following model:
where CCres can be obtained by subtracting the actual CC by the model that predicted CC from logistic regression with TCH as the predictor variable:
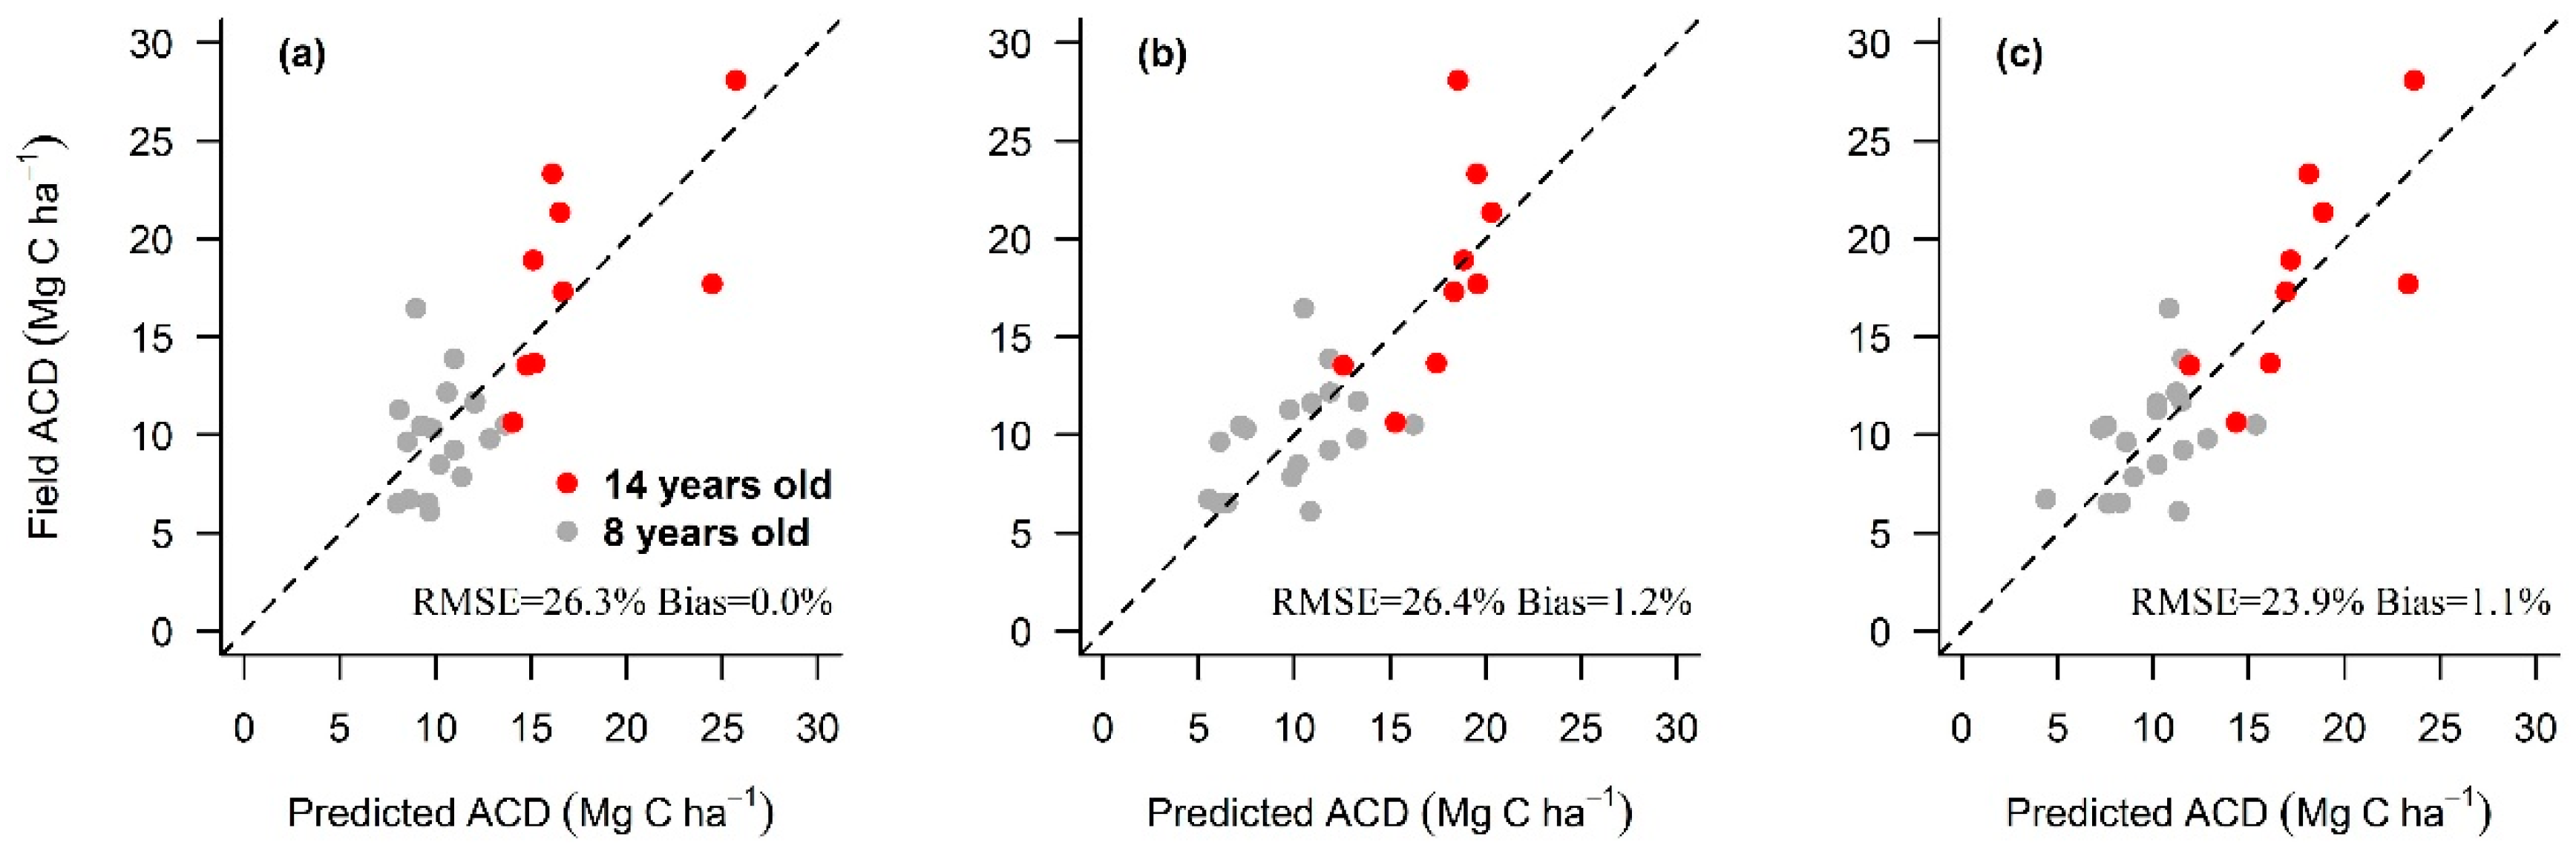
The model based on TCH generated unbiased ACD predictions with RMSE of 26.3%, whereas the model based on CC showed a bias of 1.2% with similar RMSE of 26.4%, with both models yielding an R2 = 0.62 (Figure 6a,b). The inclusion of both TCH and residual canopy cover into the model reduced RMSE to 23.9% and improved the strength of relationship to R2 = 0.69 (Figure 6c). The predictions were obtained from the validation datasets using the leave-one-out procedure. Neither approach showed any trend with oil palm plantation age (e.g., plots deviating from the 1:1 line), which indicates that the equations can be applied to plantations of different ages and to faster and slower growing stands of the same age.
3.3. Individual Tree Crown Approach
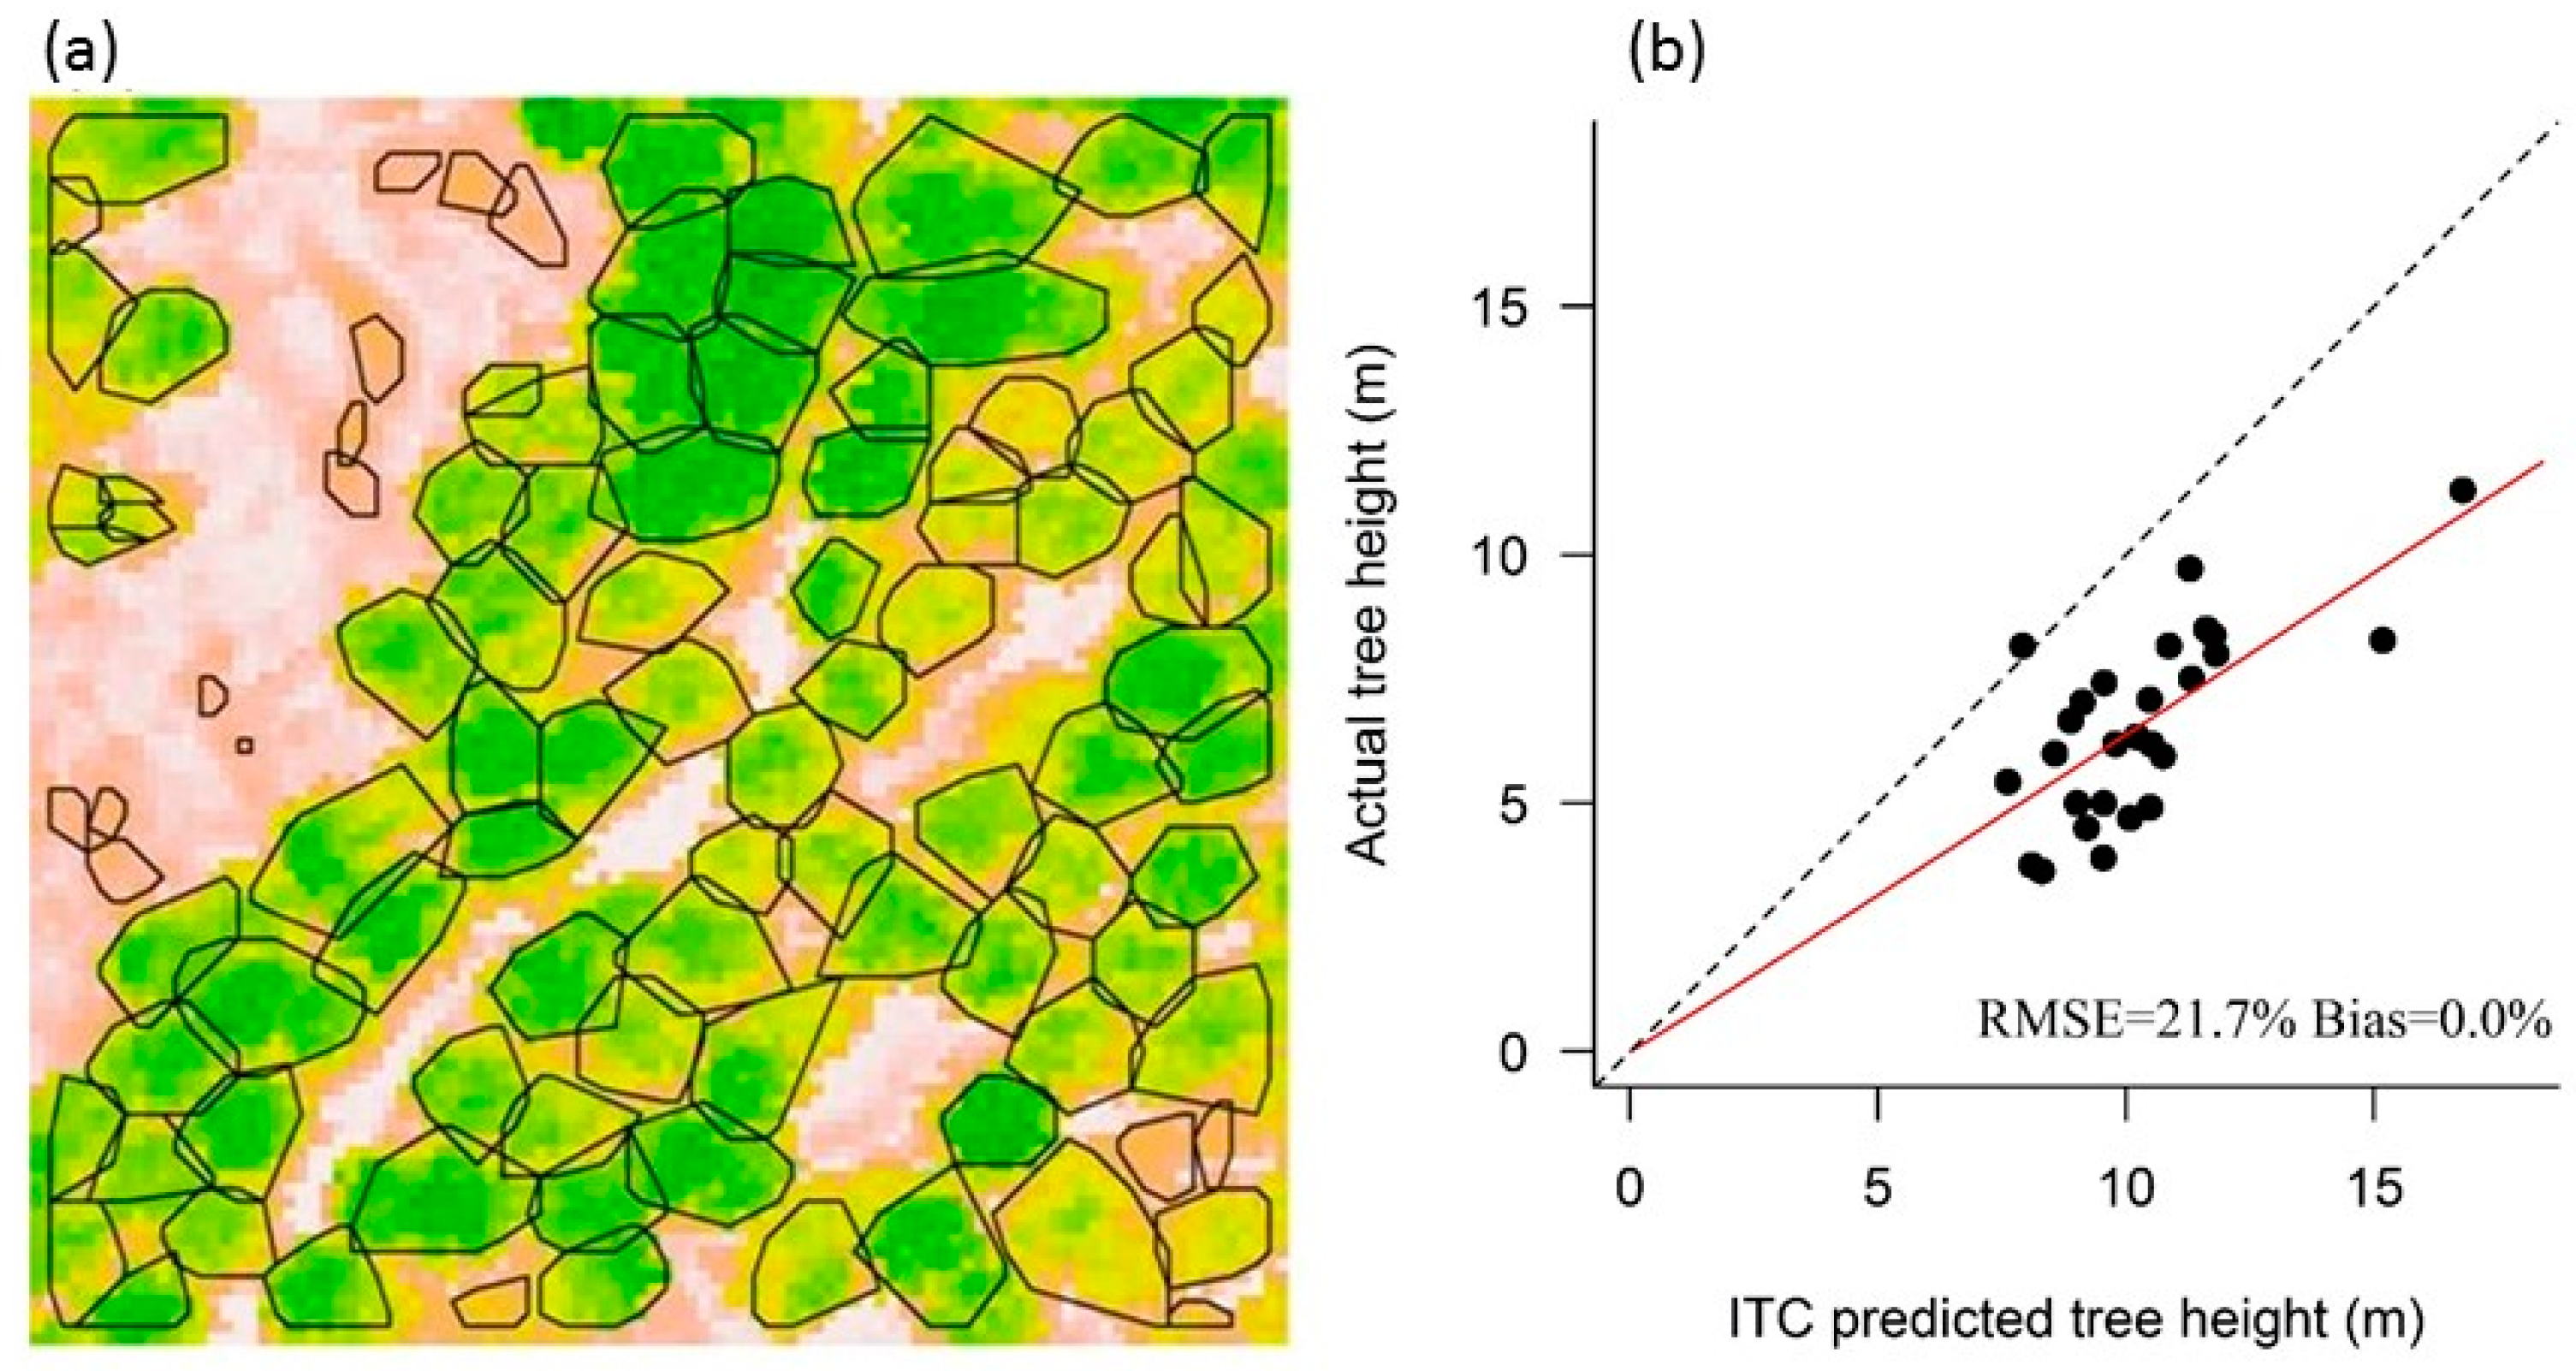
ITCsegment used variable window sizes when searching for local maxima, which avoided omitting small palms when the window was large, or over-segmenting large palms when the window was small (Figure 7a). Heights obtained from the individual tree crown segmentation (HITC) included the upward pointing fronds of palms. The relationship between stem height and HITC (Figure 7b) was:
Hc = 0.61HITC1.02
This equation was used to predict the tree stem height (Hc) of all trees in the plots, from their segmented heights.
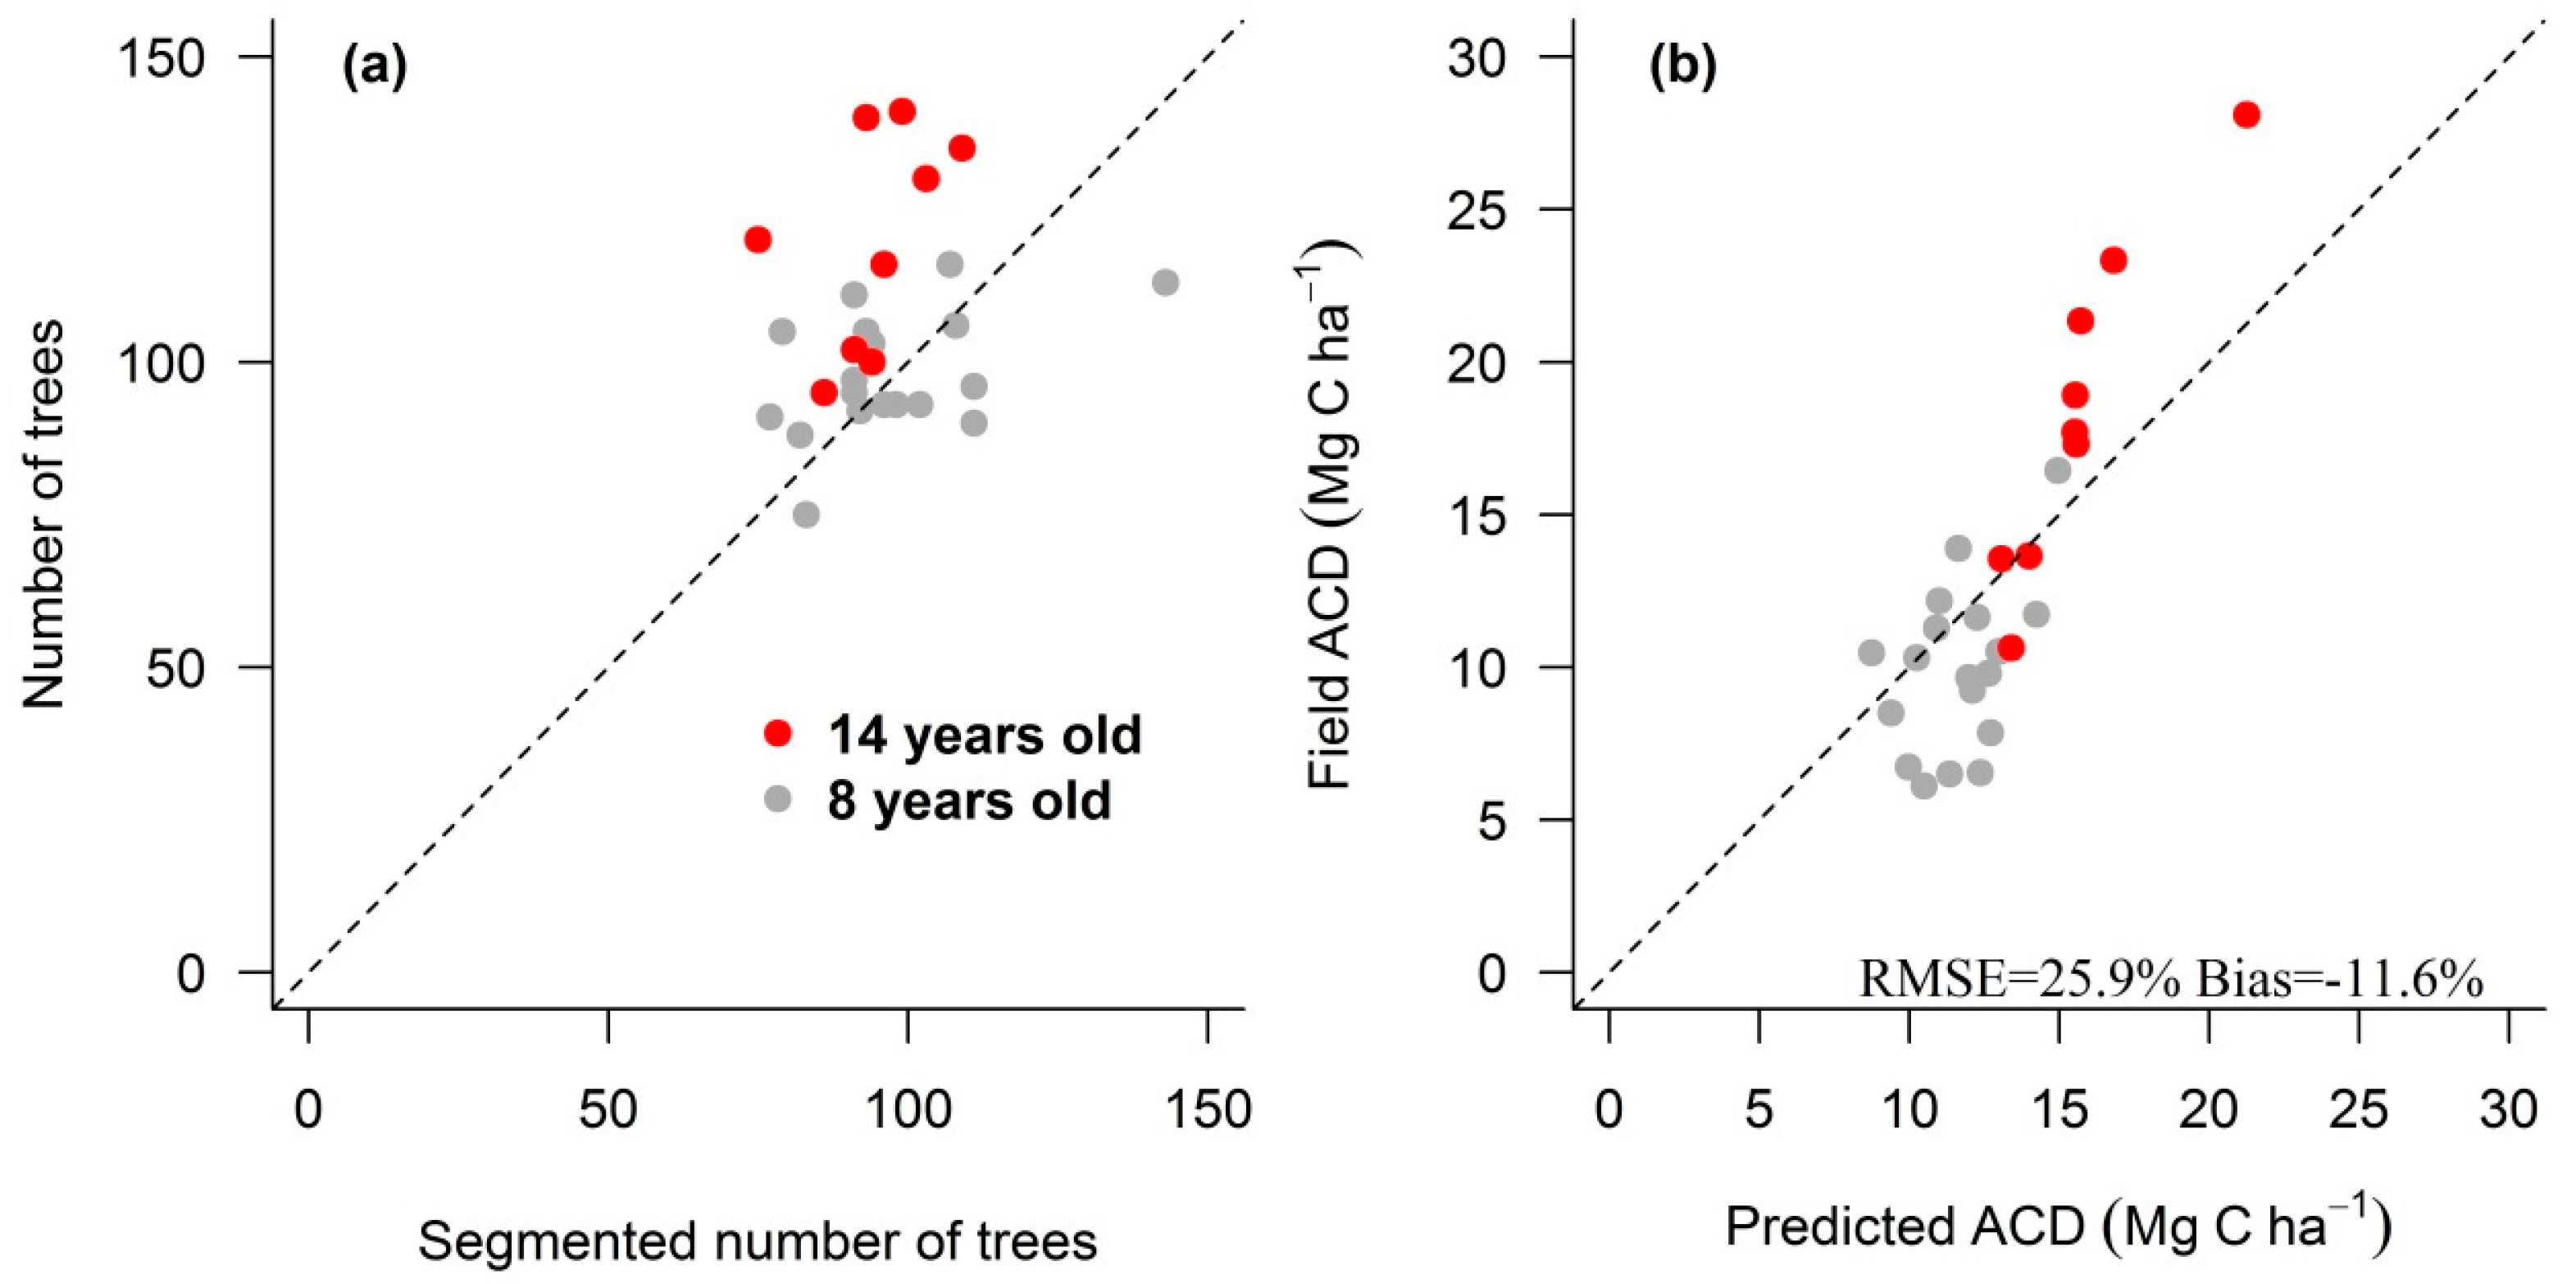
A comparison of the number of delineated trees with the tree density obtained from the Pléiades optical imagery was used to estimate the accuracy of the ITC delineation for all the 1-ha plots (Figure 8a). ACD of individual oil palm trees was summed to estimate plot ACD at the 1-ha plot level (Figure 8b). The ITC approach gave a percentage RMSE of 25.9% and was biased (−11.6%), showing a slight trend from over-estimation of lower carbon density values and under-estimation of higher carbon density values.
4. Discussion
We have demonstrated that the ACD of oil palm plantations can be assessed accurately using airborne LiDAR and can give better results compared to estimates using satellites [18]. Our ACD estimates of 10.0 Mg C ha−1 for a 8-year-old plantation and 18.3 Mg C ha−1 for a 14-year-old plantation are similar to those reported in previous studies. mean ACD of oil palm in the SAFE landscape was estimated as 17.9 Mg C ha−1 by [45] using optical satellite imagery (age of stands not distinguished), while elsewhere in Sabah, the ACD of a 3-year-old oil palm plantation was given as 1.1 Mg C/ha, rising to an average value of 24.4 Mg C ha−1 for plantations ranging from 4 to 19 years old [18].
Area-based approaches yielded more accurate carbon stock predictions in oil palm plantations than the tree-centric approach. ACD predictions were most accurate when incorporating both TCH and canopy cover as predictors [10]. Power-law modelling incorporates basal area and wood density relating to TCH; however, our function assumes that wood density and basal area are both constant, as the field biomass equation that was used to predict individual biomass, used tree height only. The authors of [12] found that the crown area of each forest tree scales with its basal area, so the gap fraction at ground level of a plot is negatively related to the basal area of its trees. The authors of [12] showed that incorporating canopy cover in tropical forests into ACD models gave more accurate results, as ACD is more closely related to basal area than to height. However, secondary thickening does not occur in palm trees, with basal area increase instead being due to division and enlargement of parenchyma cells [46]. Thus, cover fraction is not necessarily correlated to basal area, but more dependent on tree density and height. When incorporating both TCH and CC, the model yielded better results as a result of complementarity, by taking into account the high correlations between tree height and TCH as well as with tree density and CC.
The tree-centric approach was less accurate. It showed a slight tendency to over-estimate the number of trees in younger plantations. A likely reason for this oversegmentation is overlap of palm crowns of similar heights. In mature plantations, crowns were more likely to be connected to other tree crowns, making them difficult to distinguish and resulting in miscounting of trees. Other studies focussing on tropical rainforests have also found the tree-centric approach to perform slightly less well than area-based methods [12,26], due to over-segmentation of emergent trees and incomplete detection of sub-canopy trees. Here, the problem is instead the under-segmentation of large crowns, which merge into one another, owing to their similar height.
Although the tree-centric approach gives less accurate results, it can still be advantageous to segment individual trees for precision agriculture [47], particularly in oil palm plantations as individual trees are long-lived. Field-based tree counting is labour intensive, and the use of remote-sensing using high-resolution optical imagery from satellites has been suggested as a cost efficient alternative [48]. A semi-automatic technique to count oil palm trees using high-resolution airborne imaging spectrometer data has also been developed [16], and LiDAR has been used to detect and classify oil palm diseases [49]. The detection of diseases, such as the Ganoderma basal stem rot, using airborne spectral imagery [50]) and space-borne multispectral sensors [51] has also been demonstrated.
The Roundtable on Sustainable Palm Oil, the major accreditation body for sustainable palm oil production, recognises the importance of developing approaches for growers to monitor emissions across their estates. However, it has been recognised that emission cannot be monitored completely, or accurately, using current methodologies [52]. Studies indicate that remote sensing missions should estimate carbon with an error within 20% of field estimates [53,54]. Both area-based and individual tree-centric approaches offer reliable opportunities to map oil palm plantation ACD, within acceptable standards of estimation. High-resolution LiDAR techniques are a reliable tool to collect reference data, in order to decrease the uncertainty associated with satellite-based mapping projects. It is through the integration of optical and samples of LiDAR data, based upon the above findings, that measures in support of carbon sequestration programs may be generated.
5. Conclusions
Area-based modelling proved more effective at mapping ACD in oil palm plantations than a more sophisticated tree-centric approach. Using both canopy cover and top-of-canopy height in the model generated the most accurate ACD predictions. Canopy cover is related primarily to tree density and secondarily to tree height, so provides complementary information to TCH and improves accuracy. The tree-centric approach underestimated the density of trees, particularly in older plantations, because tree crowns were overlapping and our segmentation algorithm recognised overlapping crowns as a single tree. Nevertheless, the tree-centric approach may prove useful in the future for detecting individual trees and for monitoring growth and foliar properties.
Acknowledgments
Airborne laser scanning data were collected by NERC ARF as part of NERC’s Human-modified Tropical Forests Programme (Biodiversity And Land-use Impacts on tropical ecosystem function (BALI) project; grant number: NE/K016377/1). We are grateful to the flight team and the data analysts at NERC’s data analysis node. Marion Pfeifer kindly provided us access to Pléiades imagery. We thank the Sime Darby Foundation, the Sabah Foundation, Benta Wawasan and the Sabah Forestry Department for their support of the SAFE Project. We thank the Royal Society South East Asia Rainforest Research Partnership for logistical support in the field, and Yayasan Sabah, Maliau Basin Management Committee, the State Secretary, Sabah Chief Minister’s Departments, the Malaysian Economic Planning Unit and the Sabah Biodiversity Council for permission to conduct research in Sabah. Data in the field were largely collected with the help and support of the SAFE Project’s team of Research Assistants.
Author Contributions
M.H.N. analysed the data and wrote the manuscript; R.M.E. and E.C.T. designed the experiment and supervised the collection of field data; D.A.C. conceived the ideas, designed the methods, supervised the collection of LiDAR data and led the writing of the manuscript. All authors contributed critically to the drafts and gave final approval for publication.
Conflicts of Interest
The authors declare that they have no conflict of interest.
References
- Gutiérrez-Vélez, V.H.; DeFries, R. Annual multi-resolution detection of land cover conversion to oil palm in the Peruvian Amazon. Remote Sens. Environ. 2013, 129, 154–167. [Google Scholar] [CrossRef]
- Sayer, J.; Ghazoul, J.; Nelson, P.; Klintuni Boedhihartono, A. Oil palm expansion transforms tropical landscapes and livelihoods. Glob. Food Secur. 2012, 1, 114–119. [Google Scholar] [CrossRef]
- Food and Agriculture Organization of the United Nations, FAOSTAT Gateway. Available online: http://faostat3.fao.org/faostat-gateway/go/to/home/E (accessed on 15 June 2017).
- Koh, L.P.; Wilcove, D.S. Cashing in palm oil for conservation. Nature 2007, 448, 993–994. [Google Scholar] [CrossRef] [PubMed]
- Malaysian Palm Oil Board, Oil Palm Planted Area 2016. Available online: http://bepi.mpob.gov.my/index.php/en/statistics/area/176-area-2016.html (accessed on 15 June 2017).
- Foley, J.A.; Ramankutty, N.; Brauman, K.A.; Cassidy, E.S.; Gerber, J.S.; Johnston, M.; Mueller, N.D.; O’Connell, C.; Ray, D.K.; West, P.C.; et al. Solutions for a cultivated planet. Nature 2011, 478, 337–342. [Google Scholar] [CrossRef] [PubMed]
- van der Werf, G.R.; Morton, D.C.; DeFries, R.S.; Olivier, J.G.J.; Kasibhatla, P.S.; Jackson, R.B.; Collatz, G.J.; Randerson, J.T. CO2 emissions from forest loss. Nat. Geosci. 2009, 2, 737–738. [Google Scholar] [CrossRef]
- UNFCCC Intended Nationally Determined Contribution of the Government of Malaysia. Available online: http://www4.unfccc.int/Submissions/INDC/Published Documents/Malaysia/1/INDC Malaysia Final 27 November 2015 Revised Final UNFCCC.pdf (accessed on 15 June 2017).
- Asner, G.P.; Powell, G.V.N.; Mascaro, J.; Knapp, D.E.; Clark, J.K.; Jacobson, J.; Kennedy-Bowdoin, T.; Balaji, A.; Paez-Acosta, G.; Victoria, E.; Secada, L.; et al. High-resolution forest carbon stocks and emissions in the Amazon. Proc. Natl. Acad. Sci. USA 2010, 107, 16738–16742. [Google Scholar] [CrossRef] [PubMed]
- Asner, G.P.; Mascaro, J. Mapping tropical forest carbon: Calibrating plot estimates to a simple LiDAR metric. Remote Sens. Environ. 2014, 140, 614–624. [Google Scholar] [CrossRef]
- Simonson, W.; Ruiz-Benito, P.; Valladares, F.; Coomes, D. Modelling above-ground carbon dynamics using multi-temporal airborne LiDAR: Insights from a Mediterranean woodland. Biogeosciences 2016, 13, 961–973. [Google Scholar] [CrossRef]
- Coomes, D.A.; Dalponte, M.; Jucker, T.; Asner, G.P.; Banin, L.F.; Burslem, D.F.R.P.; Lewis, S.L.; Nilus, R.; Phillips, O.L.; Phua, M.H.; et al. Area-based vs tree-centric approaches to mapping forest carbon in Southeast Asian forests from airborne laser scanning data. Remote Sens. Environ. 2017, 194, 77–88. [Google Scholar] [CrossRef]
- Hyde, P.; Nelson, R.; Kimes, D.; Levine, E. Exploring LiDAR-RaDAR synergy-predicting aboveground biomass in a southwestern ponderosa pine forest using LiDAR, SAR and InSAR. Remote Sens. Environ. 2007, 106, 28–38. [Google Scholar] [CrossRef]
- Nelson, R.F.; Hyde, P.; Johnson, P.; Emessiene, B.; Imhoff, M.L.; Campbell, R.; Edwards, W. Investigating RaDAR-LiDAR synergy in a North Carolina pine forest. Remote Sens. Environ. 2007, 110, 98–108. [Google Scholar] [CrossRef]
- Zolkos, S.G.G.; Goetz, S.J.J.; Dubayah, R. A meta-analysis of terrestrial aboveground biomass estimation using LiDAR remote sensing. Remote Sens. Environ. 2013, 128, 289–298. [Google Scholar] [CrossRef]
- Shafri, H.Z.M.; Hamdan, N.; Saripan, M.I. Semi-automatic detection and counting of oil palm trees from high spatial resolution airborne imagery. Int. J. Remote Sens. 2011, 32, 2095–2115. [Google Scholar] [CrossRef]
- Thenkabail, P.S.; Stucky, N.; Griscom, B.W.; Ashton, M.S.; Diels, J.; van der Meer, B.; Enclona, E. Biomass estimations and carbon stock calculations in the oil palm plantations of African derived savannas using IKONOS data. Int. J. Remote Sens. 2004, 25, 5447–5472. [Google Scholar] [CrossRef]
- Morel, A.C.; Saatchi, S.S.; Malhi, Y.; Berry, N.J.; Banin, L.; Burslem, D.; Nilus, R.; Ong, R.C. Estimating aboveground biomass in forest and oil palm plantation in Sabah, Malaysian Borneo using ALOS PALSAR data. For. Ecol. Manag. 2011, 262, 1786–1798. [Google Scholar] [CrossRef]
- Carlson, K.M.; Curran, L.M.; Ratnasari, D.; Pittman, A.M.; Soares-Filho, B.S.; Asner, G.P.; Trigg, S.N.; Gaveau, D.A.; Lawrence, D.; Rodrigues, H.O. Committed carbon emissions, deforestation, and community land conversion from oil palm plantation expansion in West Kalimantan, Indonesia. Proc. Natl. Acad. Sci. USA 2012, 109, 7559–7564. [Google Scholar] [CrossRef] [PubMed]
- Koh, L.P.; Miettinen, J.; Liew, S.C.; Ghazoul, J. Remotely sensed evidence of tropical peatland conversion to oil palm. Proc. Natl. Acad. Sci. USA 2011, 108, 5127–5132. [Google Scholar] [CrossRef] [PubMed]
- Lim, K.; Treitz, P.; Wulder, M.; St-Onge, B.; Flood, M. LiDAR remote sensing of forest structure. Prog. Phys. Geog. 2003, 27, 88–106. [Google Scholar] [CrossRef]
- Dassot, M.; Constant, T.; Fournier, M. The use of terrestrial LiDAR technology in forest science: Application fields, benefits and challenges. Ann. For. Sci. 2011, 68, 959–974. [Google Scholar] [CrossRef]
- Nguyen, H.T.; Hutyra, L.R.; Hardiman, B.S.; Raciti, S.M. Characterizing forest structure variations across an intact tropical peat dome using field samplings and airborne LiDAR. Ecol. Appl. 2016, 26, 587–601. [Google Scholar] [CrossRef] [PubMed]
- Jucker, T.; Caspersen, J.; Chave, J.; Antin, C.; Barbier, N.; Bongers, F.; Dalponte, M.; van Ewijk, K.Y.; Forrester, D.I.; Haeni, M.; et al. Allometric equations for integrating remote sensing imagery into forest monitoring programmes. Glob. Chang. Biol. 2016, 177–190. [Google Scholar] [CrossRef] [PubMed]
- Duncanson, L.I.; Dubayah, R.O.; Cook, B.D.; Rosette, J.; Parker, G. The importance of spatial detail: Assessing the utility of individual crown information and scaling approaches for LiDAR-based biomass density estimation. Remote Sens. Environ. 2015, 168, 102–112. [Google Scholar] [CrossRef]
- Ferraz, A.; Saatchi, S.; Mallet, C.; Meyer, V. LiDAR detection of individual tree size in tropical forests. Remote Sens. Environ. 2016, 183, 318–333. [Google Scholar] [CrossRef]
- Dalponte, M.; Coomes, D.A. Tree-centric mapping of forest carbon density from airborne laser scanning and hyperspectral data. Methods Ecol. Evol. 2016, 7, 1236–1245. [Google Scholar] [CrossRef] [PubMed]
- Coomes, D.A.; Allen, R.B.; Scott, N.A.; Goulding, C.; Beets, P. Designing systems to monitor carbon stocks in forests and shrublands. For. Ecol. Manag. 2002, 164, 89–108. [Google Scholar] [CrossRef]
- Chen, Q.; Vaglio Laurin, G.; Valentini, R. Uncertainty of remotely sensed aboveground biomass over an African tropical forest: Propagating errors from trees to plots to pixels. Remote Sens. Environ. 2015, 160, 134–143. [Google Scholar] [CrossRef]
- Shugart, H.H.; Asner, G.P.; Fischer, R.; Huth, A.; Knapp, N.; Le Toan, T.; Shuman, J.K. Computer and remote-sensing infrastructure to enhance large-scale testing of individual-based forest models. Front. Ecol. Environ. 2015, 13, 503–511. [Google Scholar] [CrossRef]
- Jucker, T.; Coomes, D.A.; Dalponte, M.; Asner, G.P.; Burslem, D.F.R.P.; Deere, N.J.; Ewers, R.M.; Khoo, M.S.; Lewis, S.L.; Malhi, Y.; et al. A regional model for estimating the aboveground carbon density of Bornean forests from airborne laser scanning. 2017. under review. [Google Scholar]
- Reynolds, G.; Payne, J.; Sinun, W.; Mosigil, G.; Walsh, R.P.D. Changes in forest land use and management in Sabah, Malaysian Borneo, 1990–2010, with a focus on the Danum Valley region. Philos. Trans. R. Soc. B 2011, 366, 3168–3176. [Google Scholar] [CrossRef] [PubMed]
- Douglas, I. Hydrological investigations of forest disturbance and land cover impacts in South-East Asia: A review. Philos. Trans. R. Soc. B 1999, 354, 1725–1738. [Google Scholar] [CrossRef] [PubMed]
- Ewers, R.M.; Didham, R.K.; Fahrig, L.; Ferraz, G.; Hector, A.; Holt, R.D.; Kapos, V.; Reynolds, G.; Sinun, W.; Snaddon, J.L.; Turner, E.C. A large-scale forest fragmentation experiment: The stability of Altered forest ecosystems project. Philos. Trans. R. Soc. B 2011, 366, 3292–3302. [Google Scholar] [CrossRef] [PubMed] [Green Version]
- Rapidlasso GmbH, LAStools. Available online: https://rapidlasso.com/lastools/ (accessed on 1 January 2012).
- Martin, A.R.; Thomas, S.C. A reassessment of carbon content in tropical trees. PLoS ONE 2011, 6. [Google Scholar] [CrossRef] [PubMed]
- Graham, M.H. Confronting multicollinearity in ecological multiple regression. Ecology 2003, 84, 2809–2815. [Google Scholar] [CrossRef]
- ItcSegment: Individual Tree Crowns Segmentation. Available online: https://cran.r-project.org/web/packages/itcSegment/index.html (accessed on 6 July 2017).
- Dalponte, M.; Ørka, H.O.; Ene, L.T.; Gobakken, T.; Næsset, E. Tree crown delineation and tree species classification in boreal forests using hyperspectral and ALS data. Remote Sens. Environ. 2014, 140, 306–317. [Google Scholar] [CrossRef]
- Eysn, L.; Hollaus, M.; Lindberg, E.; Berger, F.; Monnet, J.M.; Dalponte, M.; Kobal, M.; Pellegrini, M.; Lingua, E.; Mongus, D.; Pfeifer, N. A benchmark of LiDAR-based single tree detection methods using heterogeneous forest data from the Alpine Space. Forests 2015, 6, 1721–1747. [Google Scholar] [CrossRef] [Green Version]
- Dalponte, M.; Reyes, F.; Kandare, K.; Gianelle, D. Delination of Individual Tree Crowns from ALS and Hyperspectral data: A comparison among four methods. Eur. J. Remote Sens. 2015, 48, 365–382. [Google Scholar] [CrossRef]
- Hyyppä, J.; Kelle, O.; Lehikoinen, M.; Inkinen, M. A segmentation-based method to retrieve stem volume estimates from 3-D tree height models produced by laser scanners. IEEE Trans. Geosci. Remote Sens. 2001, 39, 969–975. [Google Scholar] [CrossRef]
- Dalponte, M. itcSegment: Individual Tree Crowns Segmentation. Available online: https://rdrr.io/cran/itcSegment/man/itcIMG.html (accessed on 6 July 2017).
- Nyström, M.; Holmgren, J.; Olsson, H. Prediction of tree biomass in the forest-tundra ecotone using airborne laser scanning. Remote Sens. Environ. 2012, 123, 271–279. [Google Scholar] [CrossRef]
- Pfeifer, M.; Kor, L.; Nilus, R.; Turner, E.; Cusack, J.; Lysenko, I.; Khoo, M.; Chey, V.K.; Chung, A.C.; Ewers, R.M. Mapping the structure of Borneo’s tropical forests across a degradation gradient. Remote Sens. Environ. 2016, 176, 84–97. [Google Scholar] [CrossRef]
- Mauseth, J.D. Botany; Jones & Bartlett Publishers: Sudbury, MA, USA, 2012. [Google Scholar]
- McBratney, A.; Whelan, B.; Ancev, T.; Bouma, J. Future directions of precision agriculture. Precis. Agric. 2005, 6, 7–23. [Google Scholar] [CrossRef]
- Jusoff, K.; Pathan, M. Mapping of individual oil palm trees using airborne hyperspectral sensing: An Overview. Appl. Phys. Res. 2009, 1, 15–30. [Google Scholar] [CrossRef]
- Khosrokhani, M.; Khairunniza-Bejo, S.; Pradhan, B. Geospatial technologies for detection and monitoring of Ganoderma basal stem rot infection in oil palm plantations: A review on sensors and techniques. Geocarto. Int. 2016, 6049, 1–17. [Google Scholar] [CrossRef]
- Shafri, H.Z.M.; Hamdan, N. Hyperspectral imagery for mapping disease Infection in oil palm plantation.pdf. Amn. J. Appl. Sci. 2009, 6, 1031–1035. [Google Scholar]
- Santoso, H.; Gunawan, T.; Jatmiko, R.H.; Darmosarkoro, W.; Minasny, B. Mapping and identifying basal stem rot disease in oil palms in North Sumatra with QuickBird imagery. Precis. Agric. 2011, 12, 233–248. [Google Scholar] [CrossRef]
- Roundtable on Sustainable Palm Oil, Adoption of Principles and Criteria. Available online: http://www.rspo.org/file/revisedPandC2013.pdf (accessed on 15 June 2017).
- Houghton, R.A.; Hall, F.; Goetz, S.J. Importance of biomass in the global carbon cycle. J. Geophys. Res. Biogeosci. 2009, 114, 1–13. [Google Scholar] [CrossRef]
- Hall, F.G.; Bergen, K.; Blair, J.B.; Dubayah, R.; Houghton, R.; Hurtt, G.; Kellndorfer, J.; Lefsky, M.; Ranson, J.; Saatchi, S.; et al. Characterizing 3D vegetation structure from space: Mission requirements. Remote Sens. Environ. 2011, 115, 2753–2775. [Google Scholar] [CrossRef]
Figure 1.
Panel (a) shows the location of the Stability of Altered Forest Ecosystem (SAFE) landscape within Sabah, Malaysia and (b) the LiDAR Canopy Height Model (greener shades corresponding to higher heights in metres) of the SAFE Project landscape including 27 plots located in oil palm plantations.
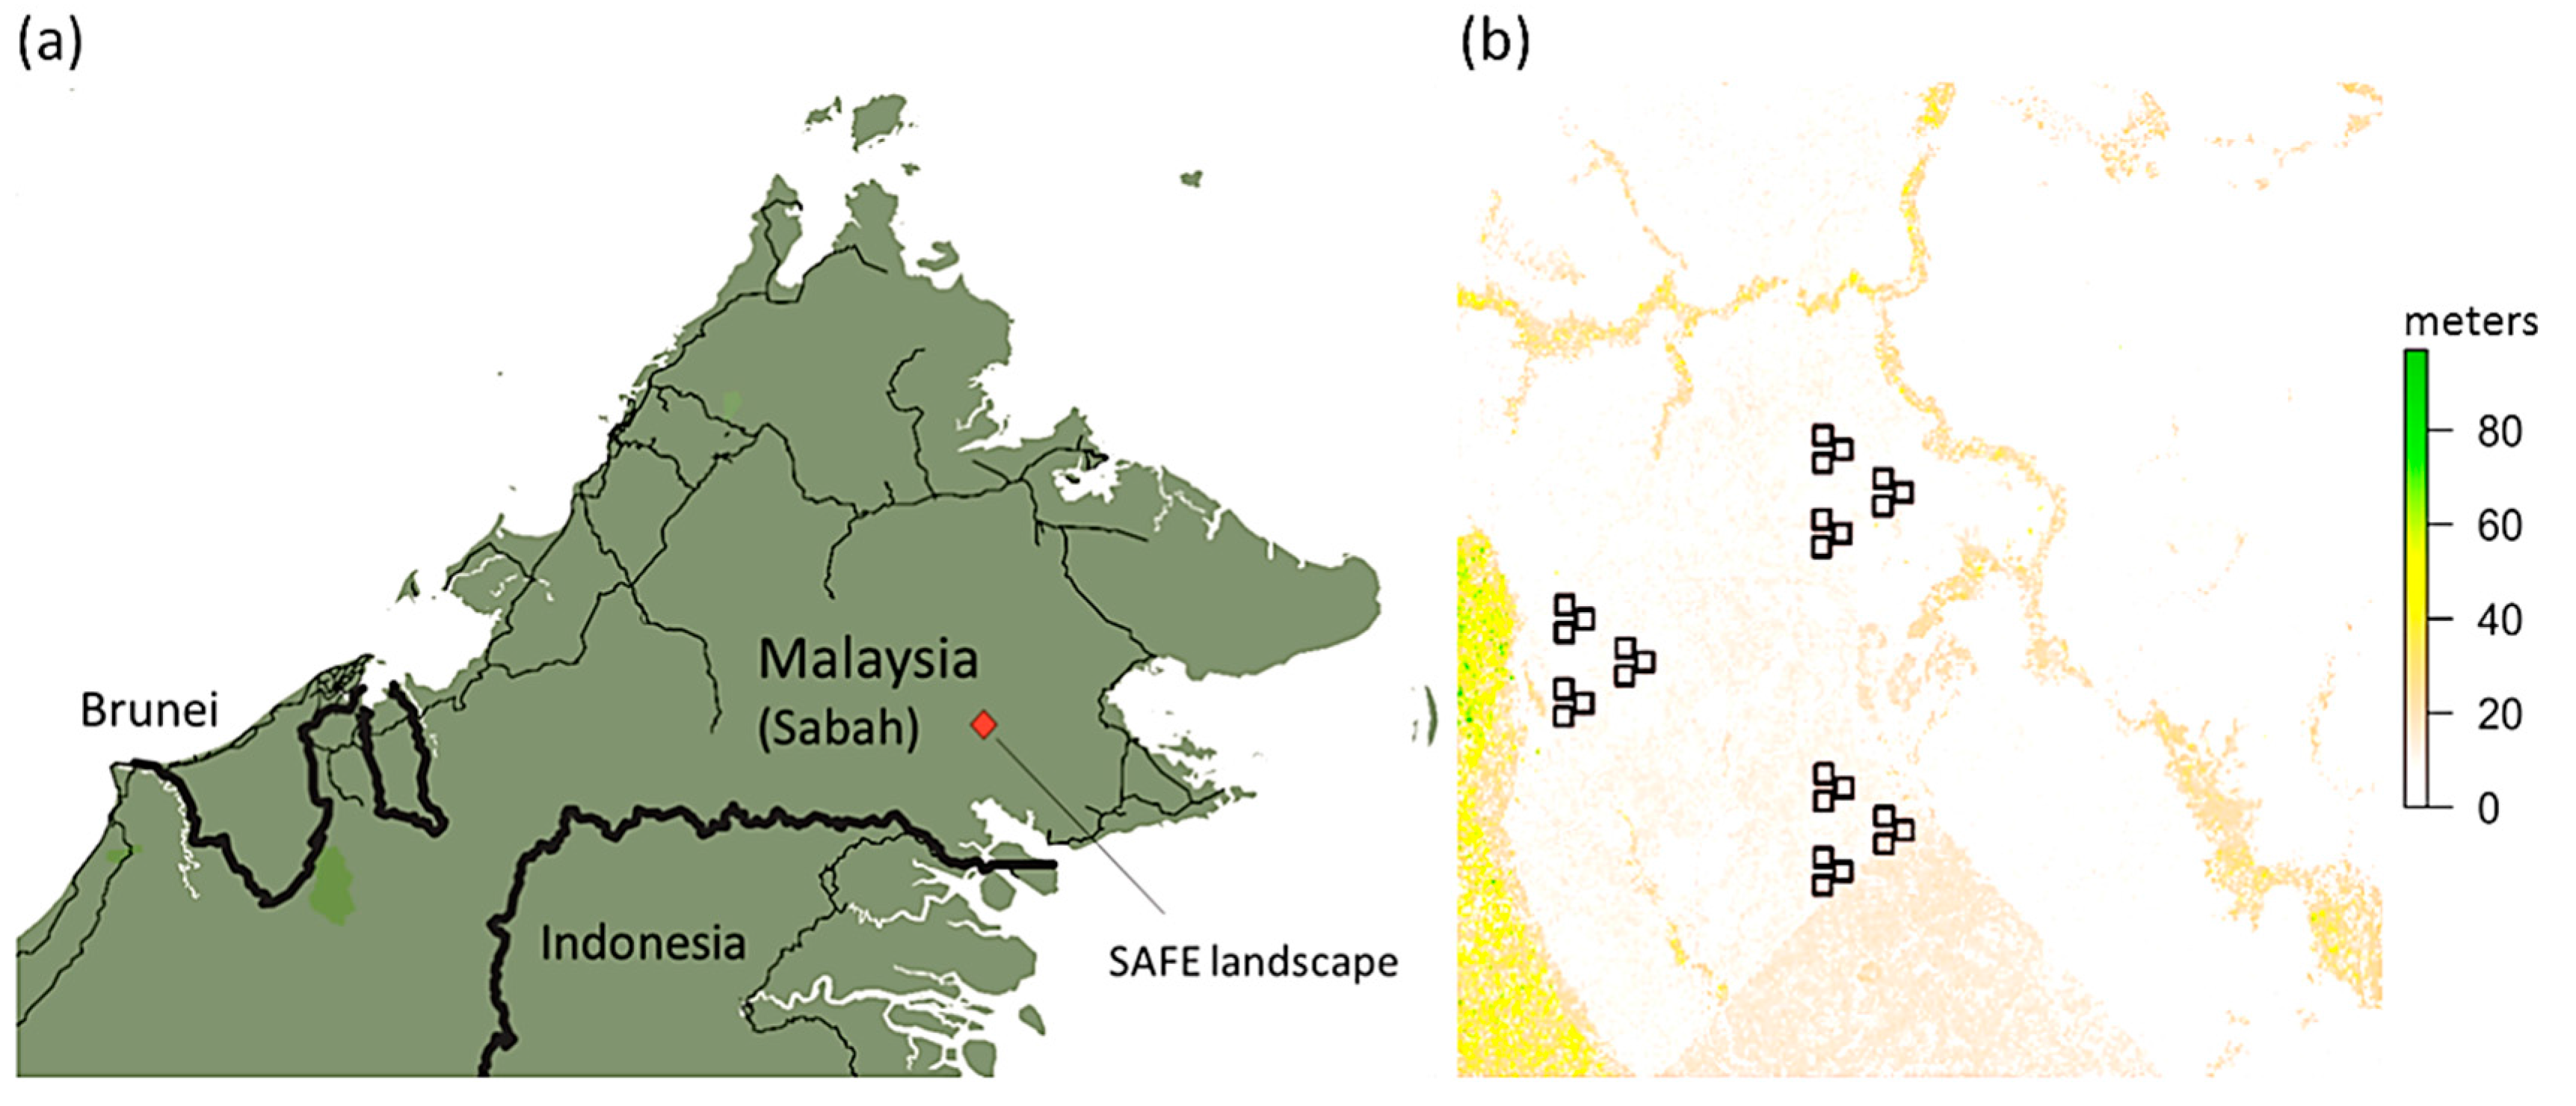
Figure 2.
Boxplots contrasting the structural attributes of oil palm plantations of two different ages (x-axis), based on measurements taken in 27 1-ha plots. ACD is aboveground carbon density (Mg C ha−1).
Figure 2.
Boxplots contrasting the structural attributes of oil palm plantations of two different ages (x-axis), based on measurements taken in 27 1-ha plots. ACD is aboveground carbon density (Mg C ha−1).
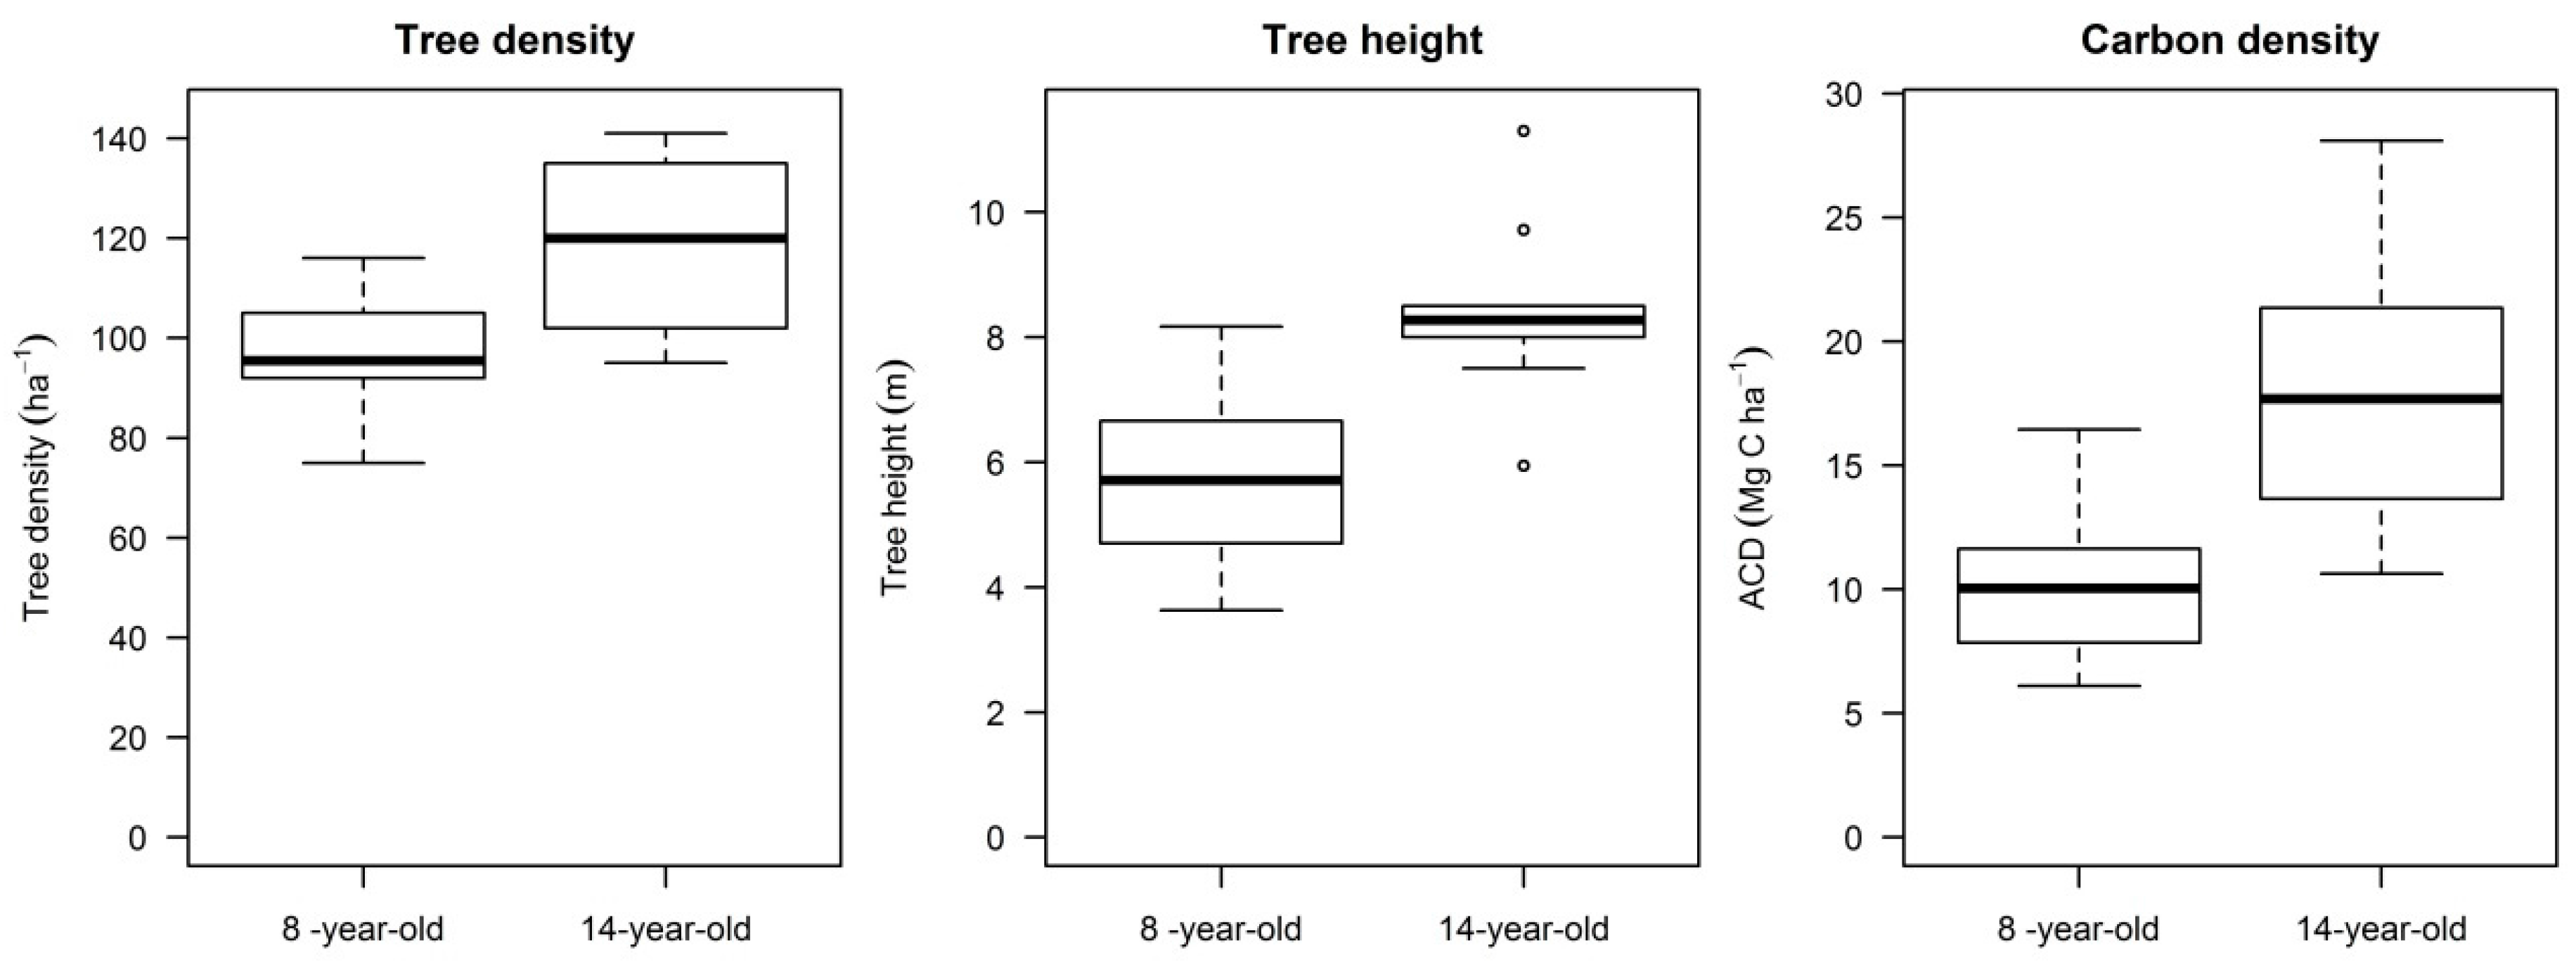
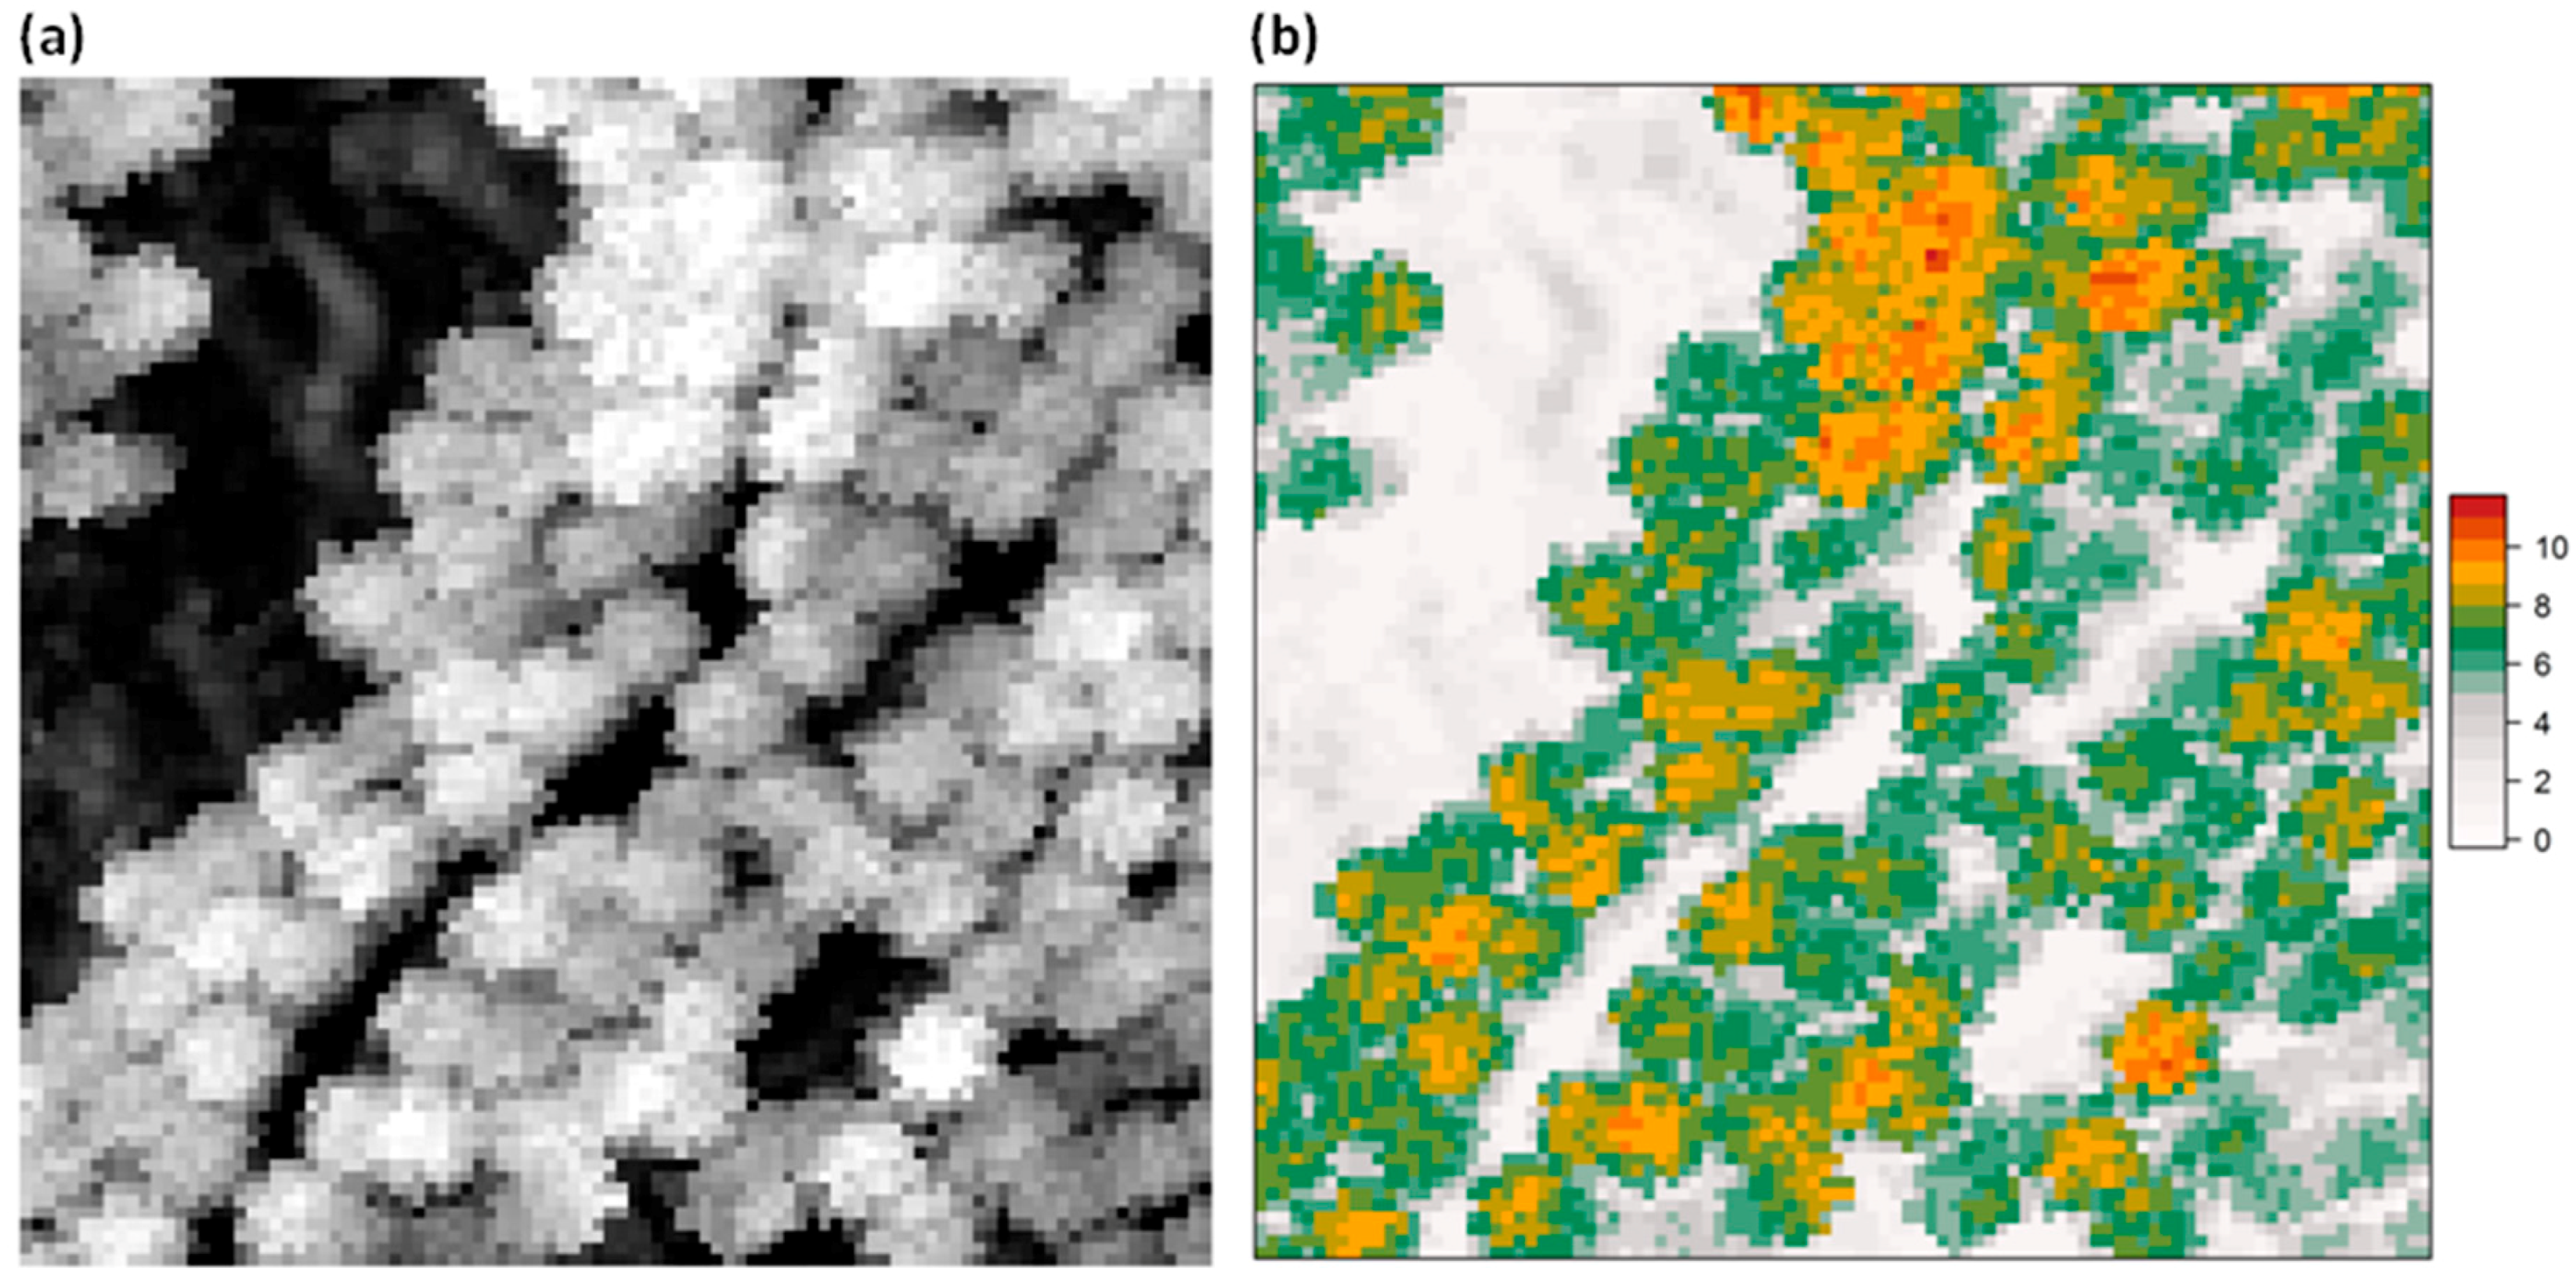
Figure 3.
(a) A monochromatic image from the Pléiades satellite constellation and (b) an airborne LiDAR image of a 1-ha plot to show a typical oil palm plantation canopy. The legend refers to height in metres of individual palms displayed on the LiDAR image.
Figure 3.
(a) A monochromatic image from the Pléiades satellite constellation and (b) an airborne LiDAR image of a 1-ha plot to show a typical oil palm plantation canopy. The legend refers to height in metres of individual palms displayed on the LiDAR image.

Figure 4.
Spearman correlation (r) between field-measured average tree height per plot and LiDAR-derived (a) top-of-canopy-height (TCH), and (b) canopy cover (CC) at 3 m height, as well as between field-measured tree density (#.ha−1) and (c) TCH and (d) CC.
Figure 4.
Spearman correlation (r) between field-measured average tree height per plot and LiDAR-derived (a) top-of-canopy-height (TCH), and (b) canopy cover (CC) at 3 m height, as well as between field-measured tree density (#.ha−1) and (c) TCH and (d) CC.
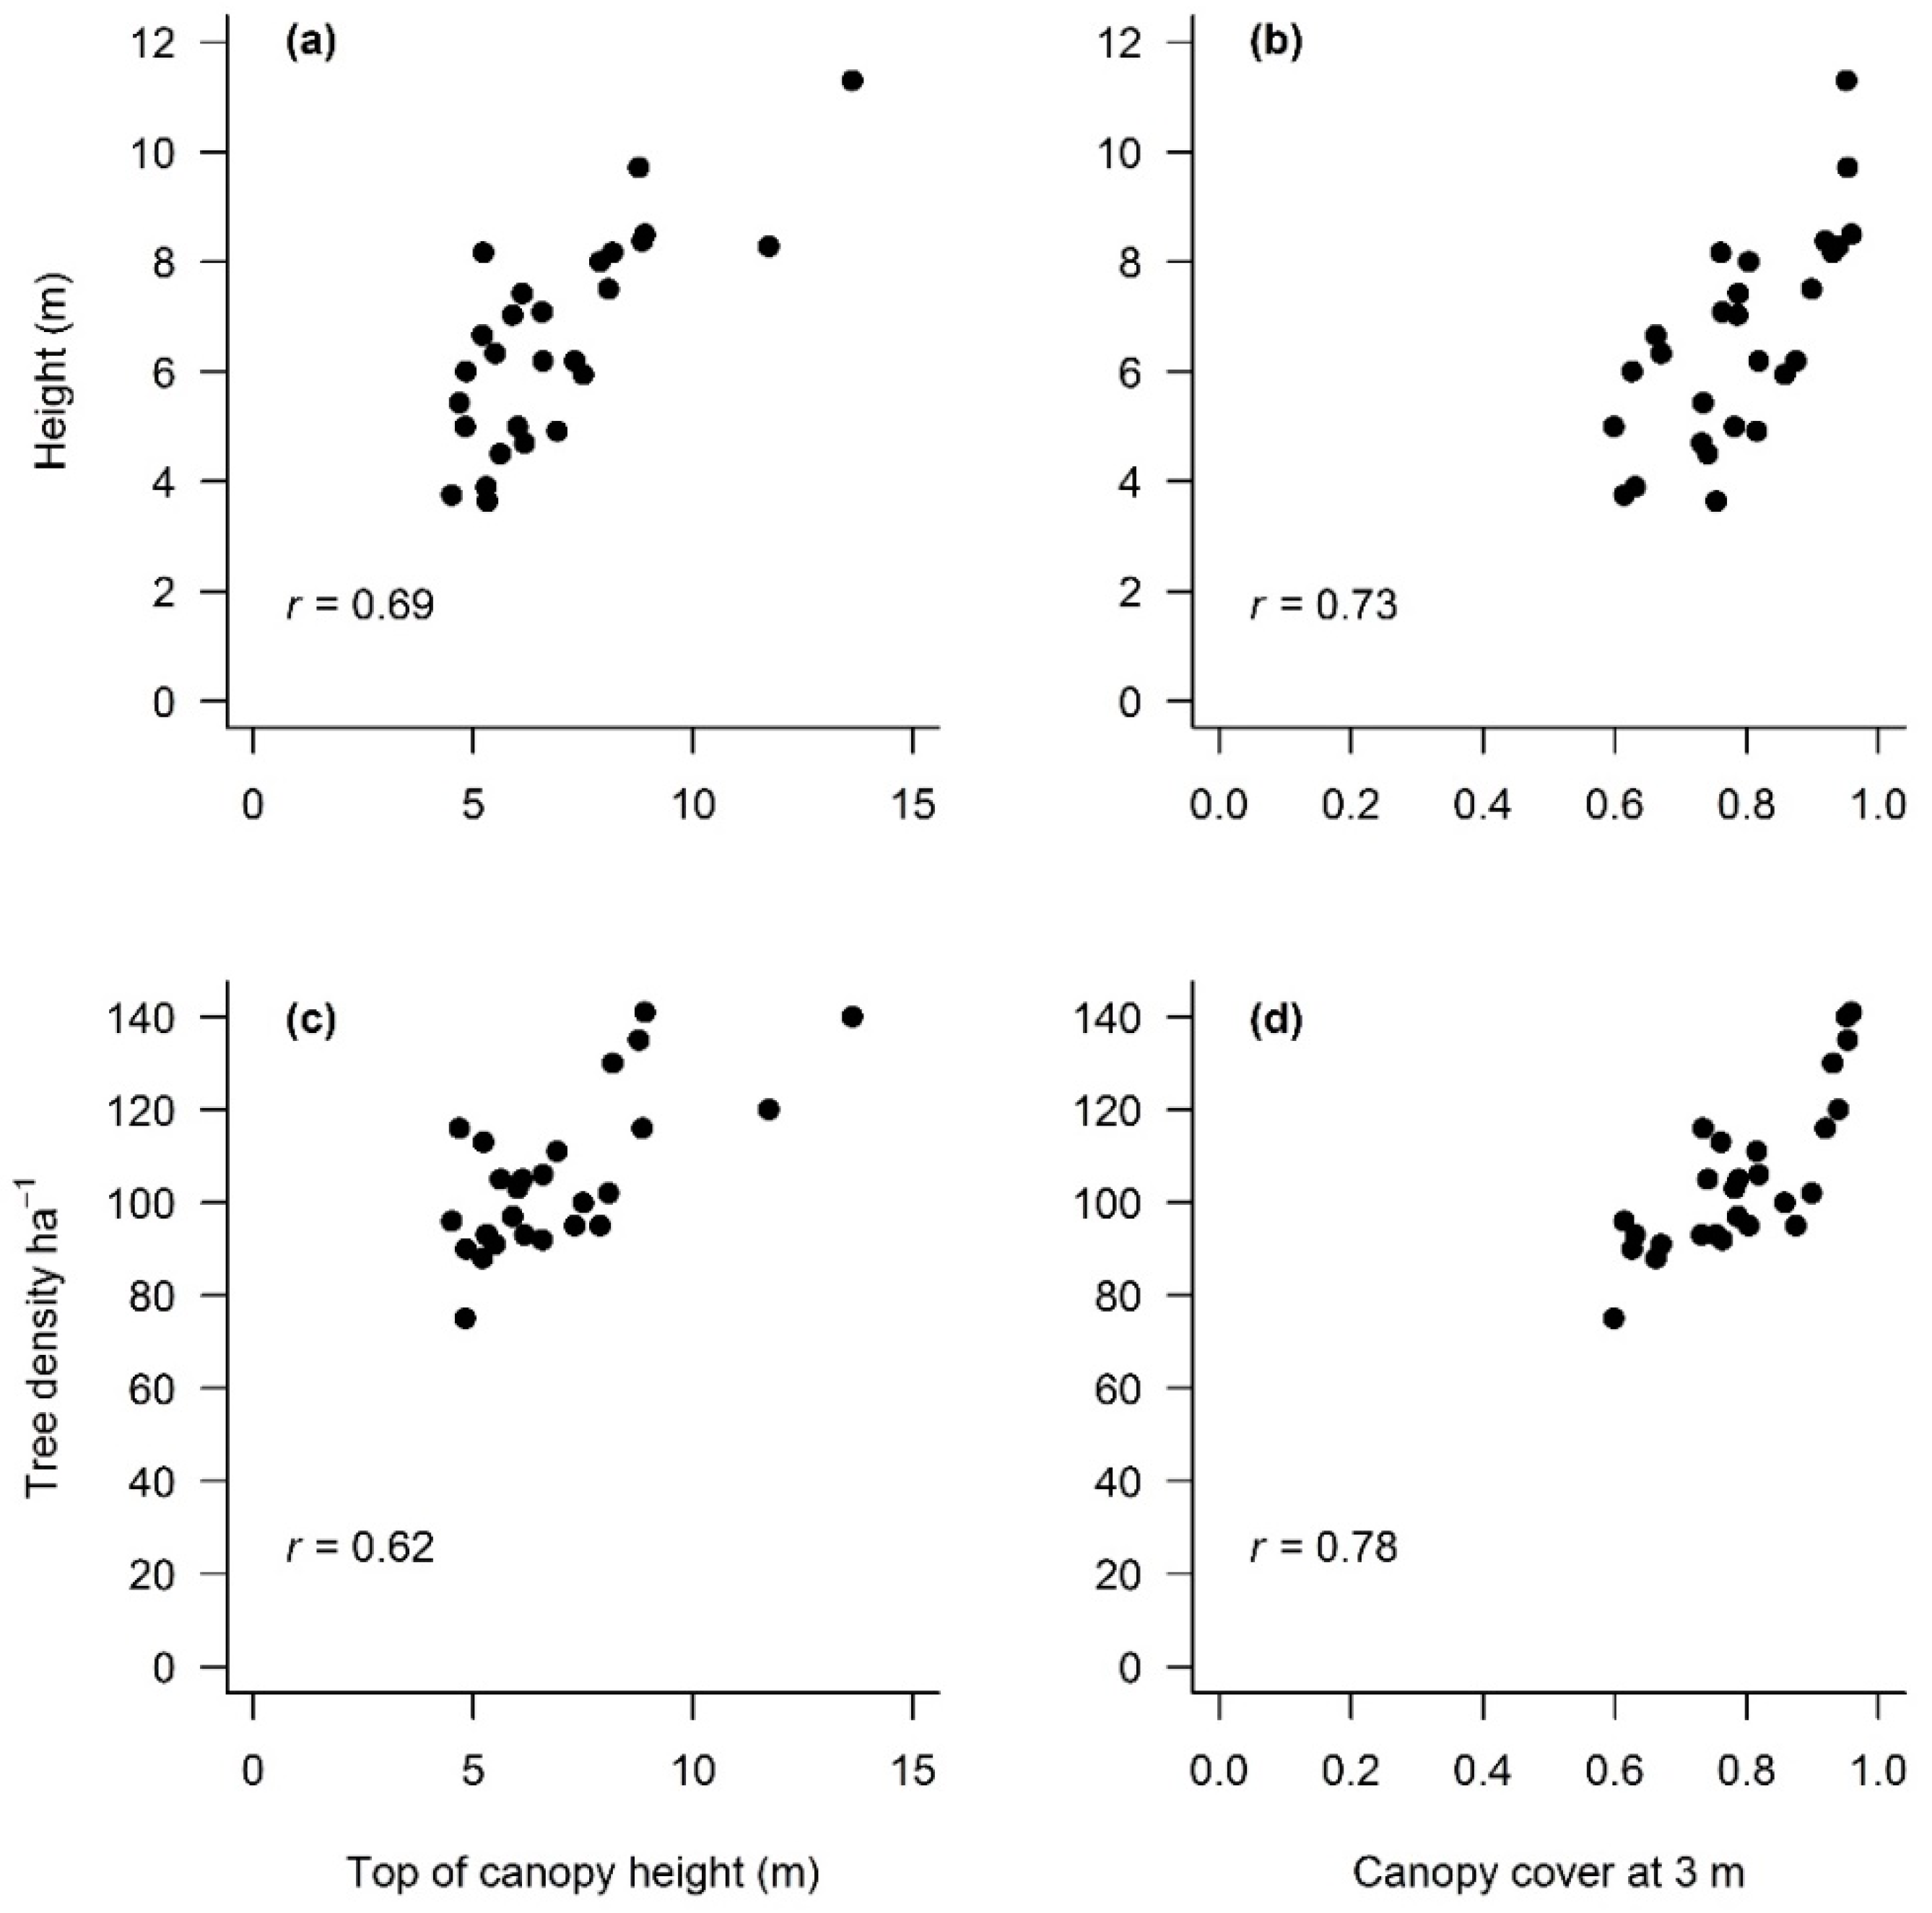
Figure 5.
Relationship between aboveground carbon density (ACD) and (a) top-of-canopy-height (TCH), and (b) canopy cover (CC) at 3 m height per plot for 8-year-old and 14-year-old plantations.
Figure 5.
Relationship between aboveground carbon density (ACD) and (a) top-of-canopy-height (TCH), and (b) canopy cover (CC) at 3 m height per plot for 8-year-old and 14-year-old plantations.

Figure 6.
Relationship between aboveground carbon density (ACD) estimated from field data and (a) ACD estimated from the leave-one-out cross validated datasets using LiDAR-derived top of canopy height (HTC), (b) canopy cover (CC) at 3 m, and (c) ACD estimated from TCH and residual CC at 3 m height per plot for 8-year-old and 14-year-old plantations. The 1:1 line is given for reference in both panels (dashed black lines).

Figure 7.
(a) Detection of individual tree crowns in a 1-ha plot LiDAR imagery using itcSegment (Dalponte and Coomes, 2016) for oil palm plantations; (b) The relationship between tree stem height obtained from field data and tree height obtained from the individual tree crown segmentation (HITC). The regression line fitted to all 27 plots is shown as a red line and the 1:1 line as a black dashed line.

Figure 8.
Relationship between (a) the number of trees in the 1-ha plots estimated from Pléiades optical imagery and number of trees obtained from the LiDAR-derived individual tree crown (ITC) segmentation approach, and (b) aboveground carbon density predicted from the ITC approach and ACD estimated from field data for 8-year-old and 14-year-old plantations. The 1:1 line is given for reference in both panels (dashed black lines).

© 2017 by the authors. Licensee MDPI, Basel, Switzerland. This article is an open access article distributed under the terms and conditions of the Creative Commons Attribution (CC BY) license (http://creativecommons.org/licenses/by/4.0/).
Share and Cite
MDPI and ACS Style
Nunes, M.H.; Ewers, R.M.; Turner, E.C.; Coomes, D.A. Mapping Aboveground Carbon in Oil Palm Plantations Using LiDAR: A Comparison of Tree-Centric versus Area-Based Approaches. Remote Sens. 2017, 9, 816. https://doi.org/10.3390/rs9080816
AMA Style
Nunes MH, Ewers RM, Turner EC, Coomes DA. Mapping Aboveground Carbon in Oil Palm Plantations Using LiDAR: A Comparison of Tree-Centric versus Area-Based Approaches. Remote Sensing. 2017; 9(8):816. https://doi.org/10.3390/rs9080816
Chicago/Turabian StyleNunes, Matheus H., Robert M. Ewers, Edgar C. Turner, and David A. Coomes. 2017. "Mapping Aboveground Carbon in Oil Palm Plantations Using LiDAR: A Comparison of Tree-Centric versus Area-Based Approaches" Remote Sensing 9, no. 8: 816. https://doi.org/10.3390/rs9080816
Note that from the first issue of 2016, this journal uses article numbers instead of page numbers. See further details here.