The Effect of Oligofructose-Enriched Inulin on Faecal Bacterial Counts and Microbiota-Associated Characteristics in Celiac Disease Children Following a Gluten-Free Diet: Results of a Randomized, Placebo-Controlled Trial

 ,
,  , and
, and 
Abstract
:
1. Introduction
2. Materials and Methods
2.1. Study Protocol
2.2. Ethics
2.3. Samples Collection
2.4. Isolation of Bacterial Genomic DNA
2.5. Quantitative Real-Time PCR
2.6. Microbiota-Associated Characteristics
2.7. Statistical Analysis
3. Results
3.1. Response to Intervention
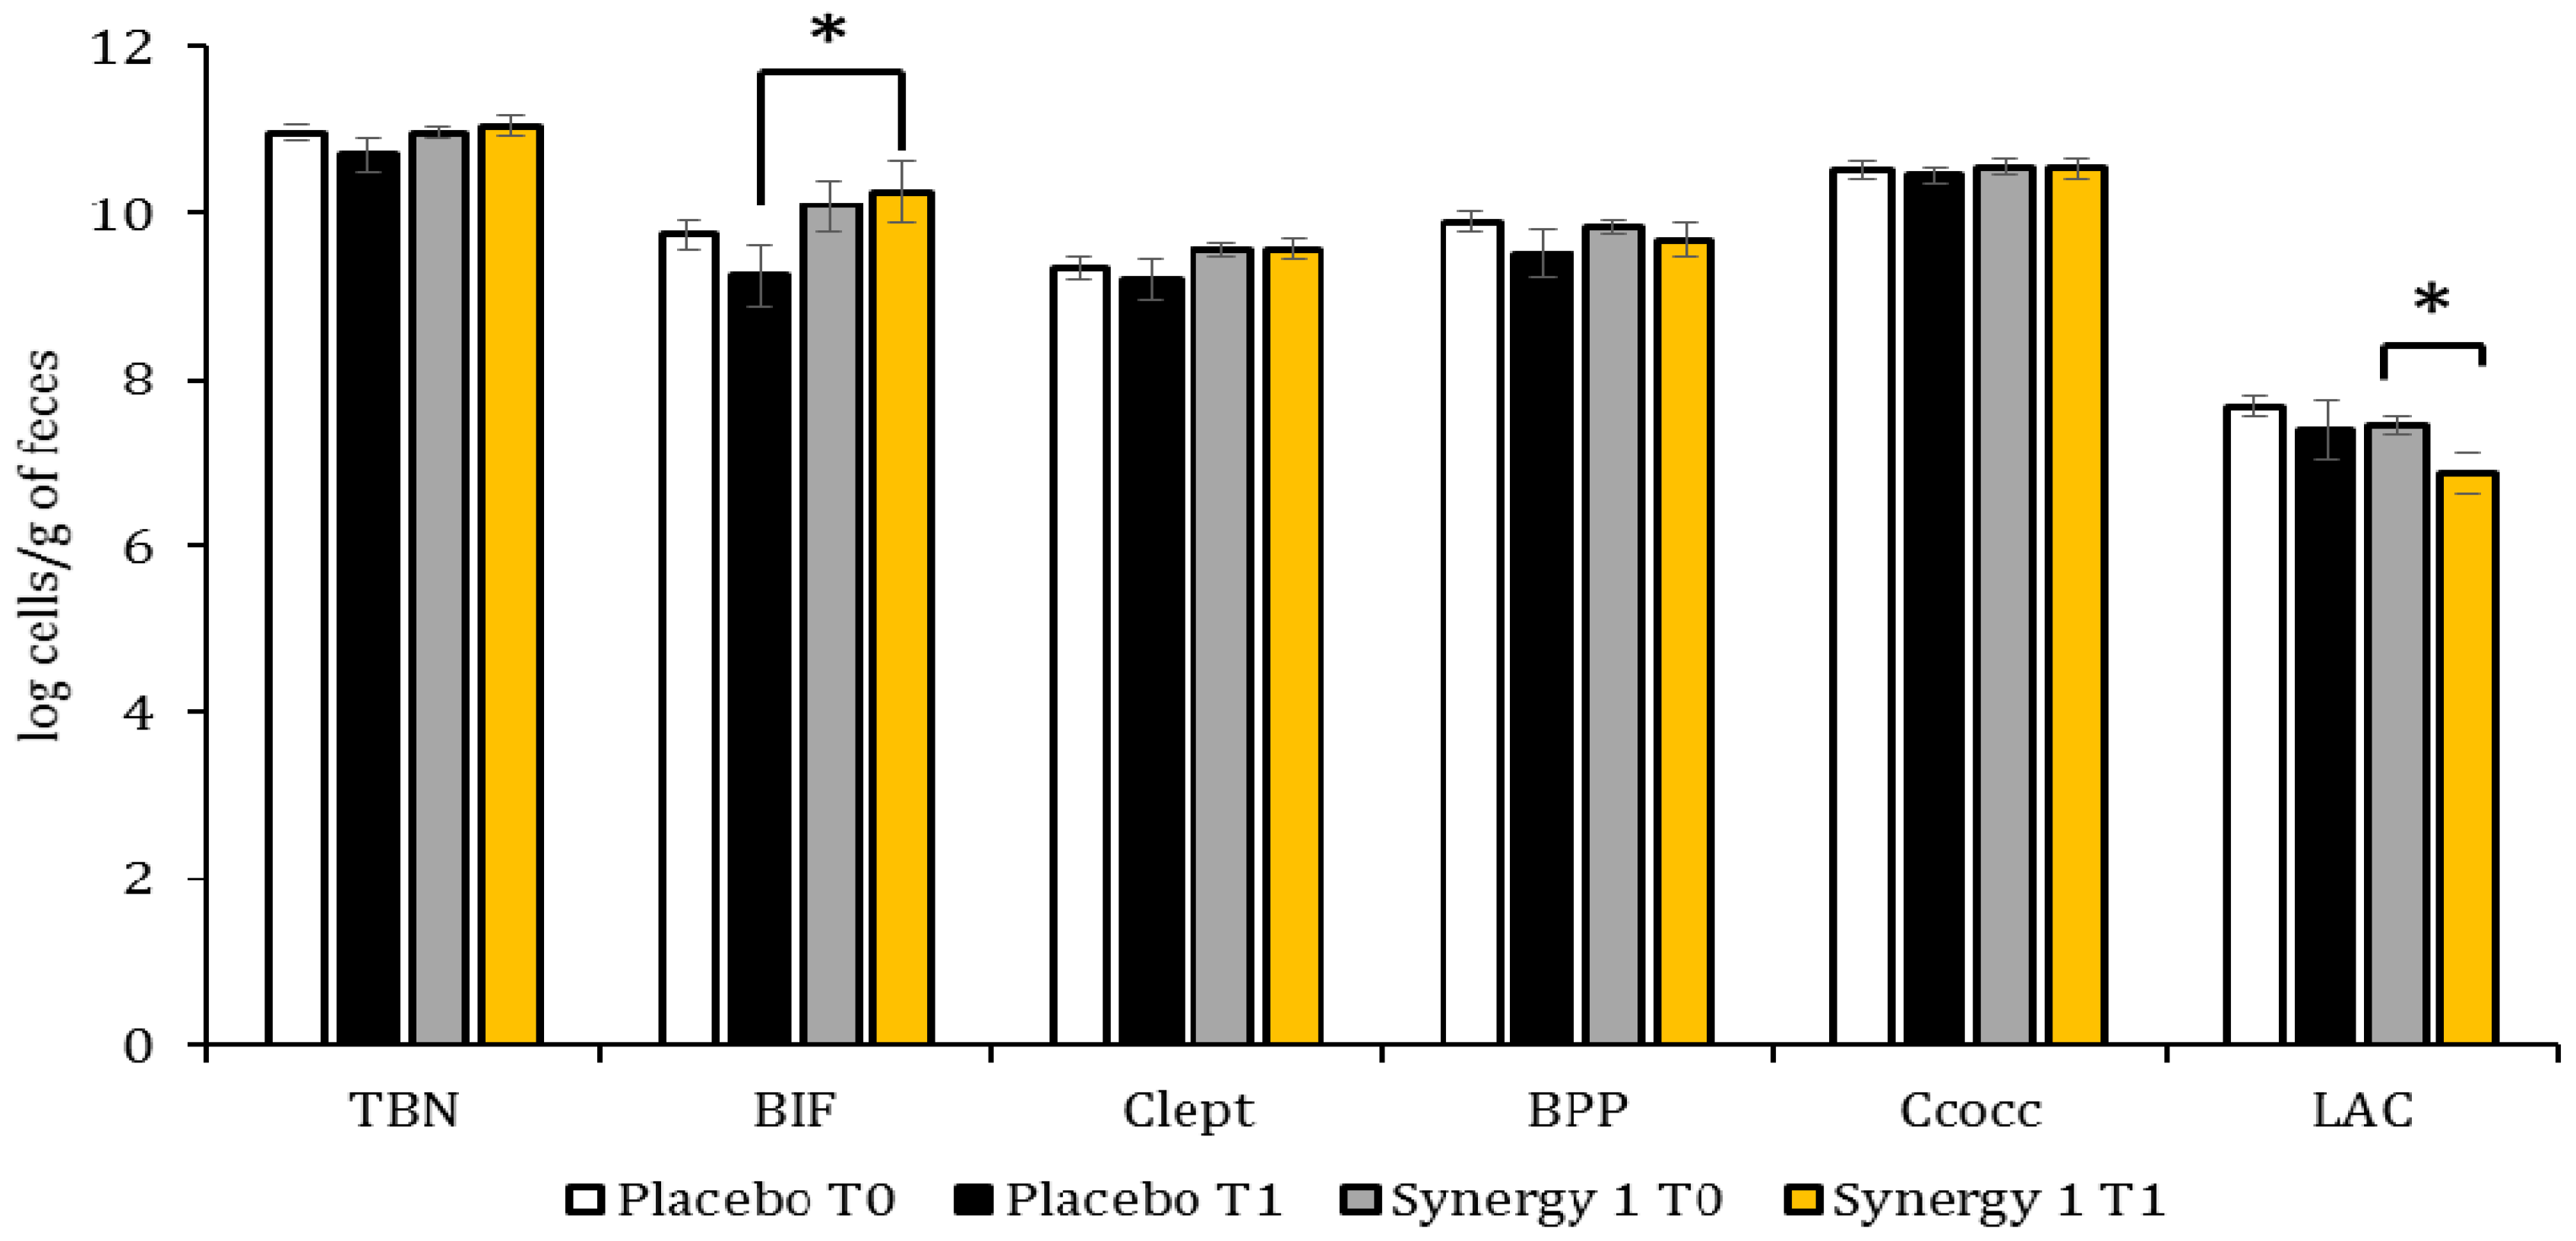
3.2. Quantitative Profile of Fecal Microbiota
3.3. Microbiota-Associated Charcteristics
4. Discussion
5. Conclusions
Acknowledgments
Author Contributions
Conflicts of Interest
References
- O’Hara, A.M.; Shanahan, F. Gut Microbiota: Mining for Therapeutic Potential. Clin. Gastroenterol. Hepatol. 2007, 5, 274–284. [Google Scholar] [CrossRef] [PubMed]
- Jandhyala, S.M.; Talukdar, R.; Subramanyam, C.; Vuyyuru, H.; Sasikala, M.; Reddy, D.N. Role of the normal gut microbiota. World J. Gastroenterol. 2015, 21, 8836–8847. [Google Scholar] [CrossRef] [PubMed]
- Leonard, M.M.; Fasano, A. The microbiome as a possible target to prevent celiac disease. Expert Rev. Gastroenterol. Hepatol. 2016, 10, 555–556. [Google Scholar] [CrossRef] [PubMed]
- Gujral, N.; Freeman, H.J.; Thomson, A.B.R. Celiac disease: Prevalence, diagnosis, pathogenesis and treatment. World J. Gastroenterol. 2012, 18, 6036–6059. [Google Scholar] [CrossRef] [PubMed]
- Marasco, G.; di Biase, A.R.; Schiumerini, R.; Eusebi, L.H.; Iughetti, L.; Ravaioli, F.; Scaioli, E.; Colecchia, A.; Festi, D. Gut microbiota and celiac disease. Dig. Dis. Sci. 2016, 61, 1461–1472. [Google Scholar] [CrossRef] [PubMed]
- Di Cagno, R.; de Angelis, M.; de Pasquale, I.; Ndagijimana, M.; Vernocchi, P.; Ricciuti, P.; Gagliardi, F.; Laghi, L.; Crecchio, C.; Guerzoni, M.; et al. Duodenal and faecal microbiota of celiac children: Molecular, phenotype and metabolome characterization. BMC Microbiol. 2011, 11, 219. [Google Scholar] [CrossRef] [PubMed]
- Nistal, E.; Caminero, A.; Vivas, S.; Ruiz de Morales, J.M.; Sáenz de Miera, L.E.; Rodríguez-Aparicio, L.B.; Casqueiro, J. Differences in faecal bacteria populations and faecal bacteria metabolism in healthy adults and celiac disease patients. Biochimie 2012, 94, 1724–1729. [Google Scholar] [CrossRef] [PubMed]
- Sanz, Y.; Sánchez, E.; Marzotto, M.; Calabuig, M.; Torriani, S.; Dellaglio, F. Differences in faecal bacterial communities in coeliac and healthy children as detected by PCR and denaturing gradient gel electrophoresis. FEMS Immunol. Med. Microbiol. 2007, 51, 562–568. [Google Scholar] [CrossRef] [PubMed]
- De Palma, G.; Nadal, I.; Medina, M.; Donat, E.; Ribes-Koninckx, C.; Calabuig, M.; Sanz, Y. Intestinal dysbiosis and reduced immunoglobulin-coated bacteria associated with coeliac disease in children. BMC Microbiol. 2010, 10, 63. [Google Scholar] [CrossRef] [PubMed] [Green Version]
- Ilus, T.; Kaukinen, K.; Virta, L.J.; Pukkala, E.; Collin, P. Incidence of malignancies in diagnosed celiac patients: A population-based estimate. Am. J. Gastroenterol. 2014, 109, 1471–1477. [Google Scholar] [CrossRef] [PubMed]
- Tjellström, B.; Stenhammar, L.; Högberg, L.; Fälth-Magnusson, K.; Magnusson, K.E.; Midtvedt, T.; Sundqvist, T.; Norin, E. Gut microflora associated characteristics in children with celiac disease. Am. J. Gastroenterol. 2005, 100, 2784–2788. [Google Scholar] [CrossRef] [PubMed]
- Tjellström, B.; Stenhammar, L.; Sundqvist, T.; Fälth-Magnusson, K.; Hollén, E.; Magnusson, K.E.; Norin, E.; Midtvedt, T.; Högberg, L. The effects of oats on the function of gut microflora in children with coeliac disease. Aliment. Pharmacol. Ther. 2014, 39, 1156–1160. [Google Scholar] [CrossRef] [PubMed]
- Morrison, D.J.; Preston, T. Formation of short chain fatty acids by the gut microbiota and their impact on human metabolism. Gut Microbes 2016, 7, 189–200. [Google Scholar] [CrossRef] [PubMed]
- Leonard, M.M.; Sapone, A.; Catassi, C.; Fasano, A. Celiac disease and nonceliac gluten sensitivity: A review. JAMA 2017, 318, 647–656. [Google Scholar] [CrossRef] [PubMed]
- Quagliariello, A.; Aloisio, I.; Bozzicionci, N.; Luiselli, D.; D’Auria, G.; Martinez-Priego, L.; Pérez-Villarroya, D.; Langerholc, T.; Primec, M.; Mičetić-Turk, D.; et al. Effect of bifidobacterium breve on the intestinal microbiota of coeliac children on a gluten free diet: A pilot study. Nutrients 2016, 8, 660. [Google Scholar] [CrossRef] [PubMed]
- Gibson, G.R.; Hutkins, R.; Sanders, M.E.; Prescott, S.L.; Reimer, R.A.; Salminen, S.J.; Scott, K.; Stanton, C.; Swanson, K.S.; Cani, P.D.; et al. Expert consensus document: The International Scientific Association for Probiotics and Prebiotics (ISAPP) consensus statement on the definition and scope of prebiotics. Nat. Rev. Gastroenterol. Hepatol. 2017. [Google Scholar] [CrossRef] [PubMed]
- Gibson, G.R.; Roberfroid, M.B. Dietary modulation of the human colonic microbiota: Introducing the concept of prebiotics. J. Nutr. 1995, 125, 1401–1412. [Google Scholar] [PubMed]
- Wilson, B.; Whelan, K. Prebiotic inulin-type fructans and galacto-oligosaccharides: Definition, specificity, function, and application in gastrointestinal disorders. J. Gastroenterol. Hepatol. 2017, 32, 64–68. [Google Scholar] [CrossRef] [PubMed]
- Wong, C.; Harris, P.; Ferguson, L. Potential benefits of dietary fibre intervention in inflammatory bowel disease. Int. J. Mol. Sci. 2016, 17, 919. [Google Scholar] [CrossRef] [PubMed]
- Krupa-Kozak, U.; Drabińska, N.; Jarocka-Cyrta, E. The effect of oligofructose-enriched inulin supplementation on gut microbiota, nutritional status and gastrointestinal symptoms in paediatric coeliac disease patients on a gluten-free diet: Study protocol for a pilot randomized controlled trial. Nutr. J. 2017, 16. [Google Scholar] [CrossRef] [PubMed]
- ClinicalTrials.gov. Available online: http://www.clinicaltrials.gov (accessed on 11 February 2018).
- Fotschki, J.; Szyc, A.M.; Laparra, J.M.; Markiewicz, L.H.; Wróblewska, B. Immune-modulating properties of horse milk administered to mice sensitized to cow milk. J. Dairy Sci. 2016, 99, 9395–9404. [Google Scholar] [CrossRef] [PubMed]
- Fuller, Z.; Louis, P.; Mihajlovski, A.; Rungapamestry, V.; Ratcliffe, B.; Duncan, A.J. Influence of cabbage processing methods and prebiotic manipulation of colonic microflora on glucosinolate breakdown in man. Br. J. Nutr. 2007, 98, 364–372. [Google Scholar] [CrossRef] [PubMed]
- Rinttilä, T.; Kassinen, A.; Malinen, E.; Krogius, L.; Palva, A. Development of an extensive set of 16S rDNA-targeted primers for quantification of pathogenic and indigenous bacteria in faecal samples by real-time PCR. J. Appl. Microbiol. 2004, 97, 1166–1177. [Google Scholar] [CrossRef] [PubMed]
- Shen, J.; Zhang, B.; Wei, G.; Pang, X.; Wei, H.; Li, M.; Zhang, Y.; Jia, W.; Zhao, L. Molecular profiling of the Clostridium leptum subgroup in human fecal microflora by PCR-denaturing gradient gel electrophoresis and clone library analysis. Appl. Environ. Microbiol. 2006, 72, 5232–5238. [Google Scholar] [CrossRef] [PubMed]
- Matsuki, T.; Watanabe, K.; Fujimoto, J.; Miyamoto, Y.; Takada, T.; Matsumoto, K.; Oyaizu, H.; Tanaka, R. Development of 16S rRNA-gene-targeted group-specific primers for the detection and identification of predominant bacteria in human feces. Appl. Environ. Microbiol. 2002, 68, 5445–5451. [Google Scholar] [CrossRef] [PubMed]
- Heilig, H.G.H.J.; Zoetendal, E.G.; Vaughan, E.E.; Marteau, P.; Akkermans, A.D.L.; de Vos, W.M. Molecular diversity of Lactobacillus spp. and other lactic acid bacteria in the human intestine as determined by specific amplification of 16S ribosomal DNA. Appl. Environ. Microbiol. 2002, 68, 114–123. [Google Scholar] [CrossRef] [PubMed]
- García-Villalba, R.; Giménez-Bastida, J.A.; García-Conesa, M.T.; Tomás-Barberán, F.A.; Carlos Espín, J.; Larrosa, M. Alternative method for gas chromatography-mass spectrometry analysis of short-chain fatty acids in faecal samples. J. Sep. Sci. 2012, 35, 1906–1913. [Google Scholar] [CrossRef] [PubMed]
- McCalley, D.V. Analysis of volatile fatty acids by capillary gas chromatography using on-column injection of aqueous solutions. J. High Resolut. Chromatogr. 1989, 12, 465–467. [Google Scholar] [CrossRef]
- Drabińska, N.; Zieliński, H.; Krupa-Kozak, U. Technological benefits of inulin-type fructans application in gluten-free products—A review. Trends Food Sci. Technol. 2016, 56. [Google Scholar] [CrossRef]
- Salazar, N.; Dewulf, E.M.; Neyrinck, A.M.; Bindels, L.B.; Cani, P.D.; Mahillon, J.; de Vos, W.M.; Thissen, J.P.; Gueimonde, M.; de los Reyes-Gavilán, C.G.; et al. Inulin-type fructans modulate intestinal Bifidobacterium species populations and decrease fecal short-chain fatty acids in obese women. Clin. Nutr. 2015, 34, 501–507. [Google Scholar] [CrossRef] [PubMed]
- Langlands, S.J. Prebiotic carbohydrates modify the mucosa associated microflora of the human large bowel. Gut 2004, 53, 1610–1616. [Google Scholar] [CrossRef] [PubMed]
- Bouhnik, Y.; Raskine, L.; Champion, K.; Andrieux, C.; Penven, S.; Jacobs, H.; Simoneau, G. Prolonged administration of low-dose inulin stimulates the growth of bifidobacteria in humans. Nutr. Res. 2007, 27, 187–193. [Google Scholar] [CrossRef]
- Aloisio, I.; Santini, C.; Biavati, B.; Dinelli, G.; Cencič, A.; Chingwaru, W.; Mogna, L.; Di Gioia, D. Characterization of Bifidobacterium spp. strains for the treatment of enteric disorders in newborns. Appl. Microbiol. Biotechnol. 2012, 96, 1561–1576. [Google Scholar] [CrossRef] [PubMed]
- Klemenak, M.; Dolinšek, J.; Langerholc, T.; di Gioia, D.; Mičetić-Turk, D. Administration of Bifidobacterium breve decreases the production of TNF-α in children with celiac disease. Dig. Dis. Sci. 2015, 60, 3386–3392. [Google Scholar] [CrossRef] [PubMed]
- Medina, M.; de Palma, G.; Ribes-Koninckx, C.; Calabuig, M.; Sanz, Y. Bifidobacterium strains suppress in vitro the pro-inflammatory milieu triggered by the large intestinal microbiota of coeliac patients. J. Inflamm. 2008, 5, 19. [Google Scholar] [CrossRef] [PubMed]
- Peterson, D.A.; McNulty, N.P.; Guruge, J.L.; Gordon, J.I. IgA response to symbiotic bacteria as a mediator of gut homeostasis. Cell Host Microbe 2007, 2, 328–339. [Google Scholar] [CrossRef] [PubMed]
- Tuohy, K.M.; Finlay, R.K.; Wynne, A.G.; Gibson, G.R. A Human volunteer study on the prebiotic effects of HP-inulin—Faecal bacteria enumerated using fluorescent in situ hybridisation (FISH). Anaerobe 2001, 7, 113–118. [Google Scholar] [CrossRef]
- Sghir, A.; Gramet, G.; Suau, A.; Rochet, V.; Pochart, P.; Dore, J. Quantification of bacterial groups within human fecal flora by oligonucleotide probe hybridization. Appl. Environ. Microbiol. 2000, 66, 2263–2266. [Google Scholar] [CrossRef] [PubMed]
- Collins, M.D.; Lawson, P.A.; Willems, A.; Cordoba, J.J.; Fernandez-Garayzabal, J.; Garcia, P.; Cai, J.; Hippe, H.; Farrow, J.A. The phylogeny of the genus Clostridium: Proposal of five new genera and eleven new species combinations. Int. J. Syst. Bacteriol. 1994, 44, 812–826. [Google Scholar] [CrossRef] [PubMed]
- Louis, P.; Flint, H.J. Diversity, metabolism and microbial ecology of butyrate-producing bacteria from the human large intestine. FEMS Microbiol. Lett. 2009, 294, 1–8. [Google Scholar] [CrossRef] [PubMed]
- Kabeerdoss, J.; Sankaran, V.; Pugazhendhi, S.; Ramakrishna, B.S. Clostridium leptum group bacteria abundance and diversity in the fecal microbiota of patients with inflammatory bowel disease: A case-control study in India. BMC Gastroenterol. 2013, 13, 20. [Google Scholar] [CrossRef] [PubMed]
- Adebola, O.O.; Corcoran, O.; Morgan, W.A. Synbiotics: The impact of potential prebiotics inulin, lactulose and lactobionic acid on the survival and growth of lactobacilli probiotics. J. Funct. Foods 2014, 10, 75–84. [Google Scholar] [CrossRef]
- Krupa-Kozak, U.; Markiewicz, L.H.; Lamparski, G.; Juśkiewicz, J. Administration of inulin-supplemented gluten-free diet modified calcium absorption and caecal microbiota in rats in a calcium-dependent manner. Nutrients 2017, 9. [Google Scholar] [CrossRef] [PubMed]
- Beaumont, M.; Portune, K.J.; Steuer, N.; Lan, A.; Cerrudo, V.; Audebert, M.; Dumont, F.; Mancano, G.; Khodorova, N.; Andriamihaja, M.; et al. Quantity and source of dietary protein influence metabolite production by gut microbiota and rectal mucosa gene expression: A randomized, parallel, double-blind trial in overweight humans. Am. J. Clin. Nutr. 2017, 106, 1005–1019. [Google Scholar] [CrossRef] [PubMed]
- Wu, G.D.; Compher, C.; Chen, E.Z.; Smith, S.A.; Shah, R.D.; Bittinger, K.; Chehoud, C.; Albenberg, L.G.; Nessel, L.; Gilroy, E.; et al. Comparative metabolomics in vegans and omnivores reveal constraints on diet-dependent gut microbiota metabolite production. Gut 2016, 65, 63–72. [Google Scholar] [CrossRef] [PubMed]
- Fukuda, S.; Toh, H.; Hase, K.; Oshima, K.; Nakanishi, Y.; Yoshimura, K.; Tobe, T.; Clarke, J.M.; Topping, D.L.; Suzuki, T.; et al. Bifidobacteria can protect from enteropathogenic infection through production of acetate. Nature 2011, 469, 543–547. [Google Scholar] [CrossRef] [PubMed]
- Tjellström, B.; Högberg, L.; Stenhammar, L.; Fälth-Magnusson, K.; Magnusson, K.; Norin, E.; Sundqvist, T.; Midtvedt, T. Faecal short-chain fatty acid pattern in childhood coeliac disease is normalised after more than one year’s gluten-free diet. Microb. Ecol. Health Dis. 2013, 24, 1–5. [Google Scholar] [CrossRef] [PubMed]
- Richards, J.L.; Yap, Y.A.; McLeod, K.H.; Mackay, C.R.; Mariño, E. Dietary metabolites and the gut microbiota: An alternative approach to control inflammatory and autoimmune diseases. Clin. Transl. Immunol. 2016, 5, e82. [Google Scholar] [CrossRef] [PubMed]
- Nilsson, U.; Nyman, M. Short-chain fatty acid formation in the hindgut of rats fed oligosaccharides varying in monomeric composition, degree of polymerisation and solubility. Br. J. Nutr. 2005, 94, 705. [Google Scholar] [CrossRef] [PubMed]
- Kanauchi, O.; Andoh, A.; Iwanaga, T.; Fujiyama, Y.; Mitsuyama, K.; Toyonaga, A.; Bamba, T. Germinated barley foodstuffs attenuate colonic mucosal damage and mucosal nuclear factor kappa B activity in a spontaneous colitis model. J. Gastroenterol. Hepatol. 1999, 14, 1173–1179. [Google Scholar] [CrossRef] [PubMed]
- Abela, A.-G.; Fava, S. Does the level of bacterial exposure in early life impact the risk of Type 1 diabetes? Expert Rev. Clin. Immunol. 2013, 9, 695–697. [Google Scholar] [CrossRef] [PubMed]


| Target | Primer | Sequence (5′ → 3′) | Ta (°C) | Reference |
|---|---|---|---|---|
| Total bacteria | UniF | GTGSTGCAYGGYYGTCGTCA | 60 | [23] |
| UniR | ACGTCRTCCMCNCCTTCCTC | |||
| Bifidobacterium | BIF-F | TCG CGTC(C/T)GGTGTGAAAG | 58 | [24] |
| BIF-R | CCACATCCAGC(A/G)TCCAC | |||
| Clostridium leptum group | sg-Clept-F | GCACAAGCAGTGGAGT | 53 | [25] |
| sg-Clept-R3 | CTTCCTCCGTTTTGTCAA | |||
| Bacteroides-Prevotella-Porphyromonas | BPP-F | GGTGTCGGCTTAAGTGCCAT | 56 | [24] |
| BPP-R | CGGA(C/T)GTAAGGGCCGTGC | |||
| Clostridium coccoides group | g-ccoc-F | AAATGACGGTACCTGACTAA | 58 | [26] |
| g-ccoc-R | CTTTGAGTTTCATTCTTGCGAA | |||
| Lactobacillus | Lac1F | AGCAGTAGGGAATCTTCCA | 58 | [27] |
| Lab667 | CACCGCTACACATGGAG |
| Observation | Synergy 1 | Placebo |
|---|---|---|
| Abdominal pain 1 | 3 | 3 |
| Everyday defecation 2 (%) | ||
| Yes | 90 | 81 |
| No | 10 | 19 |
| Defecation No/day | 1.3 ± 0.5 | 1.1 ± 0.2 |
| Normal stool consistency 3 (%) | 95 | 69 |
| Discomfort after the intake of supplement | 0 | 2 |
| SCFA | Placebo Group | Synergy 1 Group | Placebo: T0 vs. T1 2 | Synergy 1: T0 vs. T1 | T1: Placebo vs. Synergy 1 3 | ||
|---|---|---|---|---|---|---|---|
| T0 | T1 | T0 | T1 | ||||
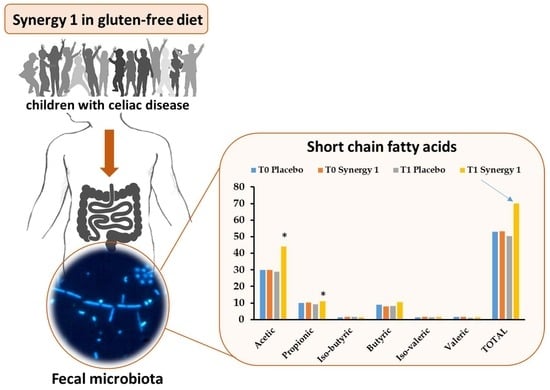
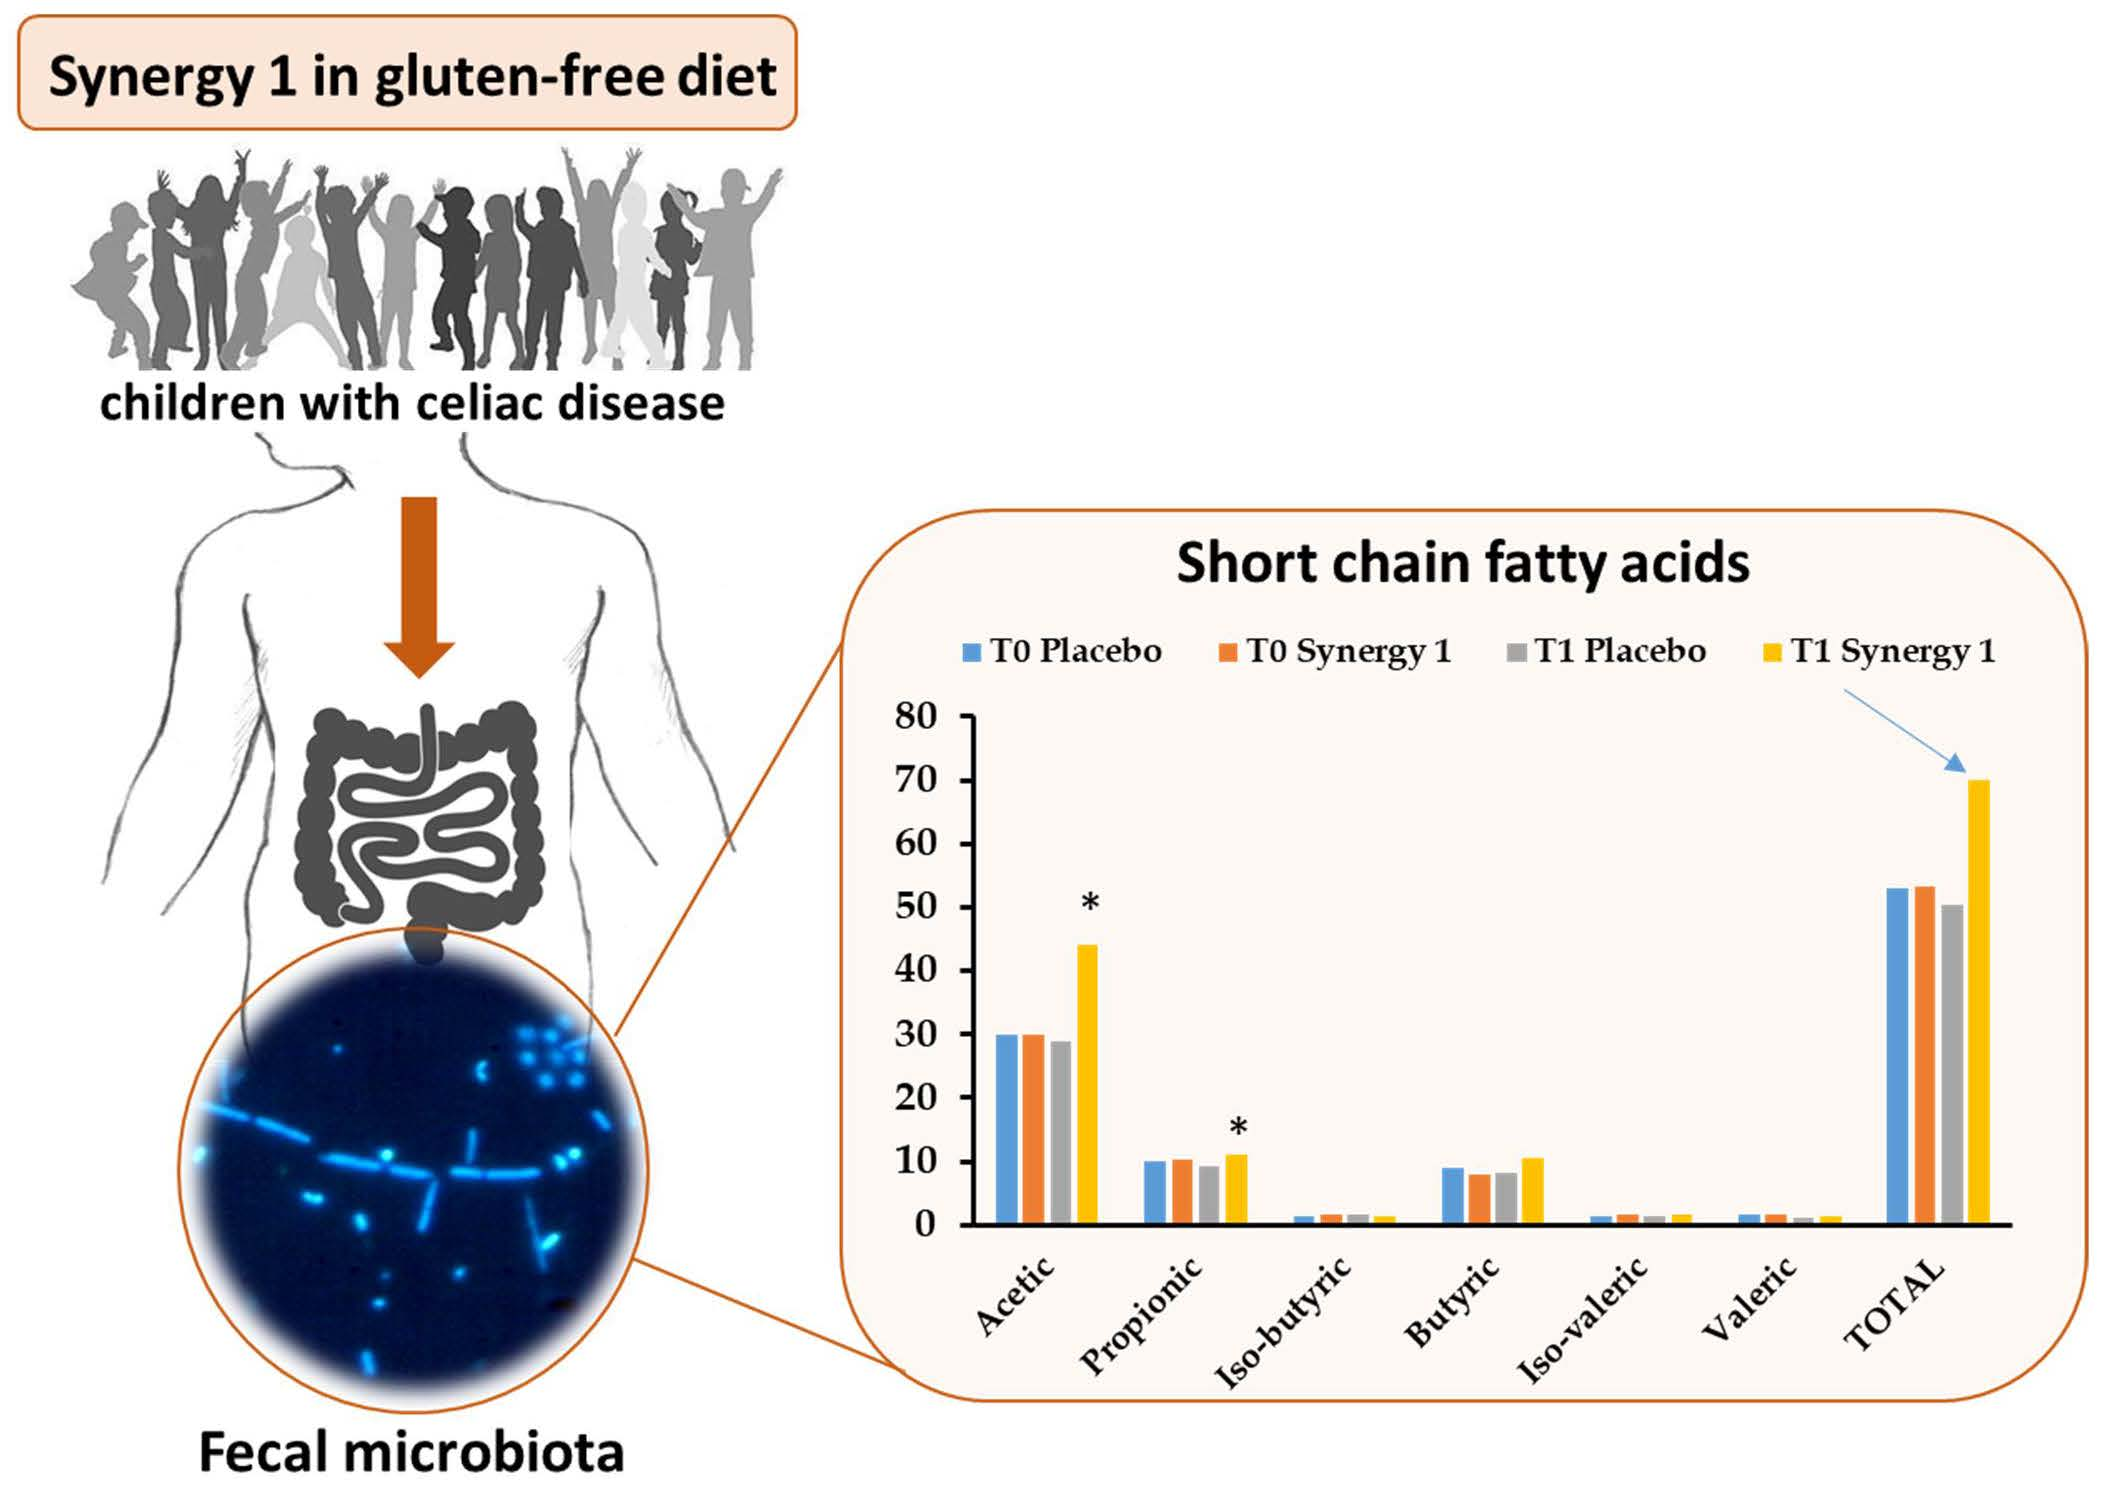
| Acetic | 29.84 ± 1.93 | 28.82 ± 4.26 | 30.00 ± 3.35 | 44.06 1 ± 4.13 | 0.520 | 0.047 * | 0.020 * |
| Propionic | 9.91 ± 1.23 | 7.97 ± 1.55 | 10.16 ± 1.25 | 11.14 ± 0.61 | 0.692 | 0.328 | 0.048 * |
| Iso-butyric | 1.41 ± 0.15 | 1.56 ± 0.33 | 1.60 ± 0.14 | 1.33 ± 0.13 | 0.678 | 0.059 | 1.000 |
| Butyric | 8.92 ± 1.37 | 8.21 ± 1.89 | 8.02 ± 1.27 | 10.41 ± 0.89 | 0.889 | 0.047 * | 0.292 |
| Iso-valeric | 1.43 ± 0.18 | 1.46 ± 0.23 | 1.72 ± 0.19 | 1.56 ± 0.16 | 0.515 | 0.400 | 0.419 |
| Valeric | 1.55 ± 0.21 | 0.97 ± 0.16 | 1.72 ± 0.18 | 1.47 ± 0.18 | 0.030 * | 0.123 | 0.062 |
| Total SCFAs | 53.06 ± 5.52 | 48.99 ± 5.22 | 53.23 ± 6.94 | 69.95 ± 5.92 | 0.418 | 0.041 * | 0.005 * |
| Total BCFAs | 2.84 ± 0.30 | 3.02 ± 0.40 | 3.32 ± 0.33 | 2.89 ± 0.28 | 0.765 | 0.132 | 0.679 |
| Relative BCFAs 1 | 5.35 | 6.16 | 6.24 | 4.13 | |||
© 2018 by the authors. Licensee MDPI, Basel, Switzerland. This article is an open access article distributed under the terms and conditions of the Creative Commons Attribution (CC BY) license (http://creativecommons.org/licenses/by/4.0/).
Share and Cite
Drabińska, N.; Jarocka-Cyrta, E.; Markiewicz, L.H.; Krupa-Kozak, U. The Effect of Oligofructose-Enriched Inulin on Faecal Bacterial Counts and Microbiota-Associated Characteristics in Celiac Disease Children Following a Gluten-Free Diet: Results of a Randomized, Placebo-Controlled Trial. Nutrients 2018, 10, 201. https://doi.org/10.3390/nu10020201
Drabińska N, Jarocka-Cyrta E, Markiewicz LH, Krupa-Kozak U. The Effect of Oligofructose-Enriched Inulin on Faecal Bacterial Counts and Microbiota-Associated Characteristics in Celiac Disease Children Following a Gluten-Free Diet: Results of a Randomized, Placebo-Controlled Trial. Nutrients. 2018; 10(2):201. https://doi.org/10.3390/nu10020201
Chicago/Turabian StyleDrabińska, Natalia, Elżbieta Jarocka-Cyrta, Lidia Hanna Markiewicz, and Urszula Krupa-Kozak. 2018. "The Effect of Oligofructose-Enriched Inulin on Faecal Bacterial Counts and Microbiota-Associated Characteristics in Celiac Disease Children Following a Gluten-Free Diet: Results of a Randomized, Placebo-Controlled Trial" Nutrients 10, no. 2: 201. https://doi.org/10.3390/nu10020201