Insufficient Fruit and Vegetable Intake in a Low- and Middle-Income Setting: A Population-Based Survey in Semi-Urban Tanzania

Abstract
:1. Introduction
2. Materials and Methods
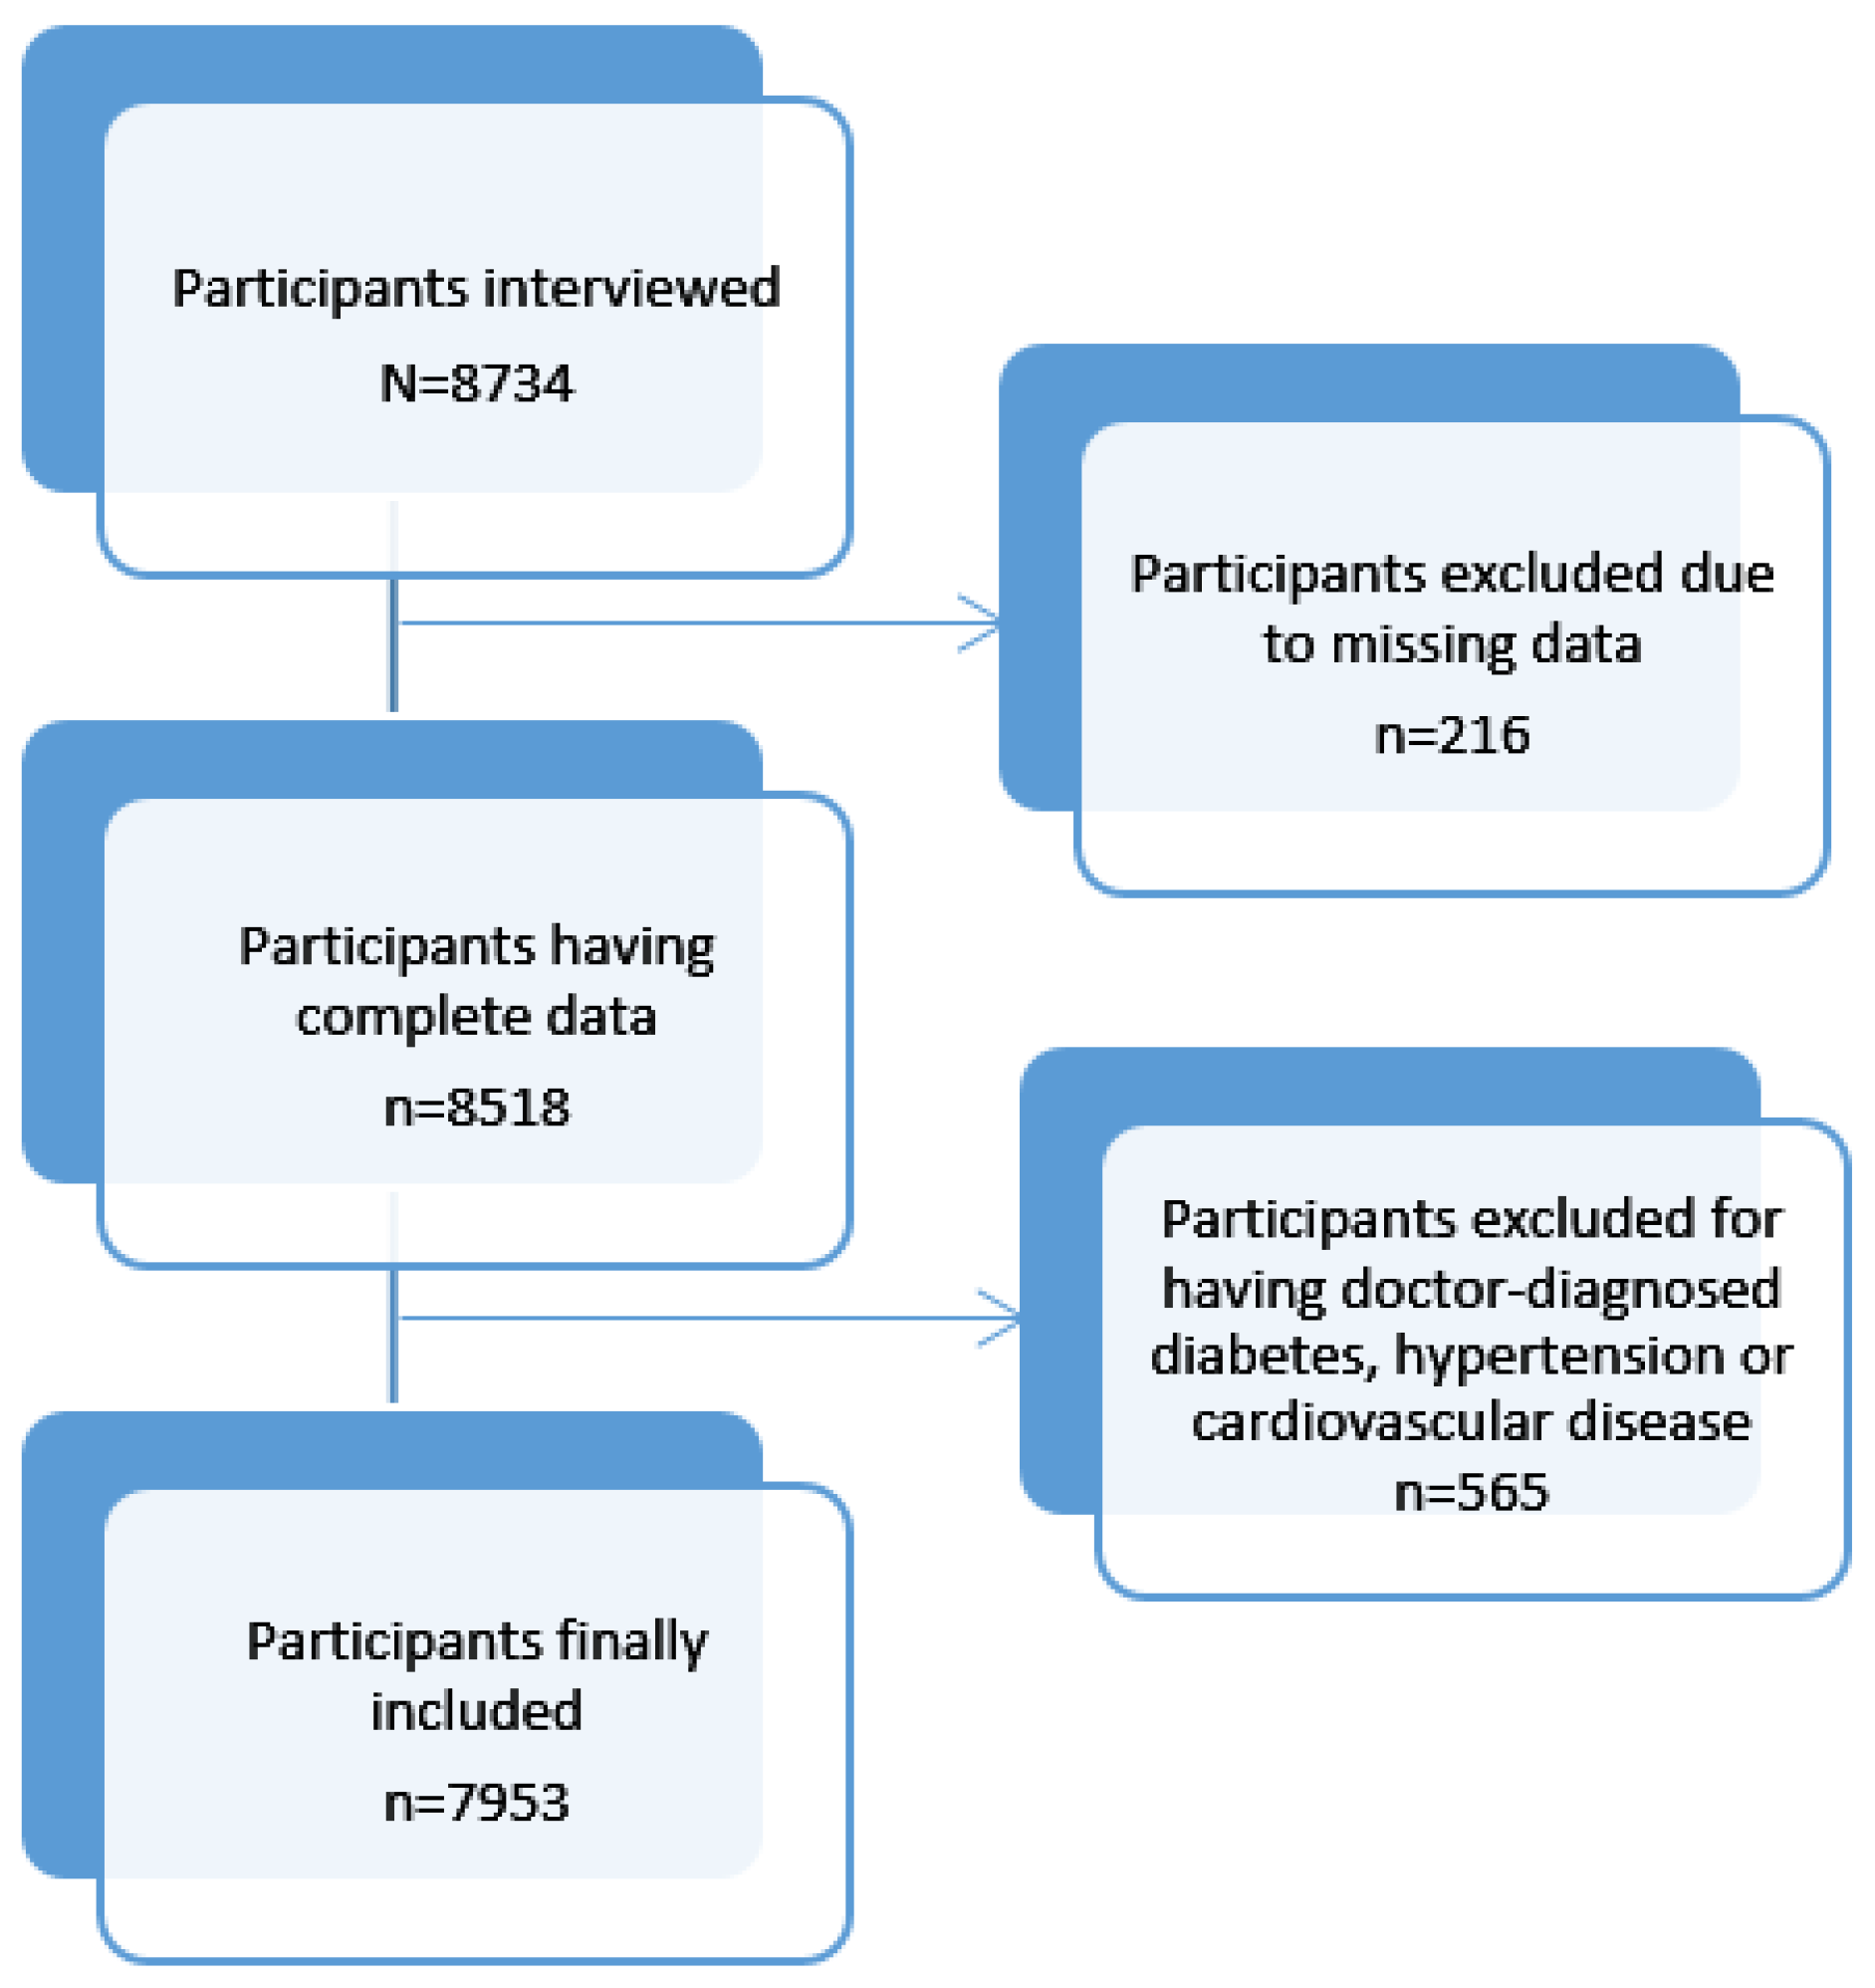
2.1. Study Design and Participants
2.2. Data Collection
2.3. Covariate Information
2.4. Statistical Analyses
2.5. Ethics Consideration
3. Results
3.1. Population Description
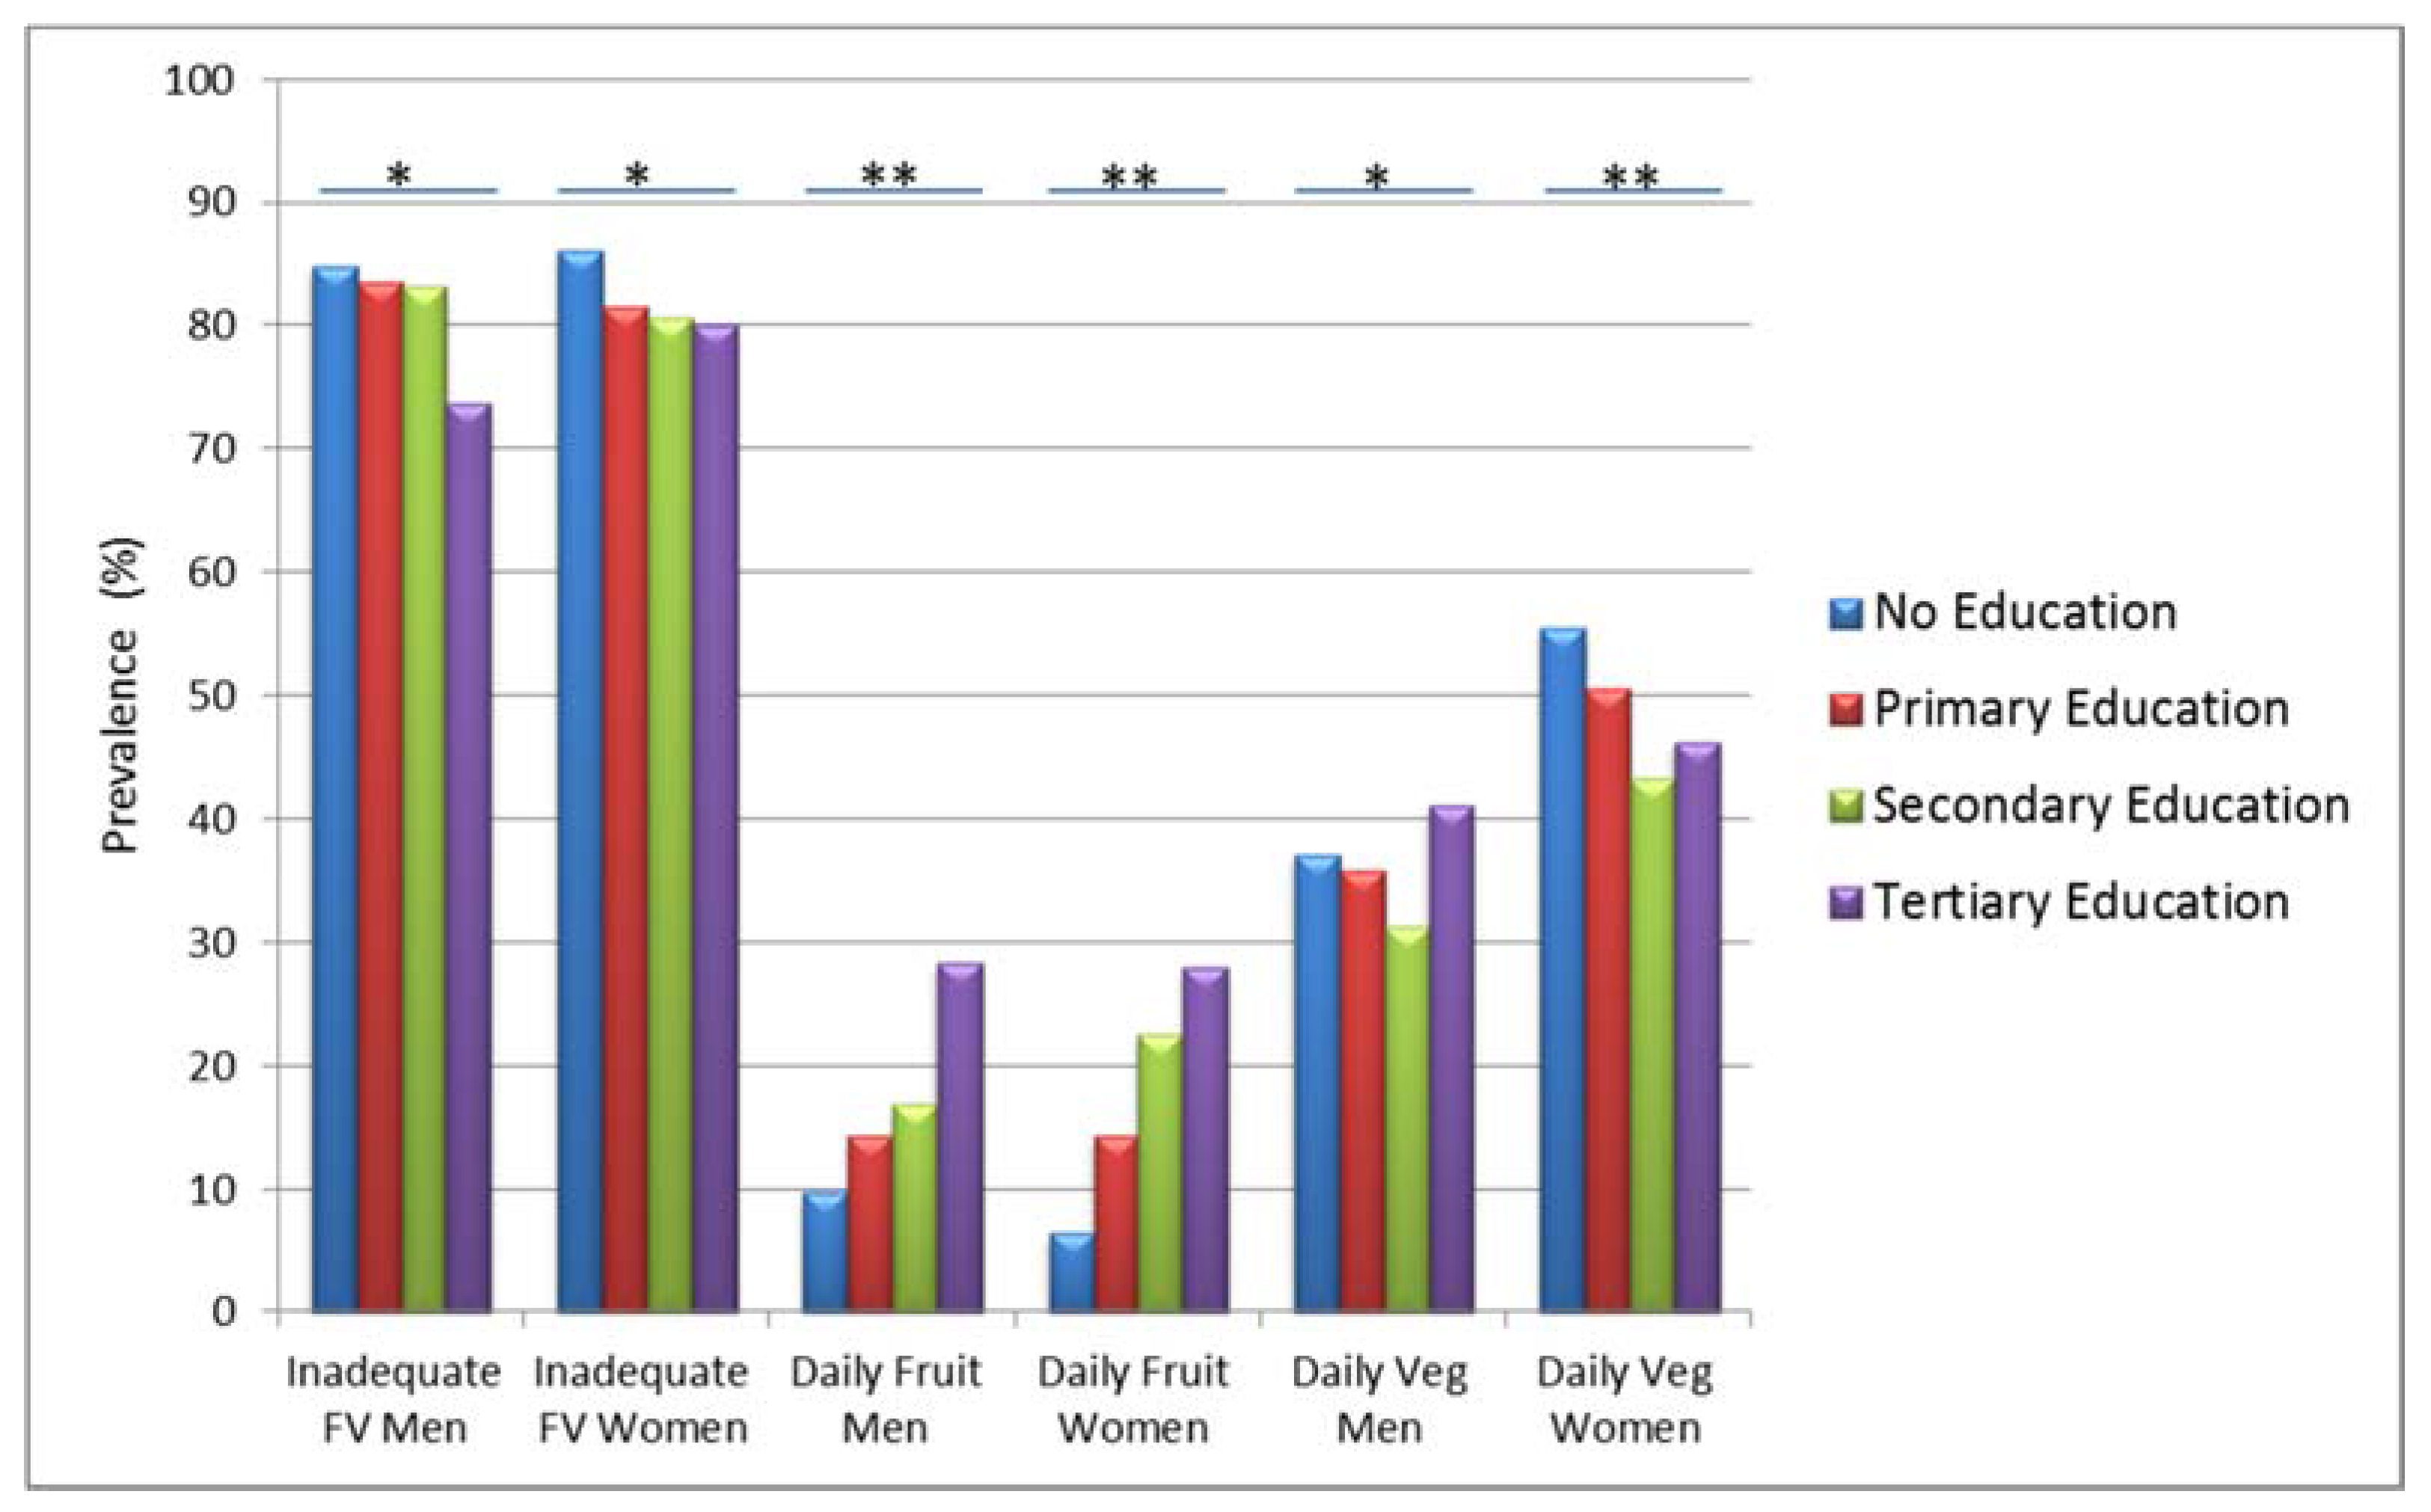
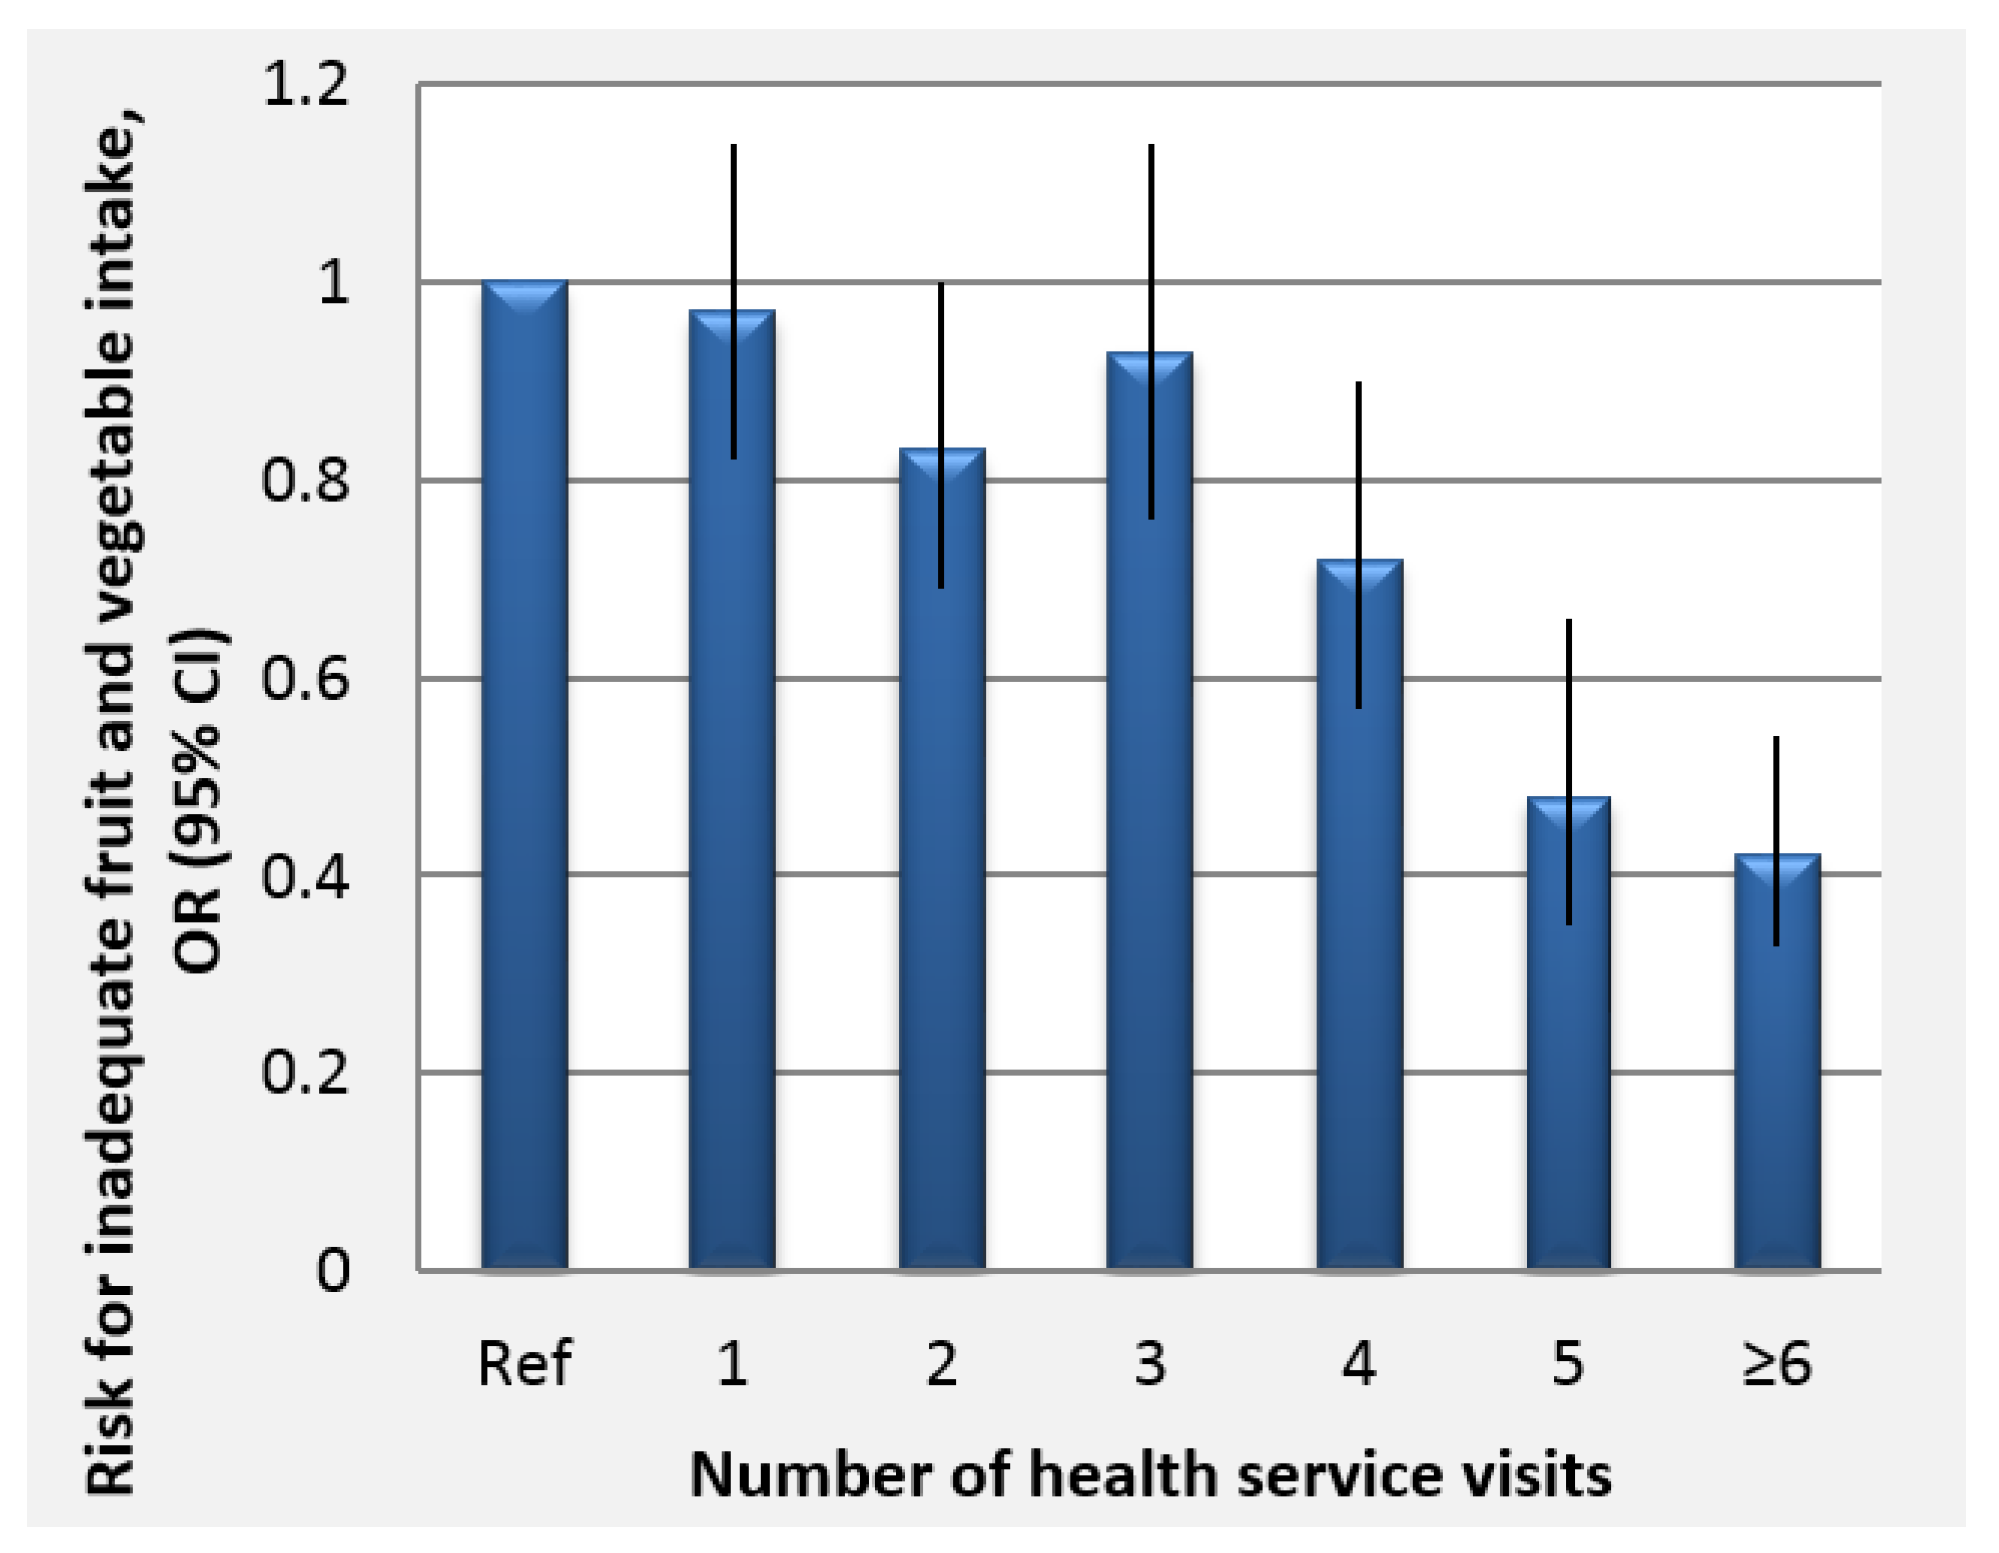
3.2. Patterns of FV Consumption
3.3. Independent Association of FV Intake with Socio-demographic Characteristics
4. Discussion
Strengths and Limitations
5. Conclusions
Acknowledgments
Author Contributions
Conflicts of Interest
References
- Nishida, C.; Uauy, R.; Kumanyika, S.; Shetty, P. The Joint WHO/FAO Expert Consultation on diet, nutrition and the prevention of chronic diseases: Process, product and policy implications. Public Health Nutr. 2007, 7, 245–250. [Google Scholar] [CrossRef]
- Boeing, H.; Bechthold, A.; Bub, A.; Ellinger, S.; Haller, D.; Kroke, A.; Leschik-Bonnet, E.; Muller, M.J.; Oberritter, H.; Schulze, M.; et al. Critical review: Vegetables and fruit in the prevention of chronic diseases. Eur. J. Nutr. 2012, 51, 637–663. [Google Scholar] [CrossRef] [PubMed]
- Slavin, J.L.; Lloyd, B. Health benefits of fruits and vegetables. Adv. Nutr. 2012, 3, 506–516. [Google Scholar] [CrossRef] [PubMed]
- Liu, R.H. Health-promoting components of fruits and vegetables in the diet. Adv. Nutr. 2013, 4, 384S–392S. [Google Scholar] [CrossRef] [PubMed]
- Esfahani, A.; Wong, J.M.W.; Truan, J.; Villa, C.R.; Mirrahimi, A.; Srichaikul, K.; Kendall, C.W.C. Health Effects of Mixed Fruit and Vegetable Concentrates: A Systematic Review of the Clinical Interventions. J. Am. Coll. Nutr. 2011, 30, 285–294. [Google Scholar] [CrossRef] [PubMed]
- Halliwell, B. Oxidative stress and cancer: Have we moved forward? Biochem. J. 2007, 401, 1–11. [Google Scholar] [CrossRef] [PubMed]
- Homocysteine Lowering Trialists’ Collaboration. Dose-dependent effects of folic acid on blood concentrations ofhomocysteine: A meta-analysis of the randomized trials. Am. J. Clin. Nutr. 2005, 82, 806–812. [Google Scholar]
- Malinow, M.R.; Bostom, A.G.; Krauss, R.M. Homocyst(e)ine, Diet, and Cardiovascular Diseases: A statement for healthcare professionals from the Nutrition Committee, American Heart Association. Circulation 1999, 99, 178–182. [Google Scholar] [CrossRef] [PubMed]
- Filippini, T.; Violi, F.; D’Amico, R.; Vinceti, M. The effect of potassium supplementation on blood pressure in hypertensive subjects: A systematic review and meta-analysis. Int. J. Cardiol. 2017, 230, 127–135. [Google Scholar] [CrossRef] [PubMed]
- Blanch, N.; Clifton, P.M.; Keogh, J.B. A systematic review of vascular and endothelial function: Effects of fruit, vegetable and potassium intake. Nutr. Metab. Cardiovasc. Dis. 2015, 25, 253–266. [Google Scholar] [CrossRef] [PubMed]
- Wang, X.; Ouyang, Y.; Liu, J.; Zhu, M.; Zhao, G.; Bao, W.; Hu, F.B. Fruit and vegetable consumption and mortality from all causes, cardiovascular disease, and cancer: Systematic review and dose-response meta-analysis of prospective cohort studies. Br. Med. J. 2014, 349, g4490. [Google Scholar] [CrossRef] [PubMed] [Green Version]
- He, F.J.; Nowson, C.A.; Lucas, M.; MacGregor, G.A. Increased consumption of fruit and vegetables is related to a reduced risk of coronary heart disease: Meta-analysis of cohort studies. J. Hum. Hypertens. 2007, 21, 717–728. [Google Scholar] [CrossRef] [PubMed]
- Hall, J.N.; Moore, S.; Harper, S.B.; Lynch, J.W. Global variability in fruit and vegetable consumption. Am. J. Prev. Med. 2009, 36, 402–409. [Google Scholar] [CrossRef] [PubMed]
- World Health Organization (WHO). Global Health Risks: Mortality and Burden of Disease Attributable to Selected Major Risks; WHO: Geneva, Switzerland, 2009; pp. 1–70. [Google Scholar]
- Mayige, M.; Kagaruki, G. Tanzania STEPS Survey Report; National Institute for Medical Research: Dar Es Salaam, Tanzania, 2013; pp. 1–154. [Google Scholar]
- Ngwira, B.; Kandoole, N.; Mvula, C.; Muwalo, B.; Msyamboza, K.; Chitimbe, G.; Chikhata, M.; Kubwalo, H.; Mwase, Y.; Saukila, K.; et al. Malawi National STEPS Survey for Chronic Non Communicable Diseases and Their Risk Factors; Ministry of Health: Malawi, Africa, 2010; pp. 1–131.
- Ministry of Health (MoH); World Health Organization (WHO). Prevalence Rates of the Common Non-Communicable Diseases and Their Risk Factors in Lusaka District Zambia 2008; Ministry of Health and WHO: Lusaka, Zambia, 2008; pp. 1–72.
- Padrao, P.; Laszczynska, O.; Silva-Matos, C.; Damasceno, A.; Lunet, N. Low fruit and vegetable consumption in Mozambique: Results from a WHO STEPwise approach to chronic disease risk factor surveillance. Br. J. Nutr. 2012, 107, 428–435. [Google Scholar] [CrossRef] [PubMed]
- Ministry of Health (MoH). Republic of Botswana Chronic Disease Risk Factors Surveillance Report 2007; Ministry of Health: Gaborone, Botswana, 2007; pp. 1–142.
- Peltzer, K.; Phaswana-Mafuya, N. Fruit and vegetable intake and associated factors in older adults in South Africa. Glob. Health Action 2012, 5, 1–8. [Google Scholar] [CrossRef] [PubMed]
- Ruel, M.; Minot, N.; Smith, L. Patterns and Determinants of Fruit and Vegetable Consumption in Sub-Saharan Africa; World Health Organization: Geneva, Switzerland, 2005; pp. 1–45. [Google Scholar]
- Keller, A. Association between Fruit and Vegetables Eating Habits and Practices in Relation to the Prevalence of Diet Related Chronic Non Communicable Diseases in Zanzibar Tanzania; University of Copenhagen: Copenhagen, Denmark, 2012. [Google Scholar]
- Glasson, C.; Chapman, K.; James, E. Fruit and vegetables should be targeted separately in health promotion programmes: Differences in consumption levels, barriers, knowledge and stages of readiness for change. Public Health Nutr. 2011, 14, 694–701. [Google Scholar] [CrossRef] [PubMed]
- Guillaumie, L.; Godin, G.; Vezina-Im, L.A. Psychosocial determinants of fruit and vegetable intake in adult population: A systematic review. Int. J. Behav. Nutr. Phys. Act. 2010, 7, 12. [Google Scholar] [CrossRef] [PubMed]
- Love, P.; Maunder, E.; Green, M.; Ross, F.; Smale-Lovely, J. South African Food-Based Dietary Guidelines: Testing of the Preliminary Guidelines among Women in Kwa Zulu Natal and Western Cape. South Afr. J. Clin. Nutr. 2001, 14, 9–19. [Google Scholar]
- Naude, C. “Eat plenty of vegetables and fruit every day”: A food-based dietary guideline for South Africa. South Afr. J. Clin. Nutr. 2013, 26, S46–S56. [Google Scholar]
- Ministry of Health (MoH—Kenya). National Guidelines for Healthy Diets and Physical Activity; Ministry of Health: Nairobi, Kenya, 2017.
- Ministry of Health (MoH—Malawi). National Nutrition Guidelines for Malawi; Ministry of Health: Lilongwe, Malawi, 2007; pp. 1–49.
- Ministry of Health (MoH—Nigeria). Food-Based Dietary Guidelines for Nigeria—A Guide to Healthy Eating; Federal Ministry of Health: Abuja, Nigeria, 2006; pp. 1–36.
- Bandura, A. Social Cognitive Theory of Self Regulation. Organ. Behav. Hum. Decis. Process. 1991, 50, 248–287. [Google Scholar] [CrossRef]
- Erinosho, T.O.; Moser, R.P.; Oh, A.Y.; Nebeling, L.C.; Yaroch, A.L. Awareness of the Fruits and Veggies-More Matters campaign, knowledge of the fruit and vegetable recommendation, and fruit and vegetable intake of adults in the 2007 Food Attitudes and Behaviors (FAB) Survey. Appetite 2012, 59, 155–160. [Google Scholar] [CrossRef] [PubMed]
- Metta, E.; Msambichaka, B.; Mwangome, M.; Nyato, D.J.; Dieleman, M.; Haisma, H.; Klatser, P.; Geubbels, E. Public policy, health system, and community actions against illness as platforms for response to NCDs in Tanzania: A narrative review. Glob. Health Action 2014, 7, 23439. [Google Scholar] [CrossRef] [PubMed]
- Kamphuis, C.B.; Giskes, K.; de Bruijn, G.J.; Wendel-Vos, W.; Brug, J.; van Lenthe, F.J. Environmental determinants of fruit and vegetable consumption among adults: A systematic review. Br. J. Nutr. 2006, 96, 620–635. [Google Scholar] [PubMed]
- Peltzer, K.; Pengpid, S. Fruits and vegetables consumption and associated factors among in-school adolescents in seven African countries. Int. J. Public Health 2010, 55, 669–678. [Google Scholar] [CrossRef] [PubMed]
- Hosseinpoor, A.; Bergen, N.; Kunst, A.; Harper, S.; Guthold, R.; Rekve, D.; d’Espaignet, E.; Naidoo, N.; Chatterji, S. Socioeconomic inequalities in risk factors for noncommunicable diseases in low-income andmiddle-income countries: Results from the WorldHealth Survey. BMC Public Health 2012, 12, 912. [Google Scholar]
- Mikkonen, J.; Raphael, D. Social Determinants of Health: The Canadian Facts; York University School of Health Policy and Management: Toronto, ON, Canada, 2010. [Google Scholar]
- Wolf, R.L.; Lepore, S.J.; Vandergrift, J.L.; Wetmore-Arkader, L.; McGinty, E.; Pietrzak, G.; Yaroch, A.L. Knowledge, barriers, and stage of change as correlates of fruit and vegetable consumption among urban and mostly immigrant black men. J. Am. Diet. Assoc. 2008, 108, 1315–1322. [Google Scholar] [CrossRef] [PubMed]
- Peltzer, K.; Promtussananon, S. Knowledge, barriers, and benefits of fruit and vegetable consumption and lay conceptions of nutrition among rural and semi-urban Black South Africans. Psychol. Rep. 2004, 94, 976–982. [Google Scholar] [CrossRef] [PubMed]
- Shaikh, A.R.; Yaroch, A.L.; Nebeling, L.; Yeh, M.C.; Resnicow, K. Psychosocial predictors of fruit and vegetable consumption in adults a review of the literature. Am. J. Prev. Med. 2008, 34, 535–543. [Google Scholar] [CrossRef] [PubMed]
- Salehi, L.; Eftekhar, H.; Mohammad, K.; Tavafian, S.S.; Jazayery, A.; Montazeri, A. Consumption of fruit and vegetables among elderly people: A cross sectional study from Iran. Nutr. J. 2010, 9, 2. [Google Scholar] [CrossRef] [PubMed]
- Giles, E.L.; Brennan, M. Trading between healthy food, alcohol and physical activity behaviours. BMC Public Health 2014, 14, 1231. [Google Scholar] [CrossRef] [PubMed] [Green Version]
- Lahti-Koski, M.; Pietinen, P.; Heliovaara, M.; Vartiainen, E. Associations of body mass index and obesity with physical activity, food choices, alcohol intake, and smoking in the 1982–1997 FINRISK Studies. Am. J. Clin. Nutr. 2002, 75, 809–817. [Google Scholar] [CrossRef] [PubMed]
- Johnson, M.F.; Nichols, J.F.; Sallis, J.F.; Calfas, K.J.; Hovell, M.F. Interrelationships between physical activity and other health behaviors among university women and men. Prev. Med. 1998, 27, 536–544. [Google Scholar] [CrossRef] [PubMed]
- Lee, I.C.; Chang, C.S.; Du, P.L. Do healthier lifestyles lead to less utilization of healthcare resources? BMC Health Serv. Res. 2017, 17, 243. [Google Scholar] [CrossRef] [PubMed]
- Geubbels, E.; Amri, S.; Levira, F.; Schellenberg, J.; Masanja, H.; Nathan, R. Health & Demographic Surveillance System Profile: The Ifakara Rural and Urban Health and Demographic Surveillance System (Ifakara HDSS). Int. J. Epidemiol. 2015, 44, 848–861. [Google Scholar] [PubMed]
- Abdul, R.; Ramaiya, A.; Mtenga, S.; Mtowa, A.; Geubbels, E. MZIMA Longitudinal Cohort Study Progress Report: Serosurvey Round 1 June 2012–May 2013; IHI: Dar Es Salaam, Tanzania, 2014; pp. 1–38. [Google Scholar]
- Boriello, G.; Schilit, B.; Lerer, A.; Chin, J. Open Data Kit. Retrieved 2017, from Open Data Kit Downloads. Available online: https://opendatakit.org (accessed on 11 August 2017).
- World Health Organization (WHO). The WHO STEPS Surveillance Manual; WHO: Geneva, Switzerland, 2005. [Google Scholar]
- LSHTM Alpha Network: Analysing Longitudinal Population-Based HIV/AIDS Data in Africa. Available online: http://www.alpha.lshtm.ac.uk (accessed on 11 August 2017).
- Smith, F.; Eyzaguirre, P. African Leafy Vegetables: Their Role in the World Health Organization’s Global Fruit and Vegetables Initiative. Afr. J. Food Agric. Nutr. Dev. 2007, 7, 1–17. [Google Scholar]
- Girard, A.W.; Self, J.L.; McAuliffe, C.; Olude, O. The effects of household food production strategies on the health and nutrition outcomes of women and young children: A systematic review. Paediatr. Perinat. Epidemiol. 2012, 26, 205–222. [Google Scholar] [CrossRef] [PubMed]
- Beardsworth, A.; Bryman, A.; Keil, T.; Goode, J.; Haslam, C.; Lancashire, E. Women, men and food: The significance of gender for nutritional attitudes and choices. Br. Food J. 2002, 104, 470–491. [Google Scholar] [CrossRef]
- Quisumbing, A.; Brown, L.; Feldstein, H.; Haddad, L.; Pena, C.M. Women: The Key to Food Security; The International Food Policy Research institute: Washington, DC, USA, 1995; pp. 1–26. [Google Scholar]
- Krige, S.M.; Mahomoodally, F.M.; Subratty, A.H.; Ramasawmy, D. Relationship between Socio-Demographic Factors and Eating Practices in a Multicultural Society. Food Nutr. Sci. 2012, 3, 286–295. [Google Scholar] [CrossRef]
- Owouor, O.; Olaimer-Anyara, E. The value of leafy vegetables: An exploration of African Folkore. Afr. J. Food Agric. Nutr. Dev. 2007, 7, 1–13. [Google Scholar]
- Miller, V.; Yusuf, S.; Chow, C.K.; Dehghan, M.; Corsi, D.J.; Lock, K.; Popkin, B.; Rangarajan, S.; Khatib, R.; Lear, S.A.; et al. Availability, affordability, and consumption of fruits and vegetables in 18 countries across income levels: Findings from the Prospective Urban Rural Epidemiology (PURE) study. Lancet Glob. Health 2016, 4, e695–e703. [Google Scholar] [CrossRef]
- Mayen, A.L.; Marques-Vidal, P.; Paccaud, F.; Bovet, P.; Stringhini, S. Socioeconomic determinants of dietary patterns in low- and middle-income countries: A systematic review. Am. J. Clin. Nutr. 2014, 100, 1520–1531. [Google Scholar] [CrossRef] [PubMed]
- Van Bakel, M.M.; Slimani, N.; Feskens, E.J.; Du, H.; Beulens, J.W.; van der Schouw, Y.T.; Brighenti, F.; Halkjaer, J.; Cust, A.E.; Ferrari, P.; et al. Methodological challenges in the application of the glycemic index in epidemiological studies using data from the European Prospective Investigation into Cancer and Nutrition. J. Nutr. 2009, 139, 568–575. [Google Scholar] [CrossRef] [PubMed]
- USAID-TRADE-HUB. The Fresh Fruit and Vegetable Markets of East Africa: An Assessment of Regional Value Chain Actors Activities and Constraints in Kenya, Tanzania, Uganda; USAID: East Africa, 2013; pp. 1–87.
- Keller, A.; de Courten, M.; Dræbel, T.A. Fruit and vegetable consumption and prevalence of diet-related chronic non-communicable diseases in Zanzibar, Tanzania: A mixed methods study. Lancet 2012, 380, S16. [Google Scholar] [CrossRef]
- Msuya, T.S.; Kideghesho, J.R.; Luoga, E. Consumption of Indeginous Fruits in Uluguru North and Ruvu North Forest Reserves, Tanzania. Tanzan. J. For. Nat. Conserv. 2004, 75, 65–73. [Google Scholar]
- Chong, K.H.; Lee, S.T.; Ng, S.A.; Khouw, I.; Poh, B.K. Fruit and Vegetable Intake Patterns and Their Associations with Sociodemographic Characteristics, Anthropometric Status and Nutrient Intake Profiles among Malaysian Children Aged 1-6 Years. Nutrients 2017, 9, 723. [Google Scholar] [CrossRef] [PubMed]
- Rasmussen, M.; Krolner, R.; Klepp, K.I.; Lytle, L.; Brug, J.; Bere, E.; Due, P. Determinants of fruit and vegetable consumption among children and adolescents: A review of the literature. Part I: Quantitative studies. Int. J. Behav. Nutr. Phys. Act. 2006, 3, 22. [Google Scholar] [CrossRef] [PubMed] [Green Version]
- Lorson, B.A.; Melgar-Quinonez, H.R.; Taylor, C.A. Correlates of fruit and vegetable intakes in US children. J. Am. Diet. Assoc. 2009, 109, 474–478. [Google Scholar] [CrossRef] [PubMed]


| Variables | Groups | All % (N) | Males % (N) | Females % (N) | Chi- Squared Test |
|---|---|---|---|---|---|
| All participants | 100 (7953) | 35.7(2839) | 64.3 (5114) | N/A | |
| Age | Below 25 years | 39.1 (3111) | 36.2 (1027) | 40.8 (2084) | <0.001 |
| 25–50 years | 45.1 (3588) | 45.1 (1292) | 44.9 (2296) | ||
| 50–60 years | 6.7 (535) | 7.3 (206) | 6.4 (329) | ||
| 60 and above | 9.0 (719) | 11.1 (314) | 7.9 (405) | ||
| Education | No Formal Education | 14.1 (1118) | 9.1 (258) | 16.8 (860) | <0.001 |
| Primary Education | 55.2 (4387) | 53.0 (1505) | 56.4 (2882) | ||
| Secondary Education | 27.5 (2186) | 32.9 (935) | 24.5 (1251) | ||
| Tertiary Education | 3.3 (262) | 5.0 (141) | 2.4 (121) | ||
| Marriage | Never married | 38.8 (3088) | 46.6 (1324) | 34.5 (1764) | <0.001 |
| Monogamous | 47.4 (3770) | 44.7 (1268) | 48.9 (2502) | ||
| Polygamous | 1.2 (94) | 1.1 (30) | 1.3 (64) | ||
| Widowed | 5.8 (461) | 2.4 (68) | 7.7 (393) | ||
| Separated | 6.8 (540) | 5.3 (149) | 7.7 (391) | ||
| Work status | Working | 59.8 (4754) | 72.1 (2047) | 52.9 (2707) | <0.001 |
| Not working | 40.2 (3199) | 27.9 (792) | 47.1 (2407) | ||
| Occupation | Farming, Fishing, Livestock keeping | 25.4 (2017) | 26.9 (763) | 24.5 (1254) | <0.001 |
| Small business | 15.4 (1221) | 14.8 (421) | 15.6 (800) | ||
| Large business | 1.2 (95) | 2.3 (66) | 0.6 (29) | ||
| Professionals | 4.7 (367) | 6.5 (183) | 3.6 (184) | ||
| Skilled manual labor | 7.9 (625) | 12.4 (352) | 5.3 (273) | ||
| Unskilled manual labor | 5.4 (429) | 9.2 (262) | 3.3 (167) | ||
| Not working | 40.2 (3199) | 27.9 (792) | 47.1 (2407) | ||
| Religion | Muslim | 37.1 (2952) | 38.2 (1085) | 36.5 (1867) | 0.258 |
| Catholic | 54.3 (4317) | 53.6 (1521) | 54.7 (2796) | ||
| Lutheran | 1.9 (147) | 1.6 (44) | 2.0 (103) | ||
| Other beliefs | 6.8 (537) | 6.7 (189) | 6.8 (348) | ||
| Migration | Non-migrant | 41.5 (3301) | 40.4 (1146) | 42.1 (2155) | 0.124 |
| Migrant | 58.5 (4652) | 59.6 (1693) | 57.9 (2959) | ||
| Ethnicity | Mbeya region | 1.6 (127) | 1.4 (41) | 1.7 (86) | <0.001 |
| Kilimanjaro and Arusha region | 3.3 (265) | 4.1 (115) | 2.9 (150) | ||
| Coast region | 6.2 (491) | 6.2 (177) | 6.1 (314) | ||
| Shinyanga/Mwanza/Tabora regions | 6.9 (545) | 8.2 (234) | 6.1 (311) | ||
| Iringa region | 11.4 (904) | 10.6 (302) | 11.8 (602) | ||
| Ruvuma region | 14.8 (1179) | 14.2 (403) | 15.2 (776) | ||
| Other regions | 12.8 (1020) | 14.7 (418) | 11.8 (602) | ||
| Morogoro region | 43.0 (3422) | 40.5 (1147) | 44.5 (2273) | ||
| Alcohol | Not daily | 97.6 (7764) | 96.7 (2746) | 98.1 (5018) | <0.001 |
| Daily | 2.4 (189) | 3.3 (93) | 1.9 (96) | ||
| Smoking | Never smoker | 89.7 (7131) | 76.4 (2169) | 97.0 (4962) | <0.001 |
| Former smoker | 3.1 (245) | 6.5 (183) | 1.2 (62) | ||
| Current smoker | 7.3 (577) | 17.2 (487) | 1.8 (90) | ||
| Healthcare use | No visit | 40.0 (3180) | 45.5 (1291) | 36.9 (1889) | <0.001 |
| One visit | 20.7 (1643) | 21.3 (604) | 20.3 (1039) | ||
| Two visits | 12.6 (1004) | 11.6 (328) | 13.2 (676) | ||
| Three visits | 11.8 (935) | 10.7 (305) | 12.3 (630) | ||
| Four visits | 7.4 (590) | 5.5 (157) | 8.5 (433) | ||
| Five visits | 2.7 (214) | 2.3 (64) | 2.9 (150) | ||
| Six visits and more | 4.9 (387) | 3.2 (90) | 5.8 (297) |
| Variable | Groups | Daily Fruit Intake a % (N) | No Daily Fruit Intake b % (N) | No Fruit Intake c % (N) | Daily Fruit Portions (Median (IQR)) | Daily Vegetable Intake a % (N) | No Daily Vegetable Intake b % (N) | No Vegetable Intake c % (N) | Daily Vegetable Portions (Median (IQR)) | Inadequate FV Intake d (%) | Chi Squared Test |
|---|---|---|---|---|---|---|---|---|---|---|---|
| All | N/A | 15.4 (1227) | 72.1 (5734) | 12.5 (992) | 2 (2) | 44.2 (3516) | 54.3 (4318) | 1.5 (119) | 2 (1) | 82 | N/A |
| Sex | Male | 15.6 (440) | 72.7 (2064) | 11.8 (335) | 2 (2) | 34.7 (985) | 62.8 (1782) | 2.5 (72) | 1 (1) | 83 | 0.269 |
| Female | 15.4 (787) | 71.8 (3670) | 12.9 (657) | 2 (2) | 49.5 (2531) | 49.6 (2536) | 0.9 (47) | 2 (1) | 82 | ||
| Age | Below 25 | 16.1 (502) | 72.5 (2254) | 11.4 (355) | 2 (2) | 36.1 (1124) | 62.1 (1932) | 1.8 (55) | 1 (1) | 84 | <0.001 |
| 25–50 | 15.9 (572) | 72.6 (2603) | 11.5 (413) | 2 (2) | 46.4 (1665) | 52.1 (1872) | 1.4 (51) | 2 (1) | 82 | ||
| 50–60 | 17.8 (95) | 65.6 (351) | 16.6 (89) | 2 (2) | 55.2 (397) | 43.7 (314) | 0.9 (5) | 2 (1) | 76 | ||
| Above 60 | 8.1 (58) | 73.2 (526) | 18.8 (135) | 1 (1) | 55.2 (397) | 43.7 (314) | 1.1 (8) | 2 (1) | 84 | ||
| Education | No Education | 7.3 (81) | 71.1 (795) | 21.7 (242) | 1 (1) | 51.3 (573) | 47.1 (527) | 1.6 (18) | 2 (1) | 86 | 0.002 |
| Primary | 14.4 (631) | 73.7 (3231) | 12.0 (525) | 2 (2) | 45.5 (1996) | 53.3 (2336) | 1.3 (55) | 2 (1) | 82 | ||
| Secondary | 20.2 (441) | 70.3 (1537) | 9.5 (208) | 2 (2) | 38.1 (883) | 60.0 (1312) | 1.9 (41) | 1 (1) | 82 | ||
| Tertiary | 28.2 (74) | 65.3 (171) | 6.5 (17) | 2 (2) | 43.5 (114) | 54.6 (143) | 1.9 (5) | 1 (1) | 77 | ||
| Marital status | Never married | 15.7 (485) | 72.6 (2243) | 11.7 (360) | 2 (2) | 36.2 (1117) | 61.7 (1904) | 2.2 (67) | 1 (1) | 84 | 0.001 |
| Monogamous | 16.3 (627) | 72.1 (2718) | 11.3 (425) | 2 (2) | 47.6 (1796) | 51.4 (1937) | 1.0 (37) | 2 (1) | 81 | ||
| Polygamous | 14.9 (14) | 69.2 (65) | 16.0 (15) | 2 (2) | 55.3 (52) | 43.6 (41) | 1.1 (1) | 2 (1) | 79 | ||
| Widowed | 8.0 (37) | 69.2 (319) | 22.8 (105) | 1 (1) | 59.4 (274) | 39.3 (181) | 1.3 (6) | 2 (1) | 84 | ||
| Divorced | 11.9 (64) | 72.0 (389) | 16.1 (87) | 1 (2) | 51.3 (277) | 47.2 (255) | 1.5 (8) | 2 (1) | 85 | ||
| Work status | Working | 16.4 (780) | 71.8 (3415) | 11.8 (559) | 2 (2) | 47.4 (2252) | 51.3 (2437) | 1.4 (65) | 2 (1) | 80 | <0.001 |
| Not working | 14.0 (447) | 72.5 (2319) | 13.5 (433) | 2 (2) | 39.5 (1264) | 58.8 (1881) | 1.7 (54) | 2 (1) | 85 | ||
| Occupation | Farming, Fishing, Livestock | 12.0 (241) | 75.8 (1528) | 12.3 (248) | 2 (2) | 53.1 (1070) | 46.0 (928) | 0.9 (19) | 2 (1) | 82 | <0.001 |
| Small business | 18.0 (221) | 71.7 (876) | 10.2 (124) | 2 (2) | 45.5 (556) | 53.2 (649) | 1.3 (16) | 2 (1) | 79 | ||
| Large business | 30.5 (29) | 62.1 (59) | 7.4 (7) | 2 (3) | 47.4 (45) | 49.5 (47) | 3.2 (3) | 1 (1) | 71 | ||
| Professionals | 28.6 (105) | 64.0 (235) | 7.4 (27) | 2 (3) | 47.7 (175) | 52.0 (191) | 0.3 (1) | 1 (1) | 73 | ||
| Skilled manual labor | 20.4 (129) | 66.9 (418) | 12.5 (78) | 2 (2) | 40.0 (250) | 58.7 (367) | 1.3 (8) | 2 (1) | 80 | ||
| Unskilled manual labor | 12.8 (55) | 66.7 (299) | 17.5 (7) | 2 (2) | 36.4 (156) | 59.4 (255) | 4.2 (18) | 2 (1) | 87 | ||
| Not working | 14.0 (447) | 72.5 (2319) | 13.5 (433) | 2 (2) | 39.5 (1264) | 58.8 (1881) | 1.7 (54) | 2 (1) | 85 | ||
| Religion | Muslim | 15.6 (459) | 71.8 (2119) | 12.7 (374) | 2 (2) | 44.7 (1319) | 53.6 (1582) | 1.7 (51) | 2 (1) | 82 | 0.934 |
| Catholic | 14.9 (641) | 72.8 (3141) | 12.4 (535) | 2 (2) | 44.5 (1922) | 54.3 (2345) | 1.2 (50) | 1 (1) | 83 | ||
| Lutheran | 24.5 (36) | 60.5 (89) | 15.0 (22) | 2 (2) | 49.0 (72) | 50.3 (74) | 0.7 (1) | 1 (1) | 84 | ||
| Others | 17.0 (91) | 71.7 (385) | 11.4 (61) | 2 (2) | 37.8 (203) | 59.0 (317) | 3.2 (17) | 1 (1) | 83 | ||
| Migration | Non-migrants | 16.0 (527) | 71.4 (2357) | 12.6 (417) | 2 (2) | 44.8 (1478) | 54.2 (1788) | 1.1 (35) | 2 (1) | 82 | 0.151 |
| Migrants | 15.0 (700) | 72.6 (3377) | 12.4 (575) | 2 (2) | 43.8 (2038) | 54.4 (2530) | 1.8 (84) | 2 (1) | 83 | ||
| Ethnicity | Morogoro region | 14.2 (485) | 72.2 (2471) | 13.6 (466) | 2 (2) | 48.6 (1664) | 50.4 (1723) | 1 (35) | 2 (1) | 82 | 0.140 |
| Iringa region | 14.6 (132) | 73.8 (667) | 11.6 (105) | 2 (2) | 41.0 (371) | 58.2 (526) | 0.7 (7) | 1 (1) | 83 | ||
| Shinyanga/Mwanza/Tabora | 13.9 (76) | 76.2 (415) | 9.9 (54) | 2 (2) | 30.8 (168) | 65.5 (357) | 3.7 (20) | 2 (1) | 85 | ||
| Kilimanjaro/Arusha region | 24.2 (64) | 67.6 (179) | 8.3 (22) | 2 (3) | 37.4 (99) | 60.4 (160) | 2.3 (6) | 2 (1) | 78 | ||
| Ruvuma region | 15.4 (181) | 72.2 (851) | 12.5 (147) | 2 (2) | 45.3 (534) | 53.7 (633) | 1 (12) | 1 (1) | 81 | ||
| Coast region | 14.0 (71) | 70.9 (348) | 14.7 (72) | 2 (2) | 45.4 (223) | 52.6 (258) | 2.0 (10) | 2 (1) | 84 | ||
| Mbeya region | 17.3 (22) | 74.8 (95) | 7.9 (10) | 2 (2) | 32.3 (41) | 66.1 (84) | 1.6 (2) | 2 (1) | 87 | ||
| Other regions | 19.2 (196) | 69.4 (708) | 11.4 (116) | 2 (2) | 40.8 (416) | 56.8 (577) | 2.7 (27) | 1 (1) | 83 | ||
| Alcohol use | Not Daily | 15.3 (1187) | 72.3 (5615) | 12.4 (962) | 2 (2) | 43.9 (3409) | 54.6 (4239) | 1.5 (116) | 2 (1) | 83 | <0.001 |
| Daily | 21.2 (40) | 63.0 (119) | 15.9 (30) | 2 (3) | 56.6 (107) | 41.8 (79) | 1.6 (3) | 2 (1) | 72 | ||
| Smoking | Never | 15.7 (1119) | 72.5 (5167) | 11.9 (845) | 2 (2) | 44.4 (3164) | 54.3 (3870) | 1.4 (97) | 1 (1) | 82 | 0.630 |
| Former | 12.2 (30) | 71.8 (176) | 15.9 (39) | 2 (2) | 46.9 (115) | 49.0 (120) | 4.1 (10) | 2 (1) | 81 | ||
| Current | 13.5 (78) | 67.8 (391) | 18.7 (108) | 2 (2) | 41.1 (237) | 56.9 (328) | 2.1 (12) | 2 (1) | 84 | ||
| Healthcare use | No visits | 12.8 (407) | 73.0 (2322) | 14.2 (451) | 2 (2) | 38.0 (1208) | 60.4 (1919) | 1.7 (53) | 2 (1) | 85 | <0.001 |
| One visit | 16 (259) | 72.4 (1190) | 11.8 (194) | 2 (2) | 44.2 (726) | 54.2 (890) | 1.6 (27) | 2 (1) | 84 | ||
| Two visits | 16.4 (165) | 71.1 (714) | 12.5 (125) | 2 (2) | 47.7 (479) | 51.1 (513) | 1.2 (12) | 1 (1) | 82 | ||
| Three visits | 16.7 (156) | 73.2 (684) | 10.2 (95) | 2 (2) | 48.3 (452) | 50.7 (474) | 1.0 (9) | 2 (1) | 83 | ||
| Four visits | 18.0 (106) | 73.2 (432) | 8.8 (52) | 2 (2) | 50.7 (299) | 48.0 (283) | 1.4 (8) | 1 (1) | 79 | ||
| Five visits | 19.2 (41) | 65.4 (140) | 15.4 (33) | 2 (3) | 53.7 (115) | 44.9 (96) | 1.4 (3) | 1 (1) | 72 | ||
| Six visits and more | 24.0 (93) | 65.1 (252) | 10.6 (42) | 2 (3) | 61.2 (237) | 37.0 (143) | 1.8 (7) | 1 (1) | 69 |
| Risk for Less than Daily Fruit Intake | Risk for Less than Daily Vegetable Intake | Risk for Inadequate Fruit and Vegetable Intake | |||||
|---|---|---|---|---|---|---|---|
| OR * | 95% CI | OR ** | 95% CI | OR *** | 95% CI | ||
| Sex | Men | Ref | - | Ref | - | Ref | - |
| Women | 0.84 | 0.73–0.96 | 0.51 | 0.46–0.56 | 0.82 | 0.72–0.93 | |
| Age | <25 years | Ref | - | Ref | - | Ref | - |
| 25–50 | 1.00 | 0.85–1.20 | 0.80 | 0.70–0.91 | 0.94 | 0.79–1.11 | |
| 50–60 | 0.70 | 0.51–0.93 | 0.46 | 0.37–0.57 | 0.60 | 0.46–0.79 | |
| >60 | 1.28 | 0.88–1.76 | 0.54 | 0.43–0.67 | 0.79 | 0.59–1.05 | |
| Marital Status | Never married/cohabiting | Ref | - | Ref | - | Ref | - |
| Monogamously married/cohabiting | 0.84 | 0.71–0.99 | 0.88 | 0.77–0.99 | 0.89 | 0.76–1.05 | |
| Polygamous married/cohabiting | 0.90 | 0.49–1.65 | 0.75 | 0.48–1.15 | 0.84 | 0.50–1.43 | |
| Widowed | 1.33 | 0.88–2.01 | 0.86 | 0.67–1.11 | 1.19 | 0.85–1.66 | |
| Separated/divorced | 1.13 | 0.83–1.54 | 0.88 | 0.72–1.09 | 1.21 | 0.91–1.59 | |
| Education Level | No education | Ref | - | Ref | - | Ref | - |
| Primary | 0.55 | 0.43–0.70 | 1.01 | 0.87–1.17 | 0.78 | 0.64–0.95 | |
| Secondary | 0.35 | 0.27–0.46 | 1.00 | 0.85–1.19 | 0.67 | 0.53–0.84 | |
| Tertiary | 0.27 | 0.19–0.40 | 0.94 | 0.70–1.27 | 0.61 | 0.43–0.88 | |
| Occupation | Farming/Livestock/Fishing | Ref | - | Ref | - | Ref | - |
| Small business | 0.69 | 0.56–0.84 | 1.16 | 1.00–1.34 | 0.84 | 0.69–1.00 | |
| Large business | 0.39 | 0.25–0.63 | 0.75 | 0.49–1.15 | 0.50 | 0.32–0.83 | |
| Professionals | 0.51 | 0.39–0.68 | 1.00 | 0.79–1.28 | 0.66 | 0.50–0.86 | |
| Skilled manual workers & drivers | 0.61 | 0.48–0.78 | 1.25 | 1.03–1.51 | 0.87 | 0.68–1.09 | |
| Unskilled laborers & bar workers | 0.90 | 0.65–1.25 | 1.28 | 1.02–1.60 | 1.26 | 0.92–1.72 | |
| Not working | 0.99 | 0.81–1.20 | 1.46 | 1.27–1.66 | 1.28 | 1.07–1.52 | |
| Ethnicity | Morogoro | Ref | - | Ref | - | Ref | - |
| Iringa | 1.03 | 0.83–1.28 | 1.31 | 1.12–1.52 | 1.08 | 0.88–1.32 | |
| Shinyanga/Mwanza/Tabora | 1.06 | 0.80–1.41 | 1.78 | 1.45–2.21 | 1.14 | 0.87–1.49 | |
| Kilimanjaro | 0.66 | 0.48–0.91 | 1.39 | 1.06–1.82 | 0.83 | 0.60–1.14 | |
| Ruvuma | 1.98 | 0.81–1.18 | 1.09 | 0.95–1.25 | 0.94 | 0.79–.12 | |
| Coast | 0.96 | 0.72–1.27 | 1.06 | 0.87–1.30 | 1.13 | 0.86–1.47 | |
| Mbeya | 0.91 | 0.56–1.48 | 1.79 | 1.20–2.64 | 1.43 | 0.83–2.46 | |
| Other | 0.79 | 0.65–0.96 | 1.18 | 1.01–1.37 | 1.07 | 0.88–1.31 | |
| Religion | Muslim | Ref | - | Ref | - | Ref | - |
| Catholic | 1.12 | 0.97–1.28 | 0.97 | 0.88–1.08 | 1.06 | 0.93–1.21 | |
| Lutheran | 0.69 | 0.46–1.03 | 0.68 | 0.48–0.97 | 1.12 | 0.70–1.77 | |
| Other & No Religion | 0.99 | 0.75–1.29 | 1.02 | 0.83–1.26 | 0.98 | 0.75–1.27 | |
| Migration Status | Non-Migrant | Ref | - | Ref | - | Ref | - |
| Migrant | 1.15 | 1.00–1.31 | 1.08 | 0.97–1.19 | 1.14 | 1.00–1.30 | |
| Risk for Less than Daily Fruit Intake | Risk for Less than Daily Vegetable Intake | Risk for Inadequate Fruit and Vegetable Intake | ||||||
|---|---|---|---|---|---|---|---|---|
| OR * | 95% CI | OR ** | 95% CI | OR *** | 95% CI | |||
| All subjects | Smoking status | Never | Ref | - | Ref | - | Ref | - |
| Former | 1.1 | 0.70–1.61 | 0.98 | 0.74–1.29 | 0.91 | 0.64–1.28 | ||
| Current | 1.00 | 0.76–1.31 | 0.68 | 0.50–0.92 | 1.05 | 0.82–1.35 | ||
| Alcohol consumption | Not daily | Ref | - | Ref | - | Ref | - | |
| Daily | 0.68 | 0.47–0.98 | 0.68 | 0.50–0.92 | 0.62 | 0.44–0.86 | ||
| Men | Smoking status | Never | Ref | - | Ref | - | Ref | - |
| Former | 0.96 | 0.62–1.51 | 0.85 | 0.61–1.18 | 0.84 | 0.57–1.26 | ||
| Current | 1.01 | 0.75–1.36 | 0.94 | 0.75–1.17 | 0.97 | 0.74–1.20 | ||
| Alcohol consumption | Not daily | Ref | - | Ref | - | Ref | - | |
| Daily | 0.85 | 0.45–1.47 | 0.59 | 0.38–0.90 | 0.83 | 0.50–1.39 | ||
| Women | Smoking status | Never | Ref | - | Ref | - | Ref | - |
| Former | 3.36 | 0.79–14.32 | 1.39 | 0.82–2.35 | 1.19 | 0.57–2.49 | ||
| Current | 1.52 | 0.64–3.59 | 1.17 | 0.75–1.82 | 1.83 | 0.90–3.73 | ||
| Alcohol consumption | Not daily | Ref | - | Ref | - | Ref | - | |
| Daily | 0.57 | 0.35–0.95 | 0.79 | 0.52–1.20 | 0.48 | 0.31–0.74 | ||
© 2018 by the authors. Licensee MDPI, Basel, Switzerland. This article is an open access article distributed under the terms and conditions of the Creative Commons Attribution (CC BY) license (http://creativecommons.org/licenses/by/4.0/).
Share and Cite
Msambichaka, B.; Eze, I.C.; Abdul, R.; Abdulla, S.; Klatser, P.; Tanner, M.; Kaushik, R.; Geubbels, E.; Probst-Hensch, N. Insufficient Fruit and Vegetable Intake in a Low- and Middle-Income Setting: A Population-Based Survey in Semi-Urban Tanzania. Nutrients 2018, 10, 222. https://doi.org/10.3390/nu10020222
Msambichaka B, Eze IC, Abdul R, Abdulla S, Klatser P, Tanner M, Kaushik R, Geubbels E, Probst-Hensch N. Insufficient Fruit and Vegetable Intake in a Low- and Middle-Income Setting: A Population-Based Survey in Semi-Urban Tanzania. Nutrients. 2018; 10(2):222. https://doi.org/10.3390/nu10020222
Chicago/Turabian StyleMsambichaka, Beverly, Ikenna C. Eze, Ramadhan Abdul, Salim Abdulla, Paul Klatser, Marcel Tanner, Ramaiya Kaushik, Eveline Geubbels, and Nicole Probst-Hensch. 2018. "Insufficient Fruit and Vegetable Intake in a Low- and Middle-Income Setting: A Population-Based Survey in Semi-Urban Tanzania" Nutrients 10, no. 2: 222. https://doi.org/10.3390/nu10020222