A Systematic Review and Meta-Analysis of Human Milk Feeding and Morbidity in Very Low Birth Weight Infants

 , , , and
Abstract
:1. Introduction
2. Methods
2.1. Registration
2.2. Eligibility Criteria
2.2.1. Types of Studies
2.2.2. Types of Participants
2.2.3. Types of Intervention
- EHM compared with EPTF—to provide a direct evaluation of the benefits of an exclusive HM diet.
- Any HM (includes EHM or HM plus preterm formula) compared with EPTF—to examine whether any HM was protective when infants also receive preterm formula.
- Dose related—exclusive or higher HM (higher dose HM plus preterm formula) intake compared with lower HM (lower dose HM plus preterm formula) intake. This comparison was included to explore the dose related effect of HM, i.e., is more HM beneficial when infants have at least some HM? No a priori categories were defined for “higher” or “lower” dose of HM. Therefore, studies included here may have compared EHM with mixed feeding groups, or alternatively all infant groups may have been mixed fed, with those having a higher proportion of enteral intake as HM compared with those having a lower proportion of enteral intake as HM.
- Unpasteurised HM compared with pasteurised HM (DHM and/or MOM). Pasteurisation is known to destroy some of the immune-protective properties of HM [20,21,22] and unpasteurised MOM provides antibodies specific to the mother–infant dyad [23]. Thus, this comparison was included to assess the effect of pasteurisation on the potential benefits of HM, and to attempt to differentiate the benefits associated with any HM, and those only associated with unpasteurised MOM. Studies reporting mixed feeding (HM plus PTF) were included if there was also a comparison between pasteurised and unpasteurised HM.
2.2.4. Type of Outcome Measures
2.3. Information Sources and Study Selection
2.4. Data Extraction, Risk of Bias in Individual Studies and Data Synthesis
- Clear effect/clear evidence of no effect: The certainty of evidence is moderate or above with a clinically important result from RTs, ideally aligning with results from observational studies or moderate certainty evidence from observational studies; and with reasonable numbers of events and/or participants.
- Probably an effect/probably no effect: There is moderate certainty from either RTs or observational studies and point estimates may be different between the 2 study types with overlapping CIs but can be explained (e.g., through heterogeneity). There are large numbers of participants and studies.
- Possible effect/possibly no effect: There is low/ moderate certainty with CIs which may suggest a difference although not reaching conventional statistical significance; or with a confidence interval which indicates a trivial difference only.
- Inconclusive: The certainty of evidence is very low to low, CIs are wide, and number of participants and studies is low.
3. Results
3.1. Risk of Bias
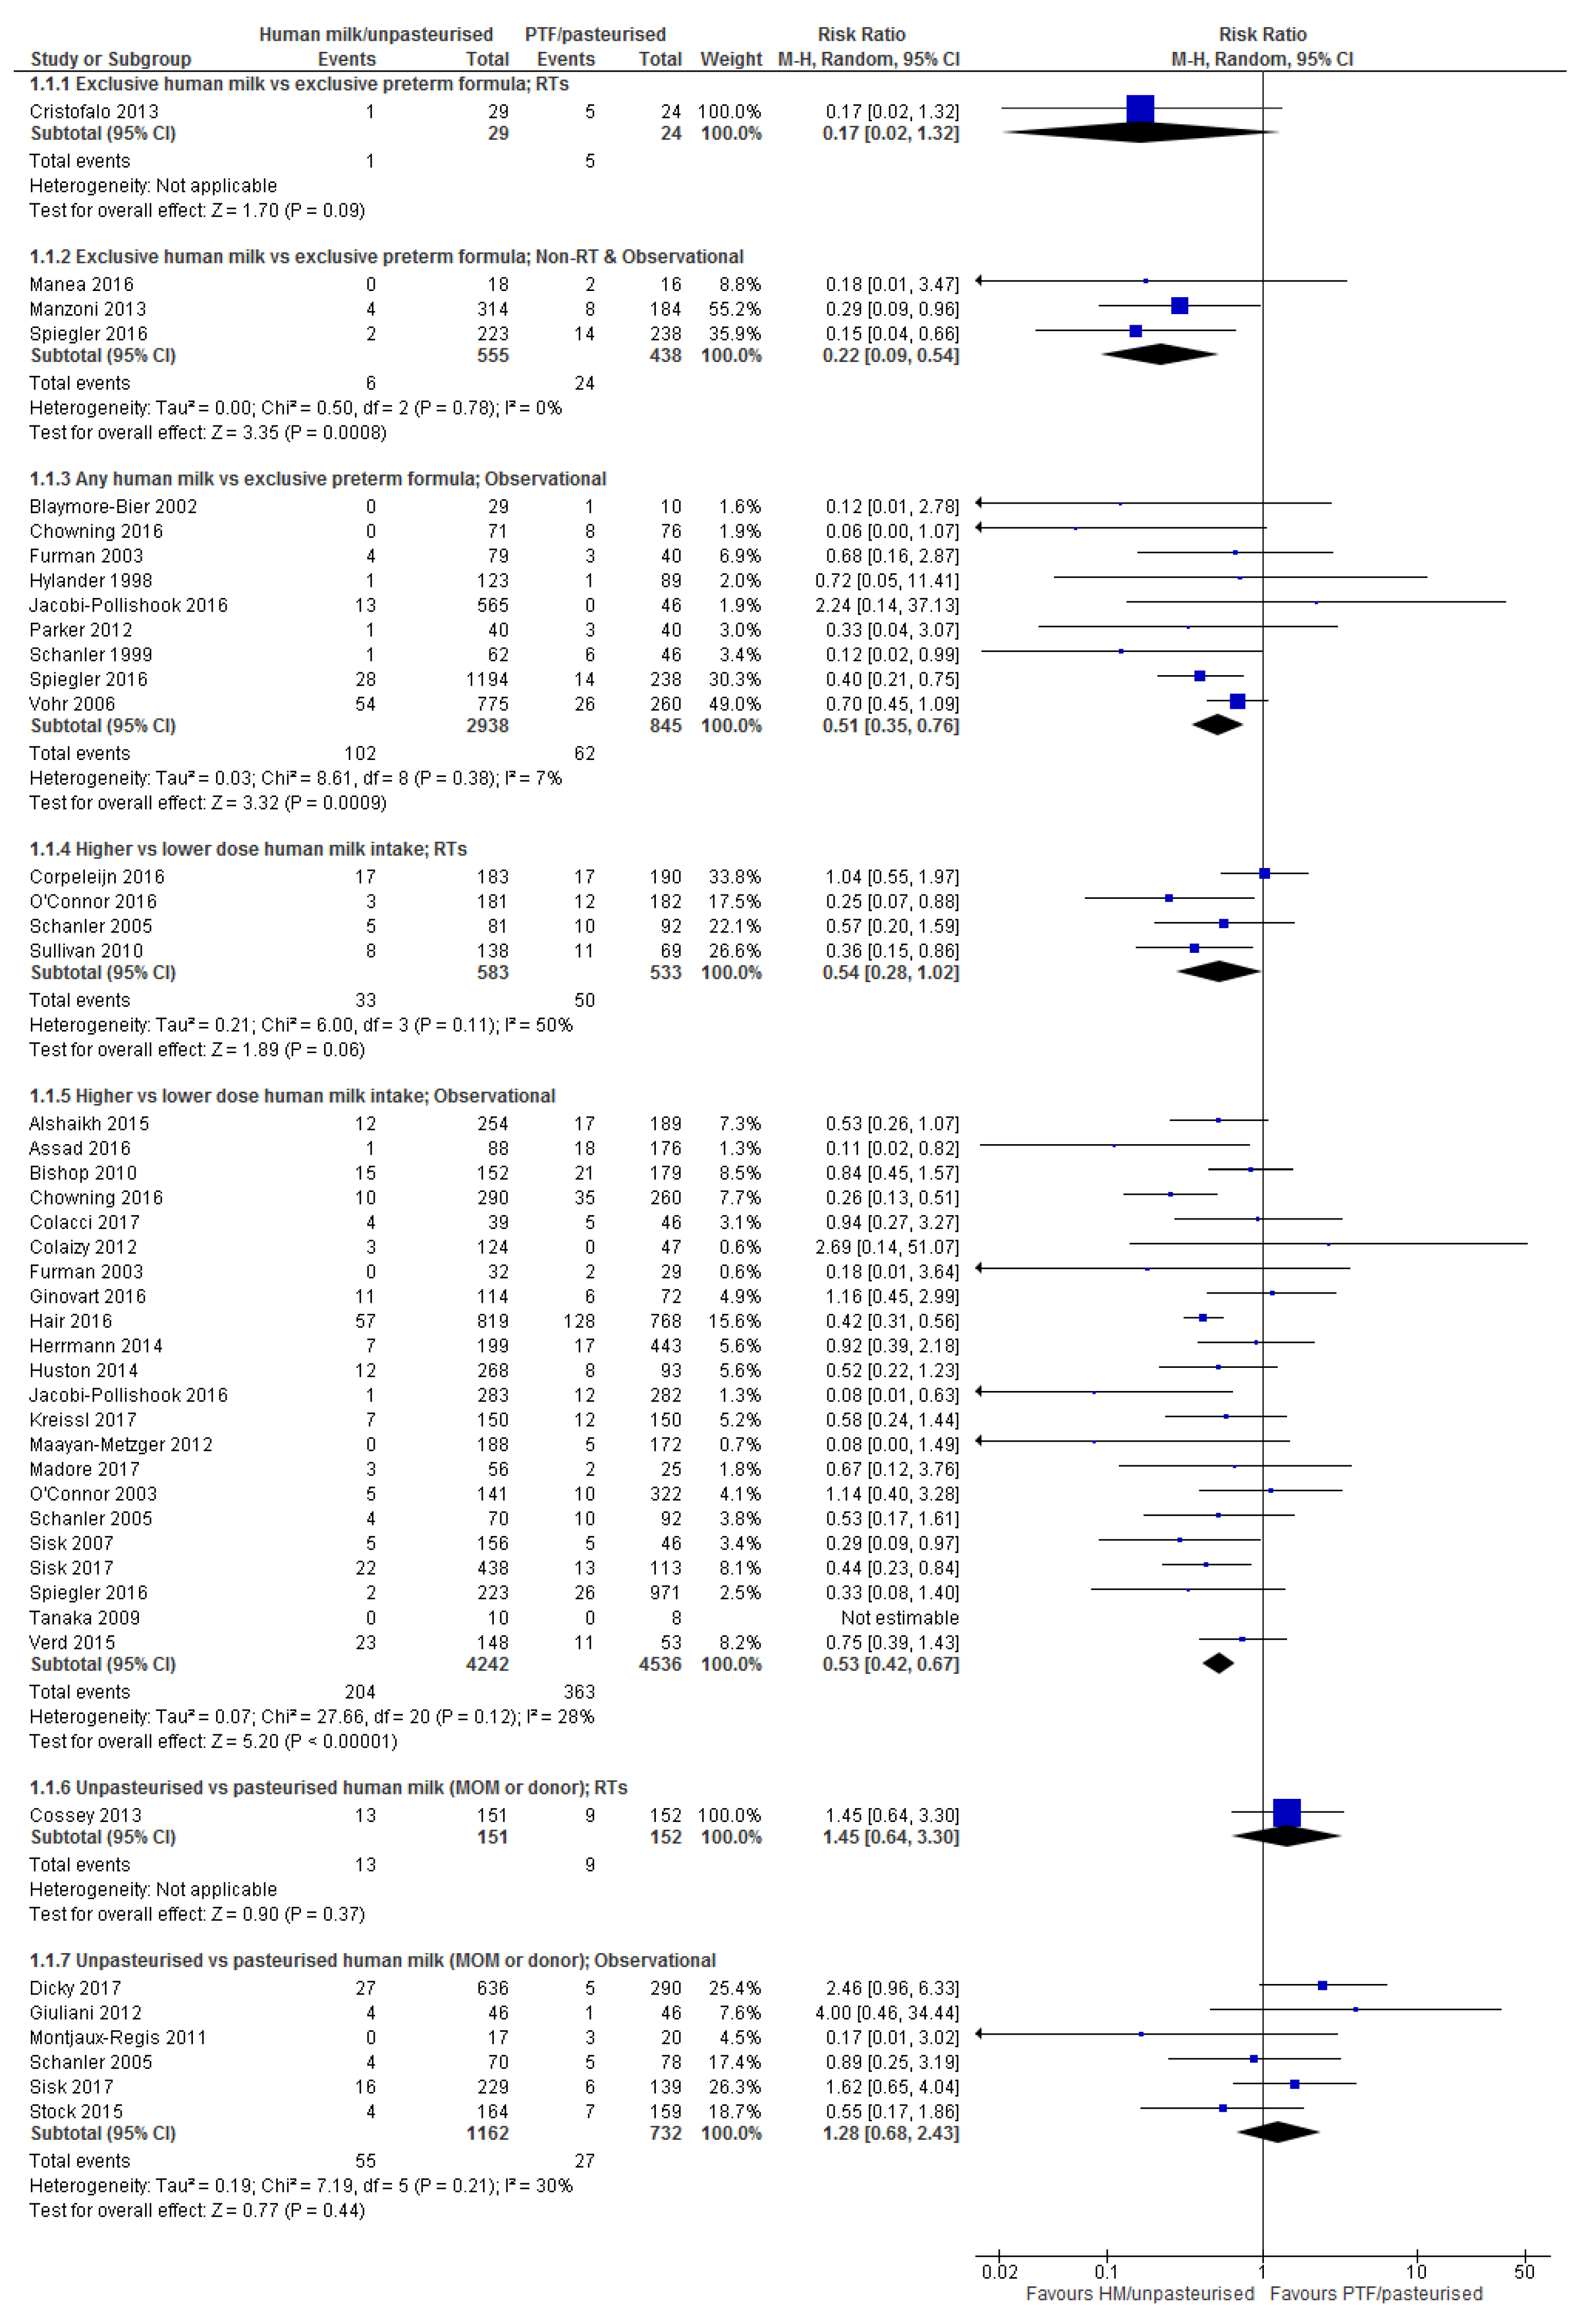
3.2. Necrotising Enterocolitis (NEC)
3.2.1. Comparison 1: Exclusive Human Milk vs. Exclusive Preterm Formula
3.2.2. Comparison 2: Any Human Milk vs. Exclusive Preterm Formula
3.2.3. Comparison 3: Higher vs. Lower Dose Human Milk Intake
3.2.4. Comparison 4: Unpasteurised vs. Pasteurised Human Milk
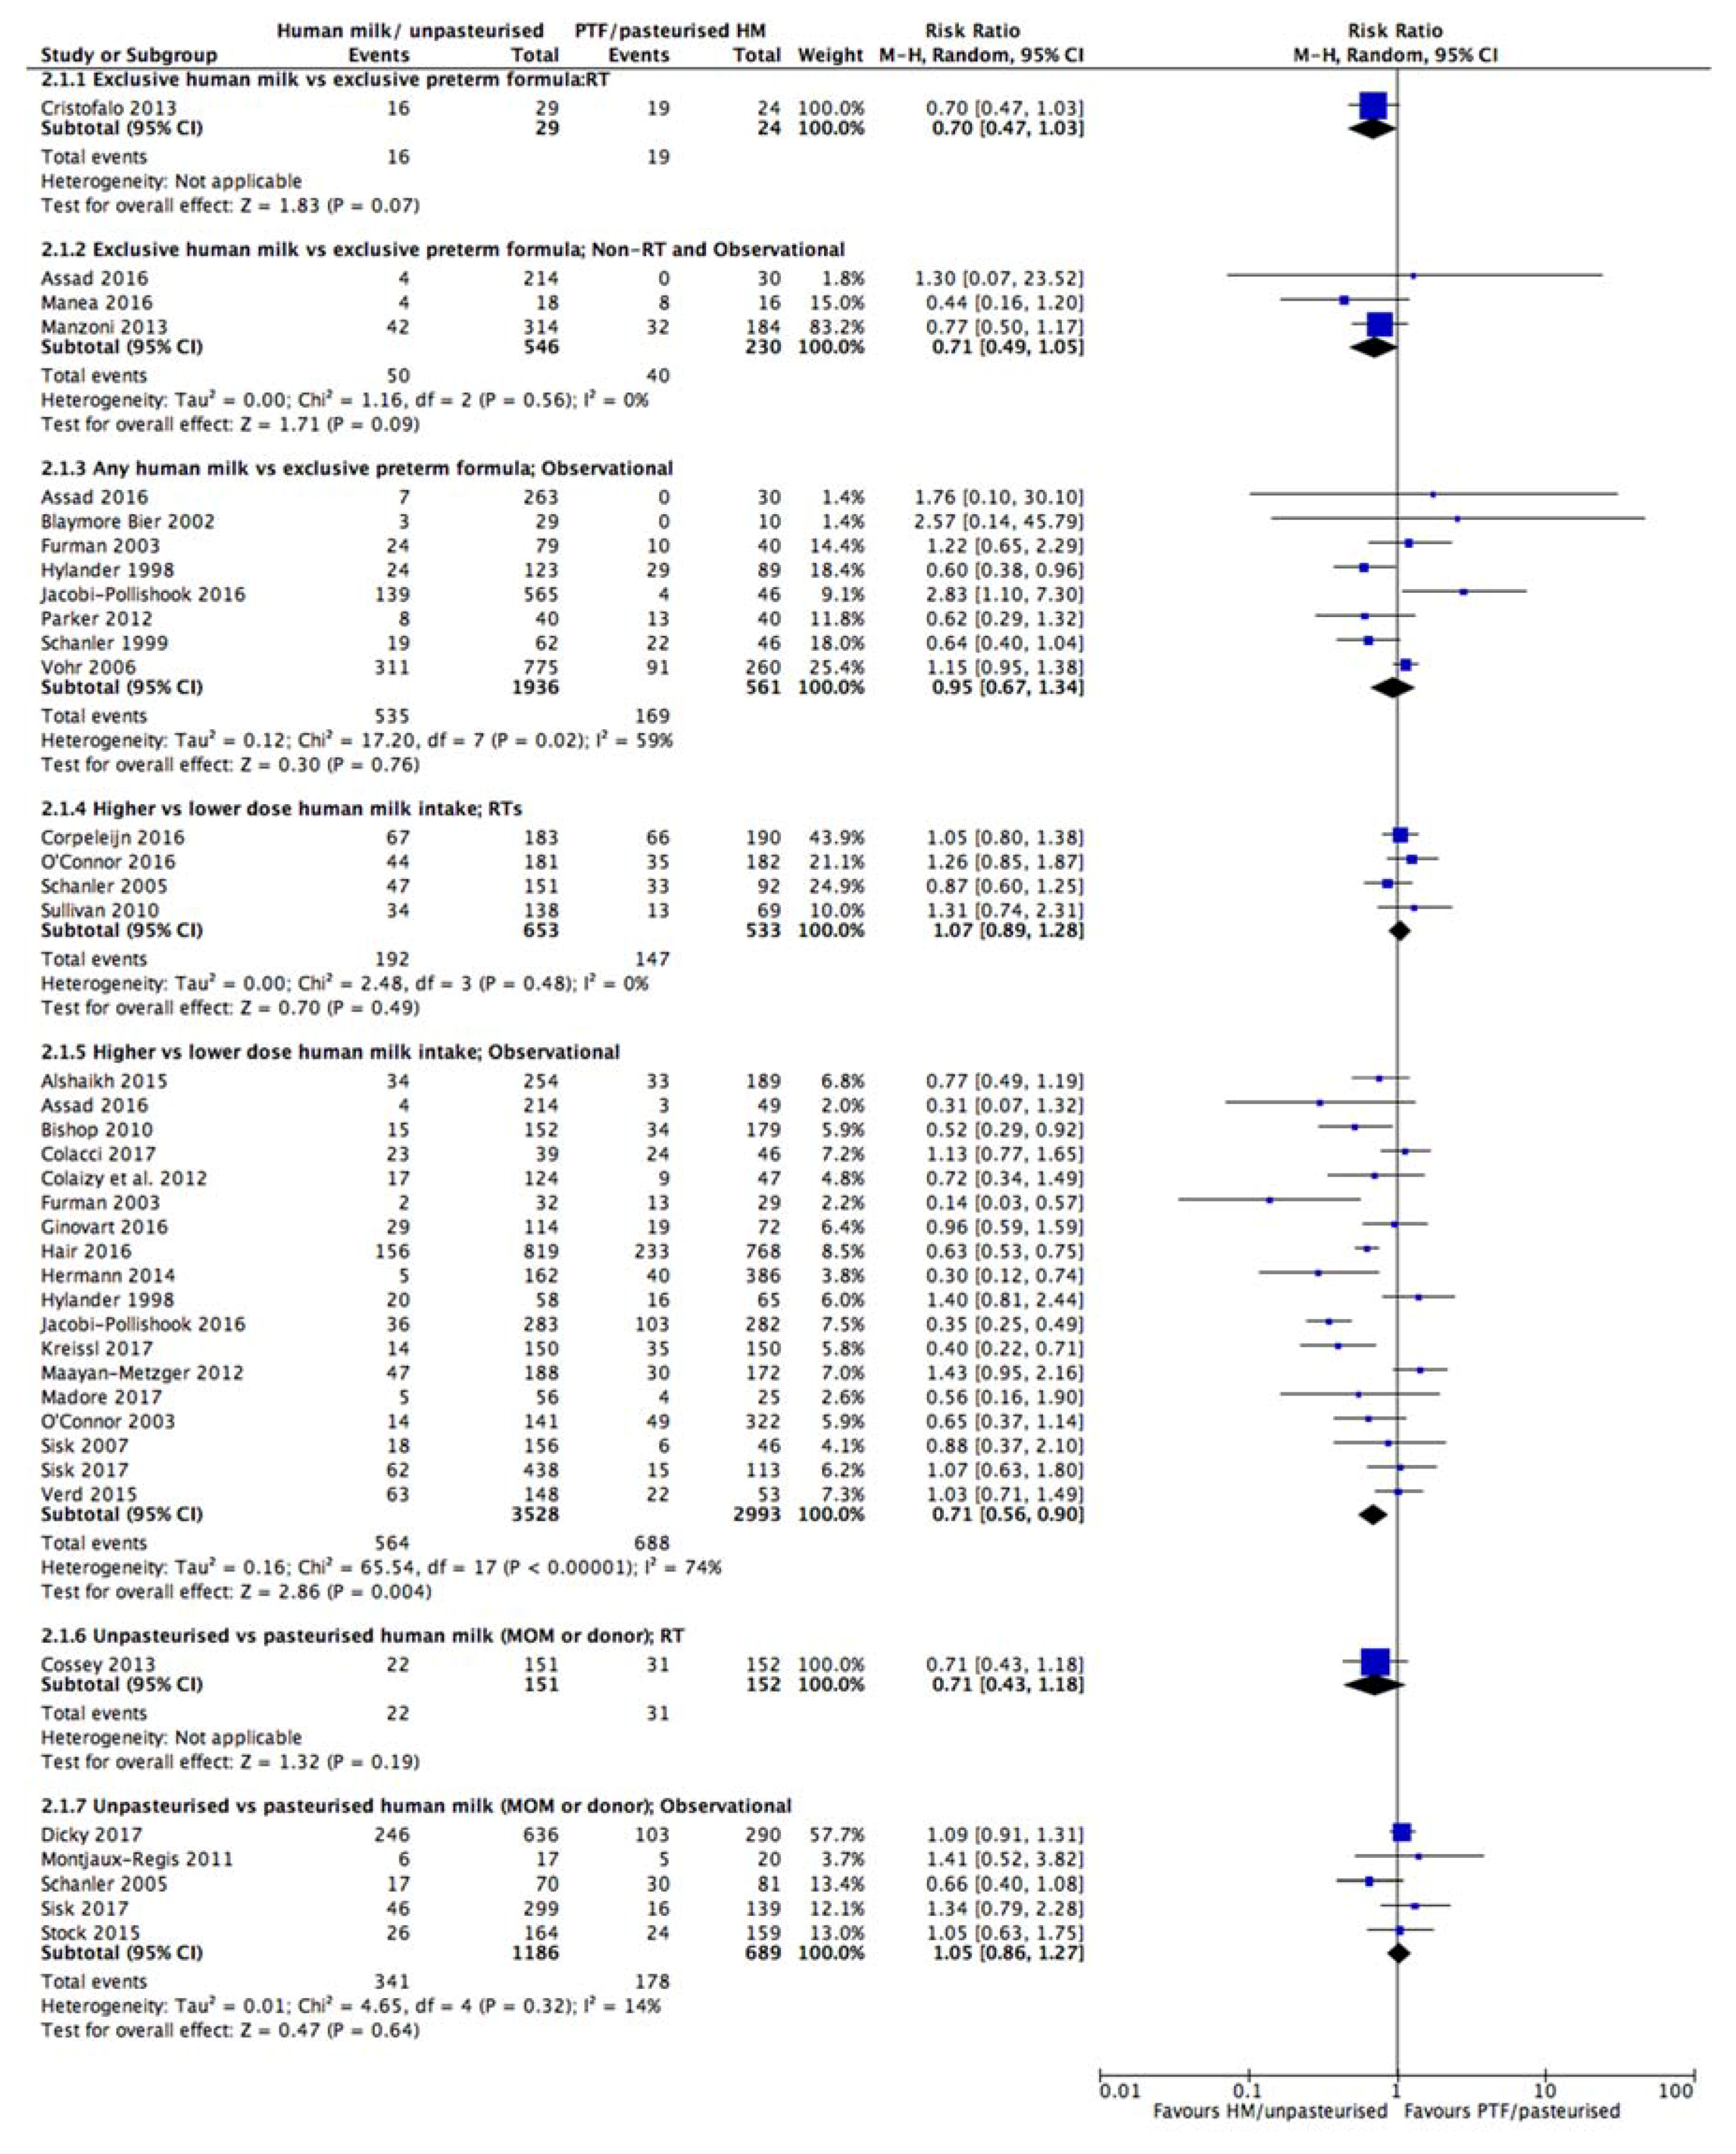
3.3. Late Onset Sepsis (LOS)
3.3.1. Comparison 1: Exclusive Human Milk vs. Exclusive Preterm Formula
3.3.2. Comparison 2: Any Human Milk vs. Exclusive Preterm Formula
3.3.3. Comparison 3: Higher vs. Lower Dose Human Milk Intake
3.3.4. Comparison 4: Unpasteurised vs. Pasteurised Human Milk
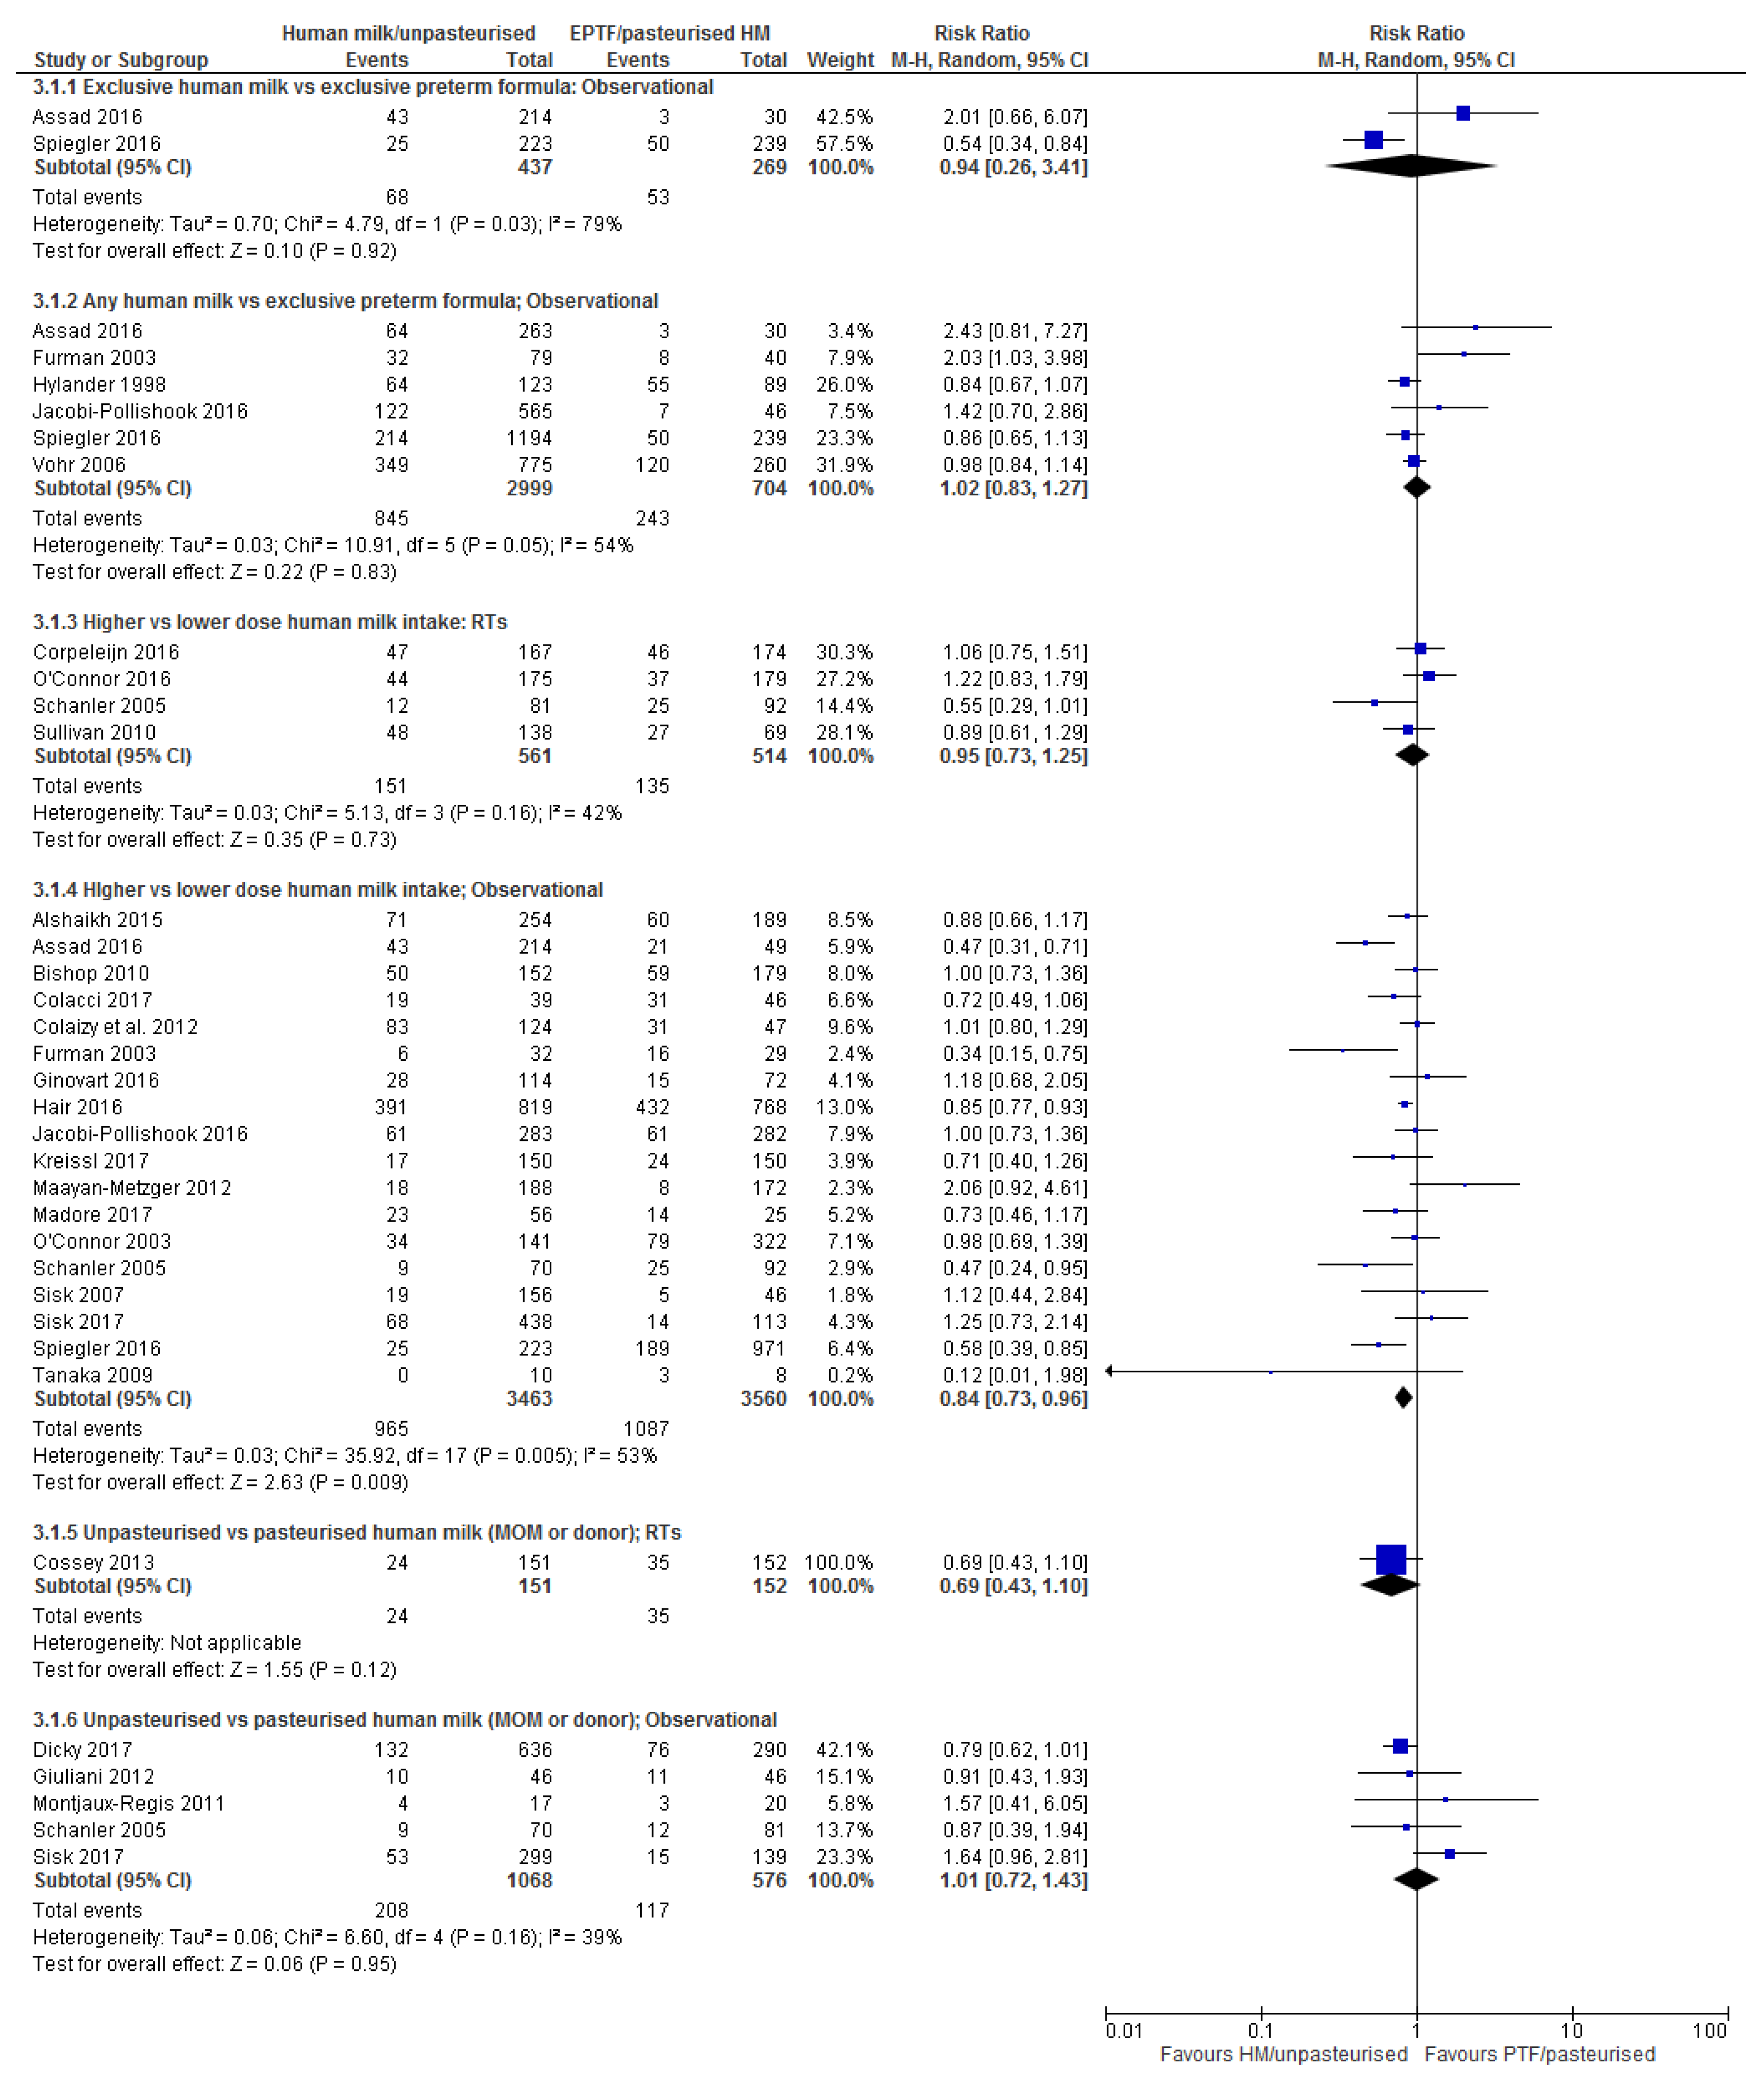
3.4. Bronchopulmonary Dysplasia (BPD)
3.4.1. Comparison 1: Exclusive Human Milk Compared with Exclusive Preterm Formula
3.4.2. Comparison 2: Any Human Milk Compared with Exclusive Preterm Formula
3.4.3. Comparison 3: Higher vs. Lower Dose Human Milk Intake
3.4.4. Comparison 4: Unpasteurised vs. Pasteurised Human Milk
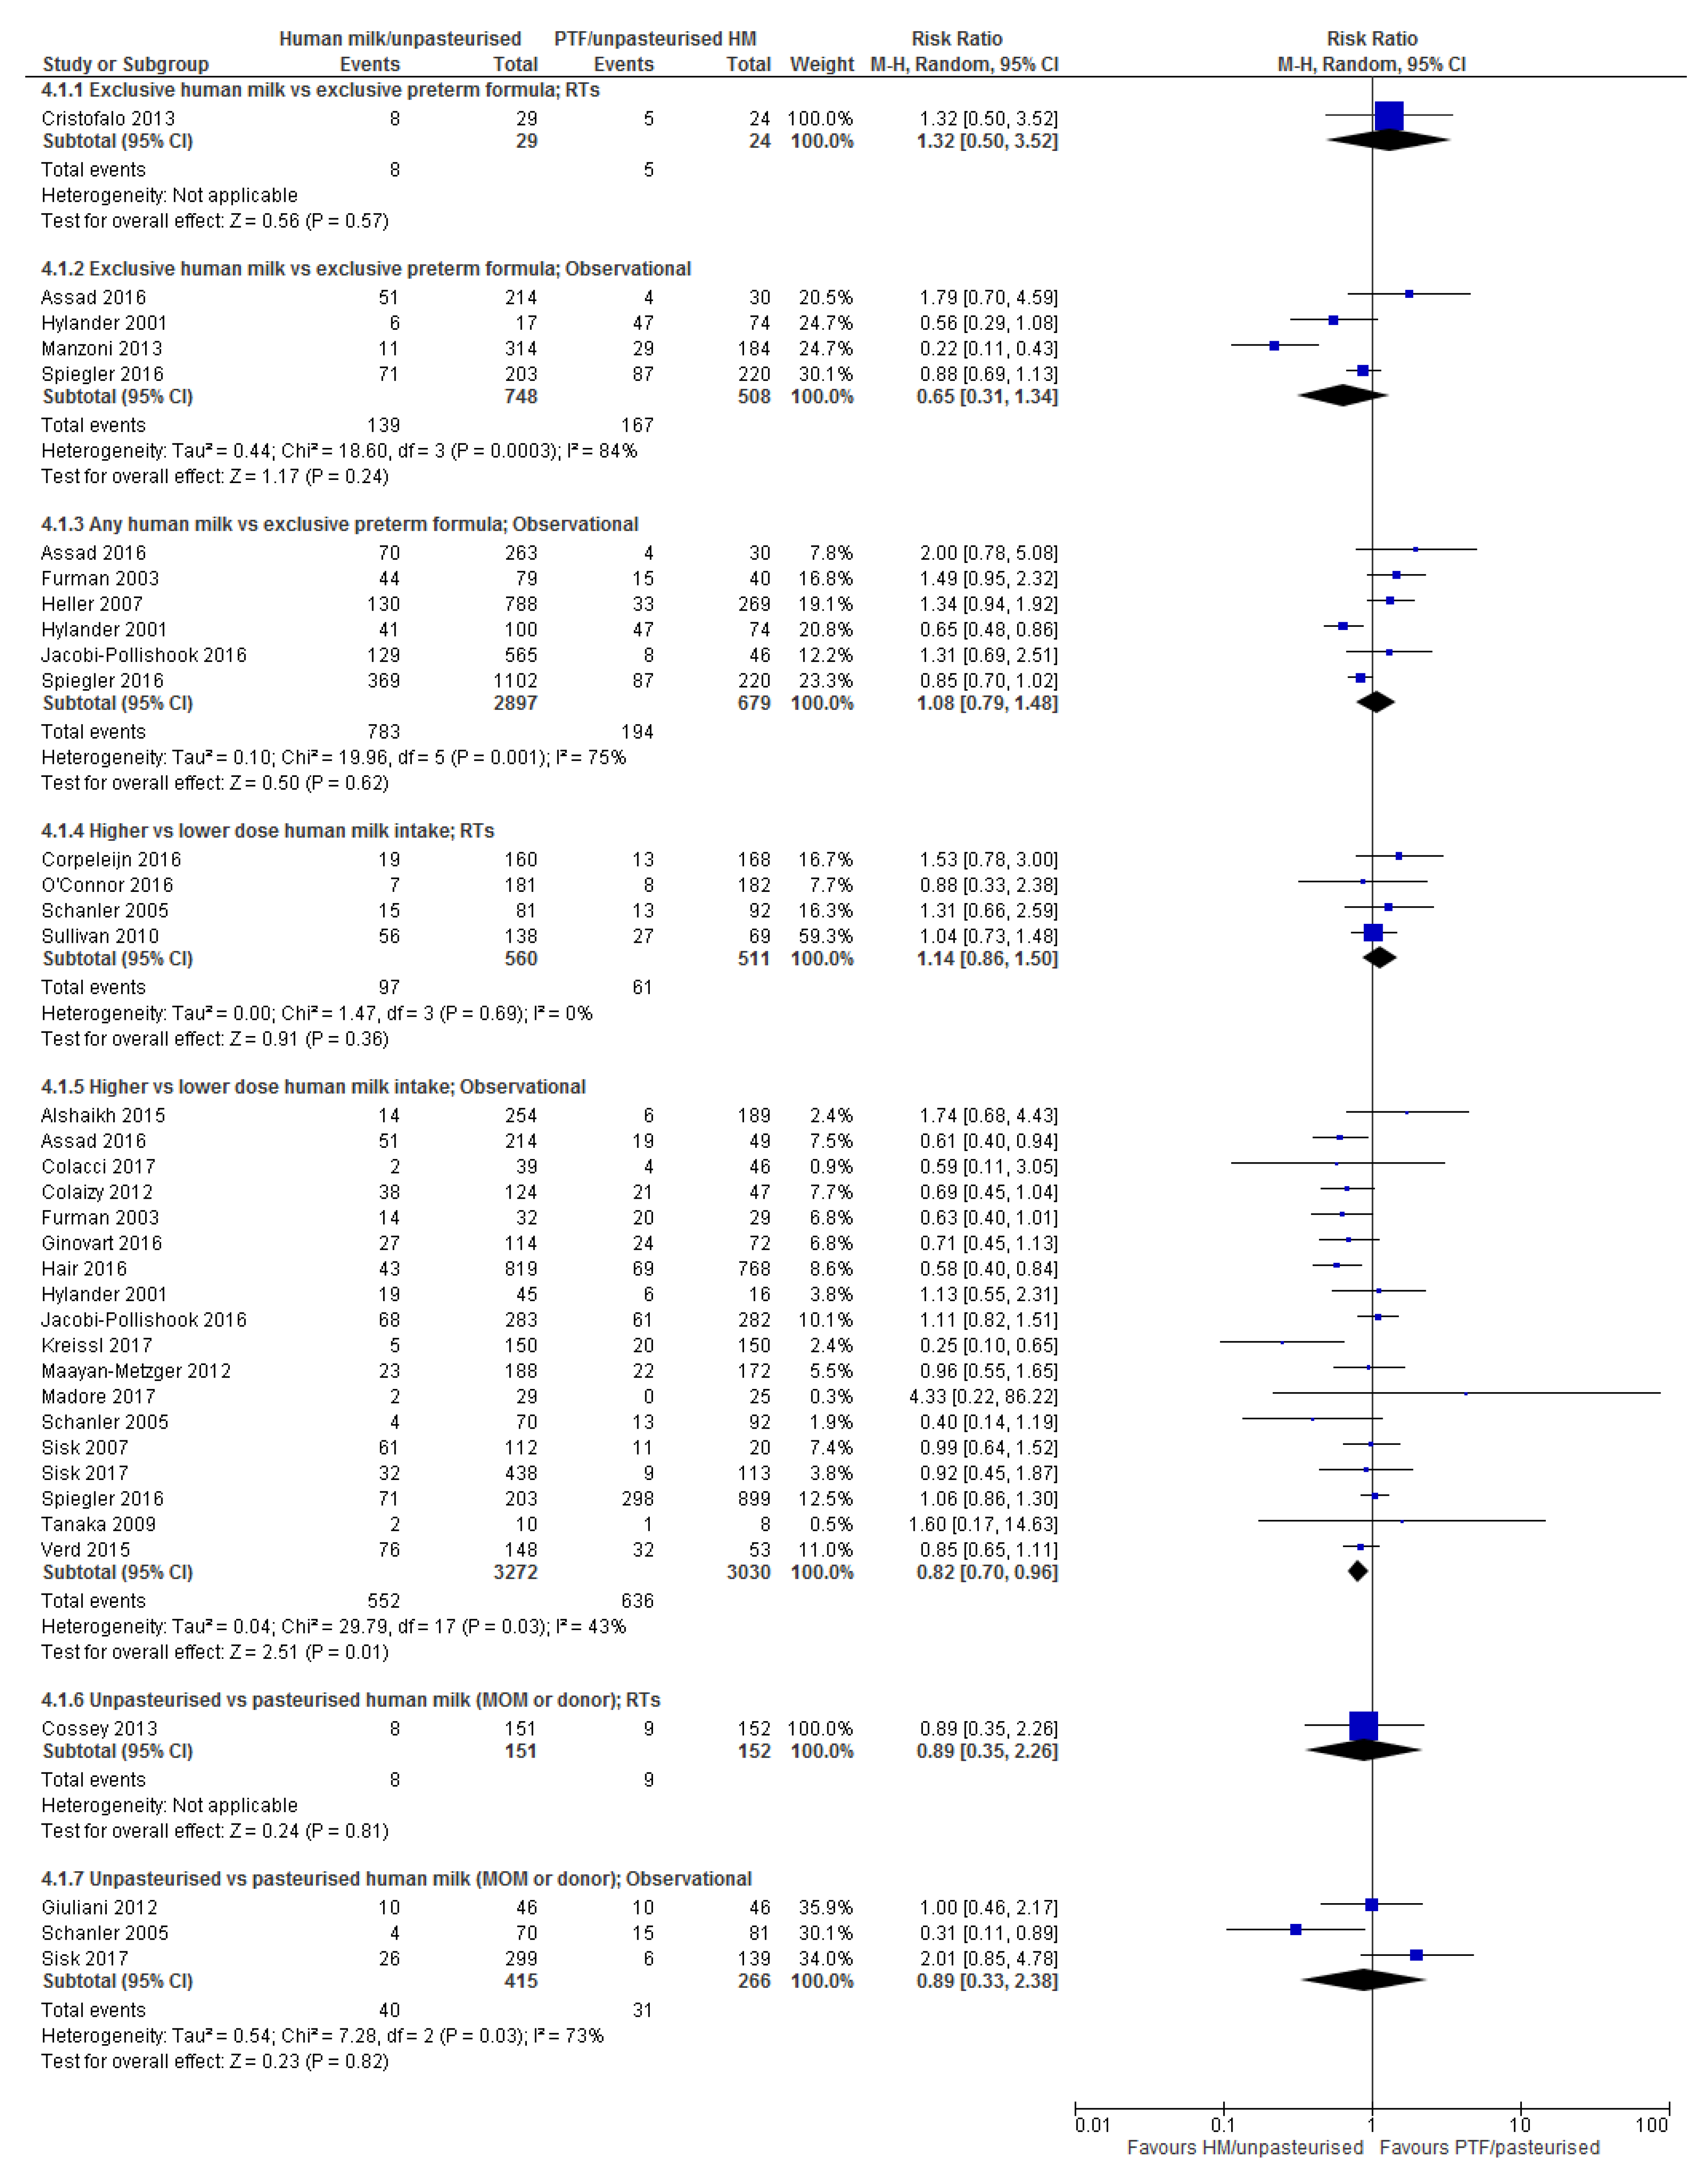
3.5. Retinopathy of Prematurity (ROP)
3.5.1. Comparison 1: Exclusive Human Milk vs. Exclusive Preterm Formula
3.5.2. Comparison 2: Any Human Milk Compared with Exclusive Preterm Formula
3.5.3. Comparison 3: Higher vs. Lower Dose Human Milk Intake
3.5.4. Comparison 4: Unpasteurised vs. Pasteurised Human Milk
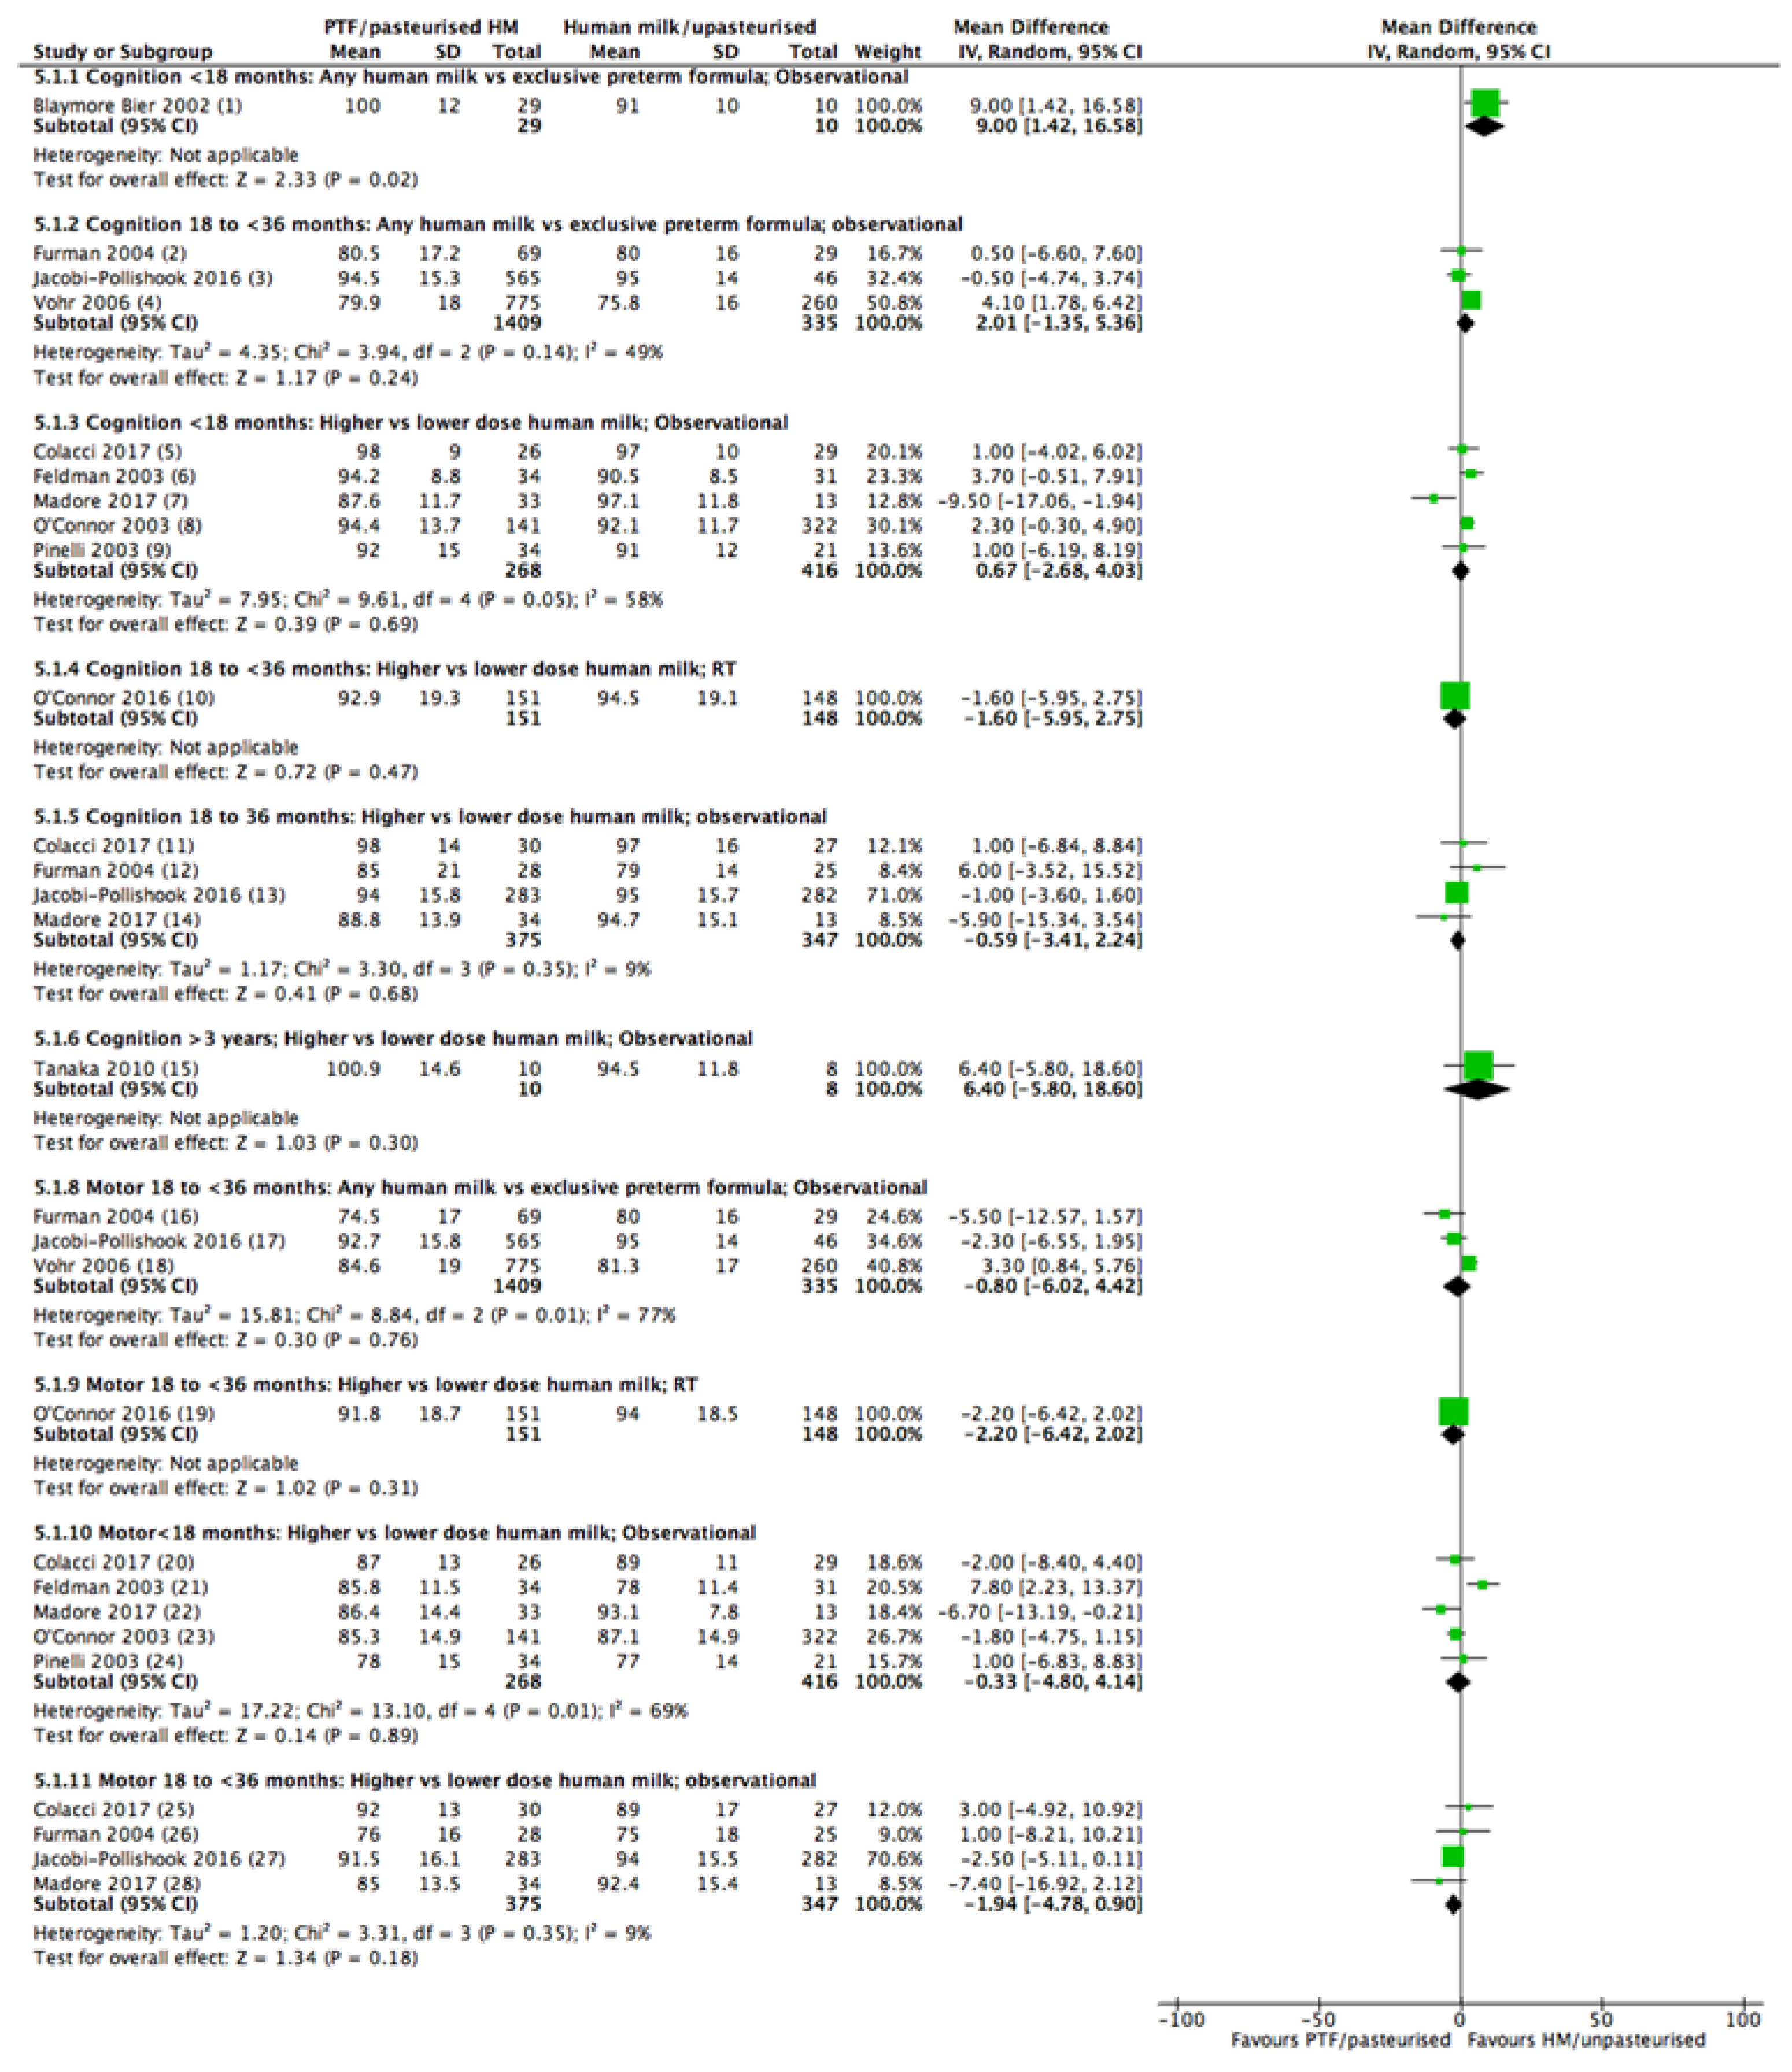
3.6. Neurodevelopment
3.6.1. Comparison 1: Exclusive Human Milk vs. Exclusive Preterm Formula
3.6.2. Comparison 2: Any Human Milk Compared with Exclusive Preterm Formula
3.6.3. Comparison 3: Higher vs. Lower Dose Human Milk Intake
3.6.4. Comparison 4: Unpasteurised vs. Pasteurised Human Milk
4. Discussion
4.1. Summary of Main Results
4.2. Strengths and Limitations
4.3. Findings from Other Reviews
5. Conclusions
5.1. Implications for Practice
5.2. Implications for Research
Supplementary Materials
Author Contributions
Funding
Conflicts of Interest
References
- Agostoni, C.; Buonocore, G.; Carnielli, V.P.; De Curtis, M.; Darmaun, D.; Decsi, T.; Domellöf, M.; Embleton, N.D.; Fusch, C.; Genzel-Boroviczeny, O.; et al. Enteral nutrient supply for preterm infants: Commentary from the european society of paediatric gastroenterology, hepatology and nutrition committee on nutrition. J. Pediatr. Gastroenterol. Nutr. 2010, 50, 85–91. [Google Scholar] [CrossRef] [PubMed]
- Committee on Nutrition; Section on Brreastfeeding; Committee on Fetus and Newborn. Donor human milk for the high-risk infant: Preparation, safety, and usage options in the United States. Pediatrics 2017, 139, e20163044. [Google Scholar]
- Arslanoglu, S.; Corpeleijn, W.; Moro, G.; Braegger, C.; Campoy, C.; Colomb, V.; Decsi, T.; Domellof, M.; Fewtrell, M.; Hojsak, I.; et al. Donor human milk for preterm infants: Current evidence and research directions. J. Pediatr. Gastroenterol. Nutr. 2013, 57, 535–542. [Google Scholar] [CrossRef] [PubMed]
- Grovslien, A.H.; Gronn, M. Donor milk banking and breastfeeding in Norway. J. Hum. Lact. 2009, 25, 206–210. [Google Scholar] [CrossRef] [PubMed]
- Lucas, A.; Cole, T.J. Breast milk and neonatal necrotising enterocolitis. Lancet 1990, 336, 1519–1523. [Google Scholar] [CrossRef]
- Lucas, A.; Fewtrell, M.S.; Morley, R.; Lucas, P.J.; Baker, B.A.; Lister, G.; Bishop, N.J. Randomized outcome trial of human milk fortification and developmental outcome in preterm infants. Am. J. Clin. Nutr. 1996, 64, 142–151. [Google Scholar] [CrossRef] [PubMed]
- Lucas, A.; Gore, S.M.; Cole, T.J.; Bamford, M.F.; Dossetor, J.F.; Barr, I.; Dicarlo, L.; Cork, S.; Lucas, P.J. Multicentre trial on feeding low birthweight infants: Effects of diet on early growth. Arch. Dis. Child. 1984, 59, 722–730. [Google Scholar] [CrossRef] [PubMed]
- Lucas, A.; Morley, R.; Cole, T.J.; Gore, S.M.; Davis, J.A.; Bamford, M.F.M.; Dossetor, J.F.B. Early diet in preterm babies and developmental status in infancy. Arch. Dis. Child. 1989, 64, 1570–1578. [Google Scholar] [CrossRef] [PubMed]
- Lucas, A.; Morley, R.; Cole, T.J.; Lister, G.; Leeson-Payne, C. Breast milk and subsequent intelligence quotient in children born preterm. Lancet 1992, 339, 261–264. [Google Scholar] [CrossRef]
- Davies, D.P. Adequacy of expressed breast milk for early growth of preterm infants. Arch. Dis. Child. 1977, 52, 296–301. [Google Scholar] [CrossRef] [PubMed]
- Narayanan, I.; Prakash, K.; Murthy, N.S.; Gujral, V.V. Randomised controlled trial of effect of raw and holder pasteurised human milk and of formula supplements on incidence of neonatal infection. Lancet 1984, 2, 1111–1113. [Google Scholar] [CrossRef]
- Behrman, R.E.; Tyson, J.E.; Lasky, R.E.; Mize, C.E.; Richards, C.J.; Blair-Smith, N.; Whyte, R.; Beer, A.E. Growth, metabolic response, and development in very-low-birth-weight infants fed banked human milk or enriched formula. I. Neonatal findings. J. Pediatr. 1983, 103, 95–104. [Google Scholar] [CrossRef]
- Gross, S.J. Growth and biochemical response of preterm infants fed human milk of modified infant formula. N. Engl. J. Med. 1983, 308, 237–241. [Google Scholar] [CrossRef] [PubMed]
- Narayanan, I.; Prakash, K.; Bala, S.; Verma, R.K.; Gujral, V.V. Partial supplementation with expressed breast-milk for prevention of infection in low-birth-weight infants. Lancet 1980, 2, 561–563. [Google Scholar] [CrossRef]
- Anderson, J.W.; Johnstone, B.M.; Remley, D.T. Breast-feeding and cognitive development: A meta-analysis. Am. J. Clin. Nutr. 1999, 70, 525–535. [Google Scholar] [CrossRef] [PubMed]
- Boyd, C.A.; Quigley, M.A.; Brocklehurst, P. Donor breast milk versus infant formula for preterm infants: Systematic review and meta-analysis. Arch. Dis. Child. Fetal Neonatal Ed. 2007, 92, F169–F175. [Google Scholar] [CrossRef] [PubMed]
- Quigley, M.; McGuire, W. Formula versus donor breast milk for feeding preterm or low birth weight infants. Cochrane Database Syst. Rev. 2014, CD002971. [Google Scholar] [CrossRef] [PubMed]
- Owen, L.S.; Manley, B.J.; Davis, P.G.; Doyle, L.W. The evolution of modern respiratory care for preterm infants. Lancet 2017, 389, 1649–1659. [Google Scholar] [CrossRef]
- Australian Government Department of Health. Donor Human Milk Banking in Australia—Issues and Background Paper. Commonwealth of Australia, 2014. Available online: http://www.health.gov.au/breastfeeding (accessed on 14 February 2018).
- Stock, K.; Griesmaier, E.; Brunner, B.; Neubauer, V.; Kiechl-Kohlendorfer, U.; Trawoger, R. Pasteurization of breastmilk decreases the rate of postnatally acquired cytomegalovirus infections, but shows a nonsignificant trend to an increased rate of necrotizing enterocolitis in very preterm infants—A preliminary study. Breastfeed. Med. 2015, 10, 113–117. [Google Scholar] [CrossRef] [PubMed]
- Assad, M.; Elliott, M.J.; Abraham, J.H. Decreased cost and improved feeding tolerance in VLBW infants fed an exclusive human milk diet. J. Perinatol. 2016, 36, 216–220. [Google Scholar] [CrossRef] [PubMed]
- Tanaka, K.; Kon, N.; Ohkawa, N.; Yoshikawa, N.; Shimizu, T. Does breastfeeding in the neonatal period influence the cognitive function of very-low-birth-weight infants at 5 years of age? Brain Dev. 2009, 31, 288–293. [Google Scholar] [CrossRef] [PubMed]
- Verd, S.; Porta, R.; Botet, F.; Gutierrez, A.; Ginovart, G.; Barbero, A.H.; Ciurana, A.; Plata, I.I. Hospital outcomes of extremely low birth weight infants after introduction of donor milk to supplement mother's milk. Breastfeed. Med. 2015, 10, 150–155. [Google Scholar] [CrossRef] [PubMed]
- Miller, J.; Collins, C.T.; Suganuma, H.; Suganuma, M.; Keir, A.; Middleton, P.F.; Makrides, M.; Damarell, R.A.; Tonkin, E.; McPhee, A. A Systematic Review of Human Milk Feeding and morbidity in Very Low Birth Weight (VLBW) Infants. PROSPERO: International Prospective Register of Systematic Reviews. CRD42017077316. Available online: http://www.crd.york.ac.uk/PROSPERO/display_record.php?ID=CRD42017077316 (accessed on 19 September 2017).
- Covidence Systematic Review Software, Veritas Health Innovation Melbourne, Australia. Available online: www.covidence.org (accessed on 9 June 2017).
- Cochrane Effective Practice and Organisation of Care (EPOC). What Study Designs Should be Included in an EPOC Review and What Should They be Called? EPOC Resources for Review Authors. 2017. Available online: http://epoc.cochrane.org/resources/epoc-resources-review-authors (accessed on 12 July 2017).
- Higgins, J.P.T.; Churchill, R.; Chandler, J.; Cumpston, M.S. Cochrane Handbook for Systematic Reviews of Interventions Version 5.2.0 (updated June 2017), Cochrane, 2017. Available online: www.training.cochrane.org/handbook (accessed on 15 September 2017).
- Critical Appraisal Skills Programme. CASP Cohort Study Checklist. 2017. Available online: https://casp-uk.net/casp-tools-checklists/ (accessed on 21 June 2017).
- Review Manager (RevMan) (Computer Program). Version 5.3. Copenhagen. The Nordic Cochrane Centre, The Cochrane Collaboration, 2014. Available online: http://community.cochrane.org/help/tools-and-software/revman-5/revman-5-download (accessed on 4 October 2017).
- GRADEpro GDT: GRADEpro Guideline Development Tool (Software). McMaster University, 2015. (Developed by Evidence Prime, Inc.). Available online: Gradepro.org (accessed on 3 March 2018).
- Schünemann, H.; Brożek, J.; Guyatt, G.; Oxman, A. (Eds.) GRADE Handbook for Grading Quality of Evidence and Strength of Recommendations. Updated October 2013. The GRADE Working Group, 2013. Available online: Guidelinedevelopment.org/handbook (accessed on 21 June 2017).
- Corpeleijn, W.E.; De Waard, M.; Christmann, V.; Van Goudoever, J.B.; Jansen-Van Der Weide, M.C.; Kooi, E.M.W.; Koper, J.F.; Kouwenhoven, S.M.P.; Lafeber, H.N.; Mank, E.; et al. Effect of donor milk on severe infections and mortality in very low-birth-weight infants: The early nutrition study randomized clinical trial. JAMA Pediatr. 2016, 170, 654–661. [Google Scholar] [CrossRef] [PubMed]
- Cossey, V.; Vanhole, C.; Eerdekens, A.; Rayyan, M.; Fieuws, S.; Schuermans, A. Pasteurization of mother’s own milk for preterm infants does not reduce the incidence of late-onset sepsis. Neonatology 2013, 103, 170–176. [Google Scholar] [CrossRef] [PubMed]
- Cristofalo, E.A.; Schanler, R.J.; Blanco, C.L.; Sullivan, S.; Trawoeger, R.; Kiechl-Kohlendorfer, U.; Dudell, G.; Rechtman, D.J.; Lee, M.L.; Lucas, A.; et al. Randomized trial of exclusive human milk versus preterm formula diets in extremely premature infants. J. Pediatr. 2013, 163, 1592–1595. [Google Scholar] [CrossRef] [PubMed]
- O’Connor, D.L.; Gibbins, S.; Kiss, A.; Bando, N.; Brennan-Donnan, J.; Ng, E.; Campbell, D.M.; Vaz, S.; Fusch, C.; Asztalos, E.; et al. Effect of supplemental donor human milk compared with preterm formula on neurodevelopment of very low-birth-weight infants at 18 months: A randomized clinical trial. JAMA 2016, 316, 1897–1905. [Google Scholar] [CrossRef] [PubMed]
- Schanler, R.J.; Lau, C.; Hurst, N.M.; Smith, E.O. Randomized trial of donor human milk versus preterm formula as substitutes for mothers’ own milk in the feeding of extremely premature infants. Pediatrics 2005, 116, 400–406. [Google Scholar] [CrossRef] [PubMed]
- Sullivan, S.; Schanler, R.J.; Kim, J.H.; Patel, A.L.; Trawoger, R.; Kiechl-Kohlendorfer, U.; Chan, G.M.; Blanco, C.L.; Abrams, S.; Cotten, C.M.; et al. An exclusively human milk-based diet is associated with a lower rate of necrotizing enterocolitis than a diet of human milk and bovine milk-based products. J. Pediatr. 2010, 156, 562–567. [Google Scholar] [CrossRef] [PubMed]
- Manea, A.; Boia, M.; Iacob, D.; Dima, M.; Iacob, R.E. Benefits of early enteral nutrition in extremely low birth weight infants. Singap. Med. J. 2016, 57, 616–618. [Google Scholar] [CrossRef] [PubMed]
- Belfort, M.B.; Anderson, P.J.; Nowak, V.A.; Lee, K.J.; Molesworth, C.; Thompson, D.K.; Doyle, L.W.; Inder, T.E. Breast milk feeding, brain development, and neurocognitive outcomes: A 7-year longitudinal study in infants born at less than 30 weeks’ gestation. J. Pediatr. 2016, 177, 133–139. [Google Scholar] [CrossRef] [PubMed]
- Blaymore-Bier, J.A.; Oliver, T.; Ferguson, A.E.; Vohr, B.R. Human milk improves cognitive and motor development of premature infants during infancy. J. Hum. Lact. 2002, 18, 361–367. [Google Scholar] [CrossRef] [PubMed]
- Chowning, R.; Radmacher, P.; Lewis, S.; Serke, L.; Pettit, N.; Adamkin, D.H. A retrospective analysis of the effect of human milk on prevention of necrotizing enterocolitis and postnatal growth. J. Perinatol. 2016, 36, 221–224. [Google Scholar] [CrossRef] [PubMed]
- Colacci, M.; Murthy, K.; Deregnier, R.A.O.; Khan, J.Y.; Robinson, D.T. Growth and development in extremely low birth weight infants after the introduction of exclusive human milk feedings. Am. J. Perinatol. 2017, 34, 130–137. [Google Scholar] [CrossRef] [PubMed]
- Colaizy, T.T.; Carlson, S.; Saftlas, A.F.; Morriss, F.H., Jr. Growth in VLBW infants fed predominantly fortified maternal and donor human milk diets: A retrospective cohort study. BMC Pediatr. 2012, 12, 124. [Google Scholar] [CrossRef] [PubMed]
- Dicky, O.; Ehlinger, V.; Montjaux, N.; Gremmo-Feger, G.; Sizun, J.; Roze, J.C.; Arnaud, C.; Casper, C. The EPIPAGE 2 Nutrition Study Group; The EPINUTRI Study Group. Policy of feeding very preterm infants with their mother’s own fresh expressed milk was associated with a reduced risk of bronchopulmonary dysplasia. Acta Paediatr. 2017, 106, 755–762. [Google Scholar] [CrossRef] [PubMed]
- Eidelman, A.I.; Feldman, R. Positive effect of human milk on neurobehavioral and cognitive development of premature infants. Adv. Exp. Med. Biol. 2004, 554, 359–364. [Google Scholar] [PubMed]
- Feldman, R.; Eidelman, A.I. Direct and indirect effects of breast milk on the neurobehavioral and cognitive development of premature infants. Dev. Psychobiol. 2003, 43, 109–119. [Google Scholar] [CrossRef] [PubMed]
- Furman, L.; Taylor, G.; Minich, N.; Hack, M. The effect of maternal milk on neonatal morbidity of very low-birth-weight infants. Arch. Pediatr. Adolesc. Med. 2003, 157, 66–71. [Google Scholar] [CrossRef] [PubMed]
- Furman, L.; Wilson-Costelo, D.; Friedman, H.; Taylor, H.G.; Minich, N.; Hack, M. The effect of neonatal maternal milk feeding on the neurodevelopmental outcome of very low birth weight infants. J. Dev. Behav. Pediatr. 2004, 25, 247–253. [Google Scholar] [CrossRef] [PubMed]
- Ginovart, G.; Gich, I.; Verd, S. Human milk feeding protects very low-birth-weight infants from retinopathy of prematurity: A pre–post cohort analysis. J. Matern.-Fetal Neonatal Med. 2016, 29, 3790–3795. [Google Scholar] [CrossRef] [PubMed]
- Heller, C.D.; O’Shea, M.; Yao, Q.; Langer, J.; Ehrenkranz, R.A.; Phelps, D.L.; Poole, W.K.; Stoll, B.; Duara, S.; Oh, W.; et al. Human milk intake and retinopathy of prematurity in extremely low birth weight infants. Pediatrics 2007, 120, 1–9. [Google Scholar] [CrossRef] [PubMed]
- Huston, R.K.; Markell, A.M.; McCulley, E.A.; Pathak, M.; Rogers, S.P.; Sweeney, S.L.; Dolphin, N.G.; Gardiner, S.K. Decreasing necrotizing enterocolitis and gastrointestinal bleeding in the neonatal intensive care unit: The role of donor human milk and exclusive human milk diets in infants ≤1500 g birth weight. Infant Child Adolesc. Nutr. 2014, 6, 86–93. [Google Scholar] [CrossRef]
- Hylander, M.A.; Strobino, D.M.; Dhanireddy, R. Human milk feedings and infection among very low birth weight infants. Pediatrics 1998, 102, E38. [Google Scholar] [CrossRef] [PubMed]
- Hylander, M.A.; Strobino, D.M.; Pezzullo, J.C.; Dhanireddy, R. Association of human milk feedings with a reduction in retinopathy of prematurity among very low birthweight infants. J. Perinatol. 2001, 21, 356–362. [Google Scholar] [CrossRef] [PubMed]
- Jacobi-Polishook, T.; Collins, C.T.; Sullivan, T.R.; Simmer, K.; Gillman, M.W.; Gibson, R.A.; Makrides, M.; Belfort, M.B. Human milk intake in preterm infants and neurodevelopment at 18 months corrected age. Pediatr. Res. 2016, 80, 486–492. [Google Scholar] [CrossRef] [PubMed]
- Maayan-Metzger, A.; Avivi, S.; Schushan-Eisen, I.; Kuint, J. Human milk versus formula feeding among preterm infants: Short-term outcomes. Am. J. Perinatol. 2012, 29, 121–126. [Google Scholar] [CrossRef] [PubMed]
- Madore, L.S.; Bora, S.; Erdei, C.; Jumani, T.; Dengos, A.R.; Sen, S. Effects of donor breastmilk feeding on growth and early neurodevelopmental outcomes in preterm infants: An observational study. Clin. Ther. 2017, 39, 1210–1220. [Google Scholar] [CrossRef] [PubMed]
- Vohr, B.R.; Poindexter, B.B.; Dusick, A.M.; McKinley, L.T.; Higgins, R.D.; Langer, J.C.; Poole, W.K. Persistent beneficial effects of breast milk ingested in the neonatal intensive care unit on outcomes of extremely low birth weight infants at 30 months of age. Pediatrics 2007, 120, e953–e959. [Google Scholar] [CrossRef] [PubMed]
- Manzoni, P.; Stolfi, I.; Pedicino, R.; Vagnarelli, F.; Mosca, F.; Pugni, L.; Bollani, L.; Pozzi, M.; Gomez, K.; Tzialla, C.; et al. Human milk feeding prevents retinopathy of prematurity (ROP) in preterm VLBW neonates. Early Hum. Dev. 2013, 89, S64–S68. [Google Scholar] [CrossRef]
- Montjaux-Regis, N.; Cristini, C.; Arnaud, C.; Glorieux, I.; Vanpee, M.; Casper, C. Improved growth of preterm infants receiving mother’s own raw milk compared with pasteurized donor milk. Acta Paediatr. 2011, 100, 1548–1554. [Google Scholar] [CrossRef] [PubMed]
- O’Connor, D.L.; Jacobs, J.; Hall, R.; Adamkin, D.; Auestad, N.; Castillo, M.; Connor, W.E.; Connor, S.L.; Fitzgerald, K.; Groh-Wargo, S.; et al. Growth and development of premature infants fed predominantly human milk, predominantly premature infant formula, or a combination of human milk and premature formula. J. Pediatr. Gastroenterol. Nutr. 2003, 37, 437–446. [Google Scholar] [CrossRef] [PubMed]
- Parker, L.A.; Krueger, C.; Sullivan, S.; Kelechi, T.; Mueller, M. Effect of breast milk on hospital costs and length of stay among very low-birth-weight infants in the NICU. Adv. Neonatal Care 2012, 12, 254–259. [Google Scholar] [CrossRef] [PubMed]
- Pinelli, J.; Saigal, S.; Atkinson, S.A. Effect of breastmilk consumption on neurodevelopmental outcomes at 6 and 12 months of age in VLBW infants. Adv. Neonatal Care 2003, 3, 76–87. [Google Scholar] [CrossRef] [PubMed]
- Schanler, R.J.; Shulman, R.J.; Lau, C. Feeding strategies for premature infants: Beneficial outcomes of feeding fortified human milk versus preterm formula. Pediatrics 1999, 103, 150–1157. [Google Scholar] [CrossRef]
- Sisk, P.M.; Lambeth, T.M.; Rojas, M.A.; Lightbourne, T.; Barahona, M.; Anthony, E.; Auringer, S.T. Necrotizing enterocolitis and growth in preterm infants fed predominantly maternal milk, pasteurized donor milk, or preterm formula: A retrospective study. Am. J. Perinatol. 2017, 34, 676–683. [Google Scholar] [PubMed]
- Sisk, P.M.; Lovelady, C.A.; Dillard, R.G.; Gruber, K.J.; O’Shea, T.M. Early human milk feeding is associated with a lower risk of necrotizing enterocolitis in very low birth weight infants. J. Perinatol. 2007, 27, 428–433. [Google Scholar] [CrossRef] [PubMed]
- Spiegler, J.; Preus, M.; Gebauer, C.; Bendiks, M.; Herting, E.; Gopel, W.; On Behalf of the German Neonatal Network. Does breastmilk influence the development of bronchopulmonary dysplasia? J. Pediatr. 2016, 169, 76–80.e4. [Google Scholar] [CrossRef] [PubMed]
- Were, F.N.; Bwibo, N.O. Two year neurological outcomes of very low birth weight infants. East Afr. Med. J. 2006, 83, 243–249. [Google Scholar] [CrossRef] [PubMed]
- Vohr, B.R.; Poindexter, B.B.; Dusick, A.M.; McKinley, L.T.; Wright, L.L.; Langer, J.C.; Poole, W.K. Beneficial effects of breast milk in the neonatal intensive care unit on the developmental outcome of extremely low birth weight infants at 18 months of age. Pediatrics 2006, 118, e115–e123. [Google Scholar] [CrossRef] [PubMed]
- Alshaikh, B.; Kostecky, L.; Blachly, N.; Yee, W. Effect of a quality improvement project to use exclusive mother’s own milk on rate of necrotizing enterocolitis in preterm infants. Breastfeed. Med. 2015, 10, 355–361. [Google Scholar] [CrossRef] [PubMed]
- Bishop, C.E.; Vasquez, M.M.; Petershack, J.A.; Blanco, C.L. Pasteurized donor human milk for VLBW infants: The effect on necrotizing enterocolitis and related factors. J. Neonatal-Perinat. Med. 2010, 3, 87–93. [Google Scholar]
- Hair, A.B.; Peluso, A.M.; Hawthorne, K.M.; Perez, J.; Smith, D.P.; Khan, J.Y.; O’Donnell, A.; Powers, R.J.; Lee, M.L.; Abrams, S.A. Beyond necrotizing enterocolitis prevention: Improving outcomes with an exclusive human milk-based diet. Breastfeed. Med. 2016, 11, 70–74. [Google Scholar] [CrossRef] [PubMed]
- Herrmann, K.; Carroll, K. An exclusively human milk diet reduces necrotizing enterocolitis. Breastfeed. Med. 2014, 9, 184–190. [Google Scholar] [CrossRef] [PubMed]
- Kreissl, A.; Sauerzapf, E.; Repa, A.; Binder, C.; Thanhaeuser, M.; Jilma, B.; Ristl, R.; Berger, A.; Haiden, N. Starting enteral nutrition with preterm single donor milk instead of formula affects time to full enteral feeding in very low birth weight infants. Acta Paediatr. 2017, 106, 1460–1467. [Google Scholar] [CrossRef] [PubMed]
- Bensouda, B.; Tarazi, S.E.; Ali, N.; Mandel, R.; Sant’Anna, G.M. Episodes of apnea, desaturation and bradycardia and the development of necrotizing enterocolitis in preterm infants: A case-control study. J. Matern.-Fetal Neonatal Med. 2013, 26, 52–55. [Google Scholar] [CrossRef] [PubMed]
- Fonseca, L.T.; Senna, D.C.; Silveira, R.C.; Procianoy, R.S. Association between breast milk and bronchopulmonary dysplasia: A single center observational study. Am. J. Perinatol. 2017, 34, 264–269. [Google Scholar] [CrossRef] [PubMed]
- Giuliani, F.; Prandi, G.; Coscia, A.; Cresi, F.; Di Nicola, P.; Raia, M.; Sabatino, G.; Occhi, L.; Bertino, E. Donor human milk versus mother’s own milk in preterm VLBWIs: A case control study. J. Biol. Regul. Homeost. Agents 2012, 26, 19–24. [Google Scholar] [PubMed]
- Henderson, G.; Craig, S.; Brocklehurst, P.; McGuire, W. Enteral feeding regimens and necrotising enterocolitis in preterm infants: A multicentre case-control study. Arch. Dis. Child. Fetal Neonatal Ed. 2009, 94, F120–F123. [Google Scholar] [CrossRef] [PubMed]
- Johnson, T.J.; Patel, A.L.; Bigger, H.R.; Engstrom, J.L.; Meier, P.P. Cost savings of human milk as a strategy to reduce the incidence of necrotizing enterocolitis in very low birth weight infants. Neonatology 2015, 107, 271–276. [Google Scholar] [CrossRef] [PubMed]
- Kimak, K.S.; De Castro Antunes, M.M.; Braga, T.D.; Brandt, K.G.; De Carvalho Lima, M. Influence of enteral nutrition on occurrences of necrotizing enterocolitis in very-low-birth-weight infants. J. Pediatr. Gastroenterol. Nutr. 2015, 61, 445–450. [Google Scholar] [CrossRef] [PubMed]
- Okamoto, T.; Shirai, M.; Kokubo, M.; Takahashi, S.; Kajino, M.; Takase, M.; Sakata, H.; Oki, J. Human milk reduces the risk of retinal detachment in extremely low-birthweight infants. Pediatr. Int. 2007, 49, 894–897. [Google Scholar] [CrossRef] [PubMed]
- Porcelli, P.J.; Weaver, R.G. The influence of early postnatal nutrition on retinopathy of prematurity in extremely low birth weight infants. Early Hum. Dev. 2010, 86, 391–396. [Google Scholar] [CrossRef] [PubMed]
- Patel, A.L.; Johnson, T.J.; Engstrom, J.L.; Fogg, L.F.; Jegier, B.J.; Bigger, H.R.; Meier, P.P. Impact of early human milk on sepsis and health-care costs in very low birth weight infants. J. Perinatol. 2013, 33, 514–519. [Google Scholar] [CrossRef] [PubMed]
- Patel, A.L.; Johnson, T.J.; Robin, B.; Bigger, H.R.; Buchanan, A.; Christian, E.; Nandhan, V.; Shroff, A.; Schoeny, M.; Engstrom, J.L.; et al. Influence of own mother’s milk on bronchopulmonary dysplasia and costs. Arch. Dis. Child. Fetal Neonatal Ed. 2017, 102, F256–F261. [Google Scholar] [CrossRef] [PubMed]
- The Committee for the Classification of Retinopathy of Prematurity. An international classification of retinopathy of prematurity. Arch. Ophthalmol. 1984, 102, 1130–1134. [Google Scholar]
- Cacho, N.T.; Parker, L.A.; Neu, J. Necrotizing enterocolitis and human milk feeding: A systematic review. Clin. Perinatol. 2017, 44, 49–67. [Google Scholar] [CrossRef] [PubMed]
- Lechner, B.E.; Vohr, B.R. Neurodevelopmental outcomes of preterm infants fed human milk: A systematic review. Clin. Perinatol. 2017, 44, 69–83. [Google Scholar] [CrossRef] [PubMed]
- De Silva, A.; Jones, P.W.; Spencer, S.A. Does human milk reduce infection rates in preterm infants? A systematic review. Arch. Dis. Child. Fetal Neonatal Ed. 2004, 89, F509–F513. [Google Scholar] [CrossRef] [PubMed]
- Villamor-Martinez, E.; Pierro, M.; Cavallaro, G.; Mosca, F.; Kramer, B.W.; Villamor, E. Donor human milk protects against bronchopulmonary dysplasia: A systematic review and meta-analysis. Nutrients 2018, 10, 238. [Google Scholar] [CrossRef] [PubMed]
- Zhou, J.; Shukla, V.V.; John, D.; Chen, C. Human milk feeding as a protective factor for retinopathy of prematurity: A meta-analysis. Pediatrics 2015, 136, e1576–e1586. [Google Scholar] [CrossRef] [PubMed]
- Corpeleijn, W.E.; Kouwenhoven, S.M.; Paap, M.C.; van Vliet, I.; Scheerder, I.; Muizer, Y.; Helder, O.K.; van Goudoever, J.B.; Vermeulen, M.J. Intake of own mother’s milk during the first days of life is associated with decreased morbidity and mortality in very low birth weight infants during the first 60 days of life. Neonatology 2012, 102, 276–281. [Google Scholar] [CrossRef] [PubMed]


| Study, Country | Design | Participants | Intervention, [Proportion of HM % Unless Stated Elsewhere] | Comparisons for This Review C1: EHM vs. EPTF C2: Any HM vs. EPTF C3: High vs. Low Dose HM C4: Unpasteurised vs. Pasteurised | Study Duration | Outcomes | Risk of Bias |
|---|---|---|---|---|---|---|---|
| BW, g; GA, Wk; n | |||||||
| RANDOMISED TRIALS | |||||||
| Corpeleijn (2016) [32] Netherlands | RT | 373 infants Gp1: 1065 (830, 1265); 28.3 ± 2.3; 183 Gp2: 1077 (854, 1275); 28.6 ± 2.2; 190 | Gp1: MOM + PDHM [100%] Gp2: MOM + PTF [median 84.5%] | C3: Gp1 vs. Gp2 | Intervention 1st 10 d of life Outcomes measured through hospital duration | NEC (≥Bell’s stage 2) Severe NEC (requiring surgery) Sepsis ((+)ve blood culture) BPD (need for O2 for ≥28 d) ROP (all stages) | Low |
| Cossey (2013) [33] Belgium | RT | 303 infants Gp1: 1291 ± 353; 30 (28, 31); 151 Gp2: 1,270 ± 406; 30 (28, 31); 152 | Gp1: Unpasteurised MOM [86% (61, 95) Gp2: Pasteurised MOM [88% (54, 95)] PTF used in both gps if MOM insufficient | C3: (sepsis only) per 10 mL/kg increase in MOM C4: Gp1 vs. Gp2 | SS: Birth SE: 8 wk of life or discharge | NEC (≥Bell’s stage 2) Severe NEC (requiring surgery) Sepsis ((+)ve blood culture + clinical signs for >48 h) BPD (O2 @ 36 wk) Severe ROP (requiring surgery) | Low |
| Cristofalo (2013) [34] USA and Austria | RT | 53 infants Gp1: 996 ± 152; 27.7 ± 1.5; 29 Gp2: 983 ± 207; 27.5 ± 2.4; 24 | Gp1: EHM (HMDF), [100%] Gp2: EPTF (BovF), [0%] | C1: Gp1 vs. Gp2 | SS: Start of enteral nutrition SE: Earliest of 91 d of age, DC, 50% of oral feeds | NEC (≥Bell’s stage 2) Severe NEC (requiring surgery) Sepsis ((+)ve blood culture + clinical signs for >5 d) ROP (not defined) | Low |
| O’Connor (2016) [35] Canada | RT | 363 infants Gp1: 995 ± 273; 27.5 ± 2.4; 181 Gp2: 996 ± 272; 27.8 ± 2.7; 182 | Gp1: EHM (MOM + DHM) [100%; MOM 58.4% (13.6, 96)] Gp2: Mixed feeding (MOM + PTF) [MOM 63.3% (9.6, 97.2)] | C3: Gp1 vs. Gp2 | SS: d of consent (within 96 h of birth) SE: after 90 d | NEC (≥Bell’s stage 2) Sepsis, ((+)ve blood or CSF culture) BPD (O2 @ 36 wk) Severe ROP (stage 4/5, laser/intraocular injection) Neurodevelopment (BSID) | Low |
| Schanler (2005) [36] USA | RT | 243 infants Gp1: 947 ± 233; 27 ± 2; 81 Gp2: 957 ± 267; 27 ± 2; 92 Gp3: 999 ± 259; 27 ± 2; 70 | Gp 1: PDM as supplement to HM (100%) Gp 2: PTF as supplement to HM [NR] Gp 3: EHM (reference, non-randomised) [100%] | C3: Gp1 vs. Gp2 (RT) and Gp3 vs. Gp2 (observational) C4: Gp3 vs. Gp1 (observational) | SS: Enrolment (4 d) SE: 90 d of age or DC | NEC (≥Bell’s stage 2) Sepsis ((+)ve blood culture + clinical signs for >5 d) BPD (O2 @ 36 wk) ROP (all stages) | Low |
| Sullivan (2010) [37] USA and Austria | RT | 207 infants Gp1: 945 ± 202; 27.2 ± 2.2; 67 Gp2: 909 ± 193; 27.1± ± 2.3; 71 Gp3: 922 ± 197; 27.3 ± 2.0; 69 | Gp 1: EHM + HMDF (fortified at 100 mL/kg) [100%; (MOM 73% (16, 82)] Gp 2: EHM + HMDF (fortified at 40 mL/kg) [100%; (MOM 70 (18, 80)] Gp 3: Mixed + BovF [82% (38, 100)] | C3: Gps1,2 vs. Gp3 | SS: Start of enteral nutrition SE: Earliest of 91 d of age, DC, 50% oral feedings | NEC, (clinical + radiographic evidence) and requiring surgery Sepsis (clinical signs) BPD (O2 @ 36 wk) ROP (not defined) | Low |
| OBSERVATIONAL STUDIES | |||||||
| Alshaikh (2015) [69] Canada | Interrupted time series | 443 infants Gp1: 1236 ± 390; 28.5 ± 2.3; 189 Gp2: 1186 ± 373; 28.5 ± 2.1; 254 | Gp1: Pre-quality improvement [NR] Gp2: Post- quality improvement [NR] Strategies designed to improve intake of MOM | C3: Gp2 vs. Gp1 | Not reported | NEC (≥Bell’s stage 2) Sepsis ((+)ve blood or CSF culture) BPD (O2 @ 36 wk) Severe ROP (not defined) | Low |
| Assad (2016) [21] USA | Interrupted time series | 293 infants BW: Range: 490 to 1700 GA: Gp 1: 27.7 ± 2.7; 87 Gp 2: 28.3 ± 2.8; 127 Gp 3: 27.6 ± 2.8; 49 Gp 4: 29.8 ± 2.5; 30 | Gp1: Human – EHM + HMDF [100 (MOM + DHM)] Gp 2: Bovine – EHM + BovF [100 (MOM + DHM)] Gp 3: Mixed—not further defined [NR] Gp 4: EPTF—not further defined [0%] | C1: Gp 1,2 vs. Gp 4 C2: Gp 1,2,3 vs. Gp 4 C3: Gp 1,2 vs. Gp 3 NEC: C3: Gp1 vs. Gp 2,3 | Not reported | NEC (≥Bell’s stage 2) (data only presented for C3) Sepsis (not defined) BPD (O2 @ 36 wk) ROP (not defined) | Low |
| Belfort (2016) [39] Australia | Cohort | 180 infants Whole cohort 947 ± 210; 27.3 ± 1.8 | No. of d infants received >50% enteral intake as HM until d 28 | C3: synthesised narratively | Intervention first 28 d of life Ax at 7 years | Neurodevelopment (BSID) | Moderate (recruitment unclear and some loss to FU) |
| Bensouda (2013) [74] Canada | Retrospective case-control study | 114 infants Cases: 1069 (845, 1320); 27.2 (26, 30); 38 Controls: 1058 (877, 1268); 27.8 (27, 30); 76 | Gp 1: Mixed (NEC), 38 Gp 2: Mixed (No NEC), 76 | C3: synthesised narratively | Not reported | NEC (≥Bell’s stage 2) | Low |
| Bishop (2010) [70] USA | Interrupted time series | 331 infants Gp1: 1056 ± 279; 28.5 ± 2.7; 179 Gp2: 1059 ± 289; 28.6 ± 2.9; 152 | Gp 1: Pre-PDM era [HM 51%, PTF ~49%] Gp 2: Post-PDM era [HM 75%, PTF ~25%] | C3: Gp 2 vs. Gp1 | Unclear, feeding data collected from birth to 34 wk CA | NEC (≥Bell’s stage 2) Severe NEC (requiring surgery) Sepsis ((+)ve blood or 2 CSF culture) BPD (O2 @ 36 wk) | Low |
| Blaymore-Bier (2002) [40] USA | Cohort | 39 infants Gp1: 1174 ± 305; 28.6 ± 2.9; 29 Gp2: 1198 ± 170; 29.9 ± 2.2; 10 | Gp1: Mixed feeding [878 (77, 1754) mL/wk of HM and 43 (0, 1051) mL/kg/wk of PTF] Gp2: EPTF [0%] | C2: Gp1 vs. Gp2 | Duration of hospitalisation | NEC (not defined) Sepsis (not defined) Neurodevelopment (BSID) | Moderate (convenience sample) |
| Chowning, (2016) [41] USA | Cohort | 550 infants Whole cohort: 1.05 ± 0.28 kg; 28.4 ± 2.6 n = Gp1: 260; Gp2, 290; Gp 3, 76; Gp4, 71 | Gp1: <50% d received HM Gp2: ≥50% d received HM Separate analysis done for extremes of intake: Gp3: 0% d received HM, Gp4: ≥50% d received HM | C2: Gp4 vs. Gp3 C3: Gp2 vs. Gp1 | Duration of hospitalisation | NEC (≥Bell’s stage 2) Severe NEC (requiring surgery) | Low |
| Colacci (2017) [42] USA | Cohort | 85 infants Gp1: 783 ± 143; 26 ± 1.9; 39 Gp2: 770 ± 137; 26 ± 1.9; 46 | Gp1: EHM + HMDF for first 4 wk of life [100%; MOM used for any feedings 92% of times] Gp2: Mixed feeding + BovF [83 (17, 100) % of feedings as formula] | C3: Gp1 vs. Gp2 | First 4 wk of life | NEC (≥Bell’s stage 2) Sepsis ((+)ve blood culture) BPD (O2 @ 36 wk) Severe ROP (requiring treatment) Neurodevelopment (BSID) | Low |
| Colaizy (2012) [43] USA | Cohort | 171 infants Whole cohort: 889 (724, 1064); 27 (25.4, 28.9) n = Gp1, 17; Gp2, 30, Gp3, 36, Gp4, 88 | Gp 1: <25% HM, Gp 2: 25–50% HM Gp 3: 50–75% HM Gp 4: >75% HM Combined MOM and PDM and PTF | C3: Gps 3,4 vs. Gps 1,2 | SS: Initiation of enteral feedings SE: discharge | NEC (≥Bell’s stage 2) Sepsis ((+)ve blood culture + clinical signs for >3 d) BPD (DC on O2) ROP (all stages) | Low |
| Dicky (2017) [44] France | Cohort | 63 NICUs, 926 infants Gp1: 1285 ± 348; 29.1 ± 1.9; 33 NICUs, 290 Gp2: 1267 ± 338; 29.1 ± 1.9; 30 NICUS, 636 | Gp1: NICUs who pasteurised MOM until 33 wk PMA, [NR] Gp2: NICUs who did not pasteurise MOM, [NR] Infant diet may also be supplemented with pasteurised donor milk or formula (un-measured) | C4: Gp 2 vs. Gp1 | Duration of hospital admission | NEC (Bell’s stge2/3) Sepsis ((+)ve blood culture + clinical signs for >3 d) BPD (O2 @ 36 wk ± need for O2 for ≥28 d) | Low |
| Feldman (2003) [46] Eidelman (2004) [45] Israel | Cohort | 86 infants Whole cohort: 1298 ± 335.6; 30.4 ± 3 n = Gp1, 34; Gp2, 21; Gp3, 31 | Gp 1: >75% HM (MOM) Gp 2: 25–75% HM (MOM) Gp 3: <25% HM (MOM) | C3: Gp1 vs. Gp3 | Duration of hospitalisation | Neurodevelopment (BSID) | Low |
| Fonseca (2017) [75] Brazil | Retrospective case-control study | 323 infants Gp1: 989 (495, 1795); 28.2 (22, 33); 94 Gp2: 1287 (750–950 *); 31 (25.4, 36.5); 229 | Gp1: With BPD, 94 Bp2: Without BPD, 229 | C3: synthesised narratively | SS: Birth SE: 42 d or discharge | BPD (need for O2 for ≥28 d) | Moderate (some differences between gps) |
| Furman (2003) [47], Furman (2004) [48] USA | Cohort | 119 infants Gp1: 1103 ± 260; 28 ± 2; 40 Gp2: 914 ± 205; 26 ± 2; 29 Gp3: 988 ± 248; 27 ± 2; 18 Gp4: 1163 ± 225; 28 ± 2; 32 | Gp 1: EPTF [0%] Gp 2: 1–24 mL/kg HM (MOM) Gp 3: 25–49 mL/kg HM (MOM) Gp 4: ≥50 mL/kg HM (MOM) | C2: Gps 2,3,4 vs. Gp 1 C3: Gp 4 vs. Gp 2 | SS: Initiation of oral HM SE: wk 4 of life | NEC (≥Bell’s stage 2) Sepsis ((+)ve blood culture + clinical signs for >5 d) BPD (O2 @ 36 wk) ROP (all stages) Neurodevelopment (BSID) | Moderate (some differences between gps) |
| Ginovart (2016) [49] Spain | Cohort | 186 infants Gp1: 1078 ± 289; 29.1 ± 2.9; 114 Gp2: 1108 ± 273; 29.6 ± 2.9; 72 | Gp1: EHM (MOM + PDHM) [100%] Gp2: Any PTF (mixed feeding) [NR] | C3: Gp1 vs. Gp2 | Duration of neonatal admission | NEC (not defined) and requiring surgery Sepsis (not defined) ROP (all stages) | Low |
| Giuliani (2012) [76] Italy | Prospective case-control study | 92 infants Gp1:984 ± 230; 28.3 ± 2.3; 46 Gp2:968 ± 236; 28.3 ± 2.3; 46 | Gp 1: >80% Unpasteurised MOM during first 20 d Gp 2: >80% PDM during first 20 d | C4: Gp1 vs. Gp2 | Not reported | NEC (≥Bell’s stage 2) Severe NEC (requiring surgery) BPD (O2 @ 36 wk ± need for O2 for ≥28 d) ROP (all stages) | Low |
| Hair (2016) [71] USA | Interrupted time series | 1587 infants Gp1: 844 ± 210; 26.5 ± 2.5, 819 Gp2: 823 ± 205; 26.4 ± 2.3, 768 | Gp1: EHM (MOM + DHM) + HMDF [100%] Gp2: MOM + BovF + PTF [NR] | C3: Gp1 vs. Gp2 | Varied: 60 d of age (2 sites) 34 wk PMA (2 sites) | NEC (not defined) Sepsis ((+)ve blood or CSF culture) BPD (O2 @ 36 wk) Severe ROP (Threshold ROP) | Moderate (some differences between gps) |
| Heller (2007) [50], Vohr (2006) [68], Vohr (2007) [57] USA | Cohort | 1035 infants Gp1: 775 ± 134; 26.0 ± 2; 976 Gp2: 783 ± 140; 26.2 ± 2; 353 Neurodevelopment n = Gp1, 80; Gp2, 94; Gp3, 110; Gp4, 120; Gp5, 135; Gp6, 134 | Gp 1: Any HM (MOM) [Median volume 30 mL/kg/d (6, 83) Gp 2: EPTF [0%] Also reported quintiles of intake for neurodevelopment Gp1: EPTF Gp2: <20th (23 mL/kg/d) Gp3: 20th–40th (≤53 mL/kg/d) Gp4: 40th to 60th (≤83 mL/kg/d) Gp5: 60th to 80th (≤112 mL/kg/d) Gp6: >80th (>112.5 mL/kg/d) | C2: Gp 1 vs. Gp 2 C2: Gps 2 to 6 vs. Gp1 C3: Gps 5,6 vs. Gps 2,3 Vohr 2007 synthesised narratively | Duration of neonatal admission with 18-month outcome follow up for neurodevelopment | NEC (not defined) Sepsis ((+)ve blood culture) BPD (O2 @ 36 wk) Severe ROP (requiring surgery) Neurodevelopment (BSID) | Low |
| Henderson (2009) [77] UK | Prospective case-control study | 106 infants Gp1: 1114 ± 427; 27.9 ± 3.1; 53 Gp2: 1179 ± 478; 28.0 ± 2.7; 53 | Gp1: NEC cases Gp2: Controls | C3: Synthesised narratively | Duration of neonatal admission | NEC (Bell’s all stages) | Low |
| Herrmann, (2014) [72] USA | Interrupted time series | 548 infants Gp1: 1334 ± 436; 29.7 ± 2.5; 386 Gp2: 1.361 ± 542; 29.6 ± 3.0; 162 | Gp1: Time 1: pre DHM and HMDF [NR] Gp2: Time 2: EHM incl HMDF [100%] | C3: Gp 2 vs. Gp1 | SS: birth SE 33 wk PMA | NEC (≥Bell’s stage 2) Sepsis ((+)ve blood culture) | Low |
| Huston (2014) [51] USA | Cohort | 361 infants Gp1: 919 ± 269; 26.7 ± 2.4; 44 Gp2: 1104 ± 262; 28.1 ± 2.2; 224 Gp3: 1177 ± 222; 29.1 ± 1.8; 93 | Gp1: EHM (MOM or DHM + HMDF [100%] Gp2: DHM (MOM + DHM + BovF [100%] Gp3: PTF (EPTF or MOM+ BovF + PTF) [NR] | C3: Gps1,2 vs. Gp3 | Not reported | NEC (≥Bell’s stage 2) Sepsis (not defined) ROP (not defined), Severe ROP (stage 3) | Moderate (some differences between gps) |
| Hylander (1998) [52], Hylander (2001) [53] USA | Cohort | 212 infants Gp1: 1061 ± 251; 28.2 ± 2.3; 123 Gp2: 988 ± 242; 27.8 ± 2.4; 89 ROP: n = Gp1, 18; Gp2, 47; Gp3, 31; Gp4, 27; Gp5, 74 | Gp 1: Any HM [NR] Gp 2: EPTF [0%] ROP reported as % HM Gp1: <20% Gp2: 20–79% Gp3: 80–99% Gp4: 100% Gp5: Formula | NEC, Sepsis, BPD C2: Gp1 vs. Gp2 ROP reported as C1: Gp 4 vs. Gp 5 C2: Gps 1,2,3,4 vs. Gp 5 C3: Gp 1 vs. Gp 3,4 | Duration of neonatal admission | NEC (≥Bell’s stage 2) Sepsis ((+)ve blood culture + clinical signs) BPD (not defined) ROP (all stages) | Moderate (some differences between gps) |
| Jacobi-Polishook (2016) [54] Australia | Cohort | 611 infants Median (range) Whole cohort 1350 (320, 262); 30 (25, 32) n = Gp1, 141; Gp2, 141; Gp3, 142; Gp4, 141; Gp5, 46 | Gp1: 1st quartile of HM intake Gp2: 2nd quartile Gp3: 3rd quartile Gp4: 4th quartile Gp5: EPTF | C2: Gps1,2,3,4 vs. Gp5 C3: Gps 3,4 vs. Gps 1,2 | Duration of neonatal admission | NEC (not defined) Sepsis (not defined) BPD (O2 @ 36 wk) ROP (all stages) Neurodevelopment (BSID) | Moderate (some differences between gps) |
| Johnson (2015) [78], Patel (2013) [82], Patel (2017) [83] USA | Prospective case-control study | n varies per study. Largest cohort = 291 infants Gp1:1050 ± 200; 27.2 ± 2.2; 29 Gp2:1065 ± 261; 28.2 ± 2.4; 262 | HM exposure measured Gp1: NEC cases Gp2: non-NEC | C3: Synthesised narratively | Exposure (HM intake) varied: Johnson: 1st 14 d Patel 2013: 1st 28 d Patel 2017: birth to 36 wk or discharge | NEC (≥Bell’s stage 2) Sepsis ((+)ve blood culture) BPD (O2 @ 36 wk) | Moderate (some differences between gps) |
| Kimak (2015) [79] Brazil | Prospective case-control study | 1028 infants Whole cohort: 1170 (900, 1340); 31 (29, 2) n = Gp1, 55; Gp2, 973 | Gp1: NEC cases, 55 Gp2: controls, 973 | C3: Synthesised narratively | SS: Birth SE: First of 30th d of life NEC or death | NEC (≥Bell’s stage 2) | Low |
| Kreissl (2017) [73] Austria | Interrupted time series | 300 infants Median (range) Gp1: 1008 (450, 1490); 196 (163, 223) d; 150 Gp2: 896 (380,1480); 191 (163, 219) d; 150 | Gp1: EHM (MOM + single PDHM [100%] Gp2: Mixed feeding (MOM + PTF) [NR] | C3: Gp1 vs. Gp2 | Exposure: From start until full enteral feeds. Outcomes measured throughout neonatal admission | NEC (≥Bell’s stage 2) Sepsis (not defined) BPD (not defined) Severe ROP (≥stage 3) | Moderate (some differences between gps) |
| Maayan-Metzger (2012) [55] Israel | Cohort | 360 infants Gp1: 1305 ± 388; 30.5 (28, 32); 188 Gp2: 1425 ± 399; 31 (29, 32); 172 | Gp 1: HM ≥5 of 8 meals Gp 2: PTF ≥5 of 8 meals | C3: Gp1 vs. Gp2 | SS: Birth SE: End of first month of life | NEC, (Clinical ± radiographic evidence) Sepsis ((+)ve blood culture + clinical signs for >3 d) BPD (need for O2 for ≥28 d) ROP (all stages) Severe ROP (stage 3) | Moderate (some differences between gps) |
| Madore (2017) [56] USA | Cohort | 81 infants Gp1: 936.6 ± 211; 27 ± 1.5; 29 Gp2: 890.5 ± 175.8; 27.1 ± 1.9; 27 Gp3: 913.8 ± 222.6; 27.3 ± 2.1; 25 | Gp1: only MOM over first m of life [100%] Gp2: >50% feeds as DHM over first m of life [100%] Gp3, >50% PTF over first m of life [>50% PTF] | C3: Gp1,2 vs. Gps3 | SS: birth SE: after 1st month of life | NEC (≥Bell’s stage 2) Sepsis ((+)ve blood culture) BPD (O2 @ 36 wk) Severe ROP (requiring surgery) Neurodevelopment (BSID) | Low |
| Manea (2016) [38] Romania | Non randomised trial | 34 infants Whole cohort: Range; 850 to 1000; 25 to 33 n = Gp1, 18, gp2, 16 | Gp1: EHM [100%] Gp2: EPTF [0%] | C1: Gp1 vs. Gp2 | Not reported | NEC (clinical signs) Sepsis (clinical signs) | High (group characteristics and participant flow not described) |
| Manzoni (2013) [58] Italy | Cohort | 498 infants Gp1:1125 ± 247; 29.4 ± 2.5; 314 Gp2: 1100 ± 272; 29.2 ± 2.8; 184 | Gp 1: EHM (MOM) [100%] Gp 2: EPTF [0%] | C1: Gp 1 vs. Gp | SS: Enrolment at <72 h of life SE: discharge or death | NEC (≥Bell’s stage 2) LOS ((+)ve blood culture + clinical signs) ROP (all stages) Severe ROP (threshold ROP) | Low |
| Montjaux-Régis (2011) [59] France | Cohort | 48 infants Whole cohort: 1105 ± 282; 28.6 ± 1.5 n = Gp1, 20; Gp2, 11; Gp3, 17 | Gp 1: <20% MOM Gp 2: ≥20% to <80% MOM Gp 3: ≥80% MOM | C4: Gp3 vs. Gp1 | SS: Full enteral feeding with HM SE: weight 1400 g ± 32 wk GA | NEC (≥Bell’s stage 2) Sepsis (nosocomial infection) BPD (O2 @ 36 wk) | Low |
| O’Connor (2003) [60] UK and USA | Cohort | 463 infants Gp1: 1275 ± 312; 29.7 ± 2.0; 43 Gp2: 1287 ± 279; 29.6 ± 1.9; 98 Gp3: 1288 ± 287; 29.5 ± 2.1; 203 Gp4: 1332 ± 279; 29.9 ± 2.0; 119 | Gp 1: >80% HM at term CA + <100 mL/kg BW of PTF for duration of stay Gp 2: ≥50% energy from HM Gp 3: <50% energy from HM Gp 4: >80% PTF at term corrected age + <100 mL/kg BW of HM for duration of stay | C3: Gps 1,2 vs. Gps 3, 4 | SS: Initiation of enteral feeding SE: Term CA (HM feeding exposure) or hospital discharge (NEC outcome) | NEC (not defined) Sepsis (not defined) BPD (O2 @ 36 wk) Neurodevelopment (BSID) | Moderate (some differences between gps) |
| Okamoto (2007) [80] Japan | Retrospective case-control study | 14 infants. Median (range) Gp1:660 (504-812); 24 (23-26); 7 Gp2: 736 (660-804); 24 (24-25); 7 | Gp 1: Mixed (Retinal detachment) Gp 2: Mixed (Non-retinal detachment) | C3: synthesised narratively | Not reported | Severe ROP (retinal detachment) | Low |
| Parker (2012) [61] USA | Cohort | 80 infants Whole cohort: 1044 ± 246.5; 27.8 ± 2.1 n = Gp1, 40; Gp2, 40 | Gp 1: Minimum 50% feed volume HM [≥50%] Gp 2: EPTF [0%] | C2: Gp 1 vs. Gp 2 | Duration of neonatal admission | NEC (clinical ± radiographic evidence) Sepsis ((+)ve blood culture) | Low |
| Pinelli (2003) [62] Canada | Cohort | 148 infants, 137 at 12m Ax Gp1: 1130 ± 244; 29 ± 3; 67 Gp2: 1090 ± 273; 29 ± 3; 70 | Gp 1: >80% HM (MOM) Gp 2: <80% HM (MOM) or no HM | C3: Gp1 vs. Gp2 | SS: during neonatal admission | Neurodevelopment (BSID) | Moderate (some loss to FU) |
| Porcelli (2010) [81] USA | Retrospective case-control study | 77 infants Gp1: 873 ± 85; 26.4 ± 1.3; 66 Gp2: 842 ± 78; 25.9 ± 0.9; 11 | Gp 1: Mixed (No ROP surgery) Gp 2: Mixed (ROP Surgery) | C3: synthesised narratively | Duration of neonatal admission | ROP (any grade) Severe ROP (requiring surgery) | Low |
| Schanler (1999) [63] USA | Cohort | 108 infants Gp1: 1069 ± 169; 27.9 ± 1.2; 62 Gp2: 1044 ± 185; 27.9 ± 1.1; 46 | Gp 1: Minimum 50 mL/kg/d of any HM [96 ±23 mL/kg/d] Gp 2: EPTF (0) | C2: Gp 1 vs. Gp2 | Duration of neonatal admission | NEC (clinical ± radiographic evidence) Severe NEC (requiring surgery) Sepsis ((+)ve blood culture + clinical signs for >5 d) | Low |
| Schanler (2005) [36] USA | RT with 1 non-randomised arm | 243 infants Gp1: 947 ± 233; 27 ± 2; 81 Gp2: 957 ± 267; 27 ± 2; 92 Gp3: 999 ± 259; 27 ± 2; 70 | Gp 1: PDM as supplement to HM [100%] Gp 2: PTF as supplement to HM [NR] Gp 3: EHM (reference, non-randomised) [100%] | C3: Gp1 vs. Gp2 (RT) and Gp3 vs. Gp2 (observational) C4: Gp3 vs. Gp1 (observational) | SS: Enrolment (4 d) SE: 90 d of age or DC | NEC (≥Bell’s stage 2) Sepsis ((+)ve blood culture + clinical signs for >5 d) BPD (O2 @ 36 wk) ROP (all stages) | Low |
| Sisk (2007) [65] USA | Cohort | 202 infants Gp1: 1112.8 ± 17.8; 28.1 ± 0.2; 156 Gp2: 1184.2 ± 30.2; 29.2 ± 0.3; 46 | Gp 1: ≥50% HM (MOM) [89% at 4 wk] Gp 2: <50% HM (MOM) [10.7% at 4 wk] | C3: Gp1 vs. Gp2 | SS: <72 h of birth SE: 14 d from study start | NEC (clinical ± radiographic evidence) Sepsis ((+)ve blood culture) BPD (not defined) ROP (all stages); Severe ROP (requiring laser surgery) | Moderate (some differences between gps) |
| Sisk (2017) [64] USA | Cohort | 563 infants Whole cohort: 1021 ± 285; 27.9 ± 2.4 n = Gp1, 299; Gp2, 139; Gp3, 113 | Gp1: ≥50% MOM [97 (82, 100) MOM] Gp2: ≥50% PDHM [86% (74, 96) DHM] Gp3: ≥50% PTF [9% (0, 26) MOM] | C3: Gps1,2 vs. Gp3 C4: Gp1 vs. Gp2 | SS: Birth SE 34 wk PMA | NEC (≥Bell’s stage 2) Severe NEC (requiring surgery) Sepsis ((+)ve blood culture) BPD (O2 @ 36 wk) Severe ROP (Grade 3 or 4) | Low |
| Spiegler (2016) [66] Germany | Cohort | 1433 infants Gp1: 1080 (830, 1330); 28.7 (26.6, 30.1); 239 Gp2: 1100 (865, 1340); 29.0 (26.9,3 0.0); 223 Gp3: 1050 (805, 1295); 28.4 (26.6, 30.0); 971 | Gp1: EPTF [0%] Gp2: EHM (MOM) [100%] Gp3: Mixed feeding [NR] | C1 Gp2 vs. Gp1: C2: Gps2,3 vs. Gp1 C3: Gp2 vs. Gp3 | Duration of neonatal admission | NEC (Bell’s stage 2/3) Severe NEC (requiring surgery) BPD (O2 @ 36 wk) ROP (all stages); Severe ROP (Stage3/4) | Low |
| Stock (2015) [20] Austria | Interrupted time series | 323 infants Gp1:1226.8 ± 382; 29.5 (27.7, 30.7); 159 Gp2: 1271.3 ± 412; 30 (28.2, 31.2); 164 | Gp 1: Pasteurisation era (2008–2010) [NR] Gp 2: Unpasteurised era (2010–2013) NR] | C4: Gp2 vs. Gp1 | Duration of neonatal admission. | NEC (Bell’s criteria) Sepsis (clinical signs | Low |
| Tanaka (2009) [22] Japan | Cohort | 18 infants Gp1: 1016.4 ± 302.2; 28.7 ± 3.2; 10 Gp2: 1188.0 ± 296.3; 30.7 ± 1.6; 8 | Gp 1: >80% HM in first month Gp 2: <80% HM in first month | C3: Gp 1 vs. Gp2 | Group allocation based on feeds within first month of life with outcome follow-up at 5 years | NEC (not defined) BPD (not defined) ROP (not defined) Neurodevelopment (Kaufman Assessment Battery for Children, + others) | High (unclear recruitment, some loss to FU) |
| Verd (2015) [23] Spain | Cohort | 201 infants Gp1: 800 (410, 995); 26.4 (23, 33.7); 148 Gp2: 830 (440, 998); 27.1 (23.7, 34.1); 53 | Gp 1: EHM (MOM + DM) [100%] Gp 2: Mixed (MOM + PTF) [NR] | C3: Gp 1 vs. Gp 2 | Duration of neonatal admission | NEC (not defined) Severe NEC (requiring surgery) Sepsis ((+)ve blood culture) ROP (any stage) Severe ROP (requiring surgery) | Low |
| Were (2006) [67] Africa | Cohort | 120 infants Whole cohort: 1420 ± 93; 32.5 ± 2.4 n = Gp1, 54, Gp2, 27, Gp3, 39 | Gp1: EHM [100%] Gp2: EPTF [0%] Gp3: Mixed feeds [NR] | C3: Synthesised narratively | Duration of neonatal admission | Neurodevelopment (Dorothy Egan’s Model, Saigal and Rosenbaum’s method) | High (unclear recruitment, some loss to FU) |
| Comparison | EHM vs. EPTF RR or MD (95% CI); N Participants (Studies), I2 GRADE Certainty of Evidence Interpretation and Absolute effect (95% CI) | Any HM vs. EPTF RR or MD (95% CI); N Participants (Studies), I2 GRADE Certainty of Evidence Interpretation and Absolute Effect (95% CI) | High vs. Low Dose HM RR or MD (95% CI); N Participants (Studies), I2 GRADE Certainty of Evidence Interpretation and Absolute Effect (95% CI) | Unpasteurised vs. Pasteurised RR or MD (95% CI); N Participants (Studies), I2 GRADE Certainty of Evidence Interpretation and Absolute Effect (95% CI) | |
|---|---|---|---|---|---|
| Outcome | |||||
| NEC | RTs RR 0.17 (0.02, 1.32); 53, (1 RT) Certainty: Low Obs RR 0.22 (0.09, 0.54), 933, (3 studies), I2 = 0% Certainty: Moderate Interpretation Possible reduction in any NEC Absolute risk reduction of 4.3% (from 2.5 to 5 fewer/100) | Obs RR 0.51 (0.35, 0.76); 3783, (9 studies), I2 = 7% Certainty: Moderate Interpretation Clear reduction in any NEC Absolute reduction of 3.6% (from 1.8 to 4.8 fewer/100) | RTs RR 0.59 (0.39, 0.89) fixed effects; 1116, (4 RTs), I2 = 50% Certainty: Moderate Obs RR: 0.53 (0.42, 0.67); 8778 (22 studies), I2 = 28% Certainty: Moderate Interpretation Clear reduction in any NEC Absolute risk reduction between 3.8 and 4.3 % (from 0.2 more to 6.8 fewer/100) | RT RR 1.45 (0.64, 3.30); 303 (1 RT) Certainty: Low Obs RR 1.28 (0.68, 2.43), 1894 (6 studies), I2 = 30% Certainty: Very low Interpretation Inconclusive | |
| NEC requiring surgery | RT RR 0.09 (0.01, 1.64); 53, (1 RT) Certainty: Low Obs RR 0.22 (0.03, 1.86), 444, (1 study) Certainty: Very low Interpretation Inconclusive | Obs RR 0.30 (0.05, 1.76); 1420, (3 studies), I2 = 50% Certainty: Very low Interpretation Inconclusive | RTs RR 0.36 (0.06, 2.04) 580, (2 RTs), I2 = 66% Certainty: Low Obs RR: 0.51 (0.33, 0.79); 2964 (6 studies), I2 = 0% Certainty: Moderate Interpretation Possible reduction in severe NEC Absolute reduction (obs studies) 1.8% (from 0.8 to 2.4 fewer/100) | RT RR 0.11 (0.01, 2.06); 303 (1 RT) Certainty: Low Obs RR 1.59 (0.14, 17.85), 530 (2 studies), I2 = 42% Certainty: Very low Interpretation Inconclusive | |
| LOS | RTs RR 0.7 (0.47, 1.03); 53 (1 RT) Certainty: Low Obs RR 0.71 (0.49, 1.05); 776 (3 studies), I2= 0% Certainty: Low Interpretation Possible reduction in LOS 1 Absolute reduction from RT of 23.8% (from 42 fewer to 2.4 more cases/100) and from observational studies 5% (from 0.9 more to 8.9 fewer cases/100) | Obs RR 0.95 (0.67, 1.34); 2497 (8 studies), I2 = 59% Certainty: Very low Interpretation Inconclusive | RTs RR 1.07 (0.89, 1.28); 1186 (4 RTs), I2 = 0% Certainty: Moderate Obs RR 0.71 (0.56, 0.9); 6521 (18 studies), I2 = 74% Certainty: Very low Interpretation Inconclusive | RT RR 0.71 (0.43, 1.18); 303 (1 RT) Certainty: Moderate Obs RR 1.05 (0.86, 1.27); 1875 (5 studies), I2 = 14% Certainty: Very low Interpretation Possibly no effect | |
| BPD | Obs RR 0.94 (0.26, 3.41); 706 (2 studies), I2 = 79% Certainty: Very low Interpretation Inconclusive | Obs RR 1.02 (0.83, 1.27); 3703 (6 studies), I2 = 54% Certainty: Very low Interpretation Inconclusive | RTs RR 0.95 (0.73, 1.25); 1075 (4 RTs), I2 = 42% Certainty: Low Obs RR 0.84 (0.73, 0.96); 7023 (18 studies), I2 = 53% Certainty: Very low Interpretation Inconclusive | RTs RR 0.69 (0.43, 1.1); 303 (1 RT) Certainty: Low Obs RR 1.01 (0.72, 1.43) 1644 (5 studies), I2 = 39% Certainty: Very low Interpretation Inconclusive | |
| ROP | RT RR 1.32 (0.5, 3.52); 53 (1 RT) Certainty: Low Obs RR 0.65 (0.31, 1.34); 1256 (4 studies), I2 = 84% Certainty: Very low Interpretation Insufficient evidence to draw conclusion | Obs RR 1.08 (0.79, 1.48); 3576 (6 studies), I2 = 75% Certainty: Very low Interpretation Inconclusive | RTs RR 1.14 (0.86, 1.5); 1071 (4 RTs), I2=0% Certainty: Moderate Obs RR 0.82 (0.70, 0.96); 6302 (18 studies), I2 = 43% Certainty: Very low Interpretation Inconclusive | RT RR 0.89 (0.35, 2.26); 303 (1RT) Certainty: Low Obs RR 0.89 (0.33, 2.38); 681 (3 studies), I2 = 73% Certainty: Very low Interpretation Inconclusive | |
| Severe ROP1 | Obs RR 0.23 (0.07, 0.73); 1012 (3 studies), I2 = 57% Certainty: Low Interpretation Possible reduction Absolute reduction of 7.6% (from 2.7to 9.1 fewer/100) | Obs RR 0.81 (0.42, 1.56); 2553 (3 studies), I2 = 74% Certainty: Very low Interpretation Inconclusive | RTs RR 1.15 (0.66, 2.02); 536 (2 RTs), I2 = 0% Certainty: Low Obs RR 0.63 (0.46, 0.87); 5224 (13 studies), I2 = 22% Certainty: Low Interpretation Inconclusive | RT RR 0.89 (0.35, 2.26); 303 (1RT) Certainty: Low Obs RR 0.81 (0.13, 5.08); 589 (2 studies), I2 = 86% Certainty: Very low Interpretation Inconclusive | |
| Neurodevelopment | No studies identified | 0 to <18 months Cognition Obs MD 9 higher (1.42 fewer to 16.58 higher); 39 (1 study) Certainty: Very low 18 to <36 months Cognition Obs MD 2.01 higher (1.35 lower to 5.36 higher); 1744 (3 studies) I2 = 49% Certainty: Very low Motor Obs MD 0.8 lower (6.02 lower, 4.42 higher); 1744 (3 studies) I2 = 77% Certainty: Very low Interpretation Inconclusive | 0 to <18 months Cognition Obs MD 0.67 higher (2.68 lower to 4.03 higher); 684 (5 studies) I2 = 58% Certainty: Very low Motor Obs MD 0.33 lower (4.8 lower to 4.14 higher) 684 (5 studies) I2 = 69% Certainty: Very low 18 to <36 months Cognition RT MD 1.6 lower (5.95 lower to 2.75 higher); 299 (1 RT) Certainty: Moderate Cognition Obs MD 0.59 lower (3.41 lower to 2.24 higher); 722 (4 studies) I2 = 9% Certainty: Very low Motor RT MD 2.2 lower (6.42 lower to 2.02 higher); 299 (1 RT) Certainty: Moderate Motor Obs MD 1.94 lower (4.78 lower to 0.9 higher); 722 (4 studies) I2 = 9% Certainty: Very low >3 years Cognition Obs MD 6.4 higher (5.8 lower to 18.6 higher); 18 (1 study) Certainty: Very low Interpretation Inconclusive | No studies identified | |
© 2018 by the authors. Licensee MDPI, Basel, Switzerland. This article is an open access article distributed under the terms and conditions of the Creative Commons Attribution (CC BY) license (http://creativecommons.org/licenses/by/4.0/).
Share and Cite
Miller, J.; Tonkin, E.; Damarell, R.A.; McPhee, A.J.; Suganuma, M.; Suganuma, H.; Middleton, P.F.; Makrides, M.; Collins, C.T. A Systematic Review and Meta-Analysis of Human Milk Feeding and Morbidity in Very Low Birth Weight Infants. Nutrients 2018, 10, 707. https://doi.org/10.3390/nu10060707
Miller J, Tonkin E, Damarell RA, McPhee AJ, Suganuma M, Suganuma H, Middleton PF, Makrides M, Collins CT. A Systematic Review and Meta-Analysis of Human Milk Feeding and Morbidity in Very Low Birth Weight Infants. Nutrients. 2018; 10(6):707. https://doi.org/10.3390/nu10060707
Chicago/Turabian StyleMiller, Jacqueline, Emma Tonkin, Raechel A. Damarell, Andrew J. McPhee, Machiko Suganuma, Hiroki Suganuma, Philippa F. Middleton, Maria Makrides, and Carmel T. Collins. 2018. "A Systematic Review and Meta-Analysis of Human Milk Feeding and Morbidity in Very Low Birth Weight Infants" Nutrients 10, no. 6: 707. https://doi.org/10.3390/nu10060707