1. Introduction
Aspergillus flavus is not only a saprophytic fungus, but an opportunistic pathogen which invades susceptible hosts such as maize, cottonseed, tree nuts, and peanuts [
1]. Aflatoxin contamination caused by
A. flavus is a major concern in maize production prior to harvest and through storage [
2,
3,
4]. Aflatoxins are secondary metabolites of this fungus which can be highly toxigenic and carcinogenic to humans or animals consuming contaminated food or feeds [
5,
6,
7]. Significant research has been devoted to developing ways of controlling aflatoxin contamination of crops. Understanding the molecular mechanisms involved in the interaction between
A. flavus and maize kernels would aid the development of strategies to interrupt the aflatoxin contamination process.
The morphological process and the molecular mechanisms of
A. flavus involved in maize kernel invasion have been widely observed and discussed [
8]. Numerous fungal genes have been shown to be involved in the invasion process and in aflatoxins biosynthesis [
9,
10]. However, identifying genetic resistance mechanisms in maize kernels of aflatoxin-resistant lines, and under varied environmental conditions, can be very challenging. To control the environmental effects, better ascertain kernel genetic differences between genotypes and assist field screening in maize breeding, the laboratory-based Kernel Screening Assay (KSA) was developed [
11,
12]. The KSA uses mature kernels inoculated with
A. flavus to quantify aflatoxin accumulation, therefore, highlighting the phase of kernel development in the field where aflatoxin increases. This technique speeds-up aflatoxin assessment and eliminates escapes. The KSA correlates well with field trial results [
12,
13,
14], and is a primary technique used to screen germplasm in a collaborative project for breeding aflatoxin-resistant maize lines between the International Institute of Tropical Agriculture (IITA) and the Southern Regional Research Center (SRRC) of the USDA-ARS [
15]. Six aflatoxin-resistant inbred lines were released to the public through this collaboration [
14].
Over the past twenty years, a number of resistant maize lines with low aflatoxin accumulation levels have been identified or developed [
14,
15,
16,
17,
18]. While maize hybrids with improved resistance to
A. flavus infection and aflatoxin biosynthesis may be in commercial use, the levels of resistance are not yet adequate to prevent unacceptable aflatoxin concentrations (FDA has limits of 20 ppb, total aflatoxins on interstate commerce of food and feed, and 0.5 ppb of aflatoxin M
1 on the sale of milk) [
17]. To make use of maize germplasm with greater resistance that are available now or in the future, efficient biomarkers are needed [
17].
Plants have defenses against most phytopathogens through recognition and the triggering of a wide range of defense responses, including the reprogramming of cellular metabolism, the accumulation of barrier-forming substances, and the production of antimicrobial compounds, which act directly to prevent pathogen invasion [
19,
20]. Despite impressive advances in knowledge concerning defense mechanisms in vegetative plants [
19,
21,
22], little is known about molecular mechanisms of plant seeds for defending against fungal infection. This is especially the case regarding infection by facultative pathogen,
A. flavus.Previous studies indicate that both constitutive and induced resistance are involved in maize kernel defense against
A. flavus infection [
16,
23]. Comparative proteomics has identified numerous constitutive resistance-associated proteins (RAPs) in mature kernels [
24,
25], presuming their resistant function in aflatoxin contamination. Meng
et al. [
26] analyzed the gene expression profile of aflatoxin-resistant inbred Tex6 during kernel development using microarray analysis and found that RAP genes were significantly expressed at the late developmental stage. In that study, kernels in developing ears were used to observe induced resistance in response to
A. flavus infection introduced by a non-wound inoculation method. However, consistent gene profiles were unable to be acquired due to variation between experimental replicates caused by factors such as the kernel developmental stage, the environment, and/or
A. flavus inoculation methods. The purpose of the present study is to determine gene expression differences between aflatoxin-resistant and -susceptible maize lines in response to
A. flavus’ challenge. This may highlight the presence of inducible resistance factors to complement constitutive factors previously identified through comparative proteomics. Employing gene expression analysis can also overcome the limitations of protein analysis such as the expensive costs involved in identifying a complete proteome and the lack of visibility of some lowly-expressed protein spots, which potentially limits the detection of important proteins. To minimize the effect of different genetic backgrounds on gene expression, two closely-related inbred lines, Eyl25 and Eyl31, were used; these were derived from a cross between two resistant lines, 1368 and GT-MAS:gk, in the SRRC-IITA collaborative project [
14,
15]. Of the two lines, Eyl25 is aflatoxin-resistant (R), and Eyl31 is susceptible (S). To eliminate the effects caused by using developing kernels in field trials, imbibed mature kernels (under KSA conditions) were used in this research. The KSA protocol involves inoculating kernels with
A. flavus and incubating them at 31 °C and 100% humidity. This method attempts to create an “ideal” environment for maize kernel infection and subsequent aflatoxin production. To acquire gene expression profiles, oligonucleotide microarrays developed by the Maize Oligonucleotide Array Project [
27] were used.
3. Results
3.1. Aflatoxin Accumulation in Inoculated Kernels
Aflatoxin levels in inoculated kernels of aflatoxin-resistant maize line Eyl25 (R) and of-susceptible line Eyl31 (S) are shown in
Table 1. Eyl25 demonstrated the same level of aflatoxin accumulation as the resistant check, while Eyl31 accumulated levels that exceeded both Eyl25 and the susceptible check.
Table 1.
Pedigrees of Eyl25(R) and Eyl31(S) and aflatoxin accumulation in kernels.
Table 1.
Pedigrees of Eyl25(R) and Eyl31(S) and aflatoxin accumulation in kernels.
| Genotype | Pedigree | Aflatoxin* (ppb) |
|---|
| Eyl25 | (1368xGT-MAS:GK)-8-1-1-4-B-B-B-B-B | 315.1 c |
| Eyl31 | (1368xGT-MAS:GK)-8-1-1-3-B-B-B-B-B | 14112.5 a |
| MI82 (Resistance reference) | - | 209 c |
| P3142 (Susceptible reference) | - | 3298 b |
3.2. Fungal Colonization of Inoculated Kernels
After 72 h incubation of A. flavus inoculated kernels under KSA conditions, A. flavus colonization on kernel surfaces was observed, and the colonization level, characterized. Results indicated that all S kernels were colonized by A. flavus, and that the colonization levels of 53.3% of the inoculated kernels were rated >3 (60% surface colonized). However, 36.6% of the R inoculated kernels had visible fungal colonization, but none were rated >2 (40% surface colonized).
3.4. Differentially Expressed Genes in the Comparison between R and S Controls
To identify differences between R and S controls, gene expression profiles of the two were compared. The criteria for significant difference were set as
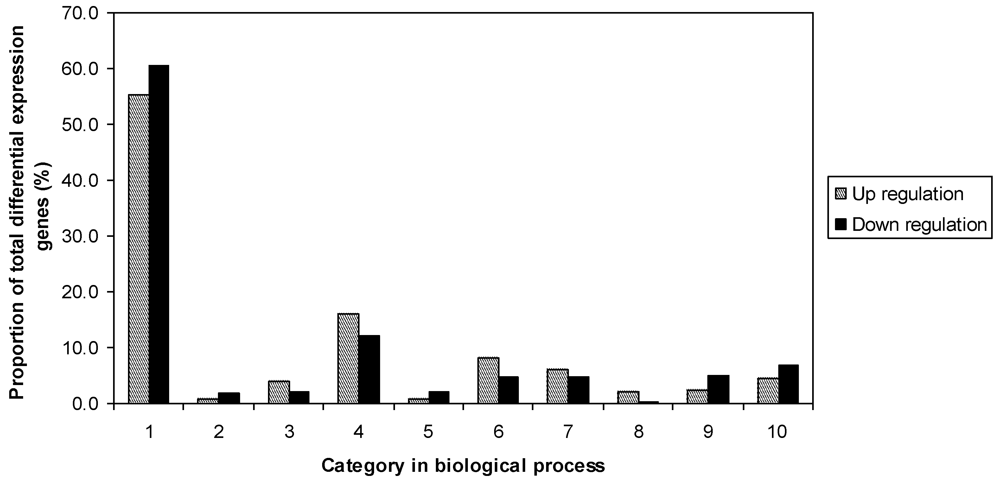
P value <0.05, and fold change >2. Of the total 8075 non-redundant expressed genes in the R and S controls, there were 530 genes that were significantly different between R and S, including 248 up-regulated, and 282 down-regulated. The fold changes of differentially expressed genes were between 2 and 45.9. Results indicated that genes were distributed in all listed functional categories of biological processes (
Figure 1). The largest proportion of genes were in the unknown category, including 55.2% of up-regulated and 60.6% of down-regulated genes. R had more genes involved in metabolism, protein fate, response to stress, and signal transduction. However, S had more genes involved in transcription and transport.
Figure 1.
Functional categories of differentially expressed genes in the comparison of noninoculated Eyl25(R) with noninoculated Eyl31(S). 1 biological process unknown; 2 catabolism; 3 cell fate and development; 4 metabolism; 5 protein bio-synthesis; 6 protein fate; 7 response to stress; 8 signal transduction; 9 transcription; 10 transport.
Defense-related genes with a significant difference between the R and S controls were also revealed. Of the six listed categories (
Table S2), abiotic stress-related genes and pathogenesis-related genes comprised the majority, but their proportions and components were different in the two genotypes. There were more abiotic stress-related genes up-regulated in S than in R, but more than 50% of the genes belonged to HSP family. The HSP34 (MZ00035042) and HSP17.2 (MZ00031854) were the top two in fold-change ranking, which were 32.9 and 21.9 folds higher respectively in S than R. However, there were more PR genes in R than in S, with several members belonging to the chitinase family; no chitinase member was down-regulated in R. The PR gene with the greatest significant difference between the two genotypes was PR-4 (MZ00043659), which was 36.3 fold higher in R than in S. Of the antioxidant genes, all 5 up-regulated genes in S belonged to the glutathione S-transferase (GST) family. However, in R, catalase 3 (MZ00042638) was also up-regulated along with GST family member, GST 41 (MZ00026611). Based on GO search, several annotation unknown genes were classified as disease resistant, and were up-regulated either in R or in S. An example is gene MZ00019113, which was up-regulated by 14.5 fold in R. For the hormone related genes and secondary metabolism genes, fewer differentially expressed genes were observed in either genotype.
3.5. Gene Expression in Kernels in Response to A. flavus’ Challenge
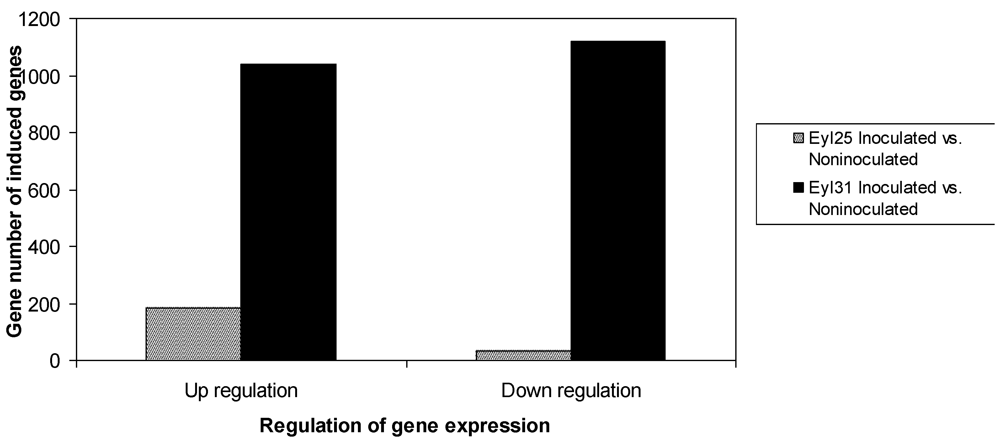
The differentially expressed transcriptional profiles in the two genotypes were analyzed separately using microarrays. Results indicated that 214 genes in R and 2159 genes in S were induced compared to controls (
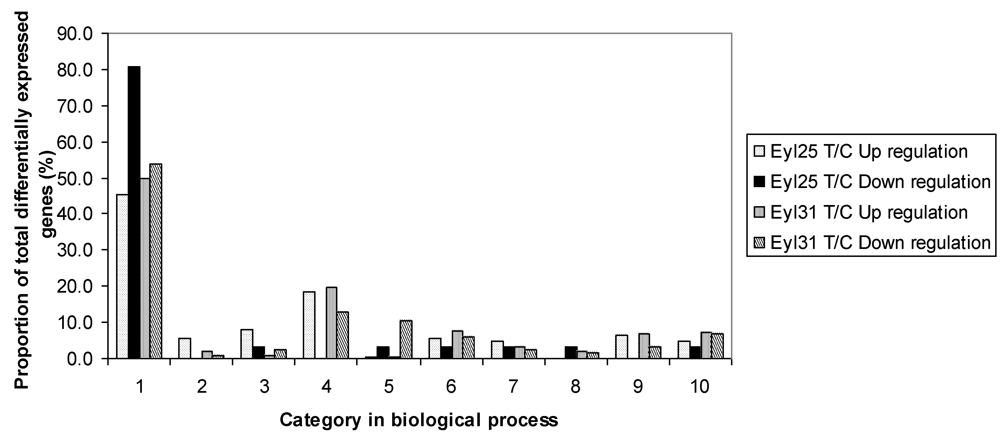
Figure 2). Although R had fewer differentially expressed genes, it contained a higher proportion of up-regulated genes. Based on GO search of biological processes, the comparison of differentially expressed genes between R and S was conducted (
Figure 3). Results showed that they were distributed in all listed categories; biological process unknown had the majority, followed by metabolism.
Figure 2.
Survey of differentially expressed genes in A. flavus inoculated Eyl25(R) and Eyl31(S) kernels after 72 h incubation.
Figure 2.
Survey of differentially expressed genes in A. flavus inoculated Eyl25(R) and Eyl31(S) kernels after 72 h incubation.
Figure 3.
Proportion of differentially expressed genes among functional categories in the comparison among A. flavus challenged Eyl25(R), Eyl31(S), and noninoculated controls. 1 biological process unknown; 2 catabolism; 3 cell fate and development; 4 metabolism; 5 protein biosynthesis; 6 protein fate; 7 response to stress; 8 signal trans-duction; 9 transcription; 10 transport. T = inoculated; C = noninoculated.
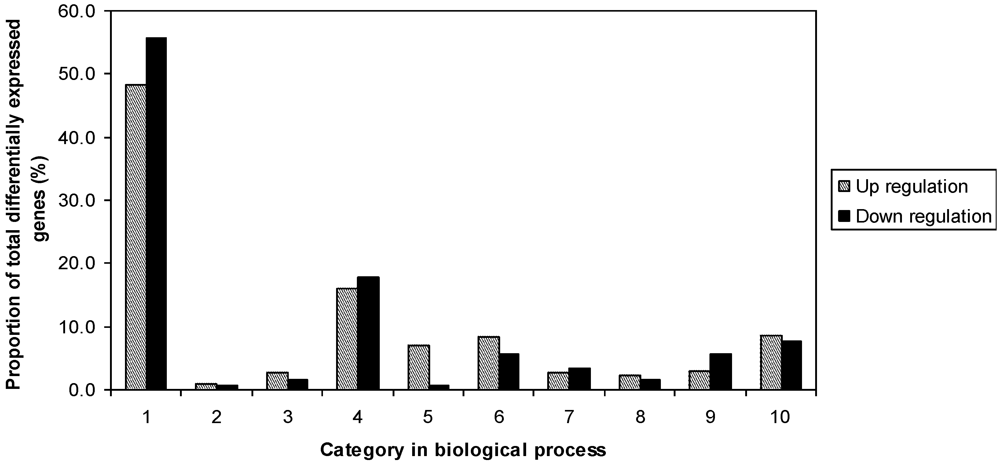
To study the difference between resistant and susceptible genotypes in response to fungal challenge, the two inoculated samples of R and S were compared in an independent experiment. A total of 1376 differentially expressed genes were observed, including 689 up-regulated and 687 down-regulated. The fold-changes of gene expression were between 2 and 125.8. Results also indicated that genes were distributed in all listed functional categories of biology processes (
Figure 4). R had more genes in protein biosynthesis, protein fate, catabolism, cell fate and development, signal transduction, and transport. However, S had more in metabolism, stress related and transcription categories.
Figure 4.
Proportion of differentially expressed genes among functional categories in the comparison of inoculated Eyl25(R) with inoculated Eyl31(S). 1 biological process unknown; 2 catabolism; 3 cell fate and development; 4 metabolism; 5 protein biosynthesis; 6 protein fate; 7 response to stress; 8 signal transduction; 9 transcription; 10 transport.
3.6. Defense Genes in Inoculated R and S
Defense-related genes were significantly expressed (
P < 0.05, 2 fold change) in both inoculated resistant and susceptible genotypes, especially in S (
Table S3). Of the up-regulated genes, PR and abiotic stress-related genes comprised the majority in both R and S, and the induced PR genes included most of the 17 PR families. However, the gene members and their expression levels in each family could be different. Chitinase, for example, had 12 members in R, and 14 in S. The maximum fold-change of the chitinase gene was 6 (MZ00043658) in R, but 18.3 (MZ00043035) in S. The maximum fold-change for defense genes in R was 6 for chitinase (MZ00043658), and only 3 defense genes were more than 5 fold different. The maximum fold-change in S was 85.7 for polyphenol oxidase (MZ00015021), and 10 defense genes were more than 10 fold different. The investigation also indicated that no PR gene was down regulated in inoculated R, but several were in S (
Table S3).
Differences in defense-related genes were also compared between the inoculated samples of R and S (
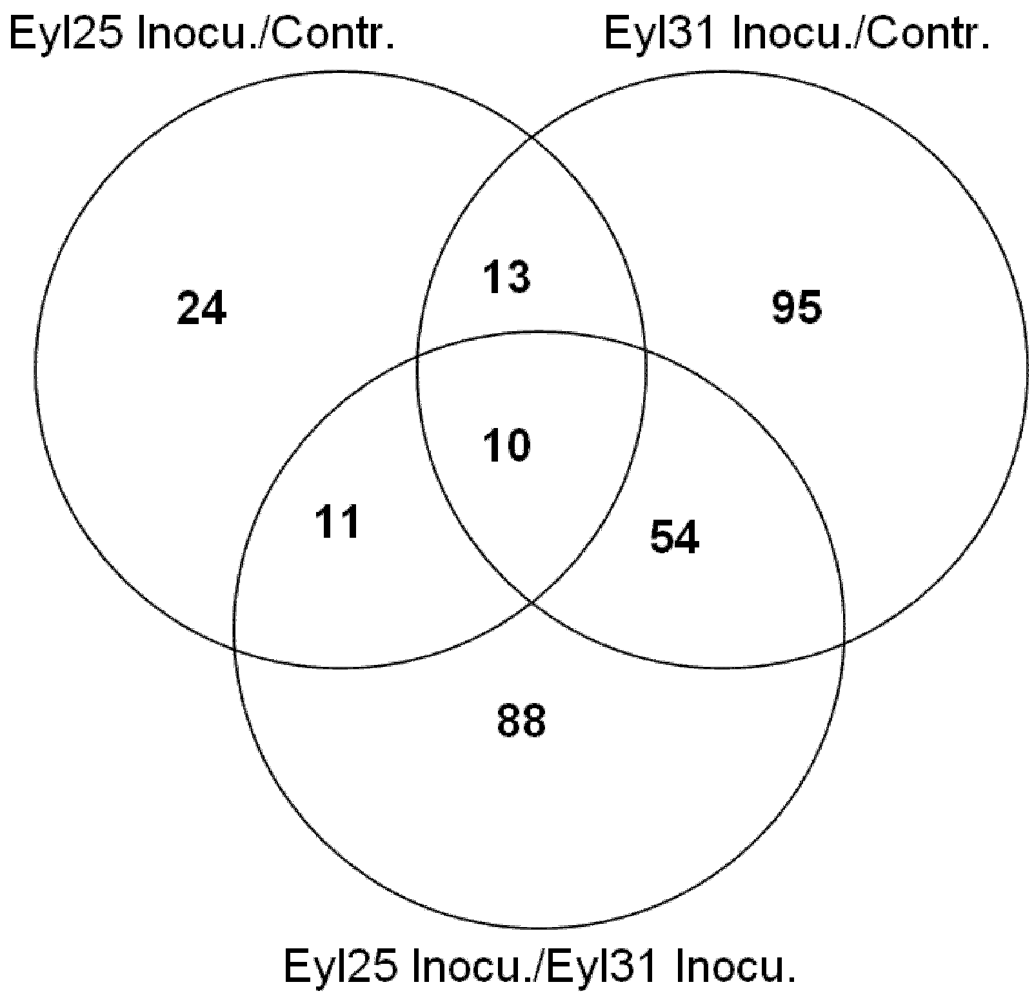
Table S4). Of the significantly expressed genes, several up-regulated genes, which were up-regulated in the comparison between noninoculated R and S, were also up-regulated in the R and S inoculated comparison. Examples of these were dehydration-responsive protein RD22 precursor (MZ00057294), glycine-rich protein (MZ00016231), pathogenesis-related protein 4 (MZ00043659), auxin-regulated like protein (MZ00042957), gibberellin-stimulated transcript 1 like protein (MZ00014890), 1,3-beta-glucanase (MZ00030174), nonspecific lipid-transfer protein precursor (MZ00041611), and Zeamatin precursor (MZ00017927). These results suggest that in the comparison between the two inoculated samples, differentially expressed genes were caused by both fungal challenge and having a different genetic background. To identify the differentially expressed genes caused by
A. flavus’ challenge, and eliminate those caused by genetic background, Venn diagram analysis based on gene ID comparison was conducted between the inoculated R, the inoculated S, and the inoculated R/inoculated S (
Figure 5). Results indicated that 75 defense-related genes were in response to
A. flavus, and the remaining 88 genes were different due to genotype. Results also indicated that 23 defense genes were expressed in both inoculated resistant and susceptible genotypes. Of 75 defense-related genes (
Table 2), more were up-regulated in S, especially PR genes.
Figure 5.
Venn diagram analysis for defense related genes for A. flavus-inoculated experiments involving Eyl25(R) and Eyl31(S).
Figure 5.
Venn diagram analysis for defense related genes for A. flavus-inoculated experiments involving Eyl25(R) and Eyl31(S).
Table 2.
Significantly different induced genes in the comparison between inoculated Eyl25(R) and inoculated Eyl31(S) *. The direction of regulation comparisons is in R relative to S.
Table 2.
Significantly different induced genes in the comparison between inoculated Eyl25(R) and inoculated Eyl31(S) *. The direction of regulation comparisons is in R relative to S.
| Gene ID | Fold Change | Regulation | Putative_Annotation |
|---|
| Abiotic Stress Related Gene |
| Z00015715 | 2.82 | up | OSJNBa0027O01.6 |
| MZ00016855 | 6.38 | up | salt-inducible protein kinase |
| MZ00017506 | 2.06 | up | heat shock factor RHSF13-like |
| MZ00019961 | 3.18 | up | unknown protein |
| MZ00025219 | 2.60 | up | unnamed protein |
| MZ00026333 | 3.92 | up | Emb5 gene |
| MZ00026695 | 3.75 | up | nin one binding protein |
| MZ00027101 | 3.02 | up | pseudouridylate synthase-like |
| MZ00027827 | 6.76 | up | At4g08790/T32A17_100 |
| MZ00028039 | 2.45 | up | Late embryogenesis abundant protein EMB564 |
| MZ00028141 | 2.46 | up | Hsp70 binding protein |
| MZ00046743 | 19.14 | up | wound inductive gene |
| Antioxidant Gene |
| MZ00042868 | 3.02 | up | glutathione transferase |
| MZ00015127 | 3.33 | up | Hydroxyacylglutathione hydrolase cytoplasmic (Glx II) |
| MZ00014089 | 2.10 | up | superoxide dismutase (Cu-Zn) 2 |
| MZ00014859 | 2.43 | up | glutathione S-transferase GST 18 |
| Biotic Stress Related Gene |
| MZ00018774 | 9.59 | up | leucine-rich repeat-like protein |
| Hormone Related Gene |
| MZ00043144 | 2.91 | up | ABI3-interacting protein 2 |
| Pathogenesis Related Gene |
| MZ00017927 | 2.16 | up | Zeamatin precursor |
| MZ00024296 | 2.20 | up | 2-oxoglutarate-dependent oxygenase |
| MZ00025038 | 2.51 | up | pathogenesis-related protein 4 |
| MZ00041277 | 2.95 | up | chitinase |
| MZ00041611 | 4.71 | up | Nonspecific lipid-transfer protein precursor (LTP) |
| MZ00042393 | 3.84 | up | oxidase |
| MZ00043179 | 2.43 | up | subtilisin/chymotrypsin inhibitor |
| MZ00043658 | 2.32 | up | pathogenesis-related protein 4 |
| MZ00043659 | 2.31 | up | pathogenesis-related protein 4 |
| MZ00043978 | 2.13 | up | thionin like protein |
| Secondary Metabolism |
| MZ00014812 | 2.47 | up | cinnamyl alcohol dehydrogenase |
| Abiotic Stress Related Gene |
| MZ00004118 | 2.42 | down | multiple stress-responsive zinc-finger protein |
| MZ00015403 | 6.34 | down | alcohol dehydrogenase ADH |
| MZ00016824 | 3.18 | down | unknown protein |
| MZ00015918 | 4.37 | down | unknown protein |
| MZ00026561 | 2.23 | down | NA |
| MZ00036743 | 2.90 | down | adhesive/proline-rich protein |
| MZ00037469 | 2.12 | down | probable lipase |
| MZ00041634 | 5.14 | down | adhesive/proline-rich protein |
| MZ00044463 | 2.48 | down | multiple stress-associated zinc-finger protein |
| MZ00042137 | 3.80 | down | phosphate-induced protein 1-like protein |
| Antioxidant Gene |
| MZ00041713 | 15.90 | down | glutathione S-transferase GST 8 |
| Biotic Stress Related Gene |
| MZ00028198 | 2.82 | down | receptor-like kinase Xa21-binding protein 3 |
| MZ00029329 | 13.99 | down | receptor-like kinase |
| MZ00036884 | 3.53 | down | Probable disease resistance protein At5g04720 |
| MZ00043958 | 2.52 | down | receptor-like protein kinase 1 |
| Hormone Related Gene |
| MZ00018872 | 10.09 | down | acc synthase |
| MZ00027365 | 3.89 | down | ethylene-forming enzyme |
| MZ00014879 | 2.03 | down | auxin response factor 2 |
| MZ00030445 | 2.42 | down | ethylene-responsive factor-like protein 1 |
| MZ00030984 | 3.30 | down | chitin-inducible gibberellin-responsive protein |
| Pathogenesis Related Gene |
| MZ00000977 | 5.45 | down | antifungal thaumatin-like protein |
| MZ00004170 | 3.89 | down | chitinase III |
| MZ00013547 | 2.65 | down | thaumatin-like protein |
| MZ00015469 | 11.38 | down | peroxidase |
| MZ00015553 | 3.82 | down | Glucan endo-1,3-beta-glucosidase precursor |
| MZ00019543 | 3.30 | down | peroxidase |
| MZ00020250 | 2.30 | down | peroxidase |
| MZ00026196 | 8.92 | down | peroxidase |
| MZ00026392 | 7.12 | down | Bax inhibitor-1 (BI-1) |
| MZ00031167 | 2.66 | down | antifungal zeamatin-like protein |
| MZ00035052 | 2.26 | down | pathogenesis related protein-5 |
| MZ00036117 | 2.38 | down | thaumatin-like protein |
| MZ00037253 | 5.39 | down | subtilisin/chymotrypsin inhibitor |
| MZ00041005 | 7.89 | down | subtilisin/chymotrypsin inhibitor |
| MZ00041326 | 3.01 | down | Bowman-Birk serine protease inhibitor |
| MZ00041327 | 6.10 | down | Bowman-Birk type trypsin inhibitor (WTI) |
| MZ00041768 | 2.25 | down | polyphenol oxidase |
| MZ00043035 | 5.66 | down | chitinase PRm 3 |
| MZ00043996 | 14.27 | down | Bax inhibitor-1 (BI-1) |
| MZ00044200 | 2.82 | down | beta-1,3-glucanase |
| Secondary Metabolism Related Gene |
| MZ00006045 | 2.64 | down | flavonol glucosyltransferase |
| MZ00014291 | 4.52 | down | phenylalanine ammonia-lyase |
| MZ00014292 | 13.01 | down | phenylalanine ammonia-lyase |
| MZ00025088 | 2.88 | down | phenylalanine ammonia-lyase |
| MZ00025089 | 3.48 | down | phenylalanine ammonia-lyase |
| MZ00025513 | 3.52 | down | cinnamic acid 4-hydroxylase |
| MZ00043784 | 5.58 | down | cinnamic acid 4-hydroxylase |
3.7. Regulatory Genes-Transcription Factors
Up-regulated transcription factors were investigated in the inoculated resistant and susceptible genotypes. Results indicated that R had fewer than S (
Table S5). The gene with maximum fold-change in R was the DNA-binding protein RAV2 (MZ00017226, 4.3 fold). Many were down-regulated in S (not shown), but only one down-regulated factor was observed in R. Among the up-regulated TFs (totaling about 190), only four were expressed in both genotypes, including development regulation gene OsNAC4 (MZ00026127), DNA-binding protein RAV2-like (MZ00017226), ethylene responsive element binding factor (ERF) 3 (MZ00018574), and zinc finger transcription factor ZF1 (MZ00056566).
Fewer TFs were shown to be significantly different between the R and S controls (
Table S5). Most of the fold-changes in the expression of TFs were less than 4, and the maximum was 5.3. However, many transcriptional factors were shown to be significantly different between inoculated R and S. The maximum change was 25 fold. This indicates that TFs in R and S responded differently to challenge. Several TFs were shown to be significantly different in the comparisons of inoculated treatments and their controls, such as OSJNBb0020J19.6 (MZ00027110), unnamed protein product (MZ00024145), transcription initiation factor IIE (MZ00026843) in R, ethylene-responsive factor-like protein 1 (MZ00030445), and Sip1 protein (MZ00041367) in S.
Of NPR1 gene members, only one (MZ00019046) was expressed in the inoculated R and S, but its expression was not significantly different between the inoculated samples and the controls. Of the WRKY genes, the WRKY9 (MZ00042052, MZ00042053, MZ00016272) and WRKY12 (MZ00021479) were expressed in both inoculated R and S, but expression was not significantly different between them. However, WRK (MZ00001709) and WRK12 (MZ00042508) were up-regulated significantly in the inoculated S. Many bZIP members were expressed in both inoculated R and S, such as MZ00043889, MZ00016963, MZ00028410, but none were up-regulated. A similar situation was observed with Myb genes; many members were expressed, but only Myb-like DNA-binding protein (MZ00044429, MZ00018761), and GAMYB-binding protein (MZ00024498) were up-regulated in inoculated S. Of the ethylene responsive factors, ERF3 (MZ00018574, MZ00026596) was up-regulated in inoculated R. ERF (MZ00016032), ethylene-responsive factor-like protein 1(MZ00019568, MZ00030445), and ERF3 (MZ00018574) were up-regulated in inoculated S.
Other transcription factors also were observed in inoculated R and S, such as zinc finger transcription factor ZF1 (MZ00056566), transcription factor MYC7E (MZ00044532), and AP2 domain factors.
3.8. Regulatory Genes-Signaling Pathways
From the survey of genes in signal biosynthesis pathways and down-stream response factors, a number of key ethylene pathway genes were expressed in the A. flavus-challenged samples. Some related genes were up-regulated, such as ACC oxidase (MZ00018436), ERF3 (MZ00018574, MZ00026596) in R; ACC synthase (MZ00018872), ERF3 (MZ00018574), ethylene-insensitive-3-like protein (MZ00042402, MZ00042403), ethylene-responsive factor-like protein 1 (MZ00019568, MZ00030445), ethylene-forming enzyme (MZ00027365), and ethylene-inducible CTR1-like protein kinase (MZ00025350) in S. Comparing inoculated R and S, the ethylene induced protein kinase PK12 (MZ00041589, MZ00001435) and ethylene receptor (MZ00025470) were up-regulated in R, but ethylene-forming enzyme (MZ00004140, MZ00027365) and ethylene-responsive factor-like protein 1 (MZ00030445) were down-regulated.
Besides ethylene, a number of key auxin pathway genes were also expressed in A. flavus’ challenged samples. Some auxin related genes were up-regulated in inoculated S, such as auxin response factor 1 (MZ00024113, MZ00024115), auxin response factor 2 (MZ00014879), auxin response factor (MZ00016434), auxin response transcription factor (ARF6) (MZ00018657), auxin-induced protein (MZ00055925), and auxin-regulated protein (MZ00017133). But in inoculated R, only the proliferating cell nuclear antigen (MZ00020357) was up-regulated by 2.3 fold. Compared with inoculated S, only auxin-regulated protein-like (MZ00042957) and auxin-induced protein (MZ00029389) were up-regulated by 25.0 fold and 8.3 fold respectively, and auxin response factor 2 (MZ00014879) and proliferating cell nuclear antigen (MZ00020357) were down-regulated by 2.0 fold and 4.8 fold respectively in R.
In the present study, several genes in lipid metabolism were up regulated in the inoculated samples, such as lipase (MZ00037469), lipid transfer protein (MZ00041203, Z00041204), and membrane lipoprotein lipid attachment site-containing protein (MZ00001596) in R; lipoxygenase (MZ00015701, MZ00000521, MZ00041271), lipase-like (MZ00026059), lipid transfer protein (MZ00023565, MZ00041610, MZ00041611), and GDSL-motif lipase/hydrolase protein (MZ00005177) in S. Of the lipoxygenase isoforms, only MZ00041271 was up-regulated (4.0 fold) in the noninoculated R and S comparison, and only MZ00015701 was down-regulated (8.4 fold). Of the lipid transfer protein isoforms, the up-regulated genes were MZ00023565 (4.7 fold), MZ00019645 (3.9 fold), MZ00041613 (3.0 fold), MZ00041611 (3.4 fold) in this comparison; no down-regulated genes were observed. In the comparison between inoculated R and S, only up-regulated genes were detected. These include MZ00041612 (3.7 fold), MZ00041611 (4.7 fold), MZ00041613 (2.4 fold) and MZ00028450 (6.5 fold). The members of MZ00041611 and MZ00041613 displayed higher expression in both the inoculated R and the control. Lipid transfer proteins are also considered PR proteins.
Of the kinases differentially expressed in the comparison between R and S controls, protein kinase Xa21 (MZ00001132) was up-regulated by 21.6 fold, LRR receptor-like kinase 2 (MZ00031205) by 2.7 fold, and receptor protein kinase (MZ00031498) by 2.6 fold. In the comparison between inoculated R and S, several were up-regulated such as protein kinase Xa21 (MZ00001132) by 27.0 fold, protein kinase A. FLAVUSC3 (MZ00015865) by 12.1 fold, and serine/threonine protein kinase (MZ00030536) by 15.1 fold. Several were also down-regulated, such as Avr9/Cf-9 rapidly elicited protein-like (MZ00041362) by 2.4 fold, MAP3K-like protein (MZ00018666), MAP kinase 4 (MZ00027390), casein kinase (MZ00013631) by 10.3 fold, serine/threonine protein kinase PKPA-like protein (MZ00056607) by 10.8 fold, and protein kinase (MZ00044579) by 11.6 fold.
3.9. Validation of Microarray Data by Quantitative Real-Time RT-PCR
To confirm the reliability of the microarray results, twenty-four genes with the expression patterns of up-regulation, down-regulation, or no-change from microarray analysis were selected for validation using qRT-PCR (
Table S6). Statistical significance and fold change based on relative quantification of C
T were analyzed for the selected genes in the comparison of inoculated R and S. Generally,
R-value > 2.00 (
P < 0.05) was described as up-regulation (++),
R-value < 0.50 (
P < 0.05) as down-regulation (−−), and 2.00 >
R-value > 0.50 (
P > 0.05) as no-change (+−). Results (
Table S6) indicated that the expression patterns measured by qRT-PCR matchedthose measured by microarray, with regard to up-regulation, down-regulation and genes where no change occurred. The differences observed between the two methods were in expression level (fold change).
4. Discussion
KSA based
A. flavus’ inoculation and incubation of kernels provides an efficient assessment method for aflatoxin accumulation. During this protocol, quiescent dry seeds will commonly germinate after the uptake of water. Different germination phases have been described, each with a unique metabolism status as well as gene expression pattern [
33,
34]. These phases include: (1) seed imbibitions; (2) reinitiation of metabolic processes; and (3) emergence of the radicle through the seed envelope [
35]. KSA-processed kernels, which imbibe under 100% humidity, take longer to enter the third phase than do kernels steeped in water. It is also our observation, that the time required for radical emergence of incubated kernels varies with genotype. In some lines, radicals cannot be observed even past a 7-day incubation period.
In the present study, R and S kernels were incubated via the KSA, 72 h for microarray analysis and 7 days for aflatoxin measurement. No radicle emerged by the 72 h time-point, however, variation in the amount of A. flavus colonization between R and S kernels was observed by this time-point. This variation facilitated the removal of kernels that differed from the resistant or susceptible phenotype (based on fungal growth on the kernel surface) used for the microarray experiment, therefore, avoiding the inclusion of false information in the microarray analysis. From the gene expression profiles of the two controls, metabolic processes in kernels had been reinitiated at 72 h. Therefore, the physiological status of the KSA kernels by definition would be phase 2. Microarray results indicate that kernels could sense and respond to a challenge from A. flavus at this stage, as a complex defense system was initiated in response to A. flavus infection in both R and S lines. Also, multiple defense genes were shown to be involved in this system.
In general, the comparison between resistant and susceptible controls demonstrated that the total expressed genes and their biological processes have similar expression patterns (
Figure 1); transcriptional profiles of imbibed kernels at the early phase of germination are also similar to profiles of inbred Tex6 kernels during late development in the field [
26]. This result suggests that imbibed kernels at the early germinating stage are restored to the physiological status existing prior to kernel dormancy. Further studies, however, comparing gene expression during imbibition with expression in late development, within the same genotype, would be required to confirm this suggestion. Imbibed kernels (early germination) might then provide a more suitable subject for gene expression analysis than late developing kernels from the field. To the authors’ knowledge, the present study represents the first time a gene expression profile has been obtained using imbibed kernels to investigate the maize-
A. flavus interaction. Since aflatoxin-resistance in pre- and in post- harvest kernels correlates well [
12,
13], using imbibed kernels may also facilitate further understanding of the ability of mature pre-harvest seed, where aflatoxin buildup occurs in the field, to respond and defend against
A. flavus infection and aflatoxin production.
All plants have a basal defense, the general immune response to pathogens and other mechanisms to counter microbial infections [
19,
22,
36]. Earlier proteomic investigations demonstrated that possession of a strong constitutive resistance is a primary factor differentiating resistant from susceptible kernels [
23]. By comparing the gene expression profile in R and S control kernels, numerous defense genes were clearly detected, and these genes could be part of the normal kernel development process under germinating conditions and a part of the constitutive resistance against potential pathogens and environmental stress at this stage of development. However, different genotypes could have different defense genes or different expression levels, even genotypes with close genetic backgrounds, such as Eyl25(R) and Eyl31(S), which are 87.5% genetically similar (
Table 1). The comparison between R and S controls shows that more PR genes were expressed in R than in S. Several members of the chitinase family were up-regulated significantly in R, however, none were up-regulated in S. Chitinase may play an important constitutive defense role in R; one member, PR-4 (MZ00043659), was expressed by 36.3 fold higher in R than in S.
In response to challenge by
A. flavus, defense genes were induced in both aflatoxin
-resistant and susceptible genotypes, especially PR genes. Most PR gene families were observed in both genotypes after induction, but the members and their expression levels varied between the two maize lines. Some induced PR genes in inoculated samples were also highly expressed in controls, such as PR4 (MZ00043659), beta-1,3-glucanase (MZ00030174), zeamatin (MZ00017927), and nonspecific lipid-transfer protein (MZ00041611). An interesting result was that no PR gene was down-regulated in the inoculated R. The gene expression profiles of both genotypes revealed that S kernels were even more sensitive to challenge by
A. flavus than R kernels. A proteomic investigation of aflatoxin-resistant and -susceptible maize rachis tissue showed the same variation in sensitivity to challenge by
A. flavus observed in the present study [
37]. The response of S and R genotypes to infection presumes the presence of a recognition and regulation system in kernels. Based on this presumption, kernels under attack would determine the defense components needed to ward off a pathogen. The lack of adequate preformed components could therefore, lead to the expression of numerous genes for defense purposes. On the other hand, the resistant line, with ‘adequate’ constitutive resources would be less sensitive in its response to pathogen attack, synthesizing components to a lesser degree than the susceptible line. This study and future investigations may assist us in understanding an “
A. flavus recognition and defense-response system”. This phenomenon may provide a new strategy for screening lines for resistance at the molecular level.
Since numerous constitutive and induced genes comprise maize kernel resistance to
A. flavus infection, devising a sound defense strategy may require an understanding of the regulation network involved in the kernel defense response. The discovery of transcription factors (TFs) expressed in response to challenge could help in understanding the regulation of defense genes and the response of TFs to signal transduction in kernels. Besides constitutive TFs in the noninoculated R and S, many TFs were induced in response to infection, and differences in induced TFs between R and S kernels were demonstrated (
Table S5). In plant disease resistance, transcription cofactor NPR1 controls the expression of antimicrobial PR genes by interacting with other transcription factors, such as WRKY, ERF, bZIP, Whirly and Myb factors [
22,
36,
38,
39]. WRKY factors appear to play a major role in transcriptional reprogramming during a variety of immune responses [
40]. One NPR1, several WRKY and many bZIP members were expressed in the inoculated R and S, however, no up-regulated ones were observed in the comparison of controls. Of the observed Myb and ERF members, three Myb and four ERF members were up regulated in the inoculated S, no Myb members but two ERF members were up regulated in the inoculated R. So, ERF members could be involved in the response of R and S kernels to
A. flavus, especially ERF3 (MZ00018574), expressed in both inoculated genotypes. ERFs are known to comprise one of the largest families of transcription factors in plants, and play a virtual role in response to biotic and abiotic stress. In response to pathogen infection, ERF proteins activate the expression of PR genes by binding to the GCC box (AGCCGCC) in the promoter of PR genes, which positively regulates resistance to pathogen attack [
41,
42,
43].
Several plant signaling components have been shown to be involved in the induction of plant defense, such as salicylic acid, jasmonic acid, ethylene and reactive oxygen species [
22,
36,
44]. Research also suggests that a lipid-based molecule could be the mobile signal in plant defense systems [
36]. Interestingly, previous evidence implicates a lipid metabolite as playing a signal role in host resistance against
A. flavus infection [
45,
46,
47]. In fact, different isoforms of lipoxygenase, could lead to different host responses to
A. flavus infection. The present microarray investigation of signaling components indicate that ethylene, auxin, and lipid pathways are involved in the response to challenge by
A. flavus. The relationship between the related pathways, however, still must be uncovered.
Receptors and kinases are important signal transduction components in plant defense systems [
22]. Of the detected receptors and kinases, Avr9/Cf-9 rapidly elicited protein, mlo2 protein and receptor-like kinase Xa21-binding protein 3 are expressed in both R and S controls. Avr9/Cf-9 rapidly elicited protein and mlo2 protein have been shown to be involved in resistance to fungal pathogens [
48,
49]. Xa21 serves as a pathogen recognition receptor in rice to innate immune systems in resistance to bacterial blight disease caused by
Xanthomonas oryzae pv.
Oryzae [
50]. Interestingly in the comparison between R and S, protein kinase Avr9/Cf-9 rapidly elicited protein-like structure (MZ00041362) was up-regulated in the inoculated S, and Xa21 (MZ00001132) was significantly higher in both the control and the inoculated R than in S samples. However, further work is needed to determine the exact involvement of Xa21 (MZ00001132) or the Avr9/Cf-9 rapidly elicited protein-like structure (MZ00041362) in the interaction with
A. flavus, and if higher expression of Xa21 in R accounts for the difference in
A. flavus resistance between R and S.


