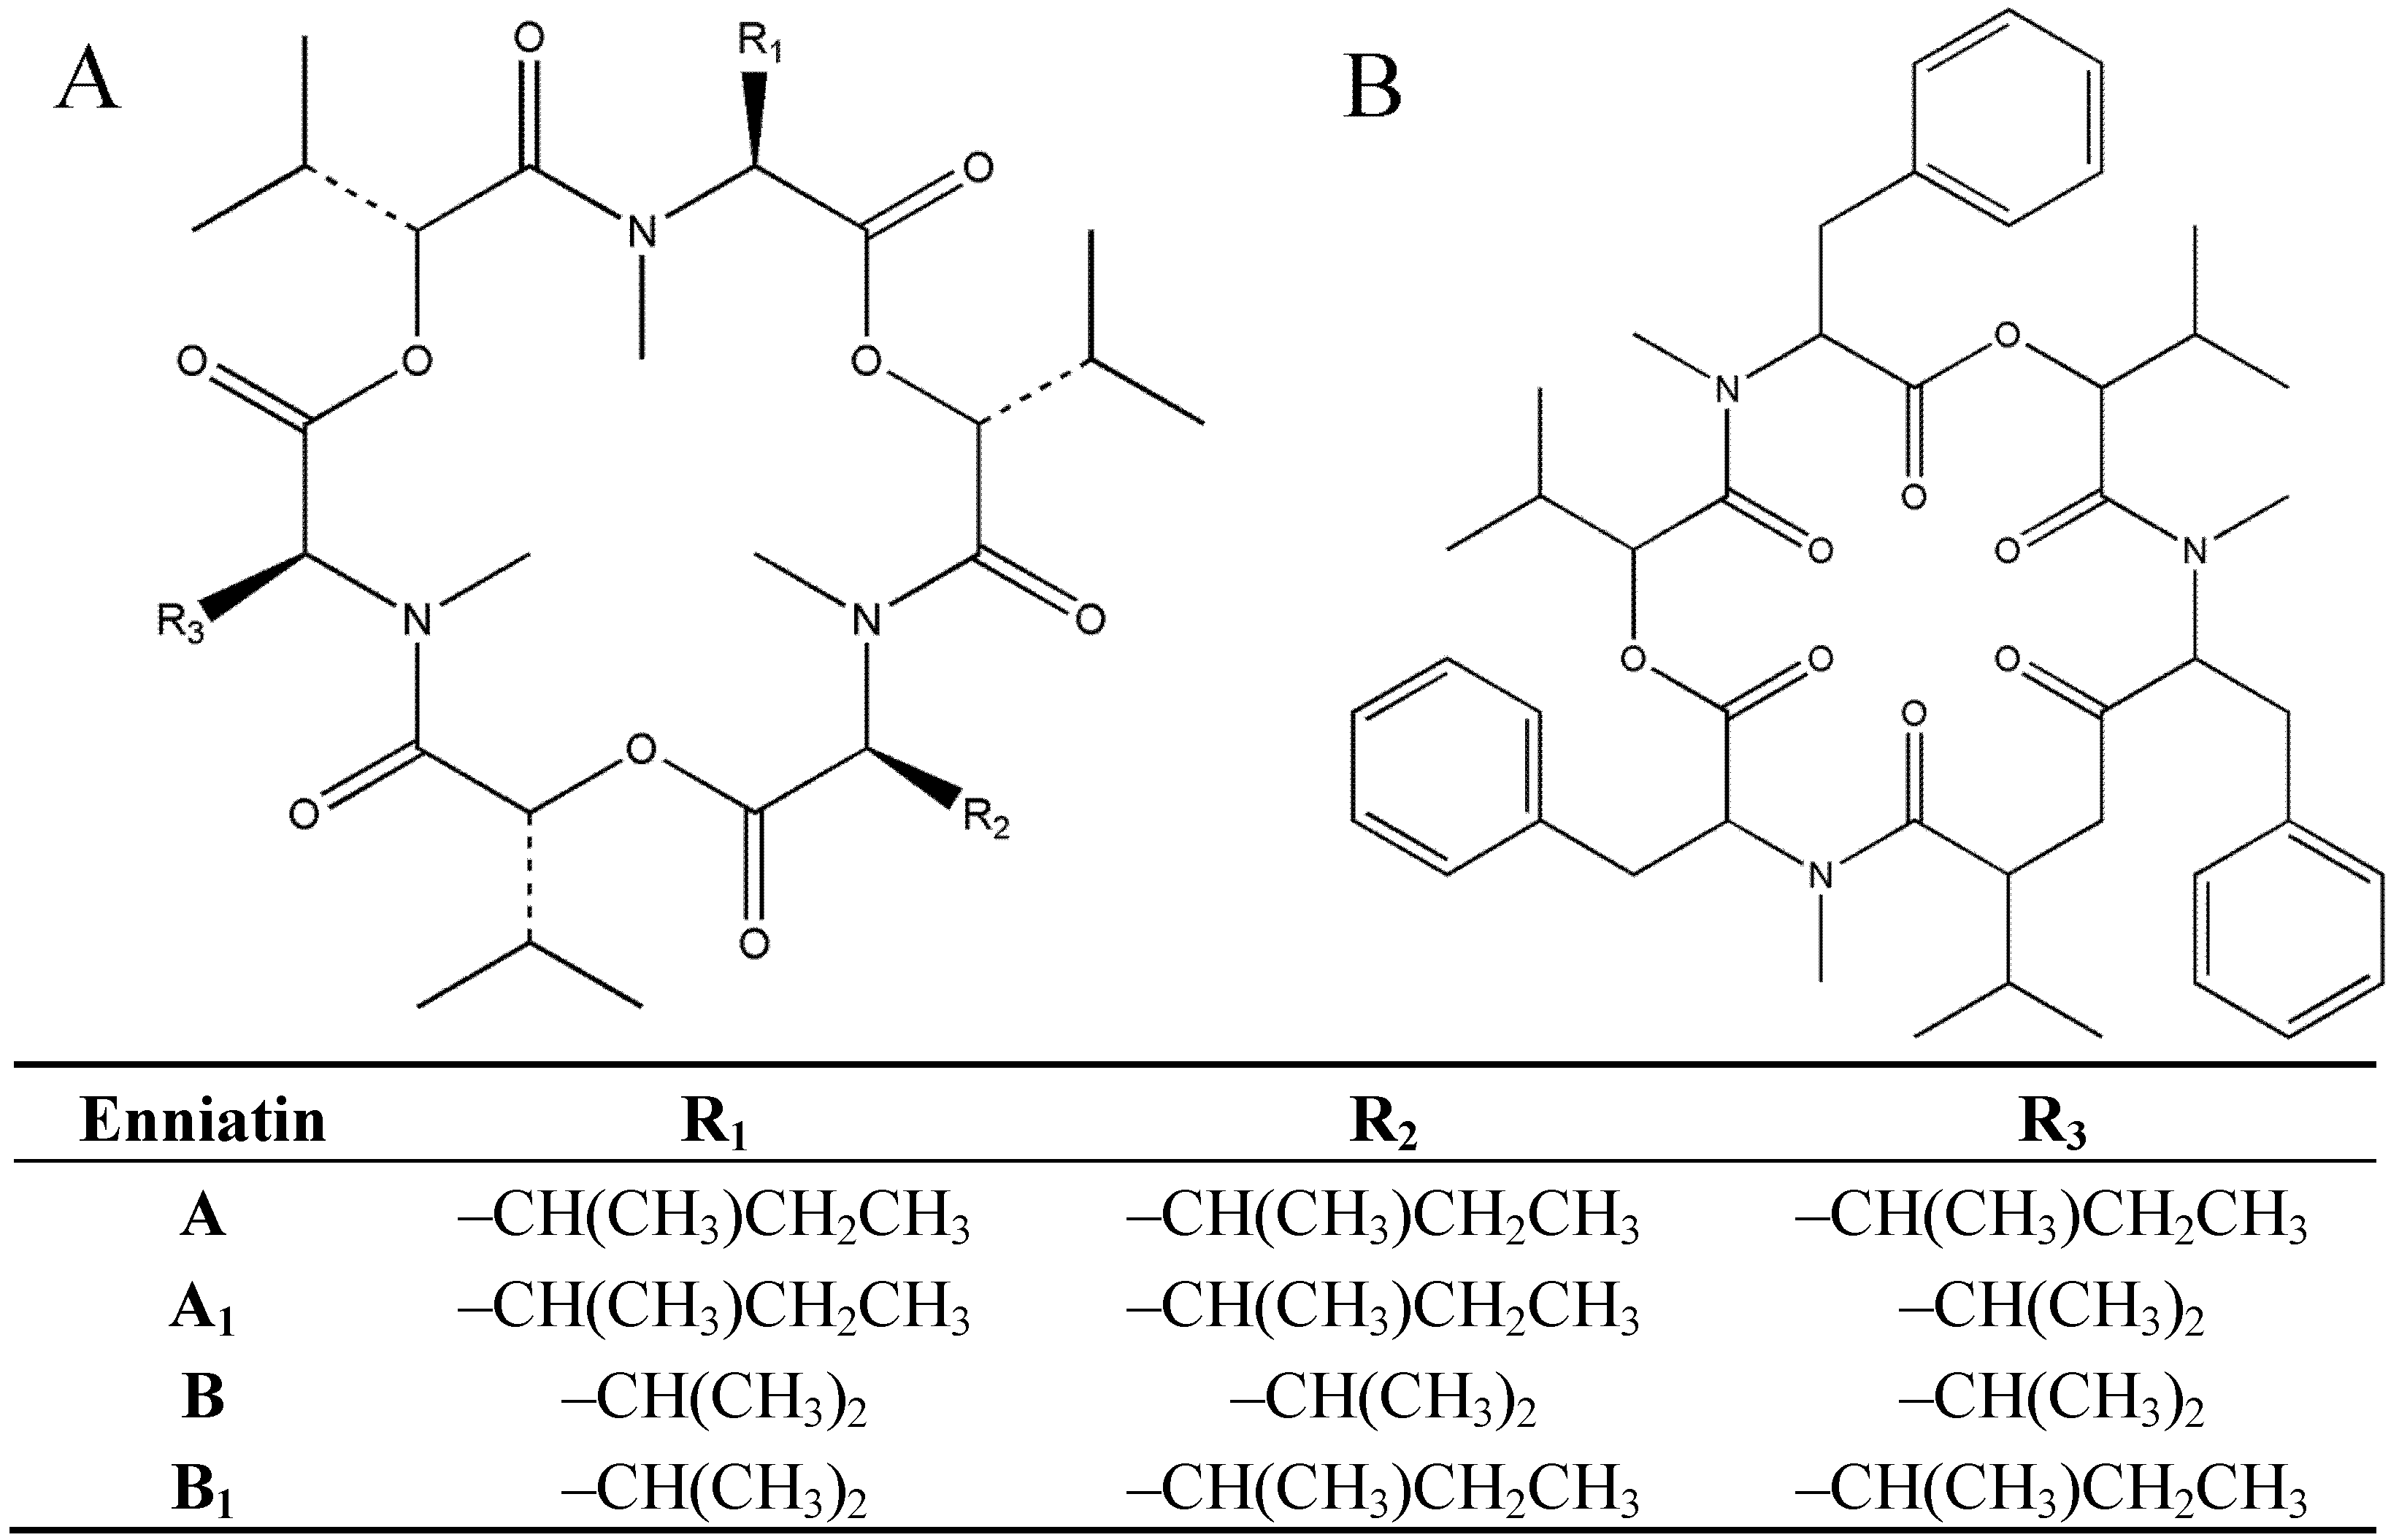
Sequence Divergence of the Enniatin Synthase Gene in Relation to Production of Beauvericin and Enniatins in Fusarium Species


Abstract
:1. Introduction

2. Results and Discussion
2.1. Fusarium Species Identification

| Strain | Species | Host | Year of isolation | Origin |
|---|---|---|---|---|
| KF 3713 | F. acuminatum | Pisum sativum | 2012 | Poland |
| KF 3557 | F. ananatum | Ananas comosus | 2011 | Costa Rica |
| KF 3756 | F. ananatum | Ananas comosus | 2011 | Costa Rica |
| KF 461 | F. anthophilum | Plantago lanceolata | USA | |
| KF 1337 | F. avenaceum | Triticum aestivum | 1987 | Poland |
| KF 3585 | F. avenaceum | Allium cepa | Italy | |
| KF 3586 | F. avenaceum | Lycopersicon esculentum | 2011 | Poland |
| KF 3719 | F. avenaceum | Pisum sativum | 2012 | Poland |
| KF 3718 | F. avenaceum | Pisum sativum | 2012 | Poland |
| KF 3717 | F. avenaceum | Pisum sativum | 2012 | Poland |
| KF 2805 | F. avenaceum | Triticum aestivum | 2009 | Poland |
| KF 3704 | F. avenaceum | Zea mays | 2011 | Poland |
| KF 3716 | F. avenaceum | Pisum sativum | 2012 | Poland |
| KF 3390 | F. avenaceum | Zea mays | 2009 | Poland |
| KF 3715 | F. avenaceum | Pisum sativum | 2012 | Poland |
| KF 3755 | F. concentricum | Ananas comosus | 2011 | Costa Rica |
| KF 3536 | F. concentricum | Ananas comosus | 2010 | Costa Rica |
| KF 3406 | F. concentricum | Ananas comosus | 2009 | Costa Rica |
| KF 430 | F. dlaminii | soil | RSA | |
| KF 3751 | F. equiseti | Lycopersicon esculentum | 2012 | Poland |
| KF 3749 | F. equiseti | Lycopersicon esculentum | 2012 | Poland |
| KF 3430 | F. equiseti | Musa sapientum | 2010 | Ecuador |
| KF 3563 | F. equiseti | Asparagus officinalis | 2011 | Poland |
| KF 3631 | F. fujikuroi | Oryza sativa | 2011 | Thailand |
| KF 3583 | F. fujikuroi | Oryza sativa | 2011 | Italy |
| KF 3588 | F. lactis | Capsicum annuum | 2011 | Poland |
| KF 3641 | F. lactis | Capsicum annuum | 2011 | Poland |
| KF 3640 | F. lactis | Capsicum annuum | 2011 | Poland |
| KF 337 | F. nygamai | Cajanus indicus | India | |
| KF 434 | F. nygamai | soil | Australia | |
| KF 3561 | F. oxysporum | Allium sativum | 2011 | Poland |
| KF 3567 | F. oxysporum | Allium sativum | 2011 | Poland |
| KF 3565 | F. oxysporum | Asparagus officinalis | 2011 | Poland |
| KF 1400 | F. poae | Zea mays | 1990 | Poland |
| KF 2576 | F. poae | Zea mays | 1999 | Poland |
| KF 3564 | F. polyphialidicum | Ananas comosus | 2011 | Costa Rica |
| KF 3560 | F. proliferatum | Rheum rhabarbarum | 2011 | Poland |
| KF 3442 | F. proliferatum | Zea mays | 2006 | Poland |
| KF 3657 | F. proliferatum | Ananas comosus | 2011 | Indonesia |
| KF 3566 | F. proliferatum | Oryza sativa | 2011 | Thailand |
| KF 3439 | F. proliferatum | Ananas comosus | 2010 | Ecuador |
| KF 496 | F. proliferatum | Zea mays | 1983 | Italy |
| KF 3363 | F. proliferatum | Allium sativum | 2009 | Poland |
| KF 3382 | F. proliferatum | Ananas comosus | 2009 | Hawaii |
| KF 3584 | F. proliferatum | Oryza sativa | 2011 | Thailand |
| KF 3558 | F. proliferatum | Asparagus officinalis | 2011 | Poland |
| KF 3654 | F. proliferatum | Zea mays | 2011 | Poland |
| KF 3754 | F. solani | Lycopersicon esculentum | 2012 | Poland |
| KF 3700 | F. sporotrichioides | Asparagus officinalis | 2012 | Poland |
| KF 3728 | F. sporotrichioides | Pisum sativum | 2012 | Poland |
| KF 3702 | F. subglutinans | Cambria sp. | 2012 | Poland |
| KF 534 | F. temperatum | Zea mays | 1985 | Poland |
| KF 506 | F. temperatum | Zea mays | 1985 | Poland |
| KF 1214,2 | F. temperatum | Zea mays | 1987 | Poland |
| KF 3321 | F. temperatum | Ananas comosus | 2008 | Costa Rica |
| KF 3667 | F. temperatum | Zea mays | Belgium | |
| KF 3701 | F. tricinctum | Asparagus officinalis | 2012 | Poland |
| KF 393 | F. verticillioides | Zea mays | USA |

2.2. Method Validation and Recovery
| Mycotoxin | R2 a | LOD b (ng g−1) | LOQ c (ng g−1) |
|---|---|---|---|
| Enniatin A | 0.9991 | 10.0 | 30.0 |
| Enniatin A1 | 0.9976 | 10.0 | 30.0 |
| Enniatin B | 0.9993 | 8.0 | 24.0 |
| Enniatin B1 | 0.9991 | 8.0 | 24.0 |
| Beauvericin | 0.9995 | 15.0 | 45.0 |
| Mycotoxin | Quantity added (ng g−1) | Mean recovery (%) | Relative standard deviation (%) |
|---|---|---|---|
| Enniatin A | 5 | 92.8 | 5.5 |
| 20 | 95.1 | 4.8 | |
| 60 | 94.7 | 5.9 | |
| Enniatin A1 | 5 | 88.6 | 6.7 |
| 20 | 90.2 | 5.9 | |
| 60 | 85.7 | 7.3 | |
| Enniatin B | 5 | 95.2 | 6.8 |
| 20 | 97.1 | 5.5 | |
| 60 | 94.3 | 6.3 | |
| Enniatin B1 | 5 | 89.8 | 4.3 |
| 20 | 91.4 | 5.0 | |
| 60 | 91.2 | 6.8 | |
| Beauvericin | 5 | 99.6 | 5.6 |
| 20 | 101.4 | 4.9 | |
| 60 | 98.3 | 5.4 |
2.3. In Vitro Mycotoxin Biosynthesis
| Strain | Species | BEA (μg g−1) | ENN A (μg g−1) | ENN A1 (μg g−1) | ENN B (μg g−1) | ENN B1 (μg g−1) |
|---|---|---|---|---|---|---|
| KF 3713 | F. acuminatum | 5.31 ± 0.77 | 19.62 ± 2.81 | 26.92 ± 1.97 | 90.89 ± 7.54 | 31.49 ± 5.90 |
| KF 3557 | F. ananatum | 27.68 ± 1.88 | 6.94 ± 0.42 | ND | 8.81 ± 0.73 | 27.60 ± 2.25 |
| KF 3756 | F. ananatum | 39.57 ± 2.63 | 11.18 ± 1.29 | ND | ND | 27.07 ± 1.92 |
| KF 461 | F. anthophilum | 141.97 ± 10.67 | 7.11 ± 0.53 | ND | 6.17 ± 0.63 | 12.14 ± 0.85 |
| KF 1337 | F. avenaceum | ND | 34.55 ± 4.18 | 71.90 ± 10.43 | 895.46 ± 55.48 | 452.46 ± 30.33 |
| KF 3718 | F. avenaceum | ND | ND | ND | 7.97 ± 0.54 | 15.99 ± 0.95 |
| KF 3717 | F. avenaceum | ND | 6.09 ± 0.88 | 5.65 ± 2.33 | 6.71 ± 0.72 | 11.46 ± 0.93 |
| KF 2805 | F. avenaceum | ND | ND | 25.56 ± 4.19 | 40.09 ± 2.21 | 41.49 ± 5.32 |
| KF 3704 | F. avenaceum | ND | ND | ND | 10.80 ± 0.87 | 117.77 ± 9.86 |
| KF 3716 | F. avenaceum | ND | 12.67 ± 2.06 | ND | 5.99 ± 0.51 | 18.15 ± 2.00 |
| KF 3390 | F. avenaceum | ND | 29.12 ± 3.21 | 32.40 ± 2.08 | 255.08 ± 18.76 | 138.15 ± 10.14 |
| KF 3715 | F. avenaceum | ND | 8.99 ± 1.42 | ND | 194.90 ± 20.22 | 27.21 ± 2.17 |
| KF 3755 | F. concentricum | 312.20 ± 28.09 | 11.40 ± 1.88 | 8.69 ± 0.75 | 17.33 ± 1.09 | 18.17 ± 1.44 |
| KF 3536 | F. concentricum | 1928.83 ± 60.77 | ND | 41.36 ± 5.33 | 39.44 ± 1.88 | 28.58 ± 2.09 |
| KF 3406 | F. concentricum | 0.42 ± 0.02 | ND | ND | ND | 6.98 ± 0.54 |
| KF 430 | F. dlaminii | ND | 6.92 ± 5.41 | 6.28 ± 0.71 | ND | 7.61 ± 1.13 |
| KF 3751 | F. equiseti | ND | ND | 6.94 ± 1.19 | ND | 7.66 ± 4.62 |
| KF 3749 | F. equiseti | ND | 39.27 ± 2.14 | 38.18 ± 2.01 | ND | 29.22 ± 3.22 |
| KF 3430 | F. equiseti | ND | 31.17 ± 2.81 | 32.15 ± 1.42 | 32.98 ± 2.63 | 41.22 ± 2.31 |
| KF 3563 | F. equiseti | ND | 43.47 ± 3.76 | 36.81 ± 2.88 | 29.18 ± 2.14 | 30.39 ± 1.54 |
| KF 3631 | F. fujikuroi | 428.09 ± 23.61 | ND | ND | ND | ND |
| KF 3583 | F. fujikuroi | 5.60 ± 0.27 | ND | ND | ND | ND |
| KF 3588 | F. lactis | ND | ND | 10.57 ± 1.02 | 9.59 ± 1.07 | 32.43 ± 4.55 |
| KF 3641 | F. lactis | ND | 30.97 ± 1.97 | 26.94 ± 4.61 | ND | ND |
| KF 3640 | F. lactis | ND | ND | 30.53 ± 3.32 | 27.63 ± 1.88 | ND |
| KF 337 | F. nygamai | 22.86 ± 2.66 | 10.45 ± 1.58 | ND | 9.50 ± 0.84 | ND |
| KF 434 | F. nygamai | 18.33 ± 1.09 | 8.15 ± 1.03 | 5.21 ± 0.32 | 8.69 ± 1.05 | ND |
| KF 3561 | F. oxysporum | 46.12 ± 5.87 | ND | ND | ND | ND |
| KF 3567 | F. oxysporum | 80.03 ± 10.23 | ND | 6.42 ± 0.66 | 8.25 ± 1.11 | 7.28 ± 0.32 |
| KF 3565 | F. oxysporum | 20.06 ± 2.66 | ND | ND | ND | ND |
| KF 1400 | F. poae | 394.67 ± 25.87 | ND | ND | ND | ND |
| KF 2576 | F. poae | 37.53 ± 4.87 | 34.31 ± 2.57 | 26.89 ± 2.18 | 28.71 ± 3.45 | ND |
| KF 3564 | F. polyphialidicum | ND | ND | ND | ND | ND |
| KF 3560 | F. proliferatum | 149.67 ± 10.33 | ND | ND | ND | ND |
| KF 3442 | F. proliferatum | 52.01 ± 3.68 | ND | ND | ND | ND |
| KF 3657 | F. proliferatum | 74.08 ± 5.14 | ND | ND | ND | ND |
| KF 3566 | F. proliferatum | 90.85 ± 10.21 | ND | ND | ND | ND |
| KF 3439 | F. proliferatum | 8.61 ± 0.99 | ND | ND | ND | ND |
| KF 496 | F. proliferatum | ND | ND | 5.48 ± 0.77 | 9.61 ± 1.06 | 12.89 ± 2.11 |
| KF 3363 | F. proliferatum | 45.13 ± 5.56 | ND | ND | ND | ND |
| KF 3382 | F. proliferatum | 3.39 ± 0.35 | ND | ND | ND | ND |
| KF 3584 | F. proliferatum | 291.87 ± 32.65 | ND | 6.39 ± 0.32 | 12.92 ± 2.17 | 19.64 ± 1.18 |
| KF 3558 | F. proliferatum | 78.07 ± 9.47 | ND | 5.82 ± 0.65 | 7.91 ± 0.92 | 10.27 ± 1.32 |
| KF 3654 | F. proliferatum | 76.39 ± 10.15 | ND | ND | 8.26 ± 0.31 | 6.84 ± 0.87 |
| KF 3754 | F. solani | ND | ND | ND | ND | ND |
| KF 3700 | F. sporotrichioides | 8.33 ± 1.11 | ND | ND | ND | ND |
| KF 3728 | F. sporotrichioides | 5.13 ± 0.37 | 12.67 ± 3.76 | ND | 5.99 ± 0.76 | 18.15 ± 3.06 |
| KF 3702 | F. subglutinans | 13.05 ± 2.09 | 20.33 ± 2.88 | ND | 10.74 ± 2.08 | 29.50 ± 4.17 |
| KF 534 | F. temperatum | 18.22 ± 3.44 | 17.65 ± 1.05 | ND | ND | ND |
| KF 506 | F. temperatum | 17.47 ± 2.21 | ND | ND | 15.17 ± 2.22 | 9.88 ± 1.22 |
| KF 1214,2 | F. temperatum | 4.47 ± 0.59 | ND | ND | 6.83 ± 1.21 | 8.10 ± 0.93 |
| KF 3321 | F. temperatum | 290.97 ± 18.62 | 27.79 ± 3.46 | 34.39 ± 2.80 | 39.20 ± 5.07 | 29.21 ± 2.80 |
| KF 3667 | F. temperatum | 11.40 ± 0.98 | ND | ND | ND | ND |
| KF 3701 | F. tricinctum | 1.09 ± 0.29 | ND | 30.49 ± 4.15 | 68.55 ± 5.42 | 21.74 ± 2.56 |
| KF 393 | F. verticillioides | 2.34 ± 0.53 | ND | ND | 8.75 ± 1.85 | 12.43 ± 3.41 |
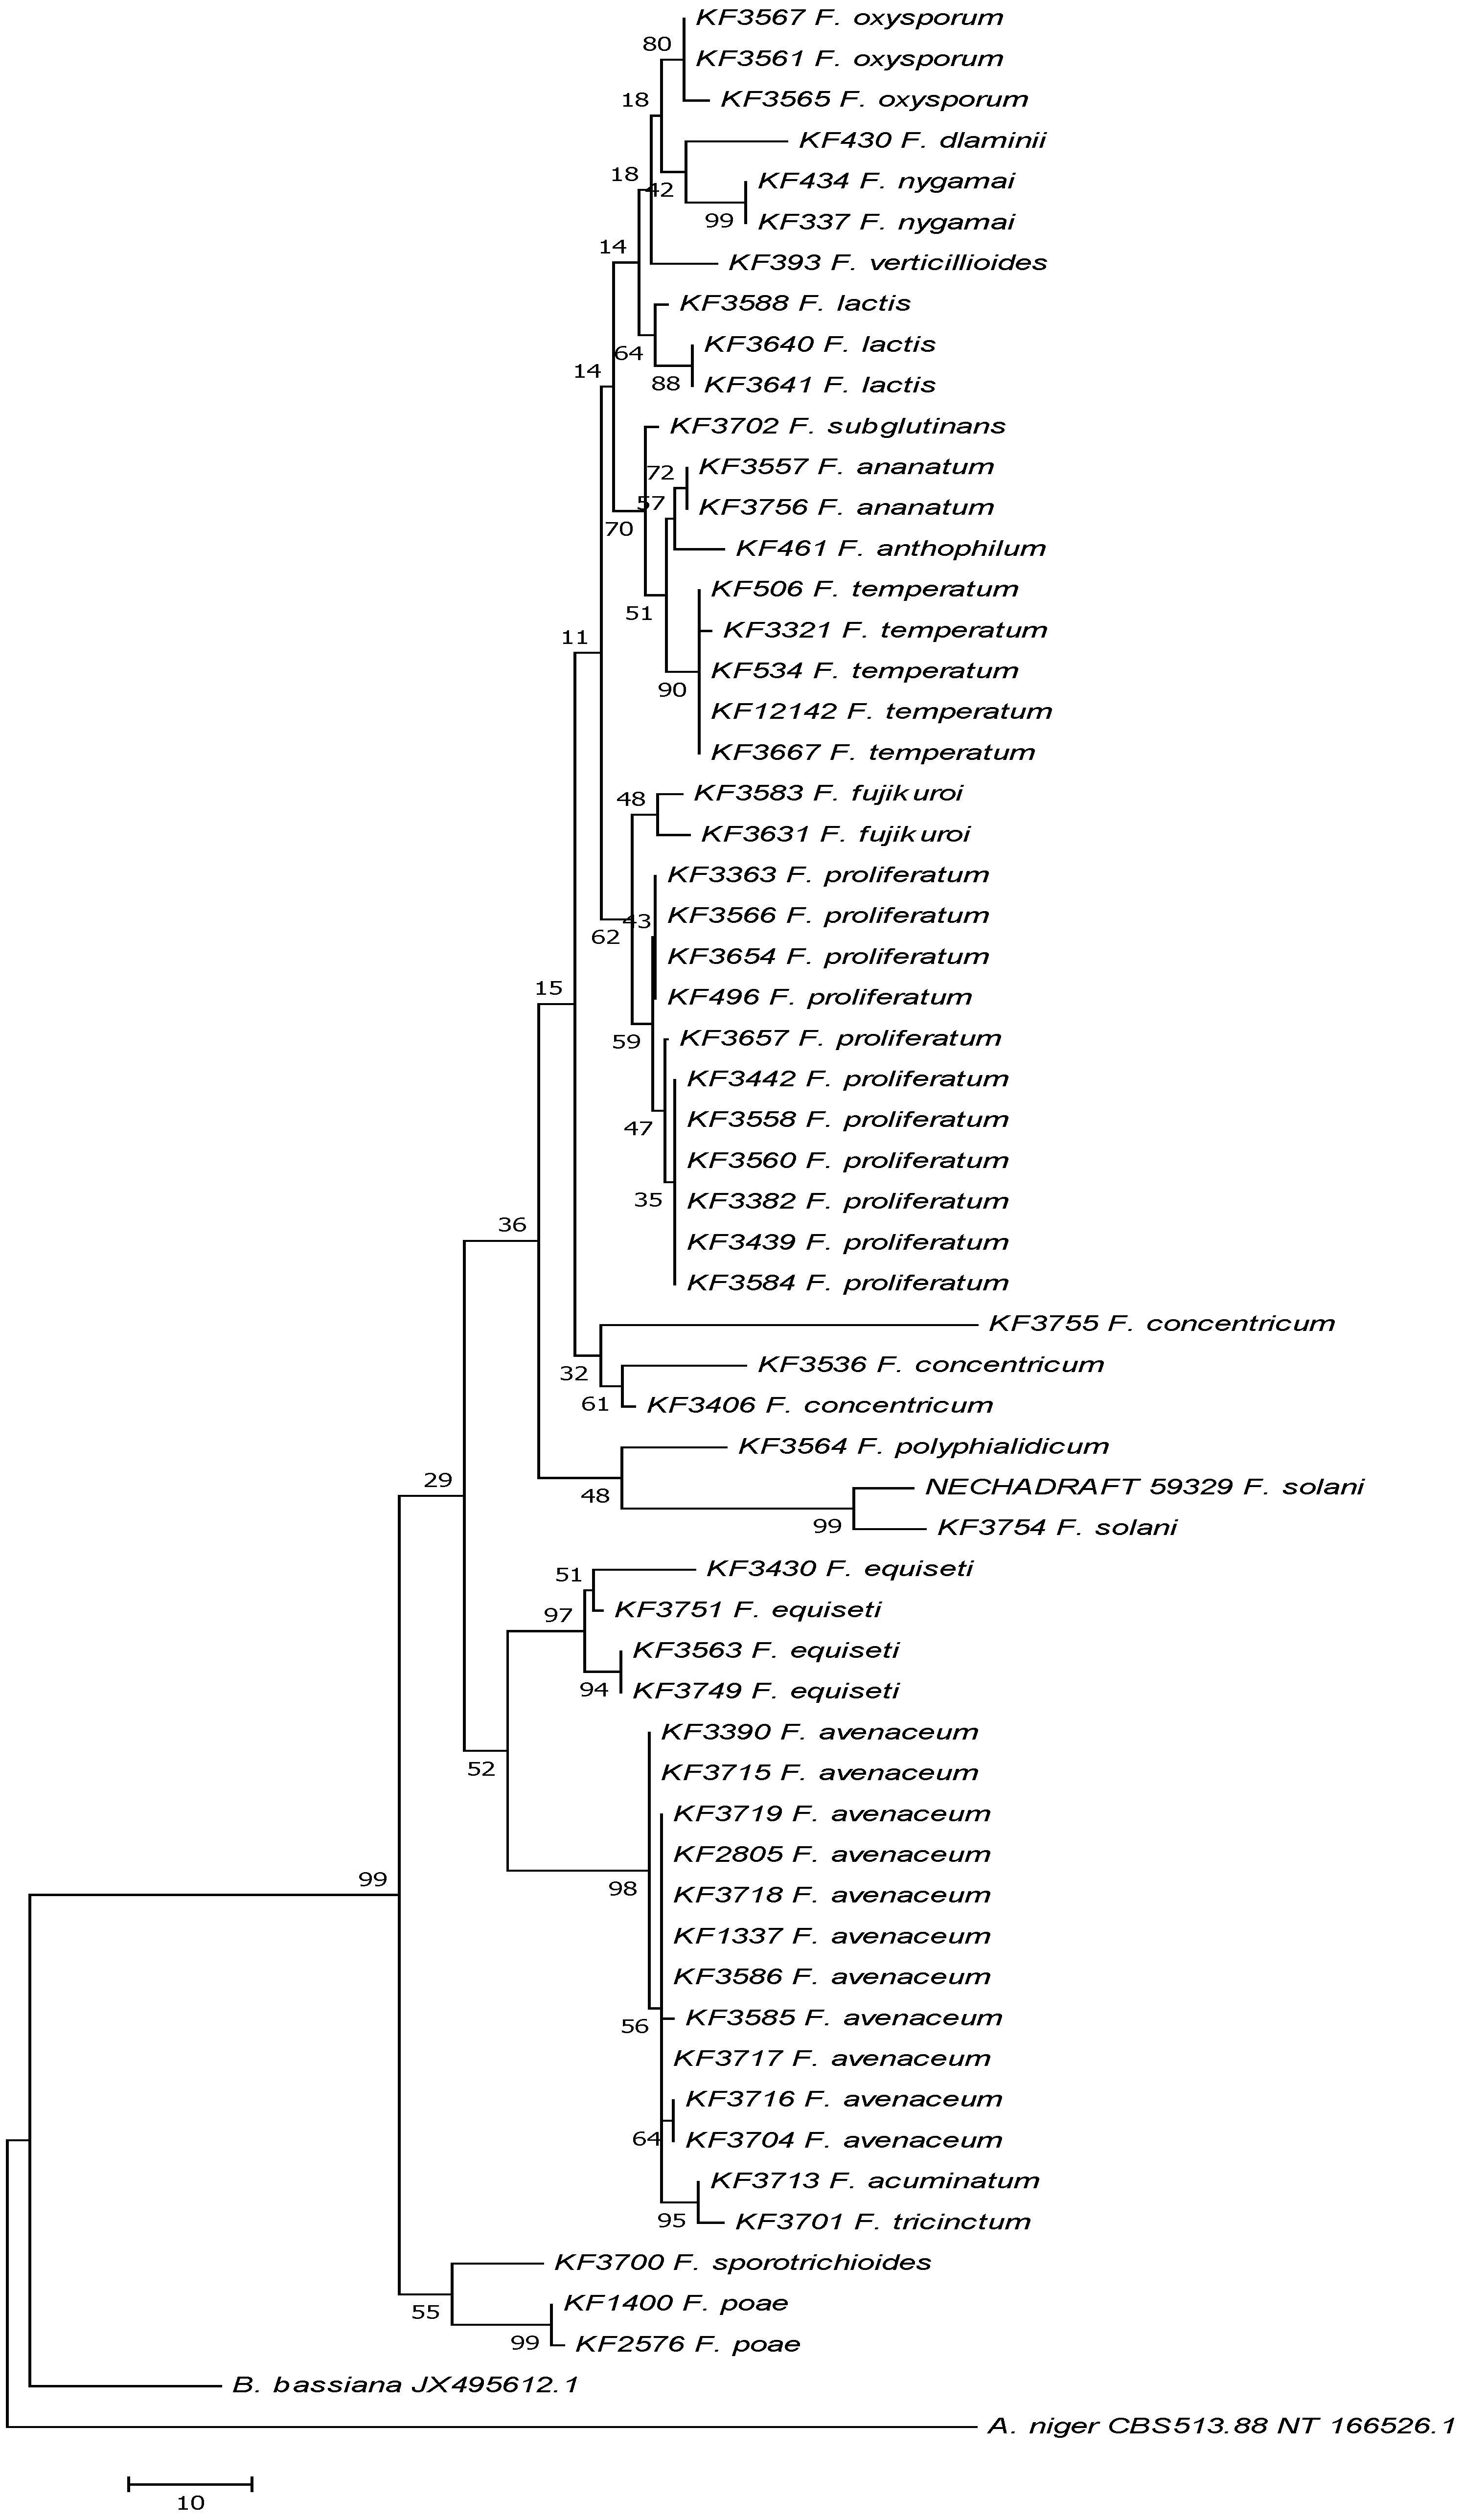
2.4. Enniatin Synthase (esyn1) Gene Divergence
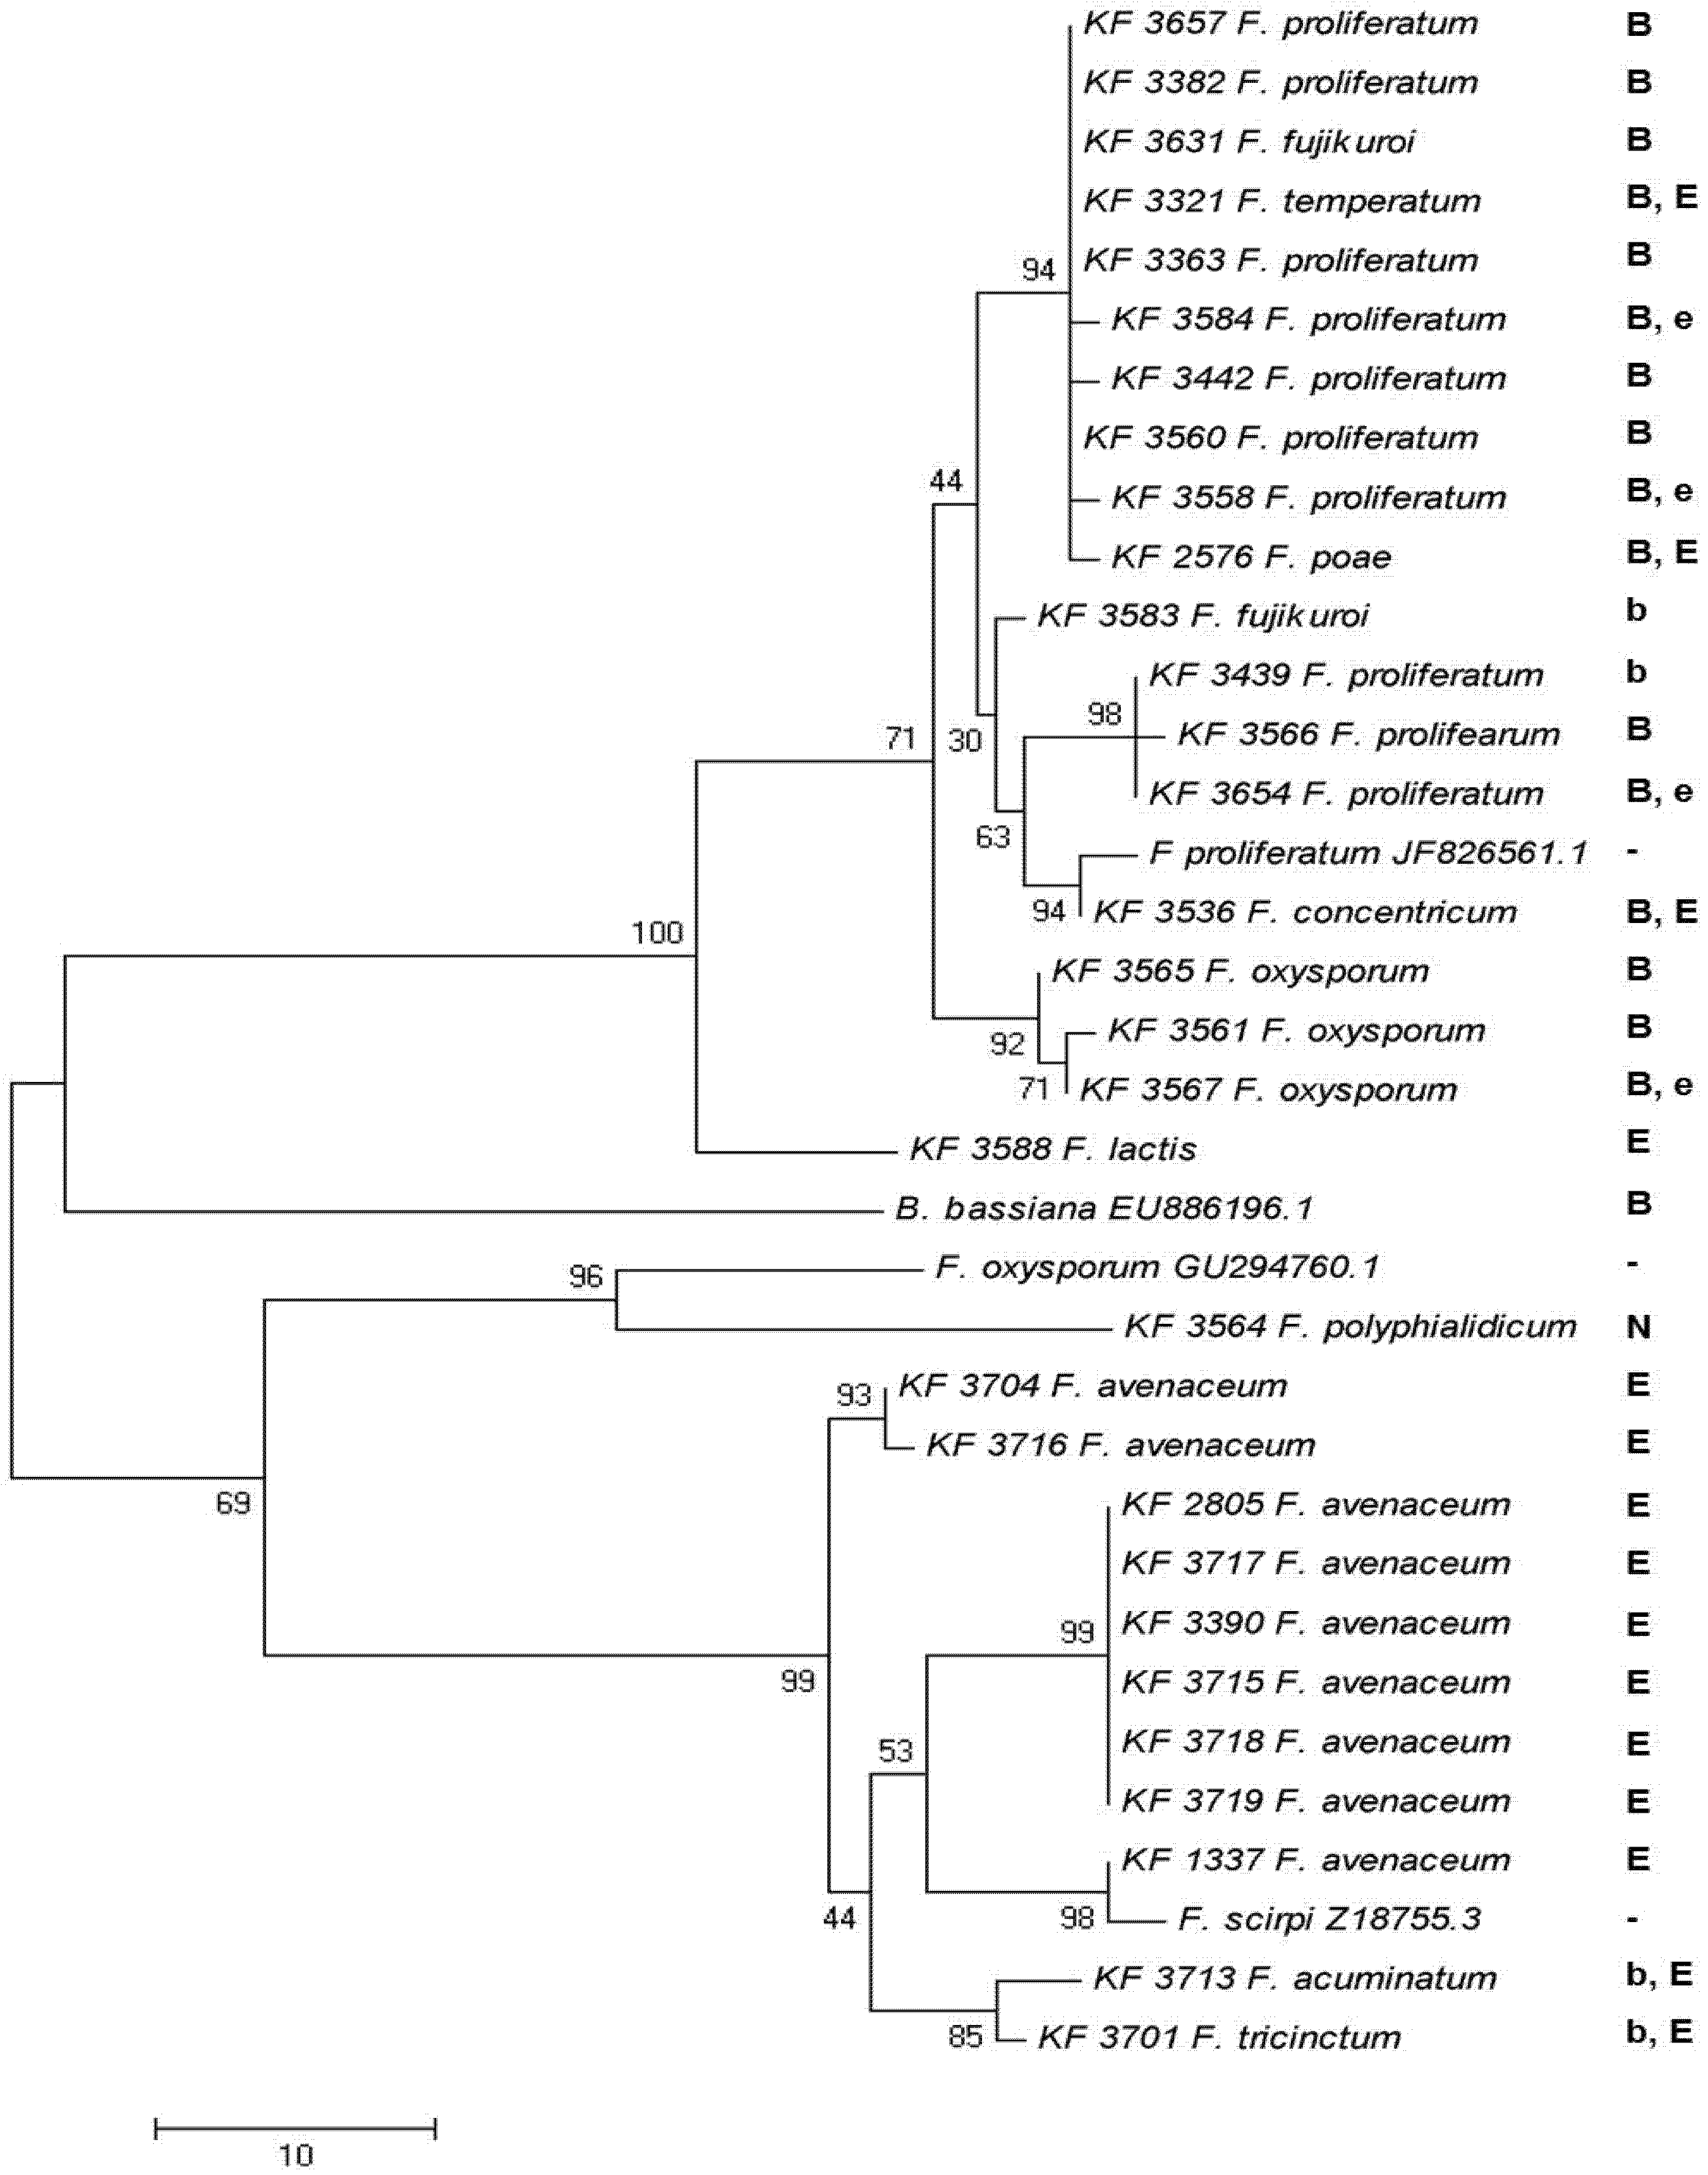
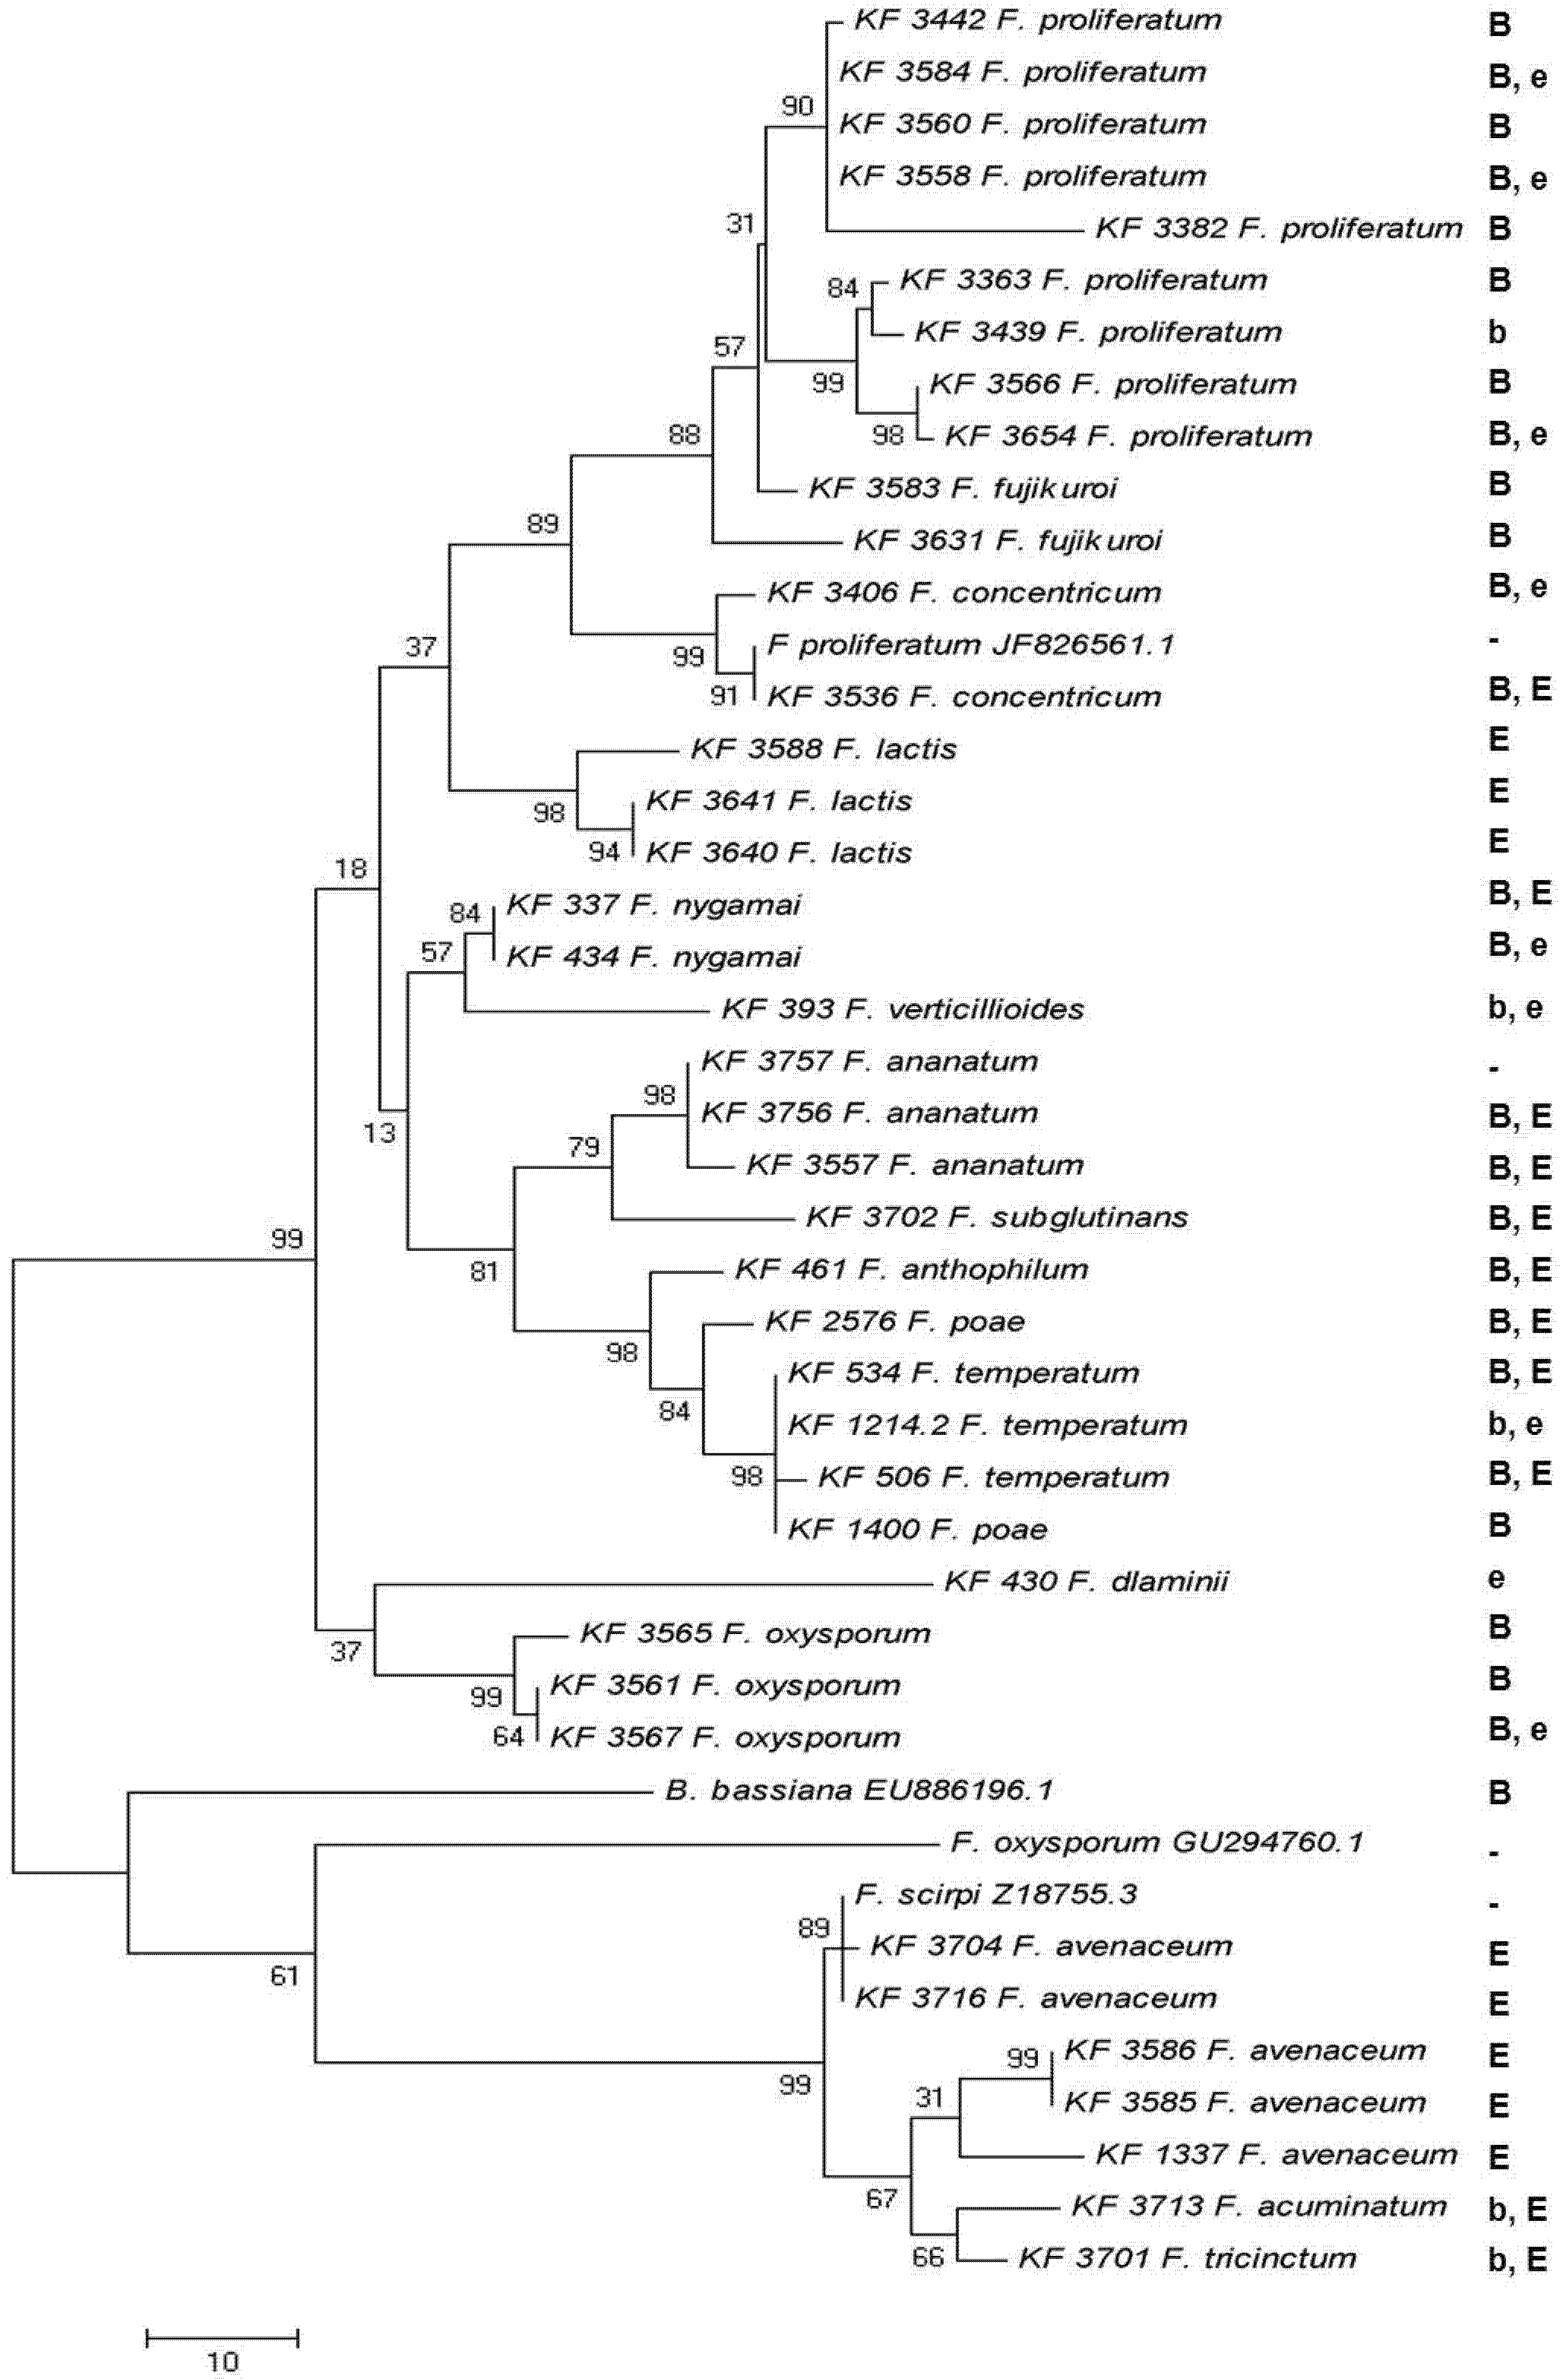
2.5. Toxin Biosynthesis in Relation to the esyn1 Gene Divergence
3. Experimental Section
3.1. Fusarium Strains
3.2. Mycotoxin Analyses
3.2.1. Apparatus
3.2.2. Chemicals
3.2.3. Extraction and Purification
3.2.4. HPLC Analysis and Identification
3.2.5. Method Validation and Recovery Experiment
3.3. DNA Extraction, PCR Primers, Cycling Profiles and DNA Sequencing
| Primer | 5'–3' sequence | Amplicon size (bp) | Reference |
|---|---|---|---|
| Ef728M | CATCGAGAAGTTCGAGAAGG | ~600 | [42,43,44] |
| Tef1R | GCCATCCTTGGAGATACCAGC | ||
| Esyn_1 | GCCGTTGGCGAGCTGGTCAT | 995 | [12] |
| Esyn_2 | GCAAAGCACGCGTCAACGCA | ||
| ES_BeaF | TCTACAGAACWGGHGAYCTTGC | ~750 | This study |
| ES_BeaR | CCYCGCATGCGSACRGCGWARGG | ||
| beas_1 | TKGARCAGCGBCAYGAGACM | 495 | [44] |
| beas_2 | GGWCGRGGGAARTCRGTDGG |
3.4. Sequence Analysis and Phylogeny Reconstruction
4. Conclusions
Acknowledgments
Conflict of Interest
References
- Kvas, M.; Marasas, W.F.O.; Wingfield, B.D.; Wingfield, M.J.; Steenkamp, E.T. Diversity and evolution of Fusarium species in the Gibberella fujikuroi complex. Fungal Divers. 2009, 34, 1–21. [Google Scholar]
- Stępień, Ł.; Chełkowski, J. Fusarium head blight of wheat: Pathogenic species and their mycotoxins. World Mycotox. J. 2010, 3, 107–119. [Google Scholar] [CrossRef]
- Chełkowski, J.; Gromadzka, K.; Stępień, Ł.; Lenc, L.; Kostecki, M.; Berthiller, F. Fusarium species, zearalenone and deoxynivalenol content in preharvest scabby wheat heads from Poland. World Mycotox. J. 2012, 5, 133–41. [Google Scholar]
- Njobeh, P.B.; Dutton, M.F.; Åberg, A.T.; Haggblom, P. Estimation of multi-mycotoxin contamination in South African compound feeds. Toxins 2012, 4, 836–848. [Google Scholar]
- Streit, E.; Schatzmayr, G.; Tassis, P.; Tzika, E.; Marin, D.; Taranu, I.; Tabuc, C.; Nicolau, A.; Aprodu, I.; Puel, O.; et al. Current situation of mycotoxin contamination and co-occurrence in animal feed—Focus on Europe. Toxins 2012, 4, 788–809. [Google Scholar] [CrossRef]
- Miller, J.D. Epidemiology of Fusarium ear diseases of cereals. In Mycotoxins in Grain; Miller, J.D., Trenholm, H.L., Eds.; Eagan Press: St. Paul, MN, USA, 1994; pp. 19–36. [Google Scholar]
- Jestoi, M. Emerging Fusarium mycotoxins: Fusaproliferin, beauvericin, enniatins, and moniliformin—A review. Crit. Rev. Food Sci. Nutr. 2008, 48, 21–49. [Google Scholar] [CrossRef]
- Blais, L.A.; Apsimon, J.W.; Blackwell, B.A.; Greenhalgh, R.; Miller, J.D. Isolation and characterization of enniatins from Fusarium avenaceum Daom-196490. Can. J. Chem. 1992, 70, 1281–1287. [Google Scholar] [CrossRef]
- Jestoi, M.; Paavanen-Huhtala, S.; Parikka, P.; Yli-Mattila, T. In vitro and in vivo mycotoxin production of Fusarium species isolated from Finnish grains. Arch. Phytopathol. Plant Prot. 2007, 41, 545–558. [Google Scholar]
- Scauflaire, J.; Gourgue, M.; Callebaut, A.; Munant, F. Fusarium temperatum, a mycotoxin-producing pathogen of maize. Eur. J. Plant Pathol. 2012, 133, 911–22. [Google Scholar] [CrossRef]
- Somma, S.; Alvarez, C.; Ricci, V.; Ferracane, L.; Ritieni, A.; Logrieco, A.; Moretti, A. Trichothecene and beauvericin mycotoxin production and genetic variability in Fusarium poae isolated from wheat kernels from northern Italy. Food Add. Contam. 2010, 27, 729–737. [Google Scholar] [CrossRef]
- Stępień, Ł.; Jestoi, M.; Chełkowski, J. Cyclic hexadepsipeptides in wheat field samples and esyn1 gene divergence among enniatin producing Fusarium avenaceum strains. World Mycotox. J. 2013. submitted for publication. [Google Scholar]
- Uhlig, S.; Torp, M.; Heier, B.T. Beauvericin and enniatins A, A1, B and B1 in Norwegian grain: A survey. Food Chem. 2006, 94, 193–201. [Google Scholar]
- Vogelgsang, S.; Sulyok, M.; Hecker, A.; Jenny, E.; Krska, R.; Schuhmacher, R.; Forrer, H.R. Toxigenicity and pathogenicity of Fusarium poae and Fusarium avenaceum on wheat. Eur. J. Plant Pathol. 2008, 122, 265–276. [Google Scholar] [CrossRef]
- Waśkiewicz, A.; Goliński, P.; Karolewski, Z.; Irzykowska, L.; Bocianowski, J.; Kostecki, M.; Weber, Z. Formation of fumonisins and other secondary metabolites by Fusarium oxysporum and F. proliferatum: A comparative study. Food Add. Contam. 2010, 27, 608–615. [Google Scholar]
- Jestoi, M.; Rokka, M.; Jarvenpaa, E.; Peltonen, K. Determination of Fusarium mycotoxins beauvericin and enniatins (A, A1, B, B1) in eggs of laying hens using liquid chromatography-tandem mass spectrometry (LC-MS/MS). Food Chem. 2009, 115, 1120–1127. [Google Scholar] [CrossRef]
- Kamyar, M.; Rawnduzi, P.; Studenik, C.R.; Kouri, K.; Lemmens-Gruber, R. Investigation of the electrophysiological properties of enniatins. Arch. Biochem. Biophys. 2004, 429, 215–223. [Google Scholar]
- Fornelli, F.; Minervini, F.; Logrieco, A. Cytotoxicity of fungal metabolites to lepidopteran (Spodoptera frugiperda) cell line (SF-9). J. Invertebr. Pathol. 2004, 85, 74–79. [Google Scholar] [CrossRef]
- Logrieco, A.; Rizzo, A.; Ferracane, R.; Ritieni, A. Occurrence of beauvericin and enniatins in wheat affected by Fusarium avenaceum head blight. Appl. Environ. Microbiol. 2002, 68, 82–85. [Google Scholar]
- Macchia, L.; Caiaffa, M.F.; Fornelli, F.; Cal, L.; Nenna, S.; Moretti, A.; Logrieco, A.; Tursi, A. Apoptosis induced by the Fusarium mycotoxin beauvericin in mammalian cells. J. Appl. Genet. 2002, 43, 363–371. [Google Scholar]
- Lemmens-Gruber, R.; Rachoy, B.; Steininger, E.; Kouri, K.; Saleh, P.; Krska, R.; Josephs, R.; Lemmens, M. The effect of the Fusarium metabolite beauvericin on electromechanical and physiological properties in isolated smooth and heart muscle preparations of guinea pigs. Mycopathologia 2000, 149, 5–12. [Google Scholar] [CrossRef]
- Logrieco, A.; Bottalico, A.; Mulé, G.; Moretti, A.; Perrone, G. Epidemiology of toxigenic fungi and their associated mycotoxins for some Mediterranean crops. Eur. J. Plant Pathol. 2003, 109, 645–667. [Google Scholar] [CrossRef]
- Moretti, A.; Belisario, A.; Tafuri, A.; Ritieni, A.; Corazza, L.; Logrieco, A. Production of beauvericin by different races of Fusarium oxysporum f. sp. melonis, the Fusarium wilt agent of muskmelon. Eur. J. Plant Pathol. 2002, 108, 661–666. [Google Scholar]
- Logrieco, A.; Moretti, A.; Ritieni, A.; Chełkowski, J.; Altomare, C.; Bottalico, A.; Randazzo, G. Natural occurrence of beauvericin in preharvest Fusarium subglutinans infected corn ears in Poland. J. Agric. Food Chem. 1993, 41, 2149–2152. [Google Scholar] [CrossRef]
- Waśkiewicz, A.; Stępień, Ł. Mycotoxins biosynthesized by plant-derived Fusarium isolates. Arch. Indust. Hyg. Toxicol. 2012, 63, 479–488. [Google Scholar]
- Moretti, A.; Logrieco, A.; Bottalico, A.; Ritieni, A.; Randazzo, G.; Corda, P. Beauvericin production by Fusarium subglutinans from different geographical areas. Mycol. Res. 1995, 99, 282–286. [Google Scholar] [CrossRef]
- Meca, G.; Zinedine, A.; Blesa, J.; Font, G.; Manes, J. Further data on the presence of Fusarium emerging mycotoxins enniatins, fusaproliferin and beauvericin in cereals available on the Spanish market. Food Chem. Toxicol. 2010, 48, 1412–1416. [Google Scholar] [CrossRef]
- Sy-Cordero, A.; Pearce, C.J.; Oberlies, N.H. Revisiting the enniatins: A review of their isolation, biosynthesis, structure determination and biological activities. J. Antibiot. 2012, 65, 541–549. [Google Scholar] [CrossRef]
- Uhlig, S.; Ivanova, L.; Petersen, D.; Kristensen, R. Structural studies on minor enniatins from Fusarium sp. VI 03441: Novel N-methyl-threonine containing enniatins. Toxicon 2009, 53, 734–742. [Google Scholar]
- Tomoda, H.; Huang, X.H.; Nishida, H.; Nagao, R.; Okuda, S.; Tanaka, H.; Omura, S.; Arai, H.; Inoue, K. Inhibition of acyl-CoA: Cholesterol acyltransferase activity by cyclodepsipeptide antibiotics. J. Antibiot. 1992, 45, 1626–1632. [Google Scholar] [CrossRef]
- Gammelsrud, A.; Solhaug, A.; Dendele, B.; Sandberg, W.J.; Ivanova, L.; Bolling, A.K.; Lagadic-Gossmann, D.; Refsnes, R.; Becher, R.; Eriksen, G.; et al. Enniatin B-induced cell death and inflammatory responses in RAW 267.4 murine macrophages. Toxicol. Appl. Pharmacol. 2012, 261, 74–87. [Google Scholar] [CrossRef]
- Watjen, W.; Debbab, A.; Hohlfeld, A.; Chovolou, Y.; Kampkötter, A.; Edrada, R.A.; Ebel, R.; Hakiki, A.; Mosaddak, M.; Totzke, F.; et al. Enniatins A1, B and B1 from an endophytic strain of Fusarium tricinctum induce apoptotic cell death in H4IIE hepatoma cells accompanied by inhibition of ERK phosphorylation. Mol. Nutr. Food Res. 2009, 53, 431–440. [Google Scholar] [CrossRef]
- Herrmann, M.; Zocher, R.; Haese, A. Enniatin production by Fusarium strains and its effect on potato tuber tissue. Appl. Environ. Microbiol. 1996, 62, 393–398. [Google Scholar]
- Kulik, T.; Pszczółkowska, A.; Fordoński, G.; Olszewski, J. PCR approach based on the esyn1 gene for the detection of potential enniatin-producing Fusarium species. Int. J. Food Microbiol. 2007, 116, 319–324. [Google Scholar] [CrossRef]
- Nicholson, P.; Simpson, D.R.; Wilson, A.H.; Chandler, E.; Thomsett, M. Detection and differentiation of trichothecene and enniatin-producing Fusarium species on small-grain cereals. Eur. J. Plant Pathol. 2004, 110, 503–514. [Google Scholar] [CrossRef]
- Xu, Y.; Orozco, R.; Wijeratne, E.M.; Gunatilaka, A.A.; Stock, S.P.; Molnár, I. Biosynthesis of the cyclooligomer depsipeptide beauvericin, a virulence factor of the entomopathogenic fungus Beauveria bassiana. Chem. Biol. 2008, 15, 898–907. [Google Scholar] [CrossRef]
- Zhang, T.; Jia, X.; Zhuo, Y.; Liu, M.; Gao, H.; Liu, J.; Zhang, L. Cloning and characterization of a novel 2-ketoisovalerate reductase from the beauvericin producer Fusarium proliferatum LF061. BMC Biotechnol. 2012, 12, 55. [Google Scholar]
- Chełkowski, J.; Ritieni, A.; Wiśniewska, H.; Mulè, G.; Logrieco, A. Occurrence of toxic hexadepsipeptides in preharvest maize ear rot infected by Fusarium poae in Poland. J. Phytopathol. 2007, 155, 8–12. [Google Scholar] [CrossRef]
- Jestoi, M.; Rokka, M.; Yli-Mattila, T.; Parikka, P.; Rizzo, A.; Poltonen, K. Presence and concentrations of the Fusarium-related mycotoxins beauvericin, enniatins and moniliformin in finnish grain samples. Food Add. Contam. 2004, 21, 794–802. [Google Scholar] [CrossRef]
- Chandler, E.A.; Simpson, D.R.; Thomsett, M.A.; Nicholson, P. Development of PCR assays to Tri7 and Tri13 trichothecene biosynthetic genes, and characterization of chemotypes of Fusarium graminearum, Fusarium culmorum and Fusarium cerealis. Physiol. Mol. Plant Pathol. 2003, 62, 355–367. [Google Scholar] [CrossRef]
- Niessen, L.; Vogel, R.F. Group specific PCR-detection of potential trichothecene-producing Fusarium species in pure cultures and cereal samples. Syst. Appl. Microbiol. 1998, 21, 618–631. [Google Scholar] [CrossRef]
- Stępień, Ł.; Koczyk, G.; Waśkiewicz, A. FUM cluster divergence in fumonisins-producing Fusarium species. Fungal Biol. 2011, 115, 112–123. [Google Scholar] [CrossRef]
- Stępień, Ł.; Koczyk, G.; Waśkiewicz, A. Genetic and phenotypic variation of Fusarium proliferatum isolates from different host species. J. Appl. Genet. 2011, 52, 487–96. [Google Scholar] [CrossRef]
- Stępień, Ł.; Gromadzka, K.; Chełkowski, J. Polymorphism of mycotoxin biosynthetic genes among Fusarium equiseti isolates from Italy and Poland. J. Appl. Genet. 2012, 53, 227–36. [Google Scholar] [CrossRef]
- Geiser, D.M.; der mar Jimenez-Gasco, M.; Kang, S.; Makalowska, I.; Veeraraghavan, N.; Ward, T.J.; Zhang, N.; Kuldau, G.A.; O’Donnell, K. FUSARIUM-ID v.1.0: A DNA sequence database for identifying Fusarium. Eur. J. Plant Pathol. 2004, 110, 473–479. [Google Scholar]
- Jurado, M.; Marin, P.; Callejas, C.; Moretti, A.; Vazquez, C.; Gonzalez-Jaen, M.T. Genetic variability and fumonisin production by Fusarium proliferatum. Food Microbiol. 2010, 27, 50–57. [Google Scholar] [CrossRef]
- Kristensen, R.; Torp, M.; Kosiak, B.; Holst-Jensen, A. Phylogeny and toxigenic potential is correlated in Fusarium species as revealed by partial translation elongation factor 1 alpha gene sequences. Mycol. Res. 2005, 109, 173–186. [Google Scholar] [CrossRef]
- O’Donnell, K.; Cigelnik, E.; Nirenberg, H.I. Molecular systematics and phylogeography of the Gibberella fujikuroi species complex. Mycologia 1998, 90, 465–493. [Google Scholar] [CrossRef]
- O’Donnell, K.; Ward, T.J.; Geiser, D.M.; Kistler, H.C.; Aoki, T. Genealogical concordance between the mating type locus and seven other nuclear genes supports formal recognition of nine phylogenetically distinct species within the Fusarium graminearum clade. Fungal Genet. Biol. 2004, 41, 600–623. [Google Scholar] [CrossRef]
- Punja, Z.K.; Wan, A.; Rahman, M.; Goswami, R.S.; Barasubiye, T.; Seifert, K.A.; Lévesque, C.A. Growth, population dynamics, and diversity of Fusarium equiseti in ginseng fields. Eur. J. Plant Pathol. 2008, 121, 173–184. [Google Scholar] [CrossRef]
- Kulik, T.; Pszczółkowska, A.; Łojko, M. Multilocus phylogenetics show high intraspecific variability within Fusarium avenaceum. Int. J. Mol. Sci. 2011, 12, 5626–40. [Google Scholar] [CrossRef]
- De Oliveira, R.L.; Reis, G.M.; da Silva, V.N.; Braghini, R.; Teixeira, M.M.; Corrêa, B. Molecular characterization and fumonisin production by Fusarium verticillioides isolated from corn grains of different geographic origins in Brazil. Int. J. Food Microbiol. 2011, 145, 9–21. [Google Scholar] [CrossRef]
- Watanabe, M.; Yonezawa, T.; Lee, K.-I.; Kumagai, S.; Sugita-Konishi, Y.; Goto, K.; Hara-Kudo, Y. Molecular phylogeny of the higher and lower taxonomy of the Fusarium genus and differences in the evolutionary histories of multiple genes. BMC Evol. Biol. 2011, 11, 322. [Google Scholar]
- Von Bargen, S.; Martinez, O.; Schadock, I.; Eisold, A.M.; Gossmann, M.; Buttner, C. Genetic variability of phytopathogenic Fusarium proliferatum associated with crown rot in Asparagus officinalis. J. Phytopathol. 2009, 157, 446–456. [Google Scholar] [CrossRef]
- Waśkiewicz, A.; Stępień, Ł.; Wilman, K.; Kachlicki, P. Diversity of pea-associated F. proliferatum and F. verticillioides populations revealed by FUM1 sequence analysis and fumonisin biosynthesis. Toxins 2013, 5, 488–503. [Google Scholar]
- Kulik, T.; Pszczółkowska, A. Multilocus sequence analysis of Fusarium poae. J. Plant Pathol. 2011, 93, 119–126. [Google Scholar]
- Stępień, Ł.; Chełkowski, J.; Wenzel, G.; Mohler, V. Combined use of linked markers for genotyping the Pm1 locus in common wheat. Cell. Mol. Biol. Lett. 2004, 9, 819–827. [Google Scholar]
- Błaszczyk, L.; Goyeau, H.; Huang, X.; Röder, M.; Stępień, Ł.; Chełkowski, J. Identification of leaf rust resistance genes and mapping gene Lr37 on microsatellite map of wheat. Cell Mol. Biol. Lett. 2004, 9, 805–817. [Google Scholar]
- Tamura, K.; Dudley, J.; Nei, M.; Kumar, S. MEGA4: Molecular evolutionary genetics analysis (MEGA) software version 4.0. Mol. Biol. Evol. 2007, 24, 1596–1599. [Google Scholar] [CrossRef]
© 2013 by the authors; licensee MDPI, Basel, Switzerland. This article is an open access article distributed under the terms and conditions of the Creative Commons Attribution license (http://creativecommons.org/licenses/by/3.0/).
Share and Cite
Stępień, Ł.; Waśkiewicz, A. Sequence Divergence of the Enniatin Synthase Gene in Relation to Production of Beauvericin and Enniatins in Fusarium Species. Toxins 2013, 5, 537-555. https://doi.org/10.3390/toxins5030537
Stępień Ł, Waśkiewicz A. Sequence Divergence of the Enniatin Synthase Gene in Relation to Production of Beauvericin and Enniatins in Fusarium Species. Toxins. 2013; 5(3):537-555. https://doi.org/10.3390/toxins5030537
Chicago/Turabian StyleStępień, Łukasz, and Agnieszka Waśkiewicz. 2013. "Sequence Divergence of the Enniatin Synthase Gene in Relation to Production of Beauvericin and Enniatins in Fusarium Species" Toxins 5, no. 3: 537-555. https://doi.org/10.3390/toxins5030537