Article

Impact of Mycotoxins Secreted by Aspergillus Molds on the Inflammatory Response of Human Corneal Epithelial Cells

1
Environmental Epidemiology Unit, Paris-Descartes University, Sorbonne Paris Cité, EA 4064, 75006 Paris, France
2
Viral Neuroimmunology Unit, Pasteur Institute, 75015 Paris, France
3
Laboratory of Biochemistry, Bichat University Hospital, AP-HP, 75018 Paris, France
4
Laboratory of Parasitology-Mycology, Saint-Louis University Hospital, AP-HP and Paris-Diderot University, Sorbonne Paris Cité, 75010 Paris, France
*
Author to whom correspondence should be addressed.
These authors contributed equally to this work.
Toxins 2017, 9(7), 197; https://doi.org/10.3390/toxins9070197
Submission received: 30 March 2017 / Revised: 17 June 2017 / Accepted: 19 June 2017 / Published: 22 June 2017
(This article belongs to the Collection Aflatoxins)

Abstract

:
Exposure to molds and mycotoxins not only contributes to the onset of respiratory disease, it also affects the ocular surface. Very few published studies concern the evaluation of the effect of mycotoxin exposure on ocular cells. The present study investigates the effects of aflatoxin B1 (AFB1) and gliotoxin, two mycotoxins secreted by Aspergillus molds, on the biological activity of the human corneal epithelial (HCE) cells. After 24, 48, and 72 h of exposure, cellular viability and inflammatory response were assessed. Both endpoint cell viability colorimetric assays and continuous cell impedance measurements, providing noninvasive real-time assessment of the effect on cells, were performed. Cytokine gene expression and interleukin-8 release were quantified. Gliotoxin appeared more cytotoxic than AFB1 but, at the same time, led to a lower increase of the inflammatory response reflecting its immunosuppressive properties. Real-time cell impedance measurement showed a distinct profile of cytotoxicity for both mycotoxins. HCE cells appeared to be a well-suited in vitro model to study ocular surface reactivity following biological contaminant exposure. Low, but persistent inflammation, caused by environmental factors, such as fungal toxins, leads to irritation and sensitization, and could be responsible for allergic manifestations which, in turn, could lead to mucosal hyper-reactivity.

1. Introduction

Mycotoxins are common contaminants of agricultural crops produced by several genera of fungi, such as Aspergillus molds, in response to both intrinsic and extrinsic factors, such as, respectively, toxigenic status of fungi and temperature and humidity [1]. These toxins can enter into the food chain, leading to adverse effects on animal and human health at low concentrations [2]. The United Nations-affiliated Food and Agriculture Organization has assessed that an average of 25% of global agricultural commodities may be contaminated with mycotoxins [3].
Fungi and their mycotoxins are ubiquitous in the environment and, once produced, these contaminants are adsorbed onto airborne dusts, leading to major public health issues. Mycotoxin toxicity via the ingestion route has been extensively studied [4,5,6,7], such as aflatoxins that play an important role in the development of hepatocellular carcinoma [5,8]. The respiratory route has been recognized in the past two decades as an important route of exposure, especially for workers in corn storage facilities and in animal farms [9,10,11]. Indeed, some studies have established an association between low-level exposure to molds and mycotoxins, and asthma or chronic airway inflammation, especially among workers in an agricultural setting [9,12]. Such exposure is related to the onset of farmers’ lung disease [13], hypersensitivity pneumonia, and allergic bronchopulmonary aspergillosis [14]. Molds belonging to the Aspergillus genus and producing mycotoxins, such as aflatoxins or gliotoxin, contribute to the onset of respiratory diseases by the exposure of nasal, bronchial, and alveolar epithelia. This type of exposure also concerns the ocular surface, leading to irritations or allergic manifestations [15].
In common with epidemiological and clinical studies, toxicological studies are traditionally based on animal tests. However the 3R principles that promote alternatives to animal experimentation are now particularly encouraged and in vitro studies using cell culture are usually implemented in toxicology [16]. Most in vitro studies aiming at assessing the impact of mycotoxins have used alveolar, bronchial, or nasal epithelial cells [17,18], whereas only very few studies have used ocular epithelial cells to explore house dust-induced toxicity [19,20] and, to our knowledge, no study has explored mycotoxin-induced toxicity on ocular epithelial cells.
To test the impact of the exposure of the ocular surface to mycotoxins, we assessed the effects of two mycotoxins produced by Aspergillus molds, aflatoxin B1 (AFB1), and gliotoxin on human corneal epithelial (HCE) cells.

2. Results

In order to evaluate the effects of AFB1 and gliotoxin on the ocular cells (HCE), we conducted two experimental approaches. In a first approach, using classical in vitro assays, both cellular viability and inflammatory response, interleukin-8 (IL-8) release, and gene expression quantification of seven inflammatory markers were assessed at different times and concentrations of mycotoxins. In a second approach, real-time monitoring of cellular impedance reflecting the kinetics of toxicity was implemented using xCelligence technology.

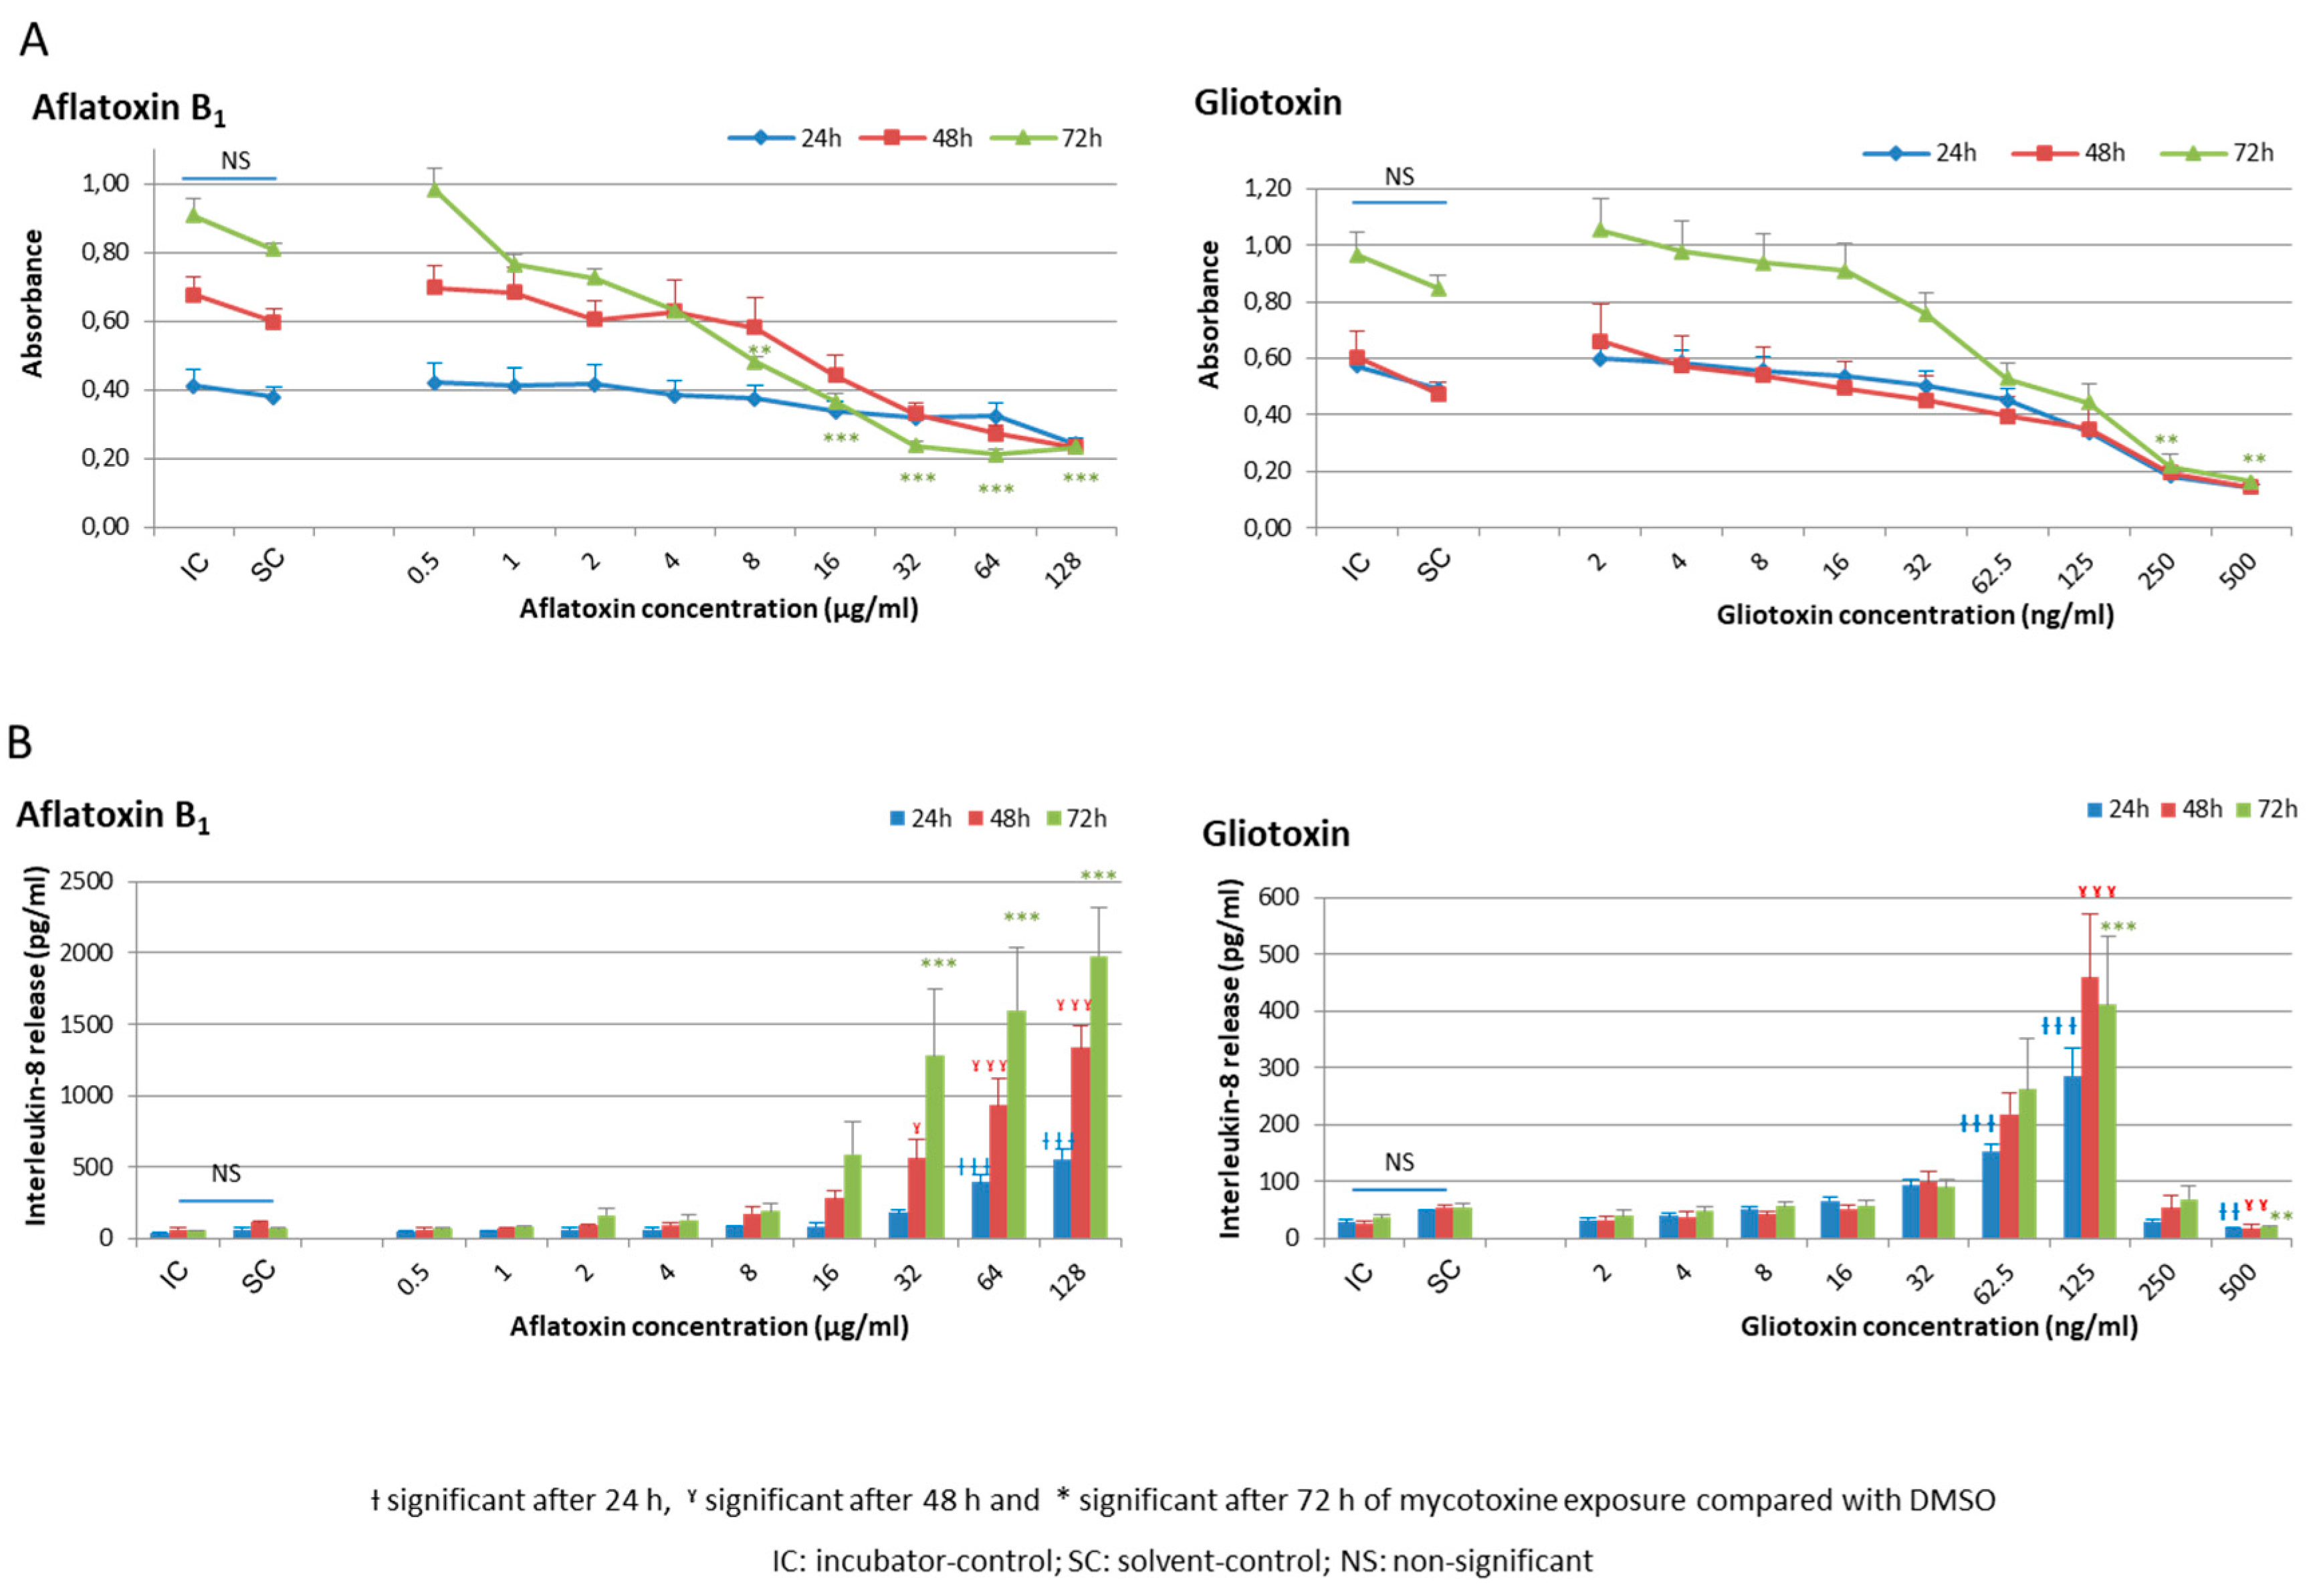
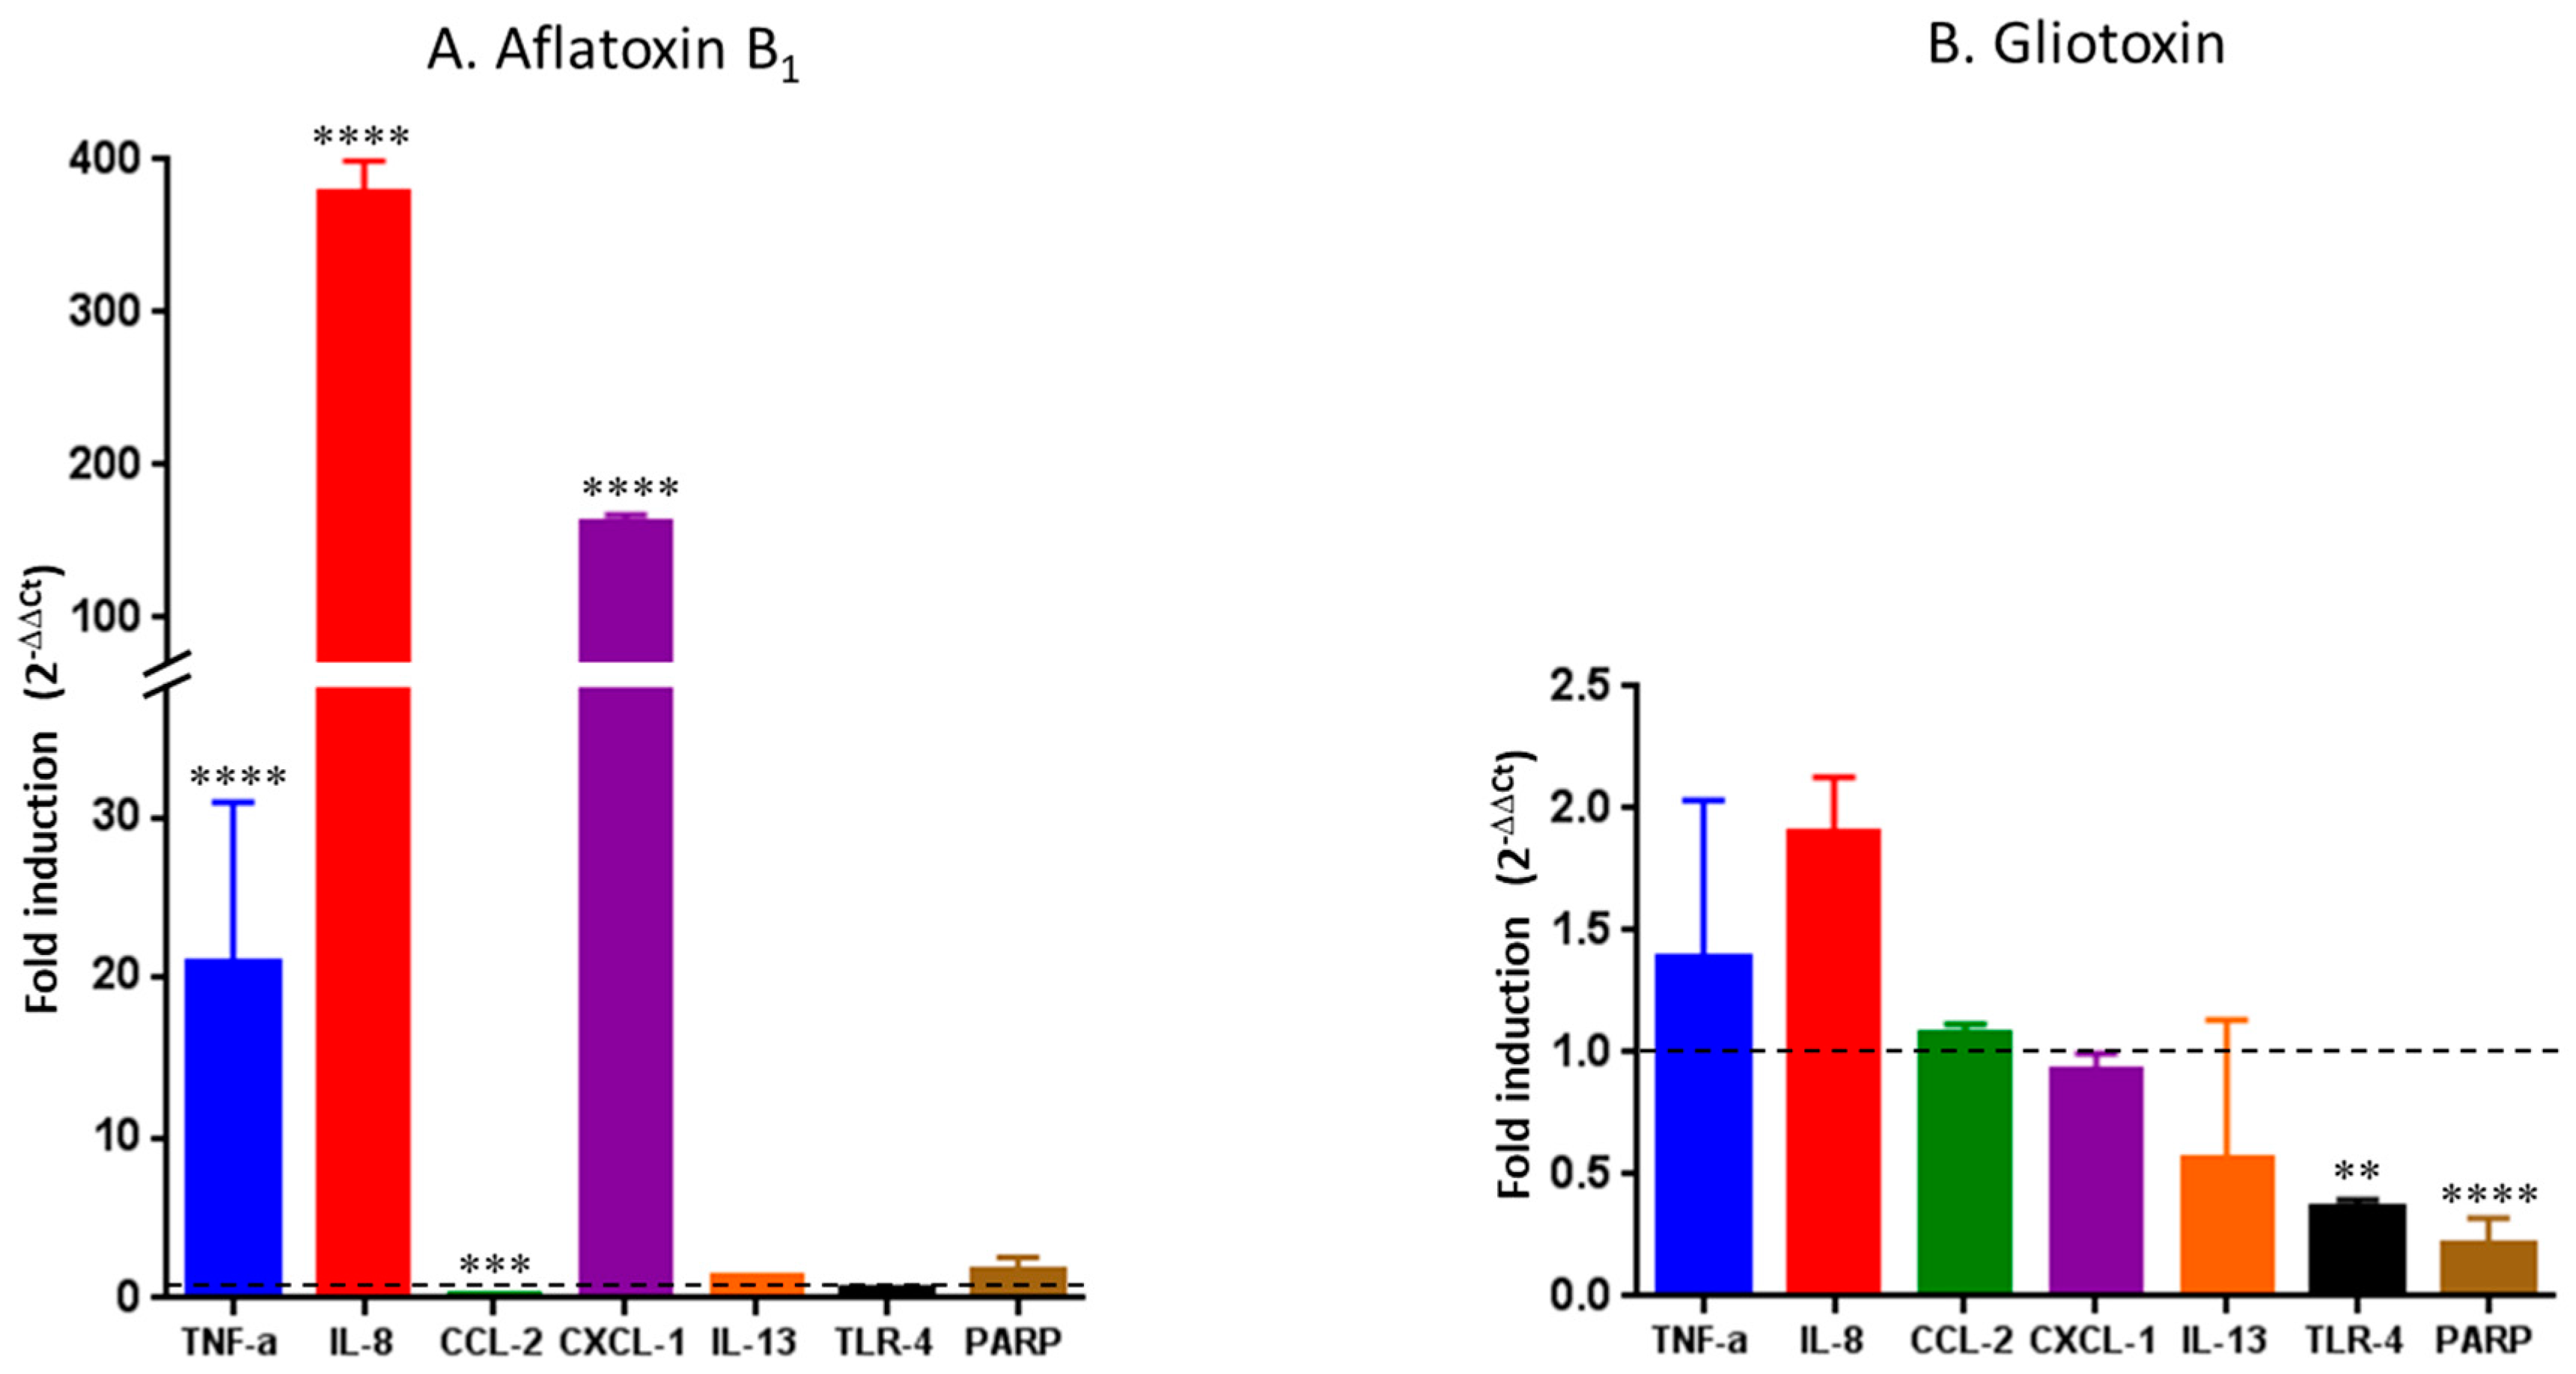
2.1. Cellular Viability and Inflammatory Response of HCE Cells after AFB1 and Gliotoxin Exposures

Seventy-two hours after seeding, HCE cells were exposed to various concentrations of AFB1 (from 0.5 to 128 µg/mL) and gliotoxin (from 2 to 500 ng/mL) for 24, 48, or 72 h. After these exposure times, a 3-(4,5-dimethyl-2-thiazolyl)-2,5-diphenyl-2H-tetrazolium bromide (MTT) test was performed on cell monolayer in order to assess cellular viability, and IL-8 secretion was quantified in culture medium to evaluate the inflammatory response. The two controls, solvent-control (DMSO) and incubator-control, were performed under the same experimental conditions.
No effect on both cellular viability and inflammatory response was observed after DMSO exposure compared with the incubator-control (Figure 1 and Figure S1).
Concerning AFB1, no decrease of cellular viability was observed after 24 h of exposure whatever the concentration tested. After 72 h of exposure, a significant reduction in cell viability compared with solvent-control was seen for the 8 µg/mL concentration and beyond (Figure 1A).
Concerning gliotoxin, a progressive decrease in cellular viability was observed, which became significant after 24 h and 72 h exposure at 250 and 500 ng/mL, respectively (Figure 1A).
For more clarity, cellular viability results expressed as absorbances in Figure 1A to better represent the growth kinetics between 24, 48, and 72 h of culture and for a better statistical approach are also expressed as the percentage of viability compared to the solvent-control in Figure S2.
After 48 and 72 h of exposure, a significant increase in IL-8 release was observed at concentrations of 32 µg/mL and 62.5 ng/mL, respectively, for AFB1 and gliotoxin (Figure 1B). The high toxicity noted with the MTT test after gliotoxin exposure at 250 and 500 ng/mL was confirmed with a dramatic drop of cytokine release (Figure 1B).
The gene expression of seven pro-inflammatory markers produced by HCE cells was quantified after 48 h of exposure to AFB1 and gliotoxin, respectively, at 16 µg/mL and 125 ng/mL. These two concentrations were chosen because they were associated with a significant increase of IL-8 secretion with a moderate decrease in cellular viability. Solvent-control and incubator-control were conducted under the same experimental conditions. DMSO exposure did not affect gene expression when compared to incubator-control (data not shown).
Exposure to AFB1 at 16 µg/mL induced a significant and marked increase in IL-8, C-X-C motif chemokine ligand 1 (CXCL-1), and tumor necrosis factor-α (TNF-α) gene expression (p < 0.0001) with, respectively, 380-fold, 160-fold, and 21-fold inductions, and a significant 0.26-fold decrease in the C-C motif chemokine ligand 2 (CCL-2) gene expression (p = 0.0002). The gene expression of the other cytokines of interest (interleukin-13 (IL-13), Toll-like receptor 4 (TLR-4), and poly (ADP-ribose) polymerase (PARP)) was not affected (Figure 2A).
Exposure to gliotoxin at 125 ng/mL induced a non-significant slight increase in IL-8 and TNF-α gene expression with, respectively, 1.9-fold and 1.4-fold inductions, and a significant decrease in TLR-4 (p = 0.0041) and PARP (p < 0.0001) gene expression. The gene expression of CCL-2, CXCL-1, and IL-13 was not affected by gliotoxin exposure (Figure 2B).
Globally, IL-8 and TNF-α gene expression was respectively 200-and 15-times higher after AFB1 exposure than after gliotoxin exposure (p < 0.0001).

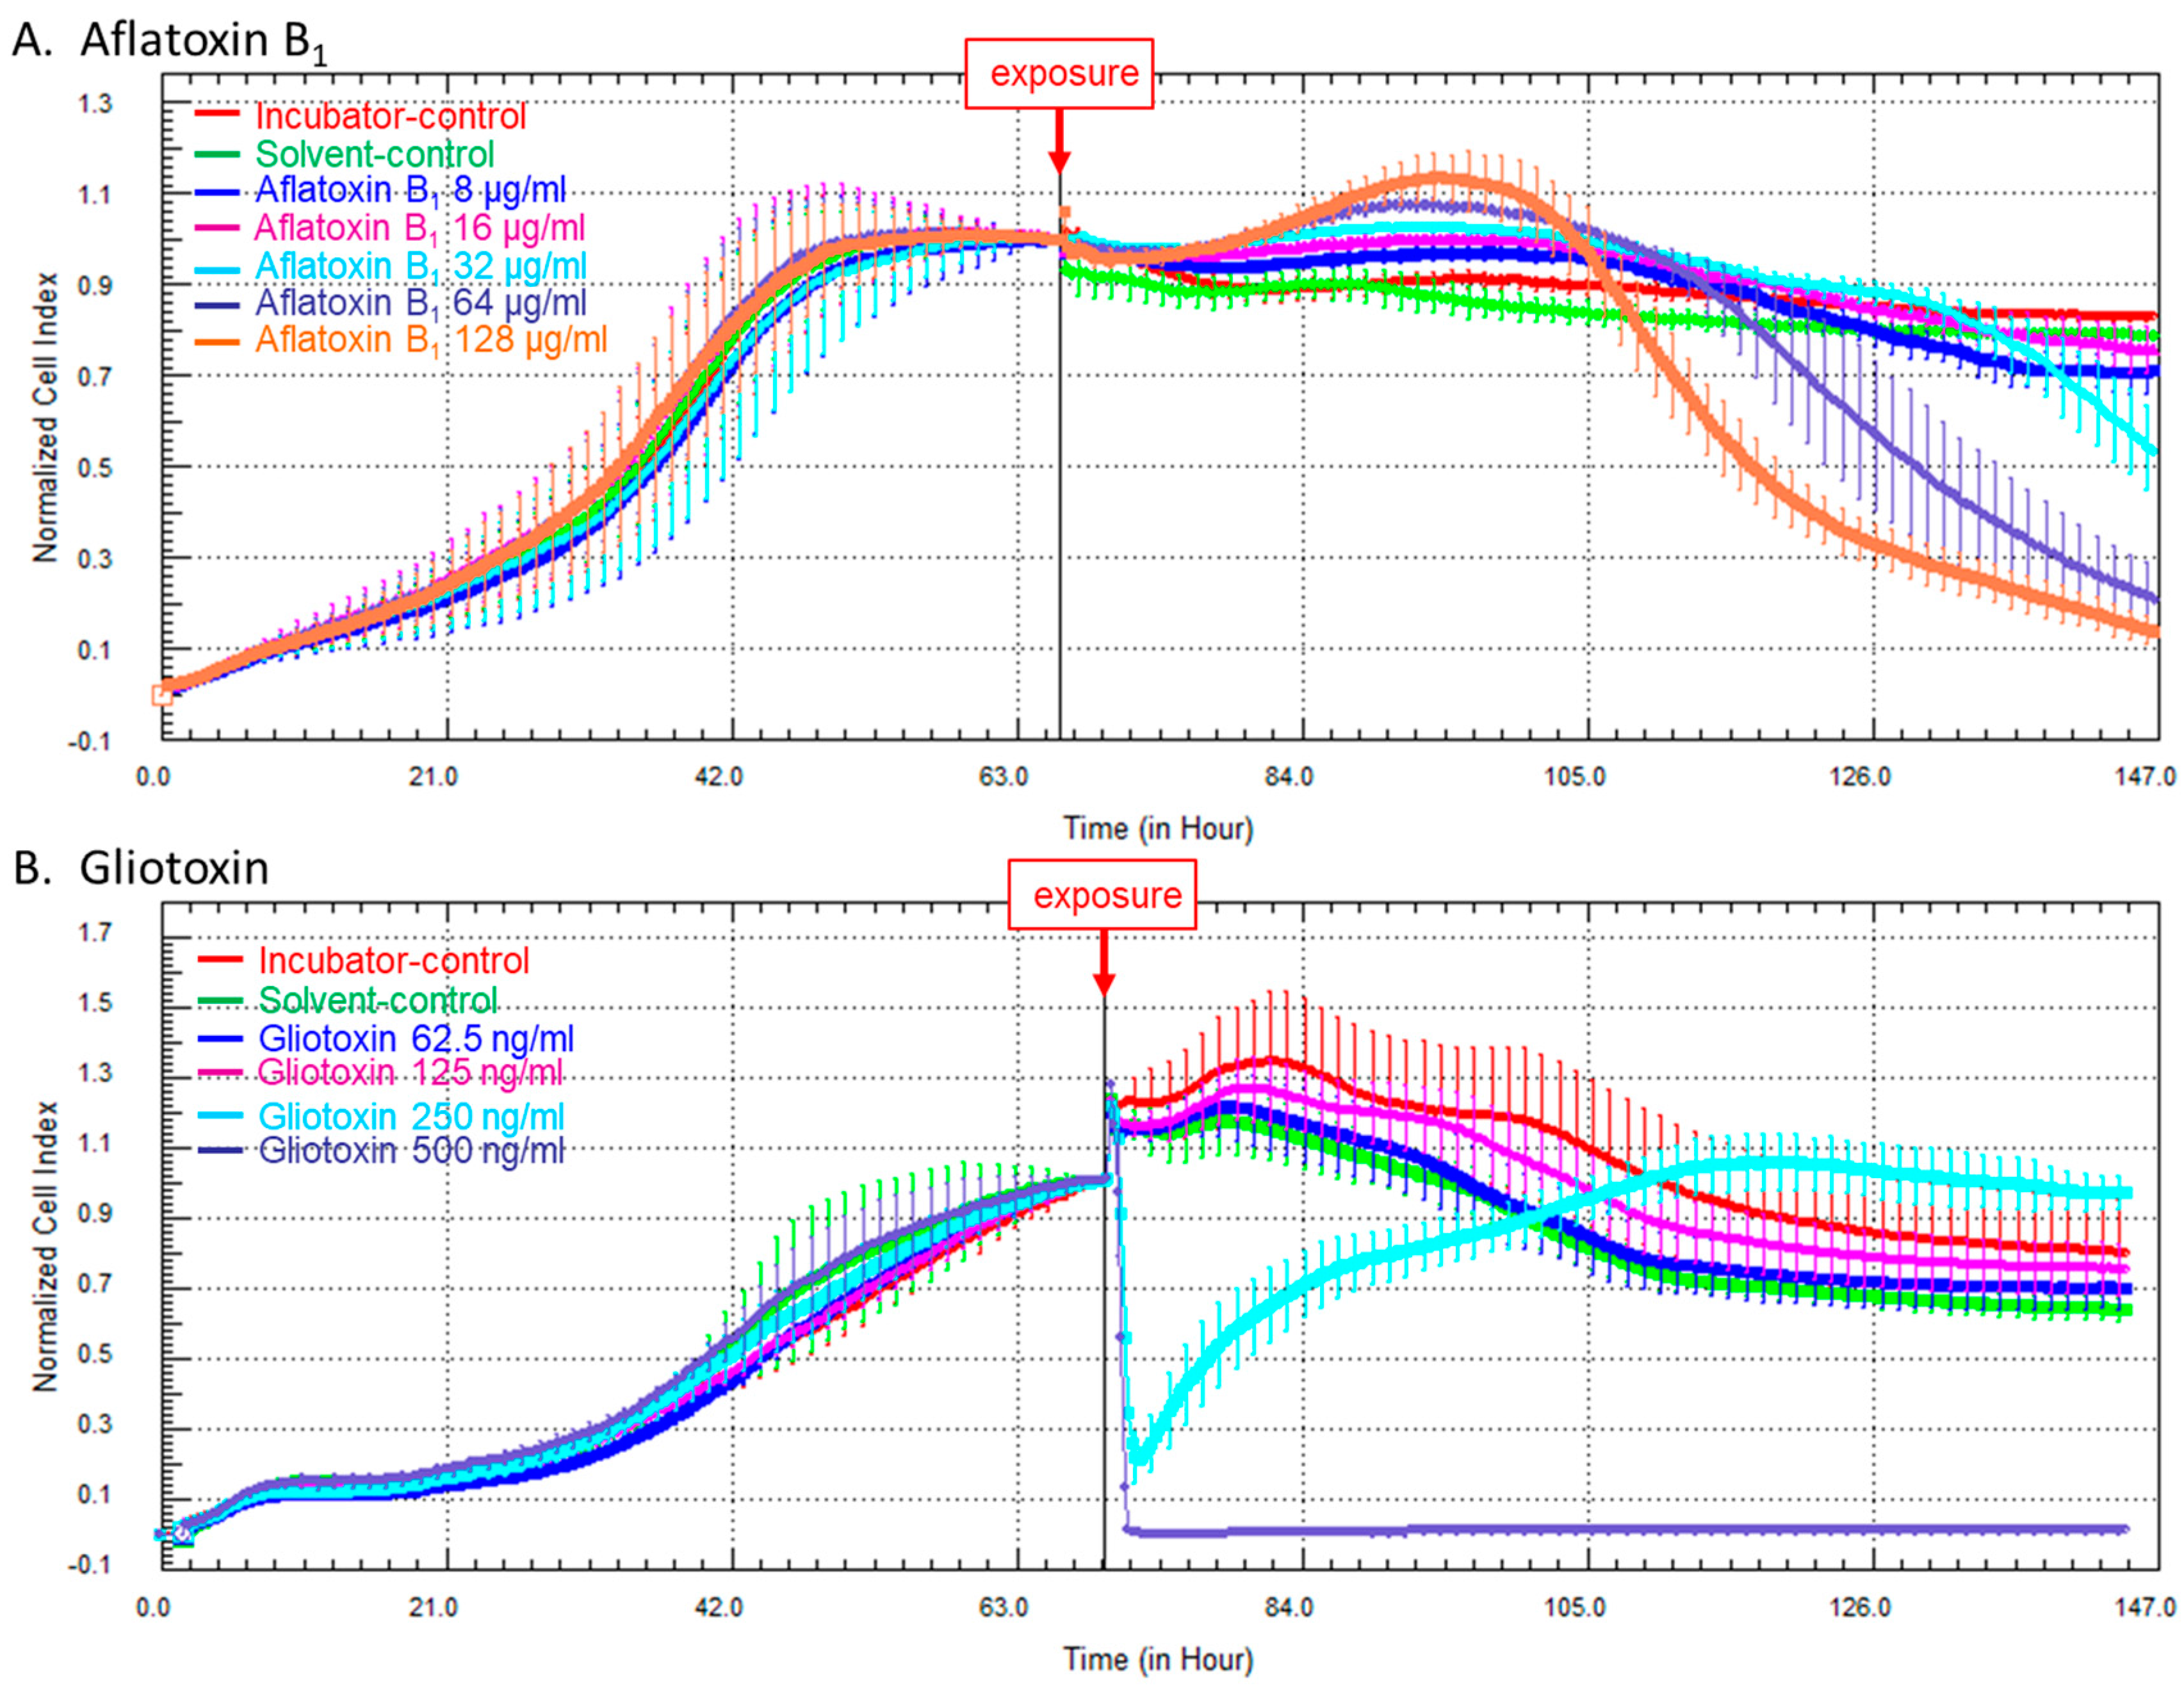
2.2. Kinetics of Cellular Impedance after Exposure of HCE Cells to AFB1 or Gliotoxin

In order to monitor the kinetics of toxicity after exposure to both mycotoxins, a noninvasive label-free real-time monitoring of cellular impedance with interdigitated gold electrode-containing microtiter plates was performed [21,22].
After the adhesion and proliferation phases, HCE cells reached the stationary phase after about 60 h. At this time, HCE cells were exposed to different concentrations of AFB1 (8, 16, 32, 64, or 128 µg/mL) or gliotoxin (62.5, 125, 250, or 500 ng/mL). Solvent-control (DMSO) and incubator-control were performed under the same experimental conditions.
No effect of DMSO exposure compared with incubator-control was observed (Figure 3).
Exposure to 8 or 16 µg/mL of AFB1 induced no significant effect compared with solvent-control. Exposure to 32, 64, or 128 µg/mL of AFB1 led to a progressive, but significant, decrease of cell indices from, respectively, 70 h, 50 h, or 40 h after challenge, without subsequent recovery, reflecting cell death (Figure 3A).
Exposure to 62.5 or 125 ng/mL of gliotoxin had no significant effect compared with solvent-control. Exposure to 250 ng/mL of gliotoxin induced a significant decrease of cell indices, followed by subsequent cell recovery, whereas exposure to 500 ng/mL of gliotoxin led to a sharp and definitive decrease of cell indices, indicating a fatal issue for the HCE cells (Figure 3B).

3. Discussion

Using an original in vitro approach combining both end-point tests and real-time monitoring of cellular impedance, we have evaluated the impact of two mycotoxins on the cellular viability and the inflammatory response of the ocular epithelium represented by the HCE cells. The anatomical position of the cornea means that it is directly in contact with environmental pollutants. Consequently, HCE cells are well adapted to the assessment of the biological effects of numerous airborne compounds on the ocular surface [23]. Our results have highlighted a concentration- and time-dependent modulation of the inflammatory response, with an increase in both gene expression of inflammatory markers (IL-8, CXCL-1, and TNF-α), and IL-8 release after AFB1 or gliotoxin exposure. Furthermore, a loss of HCE cell viability has been shown after high exposure levels of AFB1 or gliotoxin. Real-time cell impedance measurement to further evaluate the kinetics of cellular toxicity of the two mycotoxins was also performed, and confirmed the higher toxicity of gliotoxin compared with AFB1. This approach was very interesting because it allowed the estimation of the cellular toxicity with a noninvasive real-time assessment of the xenobiotic effect. Such information cannot be obtained by classical in vitro toxicity tests, such as tests based on the reduction of tetrazolium salt (MTT assay), which only give an end-point assessment. This cell impedance measurement-based technology can be used in order to complete the evaluation of the toxicity of various compounds using in vitro study, in accordance with the strategy of replacement of laboratory animals [24].
The concentrations of mycotoxins associated with inflammation but low cytotoxicity were 32 µg/mL and 125 ng/mL for AFB1 and gliotoxin, respectively. Although the AFB1 cytotoxicity appeared to be lower as compared to gliotoxin, the inflammatory response was more important after AFB1 exposure than after gliotoxin exposure. This paradoxical result could be explained by the immunosuppressive properties of gliotoxin. In an in vitro study, Pahl et al. [25] evidenced that gliotoxin inhibited the activation of NF-κB transcription factor, leading to an inhibition of the transcription of pro-inflammatory cytokines and an inhibition of the inflammatory response. Additionally, the reduced IL-8 release at the highest concentrations (250 and 500 ng/mL) is to be related to the reduced cell viability evidenced by the MTT test at these concentrations. The high toxicity we evidenced with gliotoxin is in accordance with previous reports on the toxicity of gliotoxin on other cell lines [26]. This toxicity may act through apoptosis and necrosis [26].
Most of the available data in the literature on the relation between the ocular surface and inflammation concern benzalkonium chloride (BAK), an antimicrobial preservative used in many ophthalmic solutions, known to promote the NF-κB pro-inflammatory pathway [27]. BAK is also used for this anti-inflammatory effect to improve the symptoms of dry eye syndrome [28]. Very few data are available on the impact of environmental pollutants on the ocular surface [29]. To the best of our knowledge, the present in vitro study is the first study to evidence the impact of mycotoxins on the gene expression of several cytokines involved in the inflammation of the ocular surface.
A dose-dependent induction of the gene expression of IL-8, CXCL-1, and TNF-α was observed in our study, more significantly after AFB1 exposure than after gliotoxin exposure. These cytokines lead to the activation and migration of leukocytes, mainly neutrophils, and to the production of other pro-inflammatory cytokines, contributing to the implementation of ocular damage. A similar dose-dependent induction of the gene expression of IL-8 and TNF-α was observed for BAK [30]. Such an induction of the gene expression of IL-8 and TNF-α was also evidenced in patients with Sjögren syndrome [31].
The main function of CXCL-1 is to recruit neutrophils during the inflammation process [32]. Our data reveal that CXCL-1 gene expression is 160-fold induced when compared to control following the exposure of HCE cells to 16 µg/mL of AFB1. An in vivo study on rats exposed for 16 h to Aspergillus fumigatus revealed a 3.5-fold induction of this chemokine when compared to control [33]. However, to our knowledge, no study on CXCL-1 gene expression has been reported on animals exposed to aflatoxigenic fungi. Moreover, in vivo conditions could reduce the duration of contact of the mycotoxin with corneal epithelial cells due to ciliary beat and watering eyes [34], making it difficult to compare the expression levels found in in vivo and in in vitro studies. Nevertheless, we can hypothesize that CXCL-1 might be involved in pro-inflammatory signaling pathway following environmental exposure.
Contrary to this, the gene expression of CCL-2 was not induced by gliotoxin and was even decreased by AFB1; as CCL-2 is a chemoattractant chemokine for monocytes [35], we can hypothesize monocytes to be less involved in the inflammation process following exposure to both mycotoxins. The gene expression of IL-13, a cytokine known to contribute to airway allergies [36,37], was not induced either. One would expect an induction of TLR-4 gene expression after direct exposure to fungi as the involvement of this receptor in the immune response to Aspergillus fumigatus was evidenced previously [38,39]. However, in our conditions, no induction of TLR-4 gene expression was observed after exposure of HCE cells to AFB1 and even a decrease in TLR-4 gene expression was observed after exposure to gliotoxin.
The impact of mycotoxins on the respiratory tract has been studied by several authors, mainly in terms of metabolic activity. Thus, tracheal, laryngeal, nasal, and conjunctival mucosa have been shown to be able to bioactivate AFB1 to AFB1-8,9-epoxide, which may promote toxicity and carcinogenicity as already found in hepatic tissue [40]. Gliotoxin has been shown to have immunosuppressive properties in vitro and in vivo, to inhibit phagocytosis by macrophages, and to cause apoptosis in primary and secondary lymphoid organs [41], contributing to respiratory illness. In a murine asthma model, respiratory exposure to gliotoxin has been shown to decrease the production of IL-12 by dendritic cells and of IFN-γ by T cells and to increase Th2 cytokine levels, leading to a Th2-driven allergic immune response [18].
Given the in vitro effects of AFB1 and gliotoxin on corneal epithelial cells, in order to prevent from toxic effects workers with airborne exposure to mycotoxins, such as workers in corn storage facilities or in animal farms, wearing eye protection might be discussed in addition to wearing a mask.

4. Conclusions

Taken as a whole, our results on the inflammatory response of HCE cells after exposure to both mycotoxins could be related to ocular irritation or sensitization, leading to allergic manifestations such as mucosal hyperactivity, which might be due to low, but persistent, inflammation in the presence of environmental factors such as fungal toxins [42]. As the ocular allergy symptoms are almost always combined with rhinitis [43], and as nasal and ocular mucosa belong to a complex mucosal and lymphoid tissue network [44], it would be of interest in future work to study the relation between the ocular surface and nasal mucosa in the development of the inflammatory reaction.

5. Experimental Section

5.1. Chemicals and Reagents

Dulbecco’s modified Eagle’s medium (DMEM), Ham F-12 medium, fetal calf serum (FCS), glutamine, penicillin-streptomycin, trypsin, and dimethyl sulfoxide (DMSO) were purchased from Thermo Fisher Scientific (Waltham, MA, USA). The DuoSet kits for ELISA assays were produced by R and D Systems (Minneapolis, MN, USA). AFB1, gliotoxin and 3-(4,5-dimethyl-2-thiazolyl)-2,5-diphenyl-2H-tetrazolium bromide (MTT) were purchased from Sigma-Aldrich (Saint-Quentin Fallavier, France).

5.2. Cell Line and Culture Conditions

Human corneal epithelial (HCE) cell line was a kind gift from Dr. F. Brignole (Institut de la Vision, Université Pierre et Marie Curie, Paris, France). HCE cells were cultured in DMEM:Ham F-12 (50:50) supplemented with 5% FCS, 1% glutamine and 1% antibiotics (penicillin 100 IU/mL and streptomycin 100 µg/mL). Cells were seeded at a density of 2 × 10⁴ cells/mL and incubated at 37 °C under 5% CO2. Culture medium was changed 24 h after seeding and then every three days. When the confluence had been reached, cells were harvested with trypsin and seeded in a new flask.

5.3. Cell Exposure to Mycotoxins

AFB1 and gliotoxin were first dissolved in DMSO. Then, these stock solutions of AFB1 or gliotoxin were diluted in DMEM:Ham F-12 (50:50) without FCS. Cell exposure occurred 72 h after seeding (of 2 × 10⁴ cells per mL) when the confluence was close to 70–80%. At this time, culture media were removed and replaced with culture media containing mycotoxin at nine different concentrations, from 0.5 to 128 µg/mL AFB1 and from 2 to 500 ng/mL gliotoxin. Two controls were considered: solvent-control (DMSO), tested at concentrations equivalent to the DMSO concentrations in the different mycotoxin serial dilutions, and incubator-control without exposure. Table 1 summarizes the various concentrations tested. The concentration ranges were chosen in view of the concentrations found to be toxic or to induce inflammatory reaction in the literature on other cell lines [6,7,18,26,45,46]. Cells were exposed for 24, 48, and 72 h to assess both cellular viability on the cell monolayer and IL-8 release in the culture medium. Each condition was tested in quadruplicate in four independent experiments.
The gene expression of seven pro-inflammatory markers (TNF-α, IL-8, CCL-2, CXCL-1, IL-13, TLR-4, and PARP) produced by HCE cells was quantified on the culture monolayer by RT-qPCR after 48h of exposure to AFB1 or gliotoxin, respectively, at 16 µg/mL or 125 ng/mL.
For the real-time measurement of cell proliferation, HCE cells were seeded at a density of 8 × 10³ cells per well in wells containing gold electrodes (xCELLigence 16-well E-plates, ACEA Biosciences, San Diego, CA, USA). Then, the E-plates were placed under the incubator at 37 °C and 5% CO2. After a proliferation phase, HCE cells were exposed to various concentrations of AFB1 (8, 16, 32, 64, or 128 µg/mL) or gliotoxin (62.5, 125, 250, or 500 ng/mL) throughout the time of the experiment. Two controls were considered: solvent-control (DMSO) tested for each mycotoxin and incubator-control without exposure. These assays were performed in duplicate in two separate experiments.

5.4. Cell Viability

After each exposure time, the 100-µL culture medium was harvested and 100 µL of MTT at a concentration of 5 mg/mL were deposited in each well on the monolayer culture. After 3 h incubation at 37 °C, formazan salts produced by functional cells were solubilized with DMSO. The absorbance was measured at 490 nm using a multiscan plate reader (Multiskan-EX, Thermo Scientific, Waltham, MA, USA), and was proportional to the quantity of functional cells.

5.5. Dosage of IL-8 Release

The quantification of IL-8 release was performed in the harvested culture media with ELISA assays kits (R and D Systems, Lille, France) following the manufacturer’s instructions. Concentrations were expressed in pg/mL. The assay lower limit of detection was 31.25 pg/mL.

5.6. Quantification of the Gene Expression of Seven Pro-Inflammatory Cytokines

The gene expression of seven cytokines (tumor necrosis factor α (TNF-α), interleukin-8 (IL-8), chemokine (C-C motif) ligand 2 (CCL-2), chemokine (C-X-C motif) ligand 1 (CXCL-1), IL-13, Toll-like receptor-4 (TLR-4), and poly (ADP-ribose) polymerase (PARP)) was quantified by quantitative real-time reverse transcription PCR (RTqPCR). Briefly, RNA extraction was performed on cell lysates with the RNeasy Plus Mini Kit (Qiagen, Courtaboeuf, France). RNA concentrations were measured with Nanodrop ND-200 (Thermo Fisher Scientific, Courtaboeuf, France) and adjusted to 100 ng/µL. Reverse transcription was carried out with the high capacity cDNA reverse transcription Kit (Thermo Fisher Scientific) with 1 × RT Buffer, 1 × dNTP Mix, 1 × random primers, 1 µL of MultiScribe reverse transcriptase and 1000 ng of RNA in a final volume of 20 µL. The gene expression levels of TNF-α, IL-8, CCL-2, CXCL-1, IL-13, TLR-4, and PARP were determined with the Hs99999043_m1, Hs00174103_m1, Hs00234140_m1, Hs00236937_m1, Hs00174379_m1, Hs00152939_m1, and Hs00365416_m1 inventoried TaqMan gene expression assays (Thermo Fisher Scientific), respectively. The TATA box binding protein (assay ID: Hs00427620_m1) was used as an endogenous control. All assays followed an intron spanning design so as not to show any cross-reactivity with genomic DNA. Real-time PCR assays were carried out in an Applied Biosystems 7500 PCR system (Thermo Fisher Scientific) in a 20-µL final volume containing 1 × TaqMan Gene Expression Master Mix, 1 × TaqMan gene expression assay primer and probe mix (Thermo Fisher Scientific), and 100 ng of cDNA. Thermal cycling conditions were: 50 °C for 2 min and 95 °C for 10 min, followed by 50 cycles of 95 °C for 15 s and 60 °C for 1 min. Results were expressed through the 2−ΔΔCt method [47].

5.7. Real-Time Measurement of Cell Impedance

HCE cells were seeded at a density of 8 × 10³ cells per well in wells containing gold electrodes (xCELLigence 16-well E-plates, ACEA Biosciences, San Diego, CA, USA). During culture, real-time impedance cell measurement was performed, reflecting cell surface adhesion to gold electrodes. Results were expressed as cell index (CI) values defined as (Rn − Rb)/15 where Rn is the cell-electrode impedance of the cell-containing well and Rb is the background impedance of the well with the media alone, recorded each 15 min throughout the entire experiment duration. All CIs were normalized to the CI measured just before mycotoxin exposure.

5.8. Statistical Analyses

For MTT and ELISA tests, one-way analysis of variance (ANOVA) with Bonferroni’s multiple comparisons test was performed in order to compare the results after exposure to the different concentrations of mycotoxins or DMSO alone. For gene expression studies, two-way ANOVA with Bonferroni’s multiple comparisons test was performed. Both analyses were performed with Prism version 6.04 software (GraphPad Software, La Jolla, CA, USA). A p < 0.05 was considered statistically significant.

Supplementary Materials

The following are available online at www.mdpi.com/2072-6651/9/7/197/s1. Figure S1: Cellular viability after 24 h, 48 h or 72 h of exposure to aflatoxin B1, to gliotoxin or to DMSO alone using MTT assay, Figure S2: Cellular viability of HCE cells using MTT assay after 24 h, 48 h or 72 h of exposure to nine different concentrations of aflatoxin B1 or gliotoxin.

Acknowledgments

We thank Françoise Brignole (Institut de la Vision, Université Pierre et Marie Curie, Paris, France) for the kind gift of HCE cells. We also thank George Tate for the English revision of the manuscript. This work was supported by Paris-Descartes University and by grants from MSD France, from the French Ministry of Agriculture and from the Institut de Médecine et d’Epidémiologie Appliquée.

Author Contributions

S.A. and J.M. conceived and designed the experiments; Y.M.B., Y.S., and A.A. performed the experiments; Y.M.A., Y.S., J.M., and S.A. analyzed the data; S.V. contributed reagents/materials/analysis tools; J.M., S.A., Y.M.B., I.M., and N.S. wrote the paper.

Conflicts of Interest

The authors declare no conflict of interest. The founding sponsors had no role in the design of the study; in the collection, analyses, or interpretation of data; in the writing of the manuscript, and in the decision to publish the results.

References

  1. Yiannikouris, A.; Jouany, J.-P. Mycotoxins in feeds and their fate in animals: A review. Anim. Res. 2002, 51, 81–99. [Google Scholar] [CrossRef]
  2. Bennett, J.W.; Klich, M. Mycotoxins. Clin. Microbiol. Rev. 2003, 16, 497–516. [Google Scholar] [CrossRef] [PubMed]
  3. Goossens, J.; Pasmans, F.; Verbrugghe, E.; Vandenbroucke, V.; de Baere, S.; Meyer, E.; Haesebrouck, F.; de Backer, P.; Croubels, S. Porcine intestinal epithelial barrier disruption by the Fusarium mycotoxins deoxynivalenol and T-2 toxin promotes transepithelial passage of doxycycline and paromomycin. BMC Vet. Res. 2012, 8, 245. [Google Scholar] [CrossRef] [PubMed]
  4. Magan, N. Mycotoxin contamination of food in Europe: Early detection and prevention strategies. Mycopathologia 2006, 162, 245–253. [Google Scholar] [CrossRef] [PubMed]
  5. Richard, J.L. Some major mycotoxins and their mycotoxicoses—An overview. Int. J. Food Microbiol. 2007, 119, 3–10. [Google Scholar] [CrossRef] [PubMed]
  6. Corcuera, L.A.; Vettorazzi, A.; Arbillaga, L.; Gonzalez Penas, E.; Lopez de Cerain, A. An approach to the toxicity and toxicokinetics of aflatoxin B1 and ochratoxin A after simultaneous oral administration to fasted F344 rats. Food Chem. Toxicol. 2012, 50, 3440–3446. [Google Scholar] [CrossRef] [PubMed]
  7. Qian, G.; Tang, L.; Guo, X.; Wang, F.; Massey, M.E.; Su, J.; Guo, T.L.; Williams, J.H.; Phillips, T.D.; Wang, J.S. Aflatoxin B1 modulates the expression of phenotypic markers and cytokines by splenic lymphocytes of male F344 rats. J. Appl. Toxicol. 2014, 34, 241–249. [Google Scholar] [CrossRef] [PubMed]
  8. Marroquin-Cardona, A.G.; Johnson, N.M.; Phillips, T.D.; Hayes, A.W. Mycotoxins in a changing global environment—A review. Food Chem. Toxicol. 2014, 69, 220–230. [Google Scholar] [CrossRef] [PubMed]
  9. Todd, B.E.; Buchan, R.M. Total dust, respirable dust, and microflora toxin concentrations in Colorado corn storage facilities. Appl. Occup. Environ. Hyg. 2002, 17, 411–415. [Google Scholar] [CrossRef] [PubMed]
  10. Tsapko, V.G.; Chudnovets, A.J.; Sterenbogen, M.J.; Papach, V.V.; Dutkiewicz, J.; Skorska, C.; Krysinska-Traczyk, E.; Golec, M. Exposure to bioaerosols in the selected agricultural facilities of the Ukraine and Poland—A review. Ann. Agric. Environ. Med. 2011, 18, 19–27. [Google Scholar] [PubMed]
  11. Lawniczek-Walczyk, A.; Gorny, R.L.; Golofit-Szymczak, M.; Niesler, A.; Wlazlo, A. Occupational exposure to airborne microorganisms, endotoxins and beta-glucans in poultry houses at different stages of the production cycle. Ann. Agric. Environ. Med. 2013, 20, 259–268. [Google Scholar] [PubMed]
  12. Lanier, C.; Heutte, N.; Richard, E.; Bouchart, V.; Lebailly, P.; Garon, D. Mycoflora and mycotoxin production in oilseed cakes during farm storage. J. Agric. Food Chem. 2009, 57, 1640–1645. [Google Scholar] [CrossRef] [PubMed]
  13. Reboux, G.; Piarroux, R.; Mauny, F.; Madroszyk, A.; Millon, L.; Bardonnet, K.; Dalphin, J.C. Role of molds in farmer’s lung disease in Eastern France. Am. J. Respir. Crit. Care Med. 2001, 163, 1534–1539. [Google Scholar] [CrossRef] [PubMed]
  14. Smith, N.L.; Denning, D.W. Underlying conditions in chronic pulmonary aspergillosis including simple aspergilloma. Eur. Respir. J. 2011, 37, 865–872. [Google Scholar] [CrossRef] [PubMed]
  15. Norback, D.; Hashim, J.H.; Cai, G.H.; Hashim, Z.; Ali, F.; Bloom, E.; Larsson, L. Rhinitis, ocular, throat and dermal symptoms, headache and tiredness among students in schools from johor bahru, Malaysia: Associations with fungal DNA and mycotoxins in classroom dust. PLoS ONE 2016, 11, e0147996. [Google Scholar] [CrossRef] [PubMed]
  16. Bakand, S.; Hayes, A. Troubleshooting methods for toxicity testing of airborne chemicals in vitro. J. Pharmacol. Toxicol. Methods 2010, 61, 76–85. [Google Scholar] [CrossRef] [PubMed]
  17. Johannessen, L.; Nilsen, A.; Lovik, M. Mycotoxin-induced depletion of intracellular glutathione and altered cytokine production in the human alveolar epithelial cell line A549. Toxicol. Lett. 2007, 168, 103–112. [Google Scholar] [CrossRef] [PubMed]
  18. Schutze, N.; Lehmann, I.; Bonisch, U.; Simon, J.C.; Polte, T. Exposure to mycotoxins increases the allergic immune response in a murine asthma model. Am. J. Respir. Crit. Care Med. 2010, 181, 1188–1199. [Google Scholar] [CrossRef] [PubMed]
  19. Xiang, P.; Liu, R.Y.; Sun, H.J.; Han, Y.H.; He, R.W.; Cui, X.Y.; Ma, L.Q. Molecular mechanisms of dust-induced toxicity in human corneal epithelial cells: Water and organic extract of office and house dust. Environ. Int. 2016, 92–93, 348–356. [Google Scholar] [CrossRef] [PubMed]
  20. Xiang, P.; He, R.W.; Han, Y.H.; Sun, H.J.; Cui, X.Y.; Ma, L.Q. Mechanisms of housedust-induced toxicity in primary human corneal epithelial cells: Oxidative stress, proinflammatory response and mitochondrial dysfunction. Environ. Int. 2016, 89–90, 30–37. [Google Scholar] [CrossRef] [PubMed]
  21. Ke, N.; Wang, X.; Xu, X.; Abassi, Y.A. The xCELLigence system for real-time and label-free monitoring of cell viability. Methods Mol. Biol. 2011, 740, 33–43. [Google Scholar] [PubMed]
  22. Witzel, F.; Fritsche-Guenther, R.; Lehmann, N.; Sieber, A.; Bluthgen, N. Analysis of impedance-based cellular growth assays. Bioinformatics 2015, 31, 2705–2712. [Google Scholar] [CrossRef] [PubMed]
  23. Saarinen-Savolainen, P.; Jarvinen, T.; Araki-Sasaki, K.; Watanabe, H.; Urtti, A. Evaluation of cytotoxicity of various ophthalmic drugs, eye drop excipients and cyclodextrins in an immortalized human corneal epithelial cell line. Pharm. Res. 1998, 15, 1275–1280. [Google Scholar] [CrossRef] [PubMed]
  24. Anadon, A.; Martinez, M.A.; Castellano, V.; Martinez-Larranaga, M.R. The role of in vitro methods as alternatives to animals in toxicity testing. Expert Opin. Drug Metab. Toxicol. 2014, 10, 67–79. [Google Scholar] [CrossRef] [PubMed]
  25. Pahl, H.L.; Krauss, B.; Schulze-Osthoff, K.; Decker, T.; Traenckner, E.B.; Vogt, M.; Myers, C.; Parks, T.; Warring, P.; Muhlbacher, A.; et al. The immunosuppressive fungal metabolite gliotoxin specifically inhibits transcription factor NF-kappaB. J. Exp. Med. 1996, 183, 1829–1840. [Google Scholar] [CrossRef] [PubMed]
  26. Anselmi, K.; Stolz, D.B.; Nalesnik, M.; Watkins, S.C.; Kamath, R.; Gandhi, C.R. Gliotoxin causes apoptosis and necrosis of rat Kupffer cells in vitro and in vivo in the absence of oxidative stress: Exacerbation by caspase and serine protease inhibition. J. Hepatol. 2007, 47, 103–113. [Google Scholar] [CrossRef] [PubMed]
  27. Sosne, G.; Albeiruti, A.-R.; Hollis, B.; Siddiqi, A.; Ellenberg, D.; Kurpakus-Wheater, M. Thymosin β4 inhibits benzalkonium chloride-mediated apoptosis in corneal and conjunctival epithelial cells in vitro. Exp. Eye Res. 2006, 83, 502–507. [Google Scholar] [CrossRef] [PubMed]
  28. Erdinest, N.; Shmueli, O.; Grossman, Y.; Ovadia, H.; Solomon, A. Anti-inflammatory effects of alpha linolenic acid on human corneal epithelial cells. Investig. Ophthalmol. Vis. Sci. 2012, 53, 4396–4406. [Google Scholar] [CrossRef] [PubMed]
  29. Rozanova, E.; Heilig, P.; Godnić-Cvar, J. The eye-A neglected organ in environmental and occupational medicine: An overview of known environmental and occupational non-traumatic effects on the eyes. Arch. Ind. Hyg. Toxicol. 2009, 60, 205–215. [Google Scholar] [CrossRef] [PubMed]
  30. Pauly, A.; Roubeix, C.; Liang, H.; Brignole-Baudouin, F.; Baudouin, C. In vitro and in vivo comparative toxicological study of a new preservative-free latanoprost formulation. Investig. Ophthalmol. Vis. Sci. 2012, 53, 8172–8180. [Google Scholar] [CrossRef] [PubMed]
  31. Pflugfelder, S.C.; Jones, D.; Ji, Z.; Afonso, A.; Monroy, D. Altered cytokine balance in the tear fluid and conjunctiva of patients with Sjogren’s syndrome keratoconjunctivitis sicca. Curr. Eye Res. 1999, 19, 201–211. [Google Scholar] [CrossRef] [PubMed]
  32. Pedersen, L.; Pilegaard, H.; Hansen, J.; Brandt, C.; Adser, H.; Hidalgo, J.; Olesen, J.; Pedersen, B.K.; Hojman, P. Exercise-induced liver chemokine CXCL-1 expression is linked to muscle-derived interleukin-6 expression. J. Physiol. 2011, 589, 1409–1420. [Google Scholar] [CrossRef] [PubMed]
  33. Xu, Q.; Zhao, G.; Lin, J.; Wang, Q.; Hu, L.; Jiang, Z. Role of Dectin-1 in the innate immune response of rat corneal epithelial cells to Aspergillus fumigatus. BMC Ophthalmol. 2015, 15, 126. [Google Scholar] [CrossRef] [PubMed]
  34. Tuomas, P.; Tuomas, R.; Anu, K.; Liisa, M.; Antero, S.; Kaarniranta, K. The preservative polyquaternium-1 increases cytoxicity and NF-kappaB linked inflammation in human corneal epithelial cells. Mol. Vis. 2012, 18, 1189–1196. [Google Scholar]
  35. Deshmane, S.L.; KremLev, S.; Amini, S.; Sawaya, B.E. Monocyte chemoattractant protein-1 (MCP-1): An overview. J. Interferon Cytokine Res. 2009, 29, 313–326. [Google Scholar] [CrossRef] [PubMed]
  36. Wills-Karp, M. Interleukin-13 in asthma pathogenesis. Immunol. Rev. 2004, 202, 175–190. [Google Scholar] [CrossRef] [PubMed]
  37. Di, Y.P.; Tsou, Y.-A.; Lin, C.-D.; Chen, H.-C.; Hsu, H.-Y.; Wu, L.-T.; Chiang-Ni, C.; Chen, C.-J.; Wu, T.-F.; Kao, M.-C. Interleukin-13 inhibits lipopolysaccharide-induced BPIFA1 expression in nasal epithelial cells. PLoS ONE 2015, 10, e0143484. [Google Scholar]
  38. Braedel, S.; Radsak, M.; Einsele, H.; Latge, J.P.; Michan, A.; Loeffler, J.; Haddad, Z.; Grigoleit, U.; Schild, H.; Hebart, H. Aspergillus fumigatus antigens activate innate immune cells via toll-like receptors 2 and 4. Br. J. Haematol. 2004, 125, 392–399. [Google Scholar] [CrossRef] [PubMed]
  39. Guo, H.; Wu, X. Innate responses of corneal epithelial cells against Aspergillus fumigatus challenge. FEMS Immunol. Med. Microbiol. 2009, 56, 88–93. [Google Scholar] [CrossRef] [PubMed]
  40. Larsson, P.; Tjalve, H. Bioactivation of aflatoxin B1 in the nasal and tracheal mucosa in swine. J. Anim. Sci. 1996, 74, 1672–1680. [Google Scholar] [CrossRef] [PubMed]
  41. Sutton, P.; Waring, P.; Mullbacher, A. Exacerbation of invasive aspergillosis by the immunosuppressive fungal metabolite, gliotoxin. Immunol. Cell. Biol. 1996, 74, 318–322. [Google Scholar] [CrossRef] [PubMed]
  42. Fauquert, J.L.; Demoly, P. Diagnostic approach to conjunctival hyperreactivity. Rev. Fr. Allergol. 2005, 45, 226–233. [Google Scholar]
  43. Leonardi, A.; Bogacka, E.; Fauquert, J.L.; Kowalski, M.L.; Groblewska, A.; Jedrzejczak-Czechowicz, M.; Doan, S.; Marmouz, F.; Demoly, P.; Delgado, L. Ocular allergy: Recognizing and diagnosing hypersensitivity disorders of the ocular surface. Allergy 2012, 67, 1327–1337. [Google Scholar] [CrossRef] [PubMed]
  44. Hom, M.M.; Bielory, L. The anatomical and functional relationship between allergic conjunctivitis and allergic rhinitis. Allergy Rhinol. 2013, 4, 110–119. [Google Scholar] [CrossRef] [PubMed]
  45. Wichmann, G.; Herbarth, O.; Lehmann, I. The mycotoxins citrinin, gliotoxin, and patulin affect interferon-gamma rather than interleukin-4 production in human blood cells. Environ. Toxicol. 2002, 17, 211–218. [Google Scholar] [CrossRef] [PubMed]
  46. Johannessen, L.N.; Nilsen, A.M.; Lovik, M. The mycotoxins citrinin and gliotoxin differentially affect production of the pro-inflammatory cytokines tumour necrosis factor-alpha and interleukin-6, and the anti-inflammatory cytokine interleukin-10. Clin. Exp. Allergy 2005, 35, 782–789. [Google Scholar] [CrossRef] [PubMed]
  47. Livak, K.J.; Schmittgen, T.D. Analysis of relative gene expression data using real-time quantitative PCR and the 2(-Delta Delta C(T)) Method. Methods 2001, 25, 402–408. [Google Scholar] [CrossRef] [PubMed]
Figure 1. Cellular viability and inflammatory response of HCE cells after mycotoxin exposure. (A) Cellular viability after aflatoxin B1 and gliotoxin exposure using MTT assay. After 24, 48, or 72 h of exposure to nine different concentrations of aflatoxin B1 or gliotoxin, to DMSO alone (solvent-control for aflatoxin B1 and for gliotoxin, at concentrations of 1.28% and 0.01%, respectively) or to medium alone (incubator-control), the culture medium was harvested and MTT was deposited in each well. After 3 h of incubation at 37 °C and solubilization of formazan salts with DMSO, the absorbance was measured at 490 nm; and (B) interleukine-8 release after aflatoxin B1 and gliotoxin exposure using an ELISA assay. The quantification of IL-8 release was performed in the harvested culture media with an ELISA assay kit.
Toxins 09 00197 g001
Figure 2. Gene expression of seven proinflammatory markers after a 48 h exposure of HCE cells to 16 µg/mL of aflatoxin B1 (A) or 125 ng/mL of gliotoxin (B). Results are expressed as fold induction versus incubator-control. **** p < 0.0001; *** p = 0.0002; ** p = 0.0041.
Toxins 09 00197 g002
Figure 3. Effect of aflatoxin B1 (A) and gliotoxin (B) on HCE cell survival measured by cell impedance-based technology. (A) Cells were exposed to 8, 16, 32, 64, or 128 µg/mL of aflatoxin B1 or to the concentration of DMSO alone equivalent to the DMSO concentration in 128 µg/mL of aflatoxin B1; and (B) cells were exposed to 62.5, 125, 250, or 500 ng/mL of gliotoxin or to the concentration of DMSO alone equivalent to the DMSO concentration in 500 ng/mL of gliotoxin. The error bars on the profiles represent 95% confidence intervals.
Toxins 09 00197 g003
Table 1. Various concentrations of aflatoxin B1 (AFB1), gliotoxin or DMSO tested.
Aflatoxin B1 (µg/mL)% DMSO in Culture Medium *Gliotoxin (ng/mL)% DMSO in Culture Medium *
0.50.00524 × 10−5
10.0148 × 10⁻⁵
20.0281.6 × 10−4
40.04163.2 × 10−4
80.08326.4 × 10−4
160.1662.51.25 × 10−3
320.321252.5 × 10−3
640.642505 × 10⁻³
1281.285000.01
Stock solutions: AFB1: 10 mg/mL; gliotoxin: 5 mg/mL. * equivalent concentration.

