Article

Optimization of Femtosecond Laser Polymerized Structural Niches to Control Mesenchymal Stromal Cell Fate in Culture

by
Manuela T. Raimondi
1,
Michele M. Nava
1,
Shane M. Eaton
2,*,
Arianna Bernasconi
2,
Krishna C. Vishnubhatla
3,
Giulio Cerullo
2 and
Roberto Osellame
4
1
LaBS, Department of Chemistry, Materials and Chemical Engineering "G. Natta", Politecnico di Milano, Piazza Leonardo da Vinci 32, Milano 20133, Italy
2
Department of Physics, Politecnico di Milano, Piazza Leonardo da Vinci 32, Milano 20133, Italy
3
Center for Nano Science and Technology of IIT@POLIMI, Via Pascoli 70/3, Milano 20133, Italy, Milano 20133, Italy
4
Istituto di Fotonica e Nanotecnologie-Consiglio Nazionale delle Ricerche (IFN-CNR), Piazza Leonardo da Vinci 32, Milano 20133, Italy
*
Author to whom correspondence should be addressed.
Micromachines 2014, 5(2), 341-358; https://doi.org/10.3390/mi5020341
Submission received: 31 March 2014 / Revised: 4 June 2014 / Accepted: 4 June 2014 / Published: 11 June 2014
(This article belongs to the Special Issue Laser Micro- and Nano- Processing)

Abstract

:
We applied two-photon polymerization to fabricate 3D synthetic niches arranged in complex patterns to study the effect of mechano-topological parameters on morphology, renewal and differentiation of rat mesenchymal stromal cells. Niches were formed in a photoresist with low auto-fluorescence, which enabled the clear visualization of the fluorescence emission of the markers used for biological diagnostics within the internal niche structure. The niches were structurally stable in culture up to three weeks. At three weeks of expansion in the niches, cell density increased by almost 10-fold and was 67% greater than in monolayer culture. Evidence of lineage commitment was observed in monolayer culture surrounding the structural niches, and within cell aggregates, but not inside the niches. Thus, structural niches were able not only to direct stem cell homing and colony formation, but also to guide aggregate formation, providing increased surface-to-volume ratios and space for stem cells to adhere and renew, respectively.

Graphical Abstract

1. Introduction

Recent advances in stem cell biology have opened up new therapeutic strategies for a variety of incurable diseases, but the ultimate clinical success of such therapies lies entirely on our ability to efficiently control and manipulate stem cell fate and produce therapeutic cells in large, pharmaceutically relevant scales. Recent developments towards this goal consist in the fabrication of culture substrates to be used as “synthetic niches” for engineering stem cells [1]. These are synthetic polymeric systems mimicking individual aspects of the stem cell interaction with the extra-cellular microenvironment, for example material properties (chemical functionality, tissue-mimetic modifications such as mineralization, etc.), and spatiotemporal variations of the presence of specific bioactive agents (growth and differentiation factors, nutrients, etc.). Synthetic niches are useful both for understanding stem cell behavior under three-dimensional (3D) biomimetic conditions, and to develop new strategies for long term maintenance of pluripotency or to promote lineage-specific differentiation into therapeutic cells. For example, hydrogel-based synthetic niches were recently used to study the synergistic role of matrix microenvironment (type, architecture, composition, stiffness) and signaling molecules (type, dosage) to direct murine embryonic stem cell (ESC) differentiation into specific neural and glial lineages [2].
Within this context, a potential strategy for guiding stem cell behavior is the employment of purely mechanical cues [3]. For example, spontaneous lineage commitment has been induced in mesenchymal stromal cells (MSCs), by culturing them on collagen-coated polystyrene microbeads [4], or on hydroxyapatite/chitosan nanofibrous scaffolds [5]. Altering cell culture conditions from 2D to 3D results in alteration of cell adhesion, causing major remodeling of the cellular cytoskeleton. This, in turn, induces alterations in nuclear shape, mediated by the traction transmitted by the filamentous actin cytoskeleton [6]. Nuclear shape is emerging as a primary factor orchestrating complex stem cell behaviors, including maintenance of the cell multipotency and lineage commitment [7]. Thus, a precisely controlled mechano-topological environment is becoming increasingly recognized as a crucial factor in stem cell culture, because it allows exploring the relationship between the 3D structural interaction of the adhered cell with its physical microenvironment, and its response.
Direct laser writing (DLW) by two photon polymerization (2PP) [8,9,10,11] exploits focused femtosecond laser pulses to induce photopolymerization within the focal volume, following a nonlinear two-photon absorption mechanism. 2PPis the only fabrication technique in which the scaffold geometry may be controlled at the cell scale (10 μm) and with a very high spatial resolution (less than 1 μm). Non-biodegradable “structural” materials used to fabricate scaffolds by 2PPinclude vinyls [12], epoxies [13], acrylates [14] and hybrid inorganic-organic materials [15], many of which have proven to be biocompatible in the cell culture environment [16]. In recent work, we have developed structural microscaffolds, or niches, of various complex 3D architectures, which were laser-written directly on the glass bottom of the cell culture chamber, using a photoresist consisting of a solgel-synthesized silicon-zirconium hybrid inorganic-organic [17]. In this way, we were able to select the niche microarchitecture most favoring spontaneous homing and proliferation of MSCs, among the various ones tested. However, deeper insight into the behavior of cells proliferating inside the niches was hindered by a strong fluorescence background, generatedby the polymeric structure itself that masked the signals from biological markers.
Here, we report on morphology, proliferation and differentiation of MSCs in long term culture inside “structurally” biomimetic synthetic niches. A photosensitive resin with low autofluorescence enabled immunofluorescence diagnostics inside the microscaffolds. A different behavior of the cells is observed depending on the environment where they proliferate: a lineage commitment is observed in 2D and 2.5D regions while a preservation of their multipotency is noted in 3D engineered scaffolds. This striking effect is attributed to a reduced deformation of the cell nuclei following an isotropic cytoskeletal tension state, and could find application in the development of novel customized cell therapies.

2. Experimental Section

2.1. Two-Photon Polymerization of 3D Niches

Scaffolds were directly two-photon polymerized in the SZ2080 photoresist (Maria Farsari, IESL-FORTH, Heraklion, Greece) with 1% concentration of Irg photoinitiator (Irgacure 369, 2-Benzyl-2-dimethylamino-1-(4-morpholinophenyl)-butanone-1). The laser used for 2PP was a regeneratively amplified Yb:KGW system (Pharos, Light Conversion, Vilnius, Lithuania) with 200-fs pulse duration, 515-nm wavelength (frequency doubled), focused with a 1.4-NA oil immersion lens (Plan-APOCHROMAT, 100× oil immersion, Carl Zeiss, Oberkochen, Germany). The collimated beam diameter D before the lens was 5 mm, slightly overfilling the 4.5-mm clear aperture (CA), allowing us to exploit the full NA of the objective. The transmission of the lens was measured to be 50%, which is expected given the 69% transmission quoted by Zeiss and the ratio of the area of the aperture to that of the overfilling beam (CA/D)2 = 0.8. The theoretical spot size 2w0 was 0.3 μm for our laser having a beam quality of M2 = 1.3.
Optimum fabrication conditions were 1-mm/s writing speed, 0.75-mW average power (before the objective) and 200-kHz repetition rate. After the focusing objective, this corresponds to a pulse energy of 1.9nJ, a peak fluence of 5.4 J/cm2 and a peak intensity of 27 TW/cm2 [18].Computer-controlled, 3-axis motion stages (ABL-1000, Aerotech, Pittsburgh, PA, USA) interfaced by CAD-based software (ScaBase, Altechna, Vilnius, Lithuania) with an integrated acousto-optic modulator (AOM) were used to translate the sample relative to the laser to form the desired 3D microarchitectures.The microscaffolds were laser written directly onto circular glass cover slips of 150 μm thickness and 12 mm diameter (BioOptika, Milano, Italy).
Microscaffolds were 30 μm high and 90 μm × 90 μm in transverse dimensions and consisted of a lattice of interconnected lines, with a graded spacing between 10 and 30 μm transversely and a uniform spacing of 15 μm vertically. The 3D scaffold was surrounded by four outer confinement walls formed by horizontal lines spaced by 7.5 μm, resulting in gaps of 2 μm.

2.2. Cell Isolation

Unless otherwise specified, all chemicals and chemofluorescent markers were purchased from Sigma-Aldrich; immunofluorescent markers from Thermo Scientific; cell culture media and plastics from Euroclone. All protocols comply with institutional ethical use protocols for laboratory animals.
We used primary rat MSCs to study self-renewal and differentiation within the 2PP-engineered microscaffolds. Bone marrow was obtained from 2-month-old Sprague-Dawley (CD) rats. Briefly, rats were sacrificed and femurs and tibias were aseptically removed. Bone marrow was flushed from the shaft of the bones with α-Minimum Essential Medium (Invitrogen-Gibco) containing 5% fetal calf serumplus 100 U/mL penicillin G and 0,1 mg/mL streptomycinand then filtered through a 100-μm sterile filter to produce a single-cell suspension. MSCs were recovered from bone marrow by their tendency to adhere tightly to plastic culture dishes. Filtered bone marrow cells were plated in α-MEM supplemented with 20% FCS and 1% penicillin/streptomycin and allowed to adhere for 24 h. Non-adherent cells were then removed. Medium was changed regularly every 3 days until confluence. Adherent cells were detached by trypsin-EDTA (0.5–0.2 g/L; Invitrogen, Carlsbad, CA, USA), counted and cryo-preserved in α-MEM supplemented with 30% FCS and 5% dimethyl sulfoxide (DMSO) until use. After resuscitation, cells were plated and cultured until semi-confluence in standard flasks in complete medium.

2.3. Characterization of the Freshly Isolated MSCs

The isolated cells were characterized as described in detail in [19]. Briefly, fluorescence-activated cell sorting (FACS) analysis revealed that MSCs were negative (98% negative cells) for the hematopoietic marker CD45 (anti-rat CD45 Ab, BD Pharmingen, San Jose, CA, USA). Cells were also characterized for their capability to differentiate toward adipocytes and osteocytes. For adipogenesis, MSCs were incubated for 3 weeks with 5 μg/mL insulin, 10−6 M dexamethasone, 0.5 mM isobutylmethylxanthine, and 50 μM indomethacin. Then, cells were fixed with 10% formalin, and oil red O staining was used to visualize the accumulation of lipid droplets into the cell vacuoles. For osteogenesis, cultures were fed twice a week for 3 weeks with 10 mM β-glycero-phosphate, 0.2 mM ascorbic acid 2-phosphate, and 10−8 M dexamethasone. Then, the cells were fixed and extensive mineralization of the extracellular matrix was visualized by alizarin red S.

2.4. Substrate Preparation and Cell Culture

For cell seeding, cells were trypsinised and counted. The 2PP-patterned coverglasses (hereon called samples) were washed thoroughly, kept for 12 h in deionised water, disinfected for 12 h in 70% ethanol, washed repeatedly in sterile deionised water, dried and UV-sterilized. Each sample was positioned in a well of Ultra-Low Attachment 24 multi-well plates (Costar 3473, Corning, Corning, NY, USA). The cells were suspended in complete medium and seeded directly in the wells, at a density of 20,000 cells/cm2. The cells were incubated for 21 days, with medium freshly replaced every day.The complete medium was made of α-MEM supplemented with 20% FCS, 100 U/mL penicillin G and 0.1 mg/mL streptomycin sulphate.

2.5. Morphological Examination

Live cells were imaged in their wells in phase contrast every three days, using a standard microscope (IX70, Olympus, Tokyo, Japan) equipped with a cooled high resolution video camera (4083.CL3, Optika, Ponteranica(BG), Italy). For Scanning Electron Microscopy (SEM), the cells were fixed in the wells in 1.5% glutaraldheide and 0.1 M sodium cacodylate and dehydrated in a graded series of ethanol. The samples were extracted from the wells, air dried, glued onto SEM stubs and gold-coated in a vacuum ion coater. The thickness of the gold coated layer prior to SEM investigation was in the range 15–20 nm. All observations were carried out at 17.5 kV using a SEM (EVO 50 EP, Carl Zeiss, Oberkochen, Germany).

2.6. Histological Staining

Samples were fixed with paraformaldehyde 2%. Von Kossa staining was performed to analyze calcium deposits. Samples were incubated in 1% silver nitrate solution under UV ray, washed in 5% sodium tiosolphate, nuclei were countercoloured with fast red, and samples were dehydrated in a graded series of ethanol, ending with xylene. Masson’s trichrome stain with alanin blue was used to analyze aspecific collagen content, using a commercial kit (04-010802, BioOptika, Milano, Italy). Safranin staining was performed to analyze glycosaminoglycan (GAG) content. The nuclei were stained with hematoxylin, then samples were incubated in 0.1% Safranin O, and dehydrated in a graded series of ethanol, ending with xylene. Finally, Oil red Owas used to detect lipid content. Samples were firstly stained with a 10 μg/mL solution of Oil red O, then fixed in 4% paraformaldehyde. All samples were mounted on glass slides with Biomount (BioOptika, Milano, Italy) and observed in bright light at 10× and 40×.

2.7. Fluorescence Staining and Observation by Confocal Microscopy

For confocal microscopy, the cells were fixed in the wells in paraformaldehyde 2%, permeabilised with Triton 0.2%, blocked with 3% bovine serum albumin (BSA) plus 10% FCS to avoid unspecific labeling, and fluorescently marked. DNA was stained by incubation with 4′,6′-diamidino-2-phenylindoledihydrochloride(DAPI)in solution at 10 µg/mL. Actin filaments were marked in green using FITCH-conjugated phalloidin. Cell proliferation was studied by detection of the Ki67 antigen, which is expressed by cells in all the phases of the division cycle, using a red Cy3-conjugated mouse anti-human Ki67 monoclonal antibody (NCL-Ki67-MM1, Novocastra, Nussloch, Germany). Collagen type I, collagen type II and Osteocalcin were immunolabeled with primary antibodies and then marked in red using Cy3-conjugated secondary antibodies. Immunostaining was performed also on expanded MG63 osteosarcoma immortalized cells, for which all the investigated proliferation and differentiation markers are proven to be expressed [14], either using the complete immunostaining protocol (positive control), or using the complete protocol deprived of primary antibody labeling (negative control). Image acquisition and 3D reconstruction were performed at 15× and at 40× by means of a laser confocal microscope (LSM 510 Meta, Carl Zeiss, Oberkochen, Germany).

2.8. Estimation of Nuclear Shape

Sequential images, acquired in fluorescence on the DAPI channel, at 1 µm intervals on the Z (vertical) axis, were imported in the Image J 1.43 software (National Institute of Mental Health, Bethesda, MD, USA). The RGB stack sequence was converted into grayscale images (8 bit) and subsequently filtered to reduce noise. The regions of interest corresponding to the cell nuclei and the niche structure were identified and the relevant growing regions were built by segmentation. Solid models of the cell nuclei were reconstructed by numerical interpolation (voxel growing) of subsequent images. The whole analyzed volume was subdivided into three sub-volumes: glass monolayer, niche external wall, and niche internal volume. In each sub-volume, each reconstructed nucleus was associated to its phantom (best fitting) solid ellipsoid.

2.9. Statistical Analysis

Five identical experiments were repeated. At each culture time point, cell count, colony count, measurement of colony size and relative distances, were performed on images acquired in fluorescence on the DAPI-labeled samples, in transmission by aninverted microscope (IX70, Olympus, Tokyo, Japan). By this method, all the cell nuclei present on the sample were visualized in projection on the images, instead of what happens in confocal acquisitions where only the projection of a limited sample volume above the cell-populated glass surface is visualized. Colonies were assessed visually on the DAPI-marked cells by the presence of nuclear aggregates. The distance between colonies was assessed by image processing on the DAPI images, by tracing a circle including each visualized colony and by calculating the relative distance between the centers of circle pairs. The cell count was assessed visually on the DAPI-marked cells, bycounting the cell nuclei in square regions of 100 × 100 μm2. Cell density was obtained by dividing the cell count of each region by the area of the square region. Results of the cell counts were assigned to experimental groups, based on the count location: (1) uncolonized glass, (2) colonized glass, (3) niche external walls, (4) niche internal volume. The groups were compared using one-way analysis of variance (ANOVA) for independent samples. Pair-wise comparisons among groups were determined with Tukey HSD test, or with Student t-test for independent samples. Differences were considered to be significant if p < 0.05.

3. Results and Discussion

3.1. Graded Niche Fabrication

We fabricated scaffolds in the SZ2080 photoresist with 1% concentration of Irg photoinitiator. Previously we had fabricated scaffolds in the same SZ2080 photoresist but with Michler’s ketone (Bis) photoinitiator [17], which showed strong autofluorescence, hindering the characterization of the fluorescent markers for cell proliferation (Figure 1). The Irg-based photoresist used here was found to be biocompatible [20] similarly to the previously studied Bis-SZ2080, but with greatly reduced auto-fluorescence. These results are in agreement with previous work showing that it is the addition of the photoinitiator which influences both the photosensitivity and fluorescence of the photoresist [18,21]. It should also be noted that 2PP is possible in SZ2080 without any photoinitiator, but at the expense ofa significantly smaller processing window for the fabrication of high quality 3D microstructures [18].
Figure 1. Comparison of autofluorescence in scaffolds formed with Bis (top row) and Irg (bottom row) photoinitiators in SZ2080 with (a, d) blue (4′,6-diamidino-2-phenylindole—DAPI), (b, e) green (fluorescein isothiocyanate—FITC) and (c, f) red (Tetramethylrhodamineisothiocyanate—TRITC) fluorescent markers.
Micromachines 05 00341 g001
We obtained significant improvements in niche fabrication with respect to our previous results, owing to a novel Yb-based writing laser, enabling us to also vary the repetition rate in searching for optimum processing conditions. At 200-kHz repetition rate and 1.9-nJ pulse energy (27-TW/cm2 peak intensity) after the lens, we found an ideal processing window with 1-mm/s scan speed, representing a nearly three order of magnitude improvement in fabrication speed compared to our prior work [17]. The polymerized lines in Irg-based SZ2080 were of 5 μm × 2.5 μm thickness, twice as thick as our previous results in Bis-based SZ2080 [22], which we attribute partially to the 50-fold higher average laser fluence in the present work. This processing window provides, on the one hand, a very good mechanical stability of the structures, and, on the other hand, a very high processing speed, thus making the structuring of large surfaces feasible. For example, this faster processing speed allowed us to study the influence of the microscaffold’s relative distance on MSC behavior. As shown in 
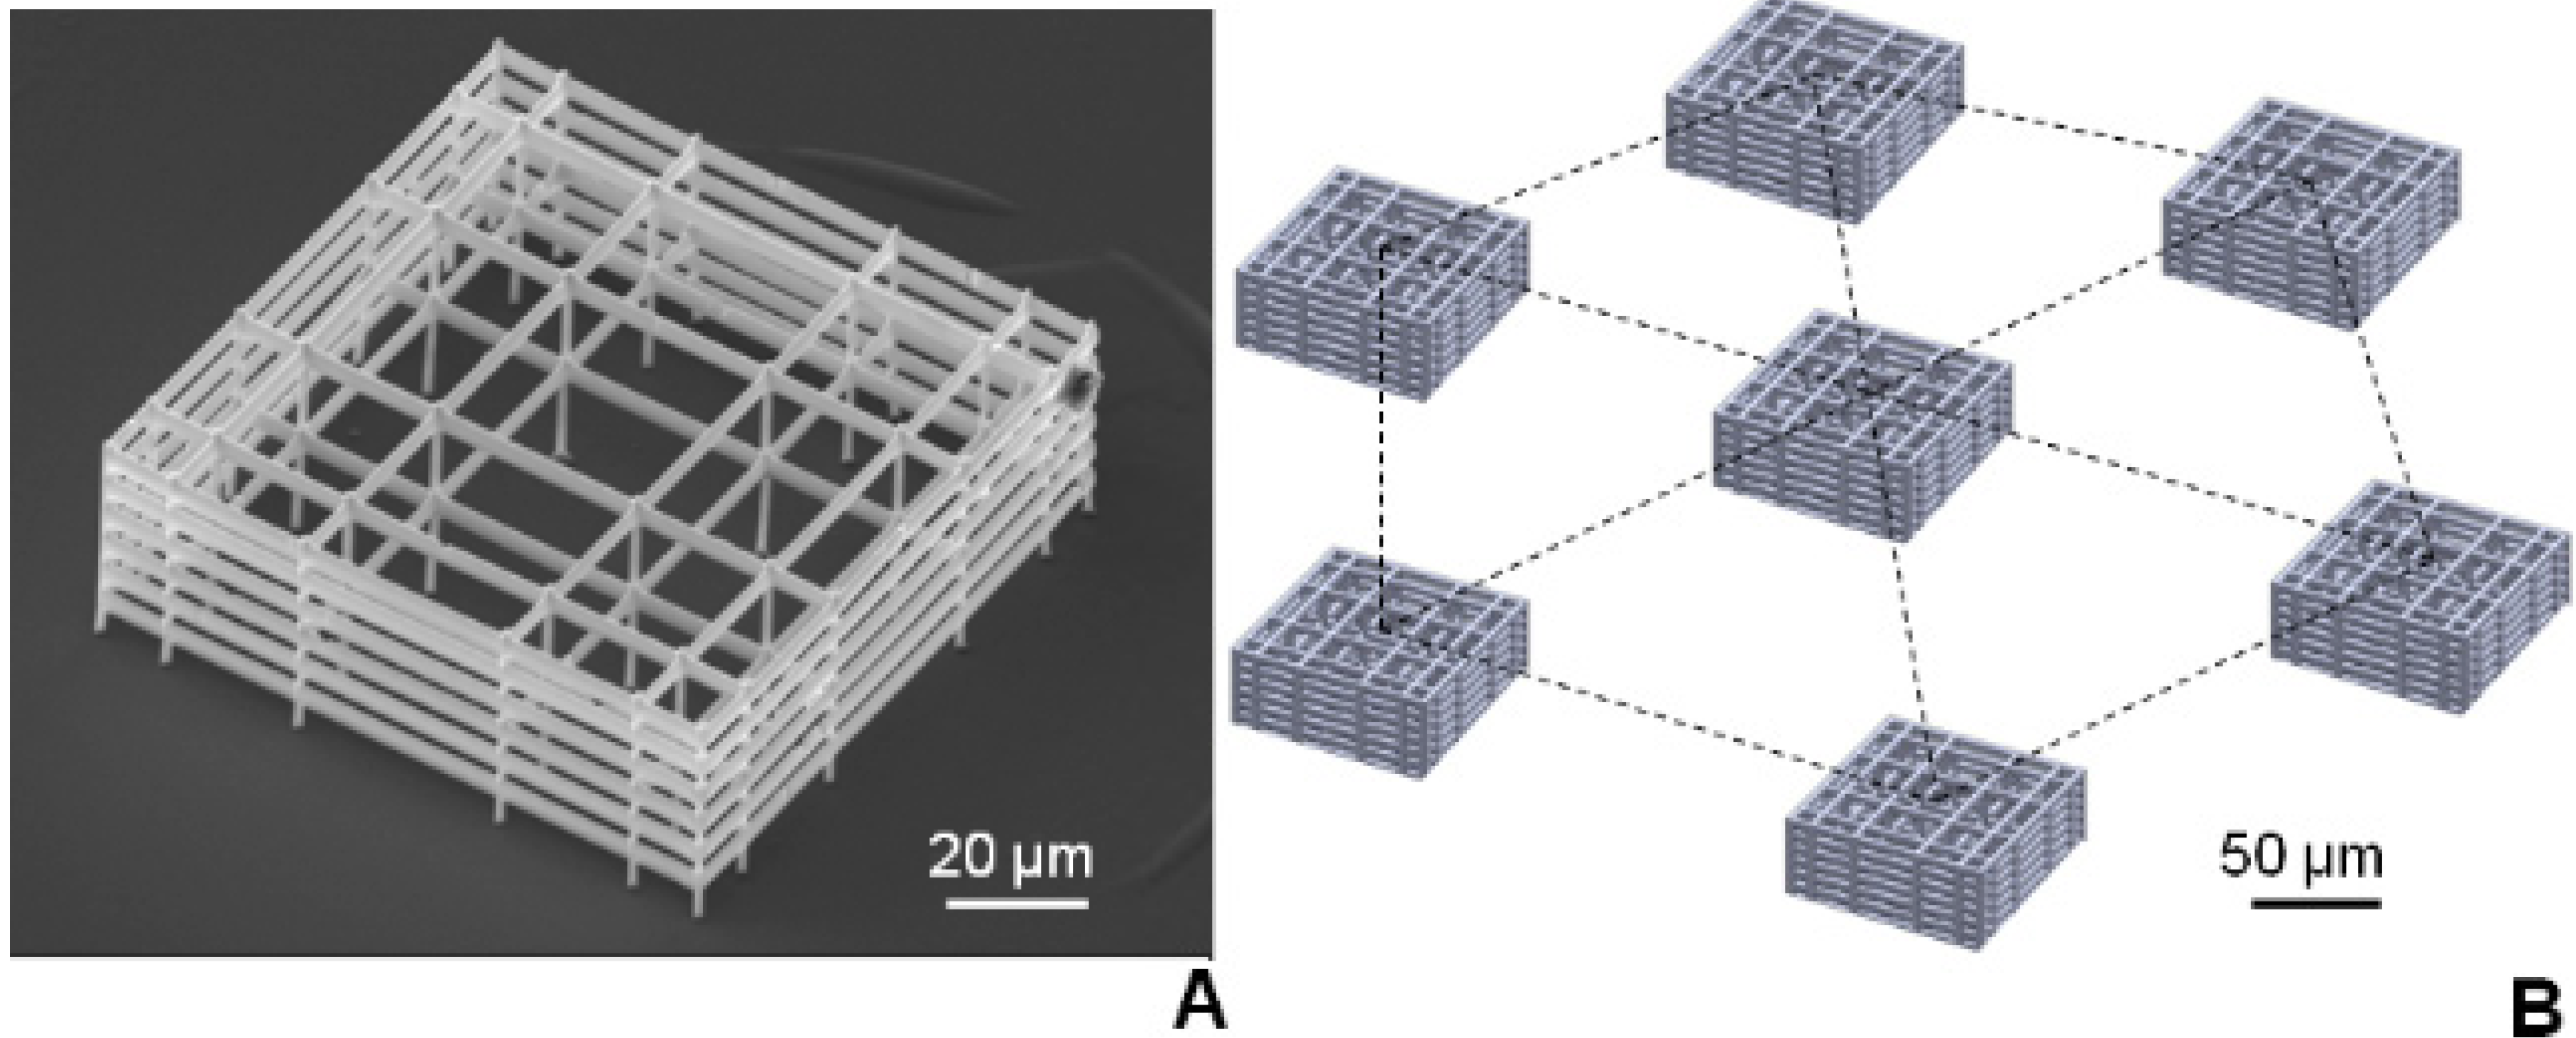
Figure 2, we fabricated seven microscaffolds on each cover glass, arranged in a hexagonal pattern with six scaffolds at the vertices and one at the center. The hexagon side was varied between 200 and 600 μm at 100 μm steps.
The niche geometry was selected from eight previously tested ones, as the one most favoring spontaneous MSC homing and proliferation [17]. This graded geometry (Figure 2) allows easy penetration of the cells from the larger central pores and a higher surface-to-volume ratio at the borders of the scaffold, where the external walls confine the cells. Individual microscaffolds were 30 µm high and 90 µm × 90 µm in transverse dimensions and consisted of a lattice of interconnected lines, with a graded spacing between 10 and 30 μm in the transverse direction and with a uniform spacing of 15 μm in the vertical direction. The 3D scaffold was surrounded by four outer confinement walls formed by horizontal rods spaced by 7.5 μm resulting in small gaps of 2 μm, which enable nutrients to pass through to the cells in the scaffold but prevent cells, which have entered to the niche, from escaping through the sides.
Figure 2. (A) SEM of the synthetic niche formed by 2PP. (B) Layout of scaffolds on each coverglass:seven niches were arranged in a hexagonal pattern and their relative distance was set at 200, 300, 400, 500, or 600 µm.
Micromachines 05 00341 g002

3.2. Stem Cell Proliferation and Colonization on Flat Surfaces

We first studied the response of stem cells on flat microscope slides without any niches. Cells adhered extensively to the substrate in a few hours, migrated and colonized all regions of the samples in a few days. The behaviour of cells cultured on unwritten microscopy slides did not differ significantly in any aspect from the behavior of cells localized, on the 2PP-written samples, in the regions far from the niches. 
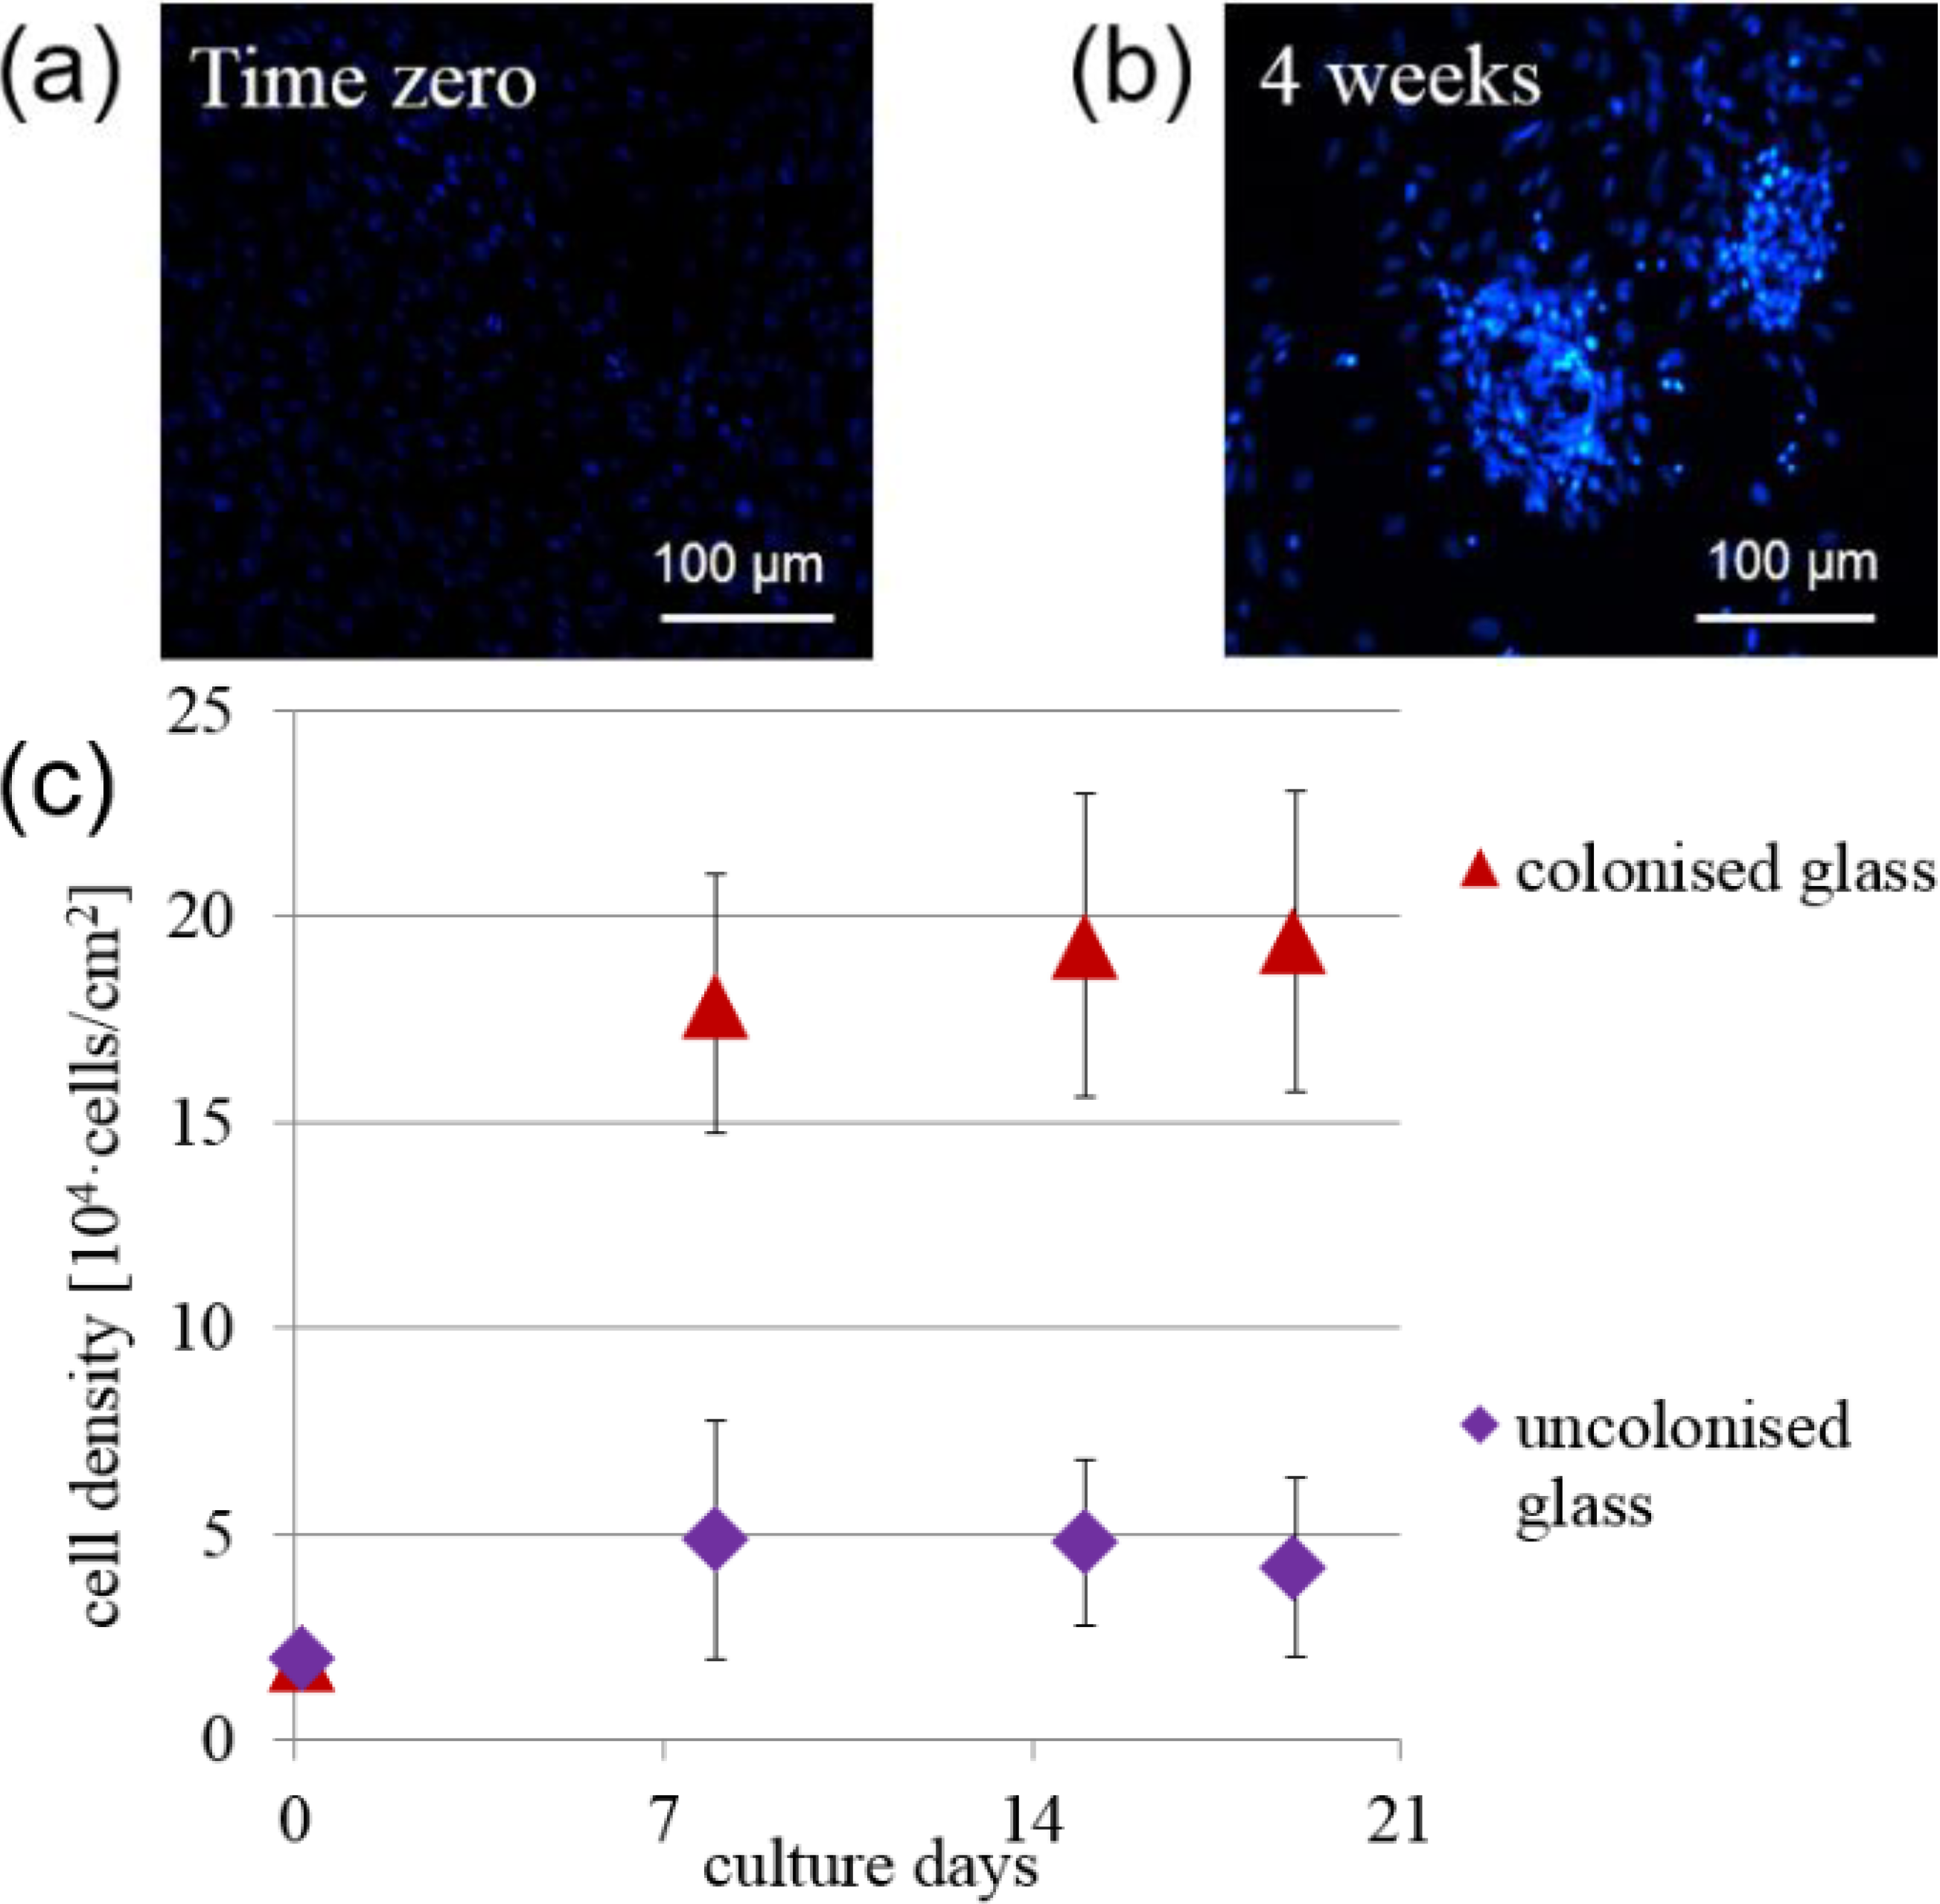
Figure 3 shows the time evolution of cell density in the colonies spontaneously formed on the glass substrate, and also in sample areas not colonized. Clearly, the cell density increased with time inside the colonies. Far from the colonies, the cell density does not increase significantly with time up to a period of three weeks. Also shown in Figure 3 are fluorescence microscope pictures at time zero and after four weeks, demonstrating the formation of colonies.
Figure 3. Fluorescence microcopy view of cell nuclei on flat glass at (a) time zero and at (b) four weeks; (c) Evolution of mean cell density versus time for cells in colonies and inother areas of the glass substrate. Values are given as mean and standard deviation of n = 15 measurements.
Micromachines 05 00341 g003
Cell clonogenicity was found, with a nearly constant density of about 1000 colonies/cm2 measured over the 3 week time period studied. The colonies were observed to change shape with time from culture day 7, with colonies raising up from the glass surface and progressively forming spherical cell aggregates at the two week point, as described in Figure 4A (top row). The average colony diameter (Figure 4B) initially increased as the colony formed and spread on the flat glass but with increased time, the diameter decreased as the colony raised up to form the spherical cell aggregate. The average distance between spontaneously formed colonies was about 400 µm (Figure 4C), which did not vary significantly with time from 0 to 21 days.
Figure 4. (A) Diagram of cell aggregate formation on flat glass (top row) and on niche (bottom row), (B) colony diameter evolution with time, (C) inter-colony distance versus time. Values are given as mean and standard deviation of n = 30 measurements.
Micromachines 05 00341 g004

3.3. Stem Cell Proliferation and Colonization within Niches

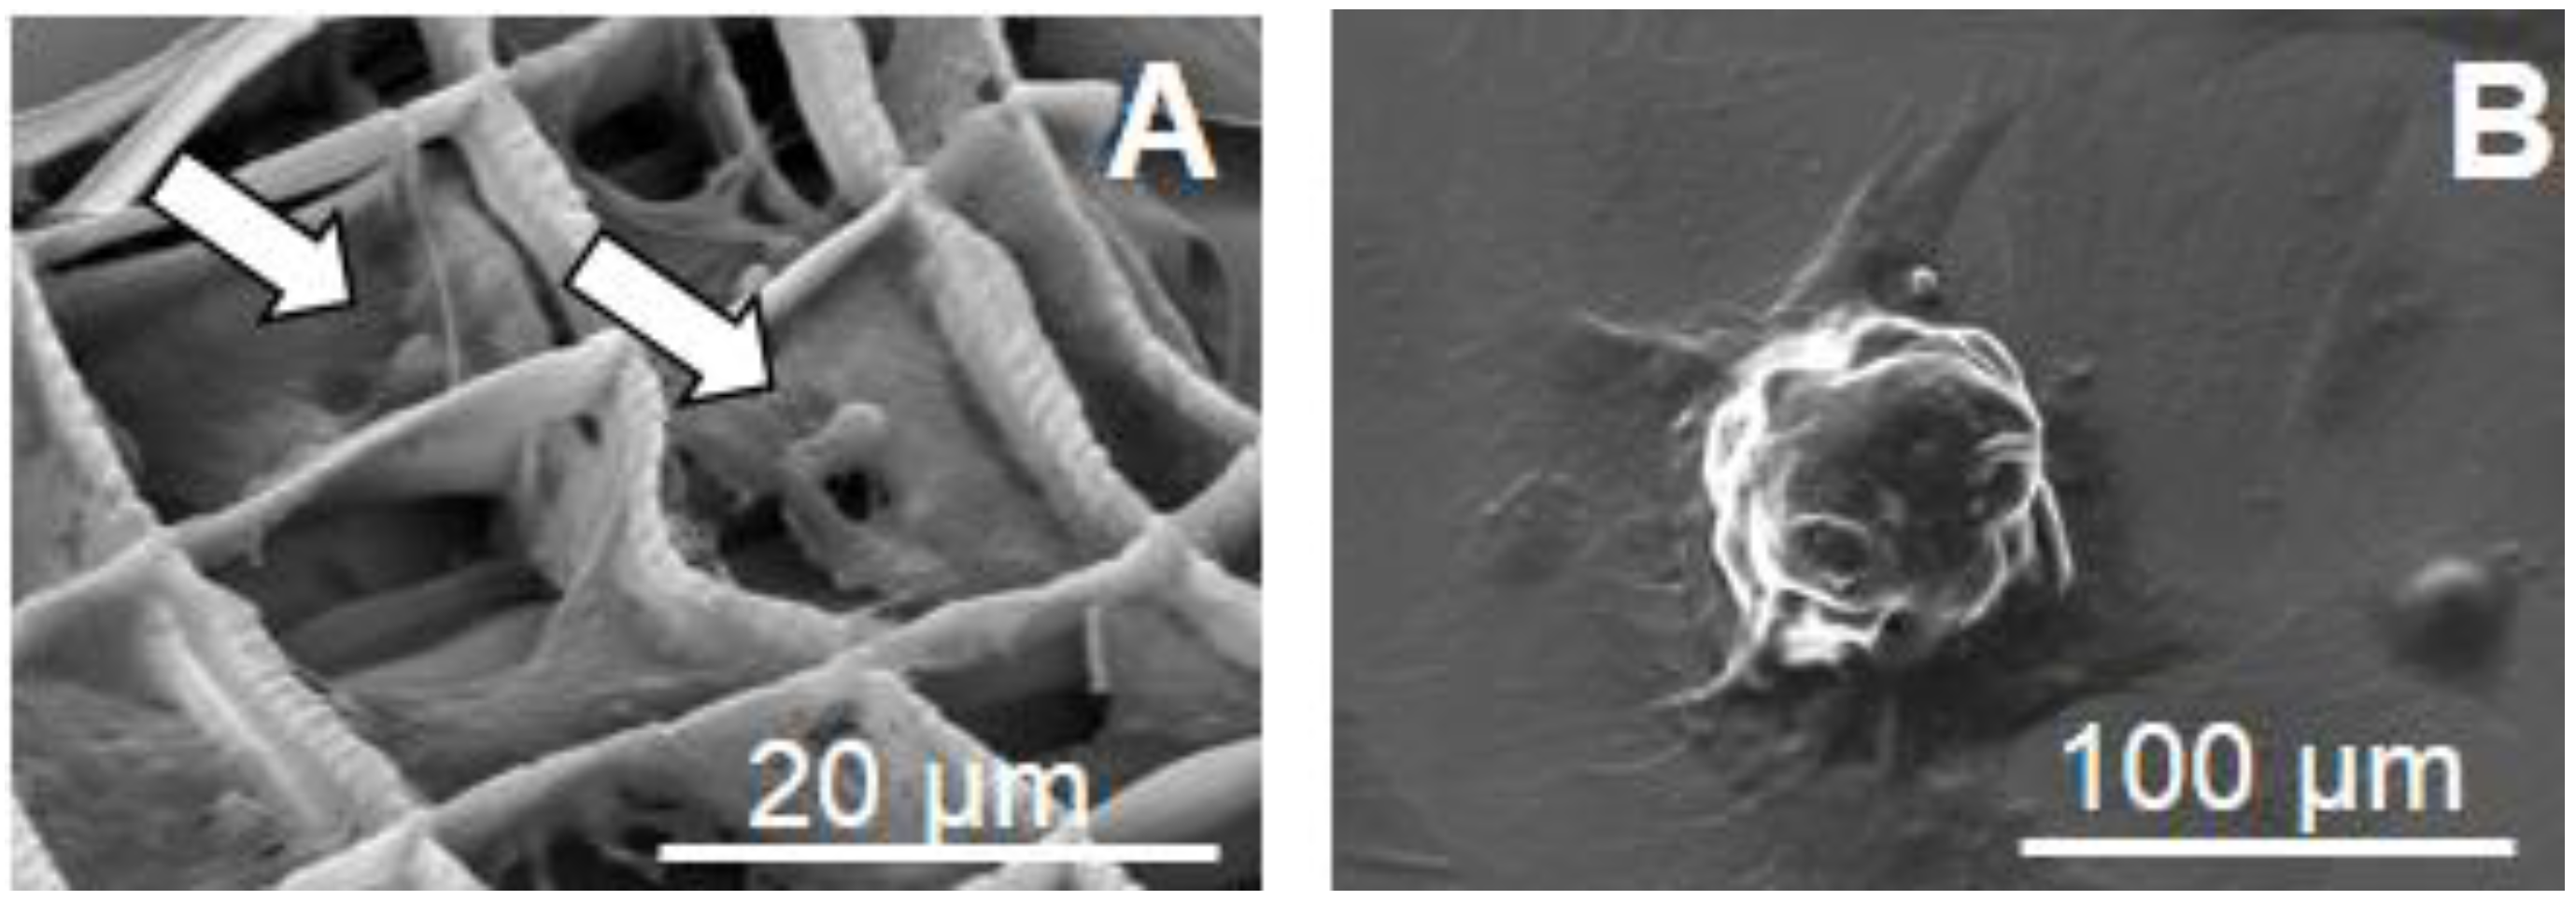
Cell aggregates were also observed to growon laser-formed niches, with a similar shape evolution as on the flat glass. The individual cells which take on rounder shapes when they adhere inside the niches (Figure 5A) eventually form an aggregate of cells (Figure 5B) with its bottom part within the niche. A pictorial description of this evolution is shown in Figure 4A (bottom). 
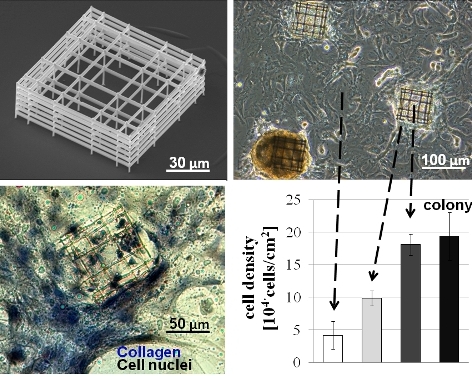
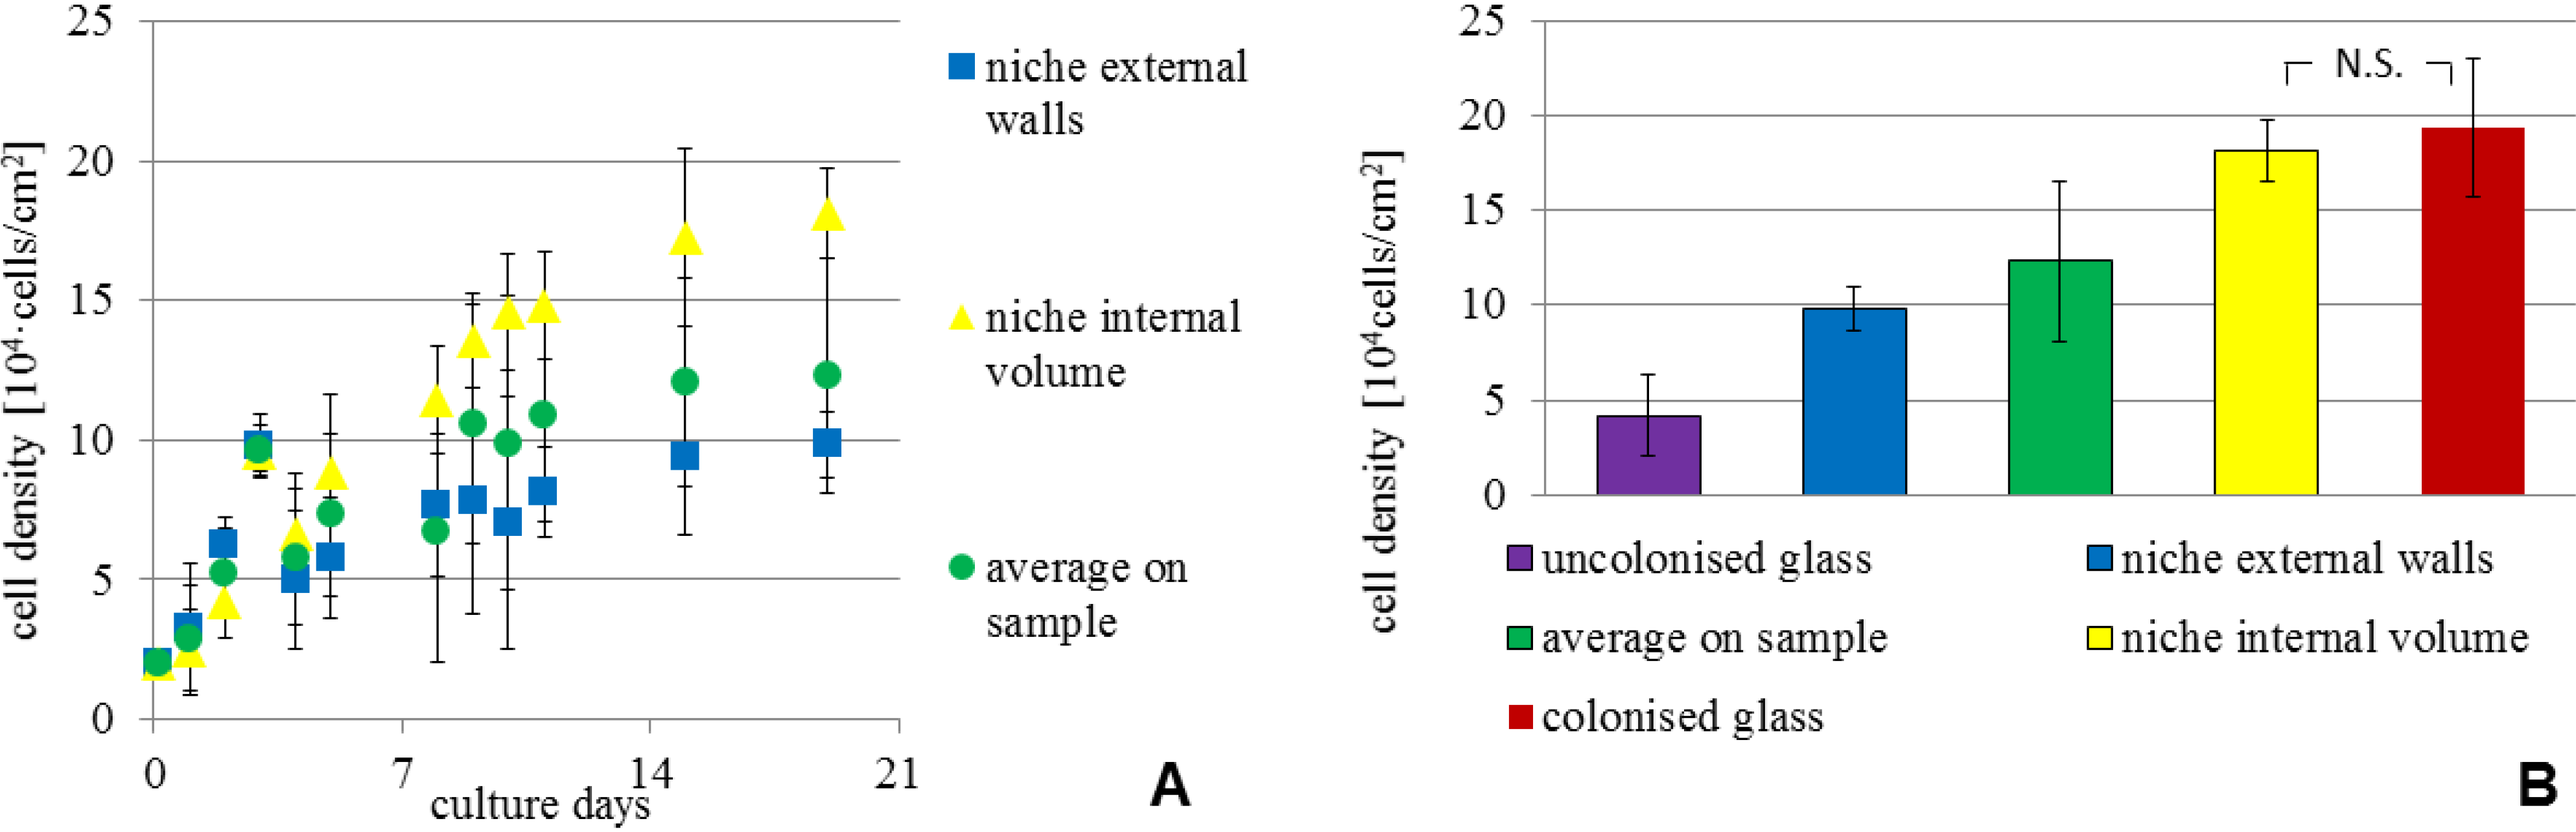
Figure 6A shows the cell density versus time for stem cells adhered inside the niches, on the external walls and also the average value on the entire sample for comparison. Stem cell density was highest inside the niches and increased with time, similar to the trend for cells in spontaneous colonies formed on the flat glass substrate (Figure 3).
To help in comparing the cell density in the various locations, Figure 6B shows the cell density at the three week mark. With respect to initial seeding density, the increase was by six-fold on the culture substrate on average, but by almost 10-fold in colonies, which formed both within the region covered by the structural niches and at random locations on the surrounding glass. When accounting for the cells also adhered to the external niche walls, the laser-formed niches had nearly three times higher cell density compared to the sample average, demonstrating that the artificial niches provide an environment favoring a local increase in cell density.
Figure 5. (A) SEM micrographs showing cells adhered to the internal lattice of the niche, with spherical morphology (arrows) and (B) spherical cell aggregates.
Micromachines 05 00341 g005
Figure 6. Cell morphology and proliferation in niches. (A) Growth curves measured for MSCs cultured on the synthetic niches; (B) cell density at culture day 21, measured at the various locations on the samples. All measurements are given as mean and standard deviation of n = 15 measurements; p < 0.01 for all pair-wise comparisons, except for * p > 0.05. N.S. indicates not statistically significant.
Micromachines 05 00341 g006
We showed previously [
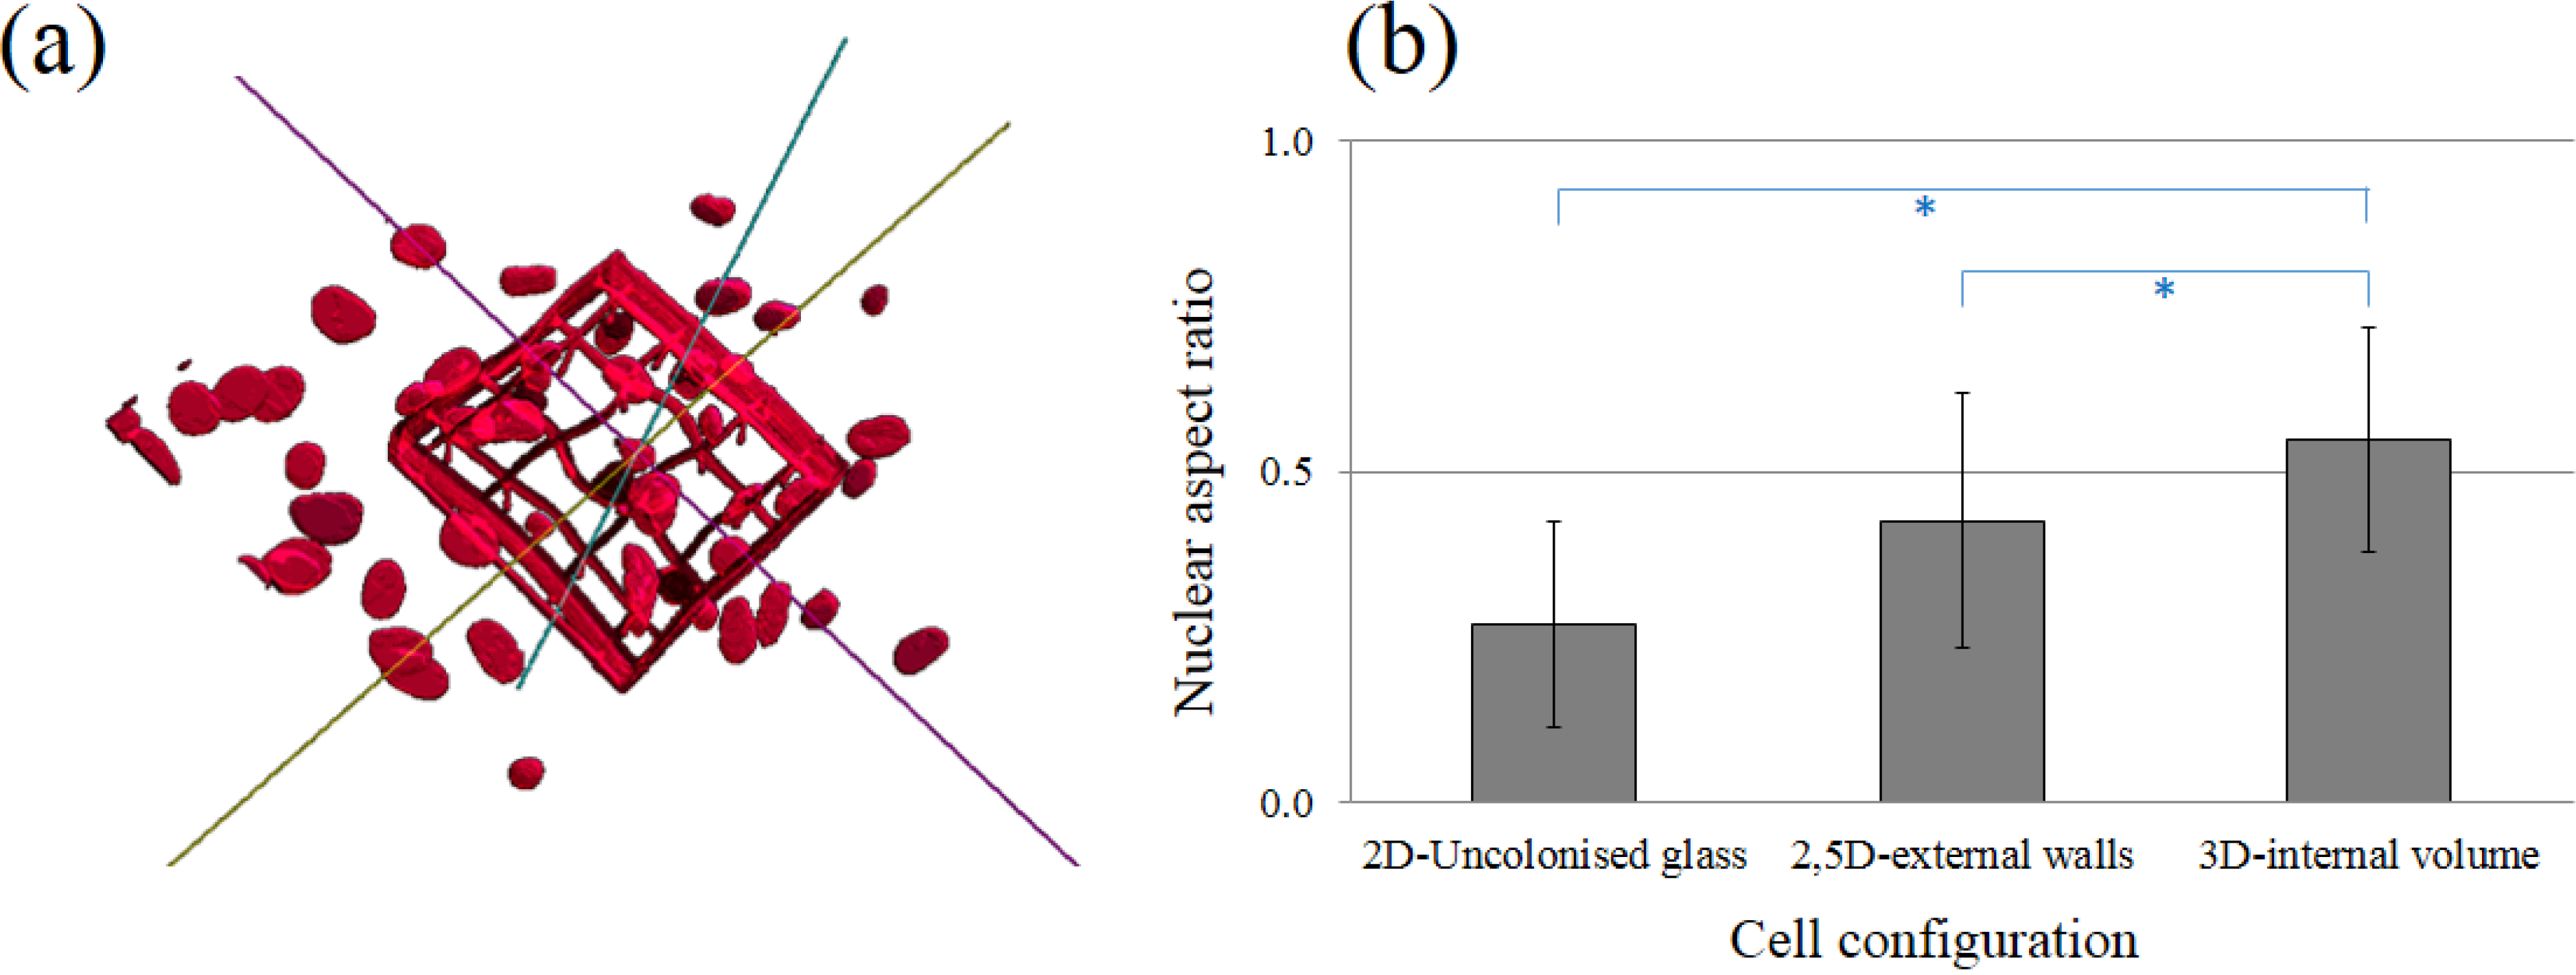
17] that cell morphology evolves from flat, when the cells are on the substrate and on the outer niche walls, to a more round shape once they are inside the niches, as they are able to bind in all spatial directions to the network of polymerized lines. A more quantitative validation of this important observation is shown in Figure 7, which shows a 3D reconstruction of solid models of cell nuclei from sequential images of cell-seeded niches, acquired with confocal microscopy on DAPI-stained cells. In Figure 7b, the nuclear aspect ratio, calculated as the ratio between shortest and longest semi-axes of the best fitting ellipsoid for the reconstructed nuclei, is shown at the various niche locations. A nuclear aspect ratio of 0 and 1 represent polarized and spherical nuclei, respectively. A two-fold more symmetric ellipsoidal shape is seen for the cells adhered inside the niche compared to those on the glass substrate.
Figure 7. Cell nuclear morphology. (a) 3D reconstruction of solid models of cell nuclei from sequential images of cell-seeded niches. (b) Nuclear aspect ratio at various niche locations. Values are given as mean and standard deviation of n = 10 measurements, with * p < 0.01 for all pair-wise comparisons.
Micromachines 05 00341 g007

3.3. Stem Cell Aggregation with Multiple Niches: Effect of Niche Separation

We next studied multiple niches oriented in a hexagonal geometry as depicted in Figure 2B. The niches were found to be structurally stable in culture up to three weeks. However, in certain conditions, we observed niche detachment from the glass substrate, attributed to the traction exerted by the growing cell colonies (Figure 8E). In previous work we estimated local substrate stresses induced by cell contraction [23]. The forces exerted by single cardiac progenitors were in the order of 10 nN. Other authors also estimated that the axons of neural progenitors can exert forces in the order of 3 nN, able to bend 2PP-fabricated polymeric ridges [24]. Previously we showed that the average distance between spontaneous colonies is about 400 µm on a substrate without niches (
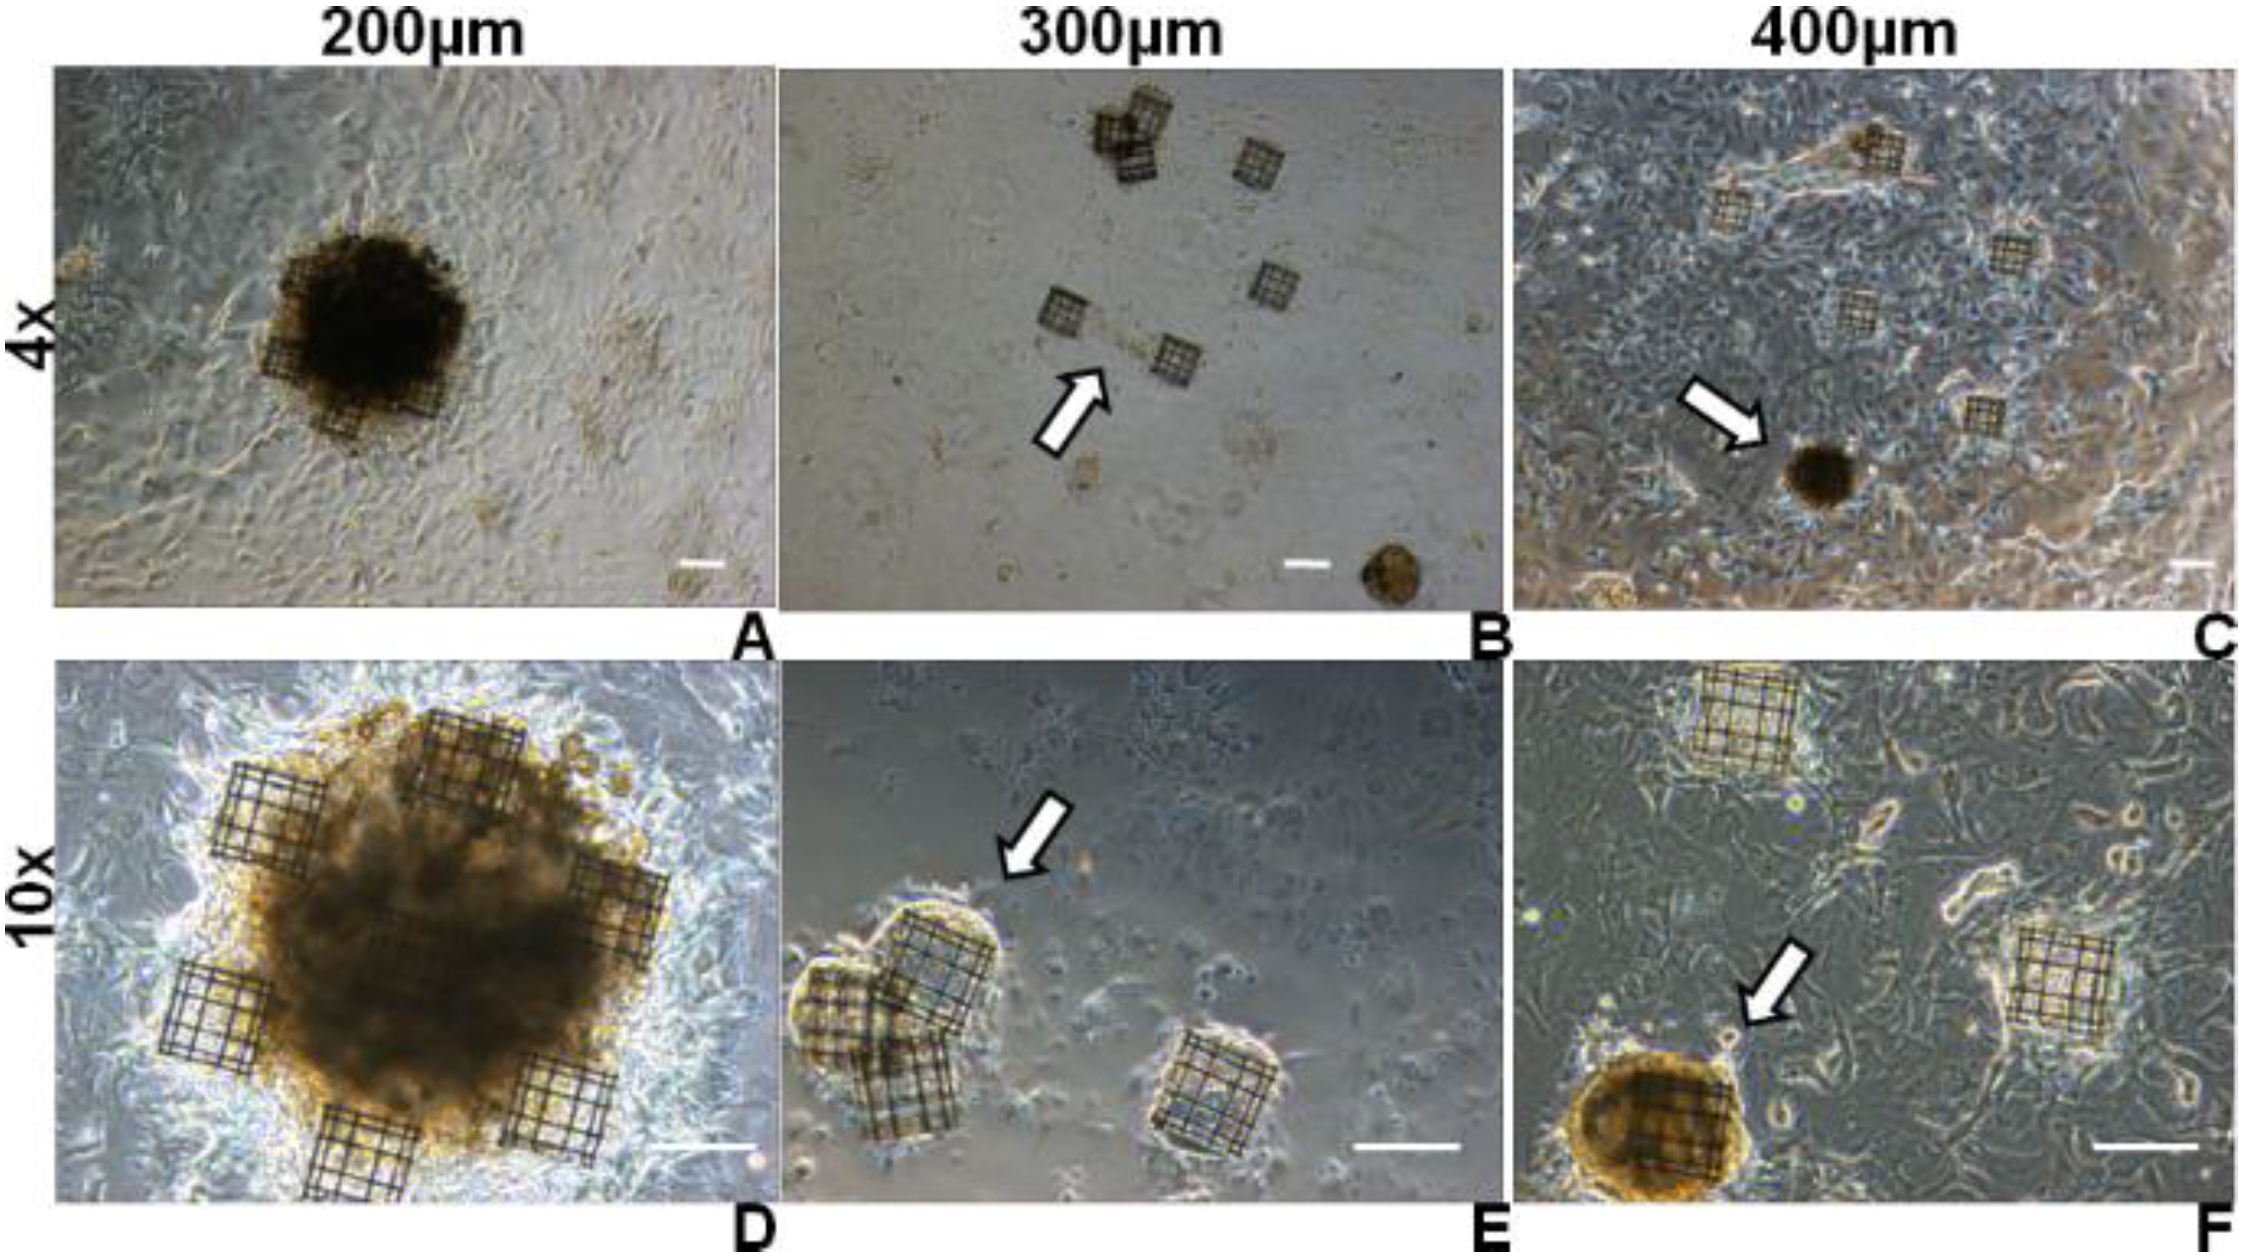
Figure 4C). When the scaffolds were at a distance much lower than this value, the cells on neighbouring scaffolds could easily interact with each other and a single large aggregate formed on top of the niche ensemble, as in the case of 200 μm inter-niche separation (Figure 8A,D); when the distance between the scaffolds was in the same order as the spontaneous separation between colonies (400 μm), colonies could not bridge the gap and individual aggregates formed on top of each niche (arrows in Figure 8C,F); when the distance between the scaffolds was intermediate (300 μm), the cells tended to pull the various scaffolds together to form a single colony(arrow in Figure 8B) and occasionally caused the detachment of the structures (arrow in Figure 8E). These detached niches did not fragment however, demonstrating satisfactory mechanical properties in relation to their application in advanced cell culture substrates.
Figure 8. At three weeks, phase contrast images acquired on MSC-seeded niche systems with different inter-niche relative distance of 200 µm (A, D), 300 μm (B, E), and 400 μm (C, F). Scale bars represent 100 µm. In (C, F), aggregates forming on top of each niche are indicated by arrows. In (B), an arrow shows the crosstalk between cells on adjacent niches which tended to pull the niches together and in some cases result in detachment, as indicated by the arrow in (E).
Micromachines 05 00341 g008

3.4. Stem Cell Renewal and Differentiation

Our study allowed us to directly compare, on the same sample, significantly different culture configurations: (a) flat glass (2D), (b) 3D-patterned vertical niche walls (engineered, 2.5D), (c) niche internal scaffold structure (engineered, 3D) and (d) cell micro-aggregates (spontaneous, 3D). Using this model, we studied differences in the spontaneous tendency of cells to renew and differentiate in the various configurations (a)–(d), without inducing interferences in the cross-talk between these various populations (
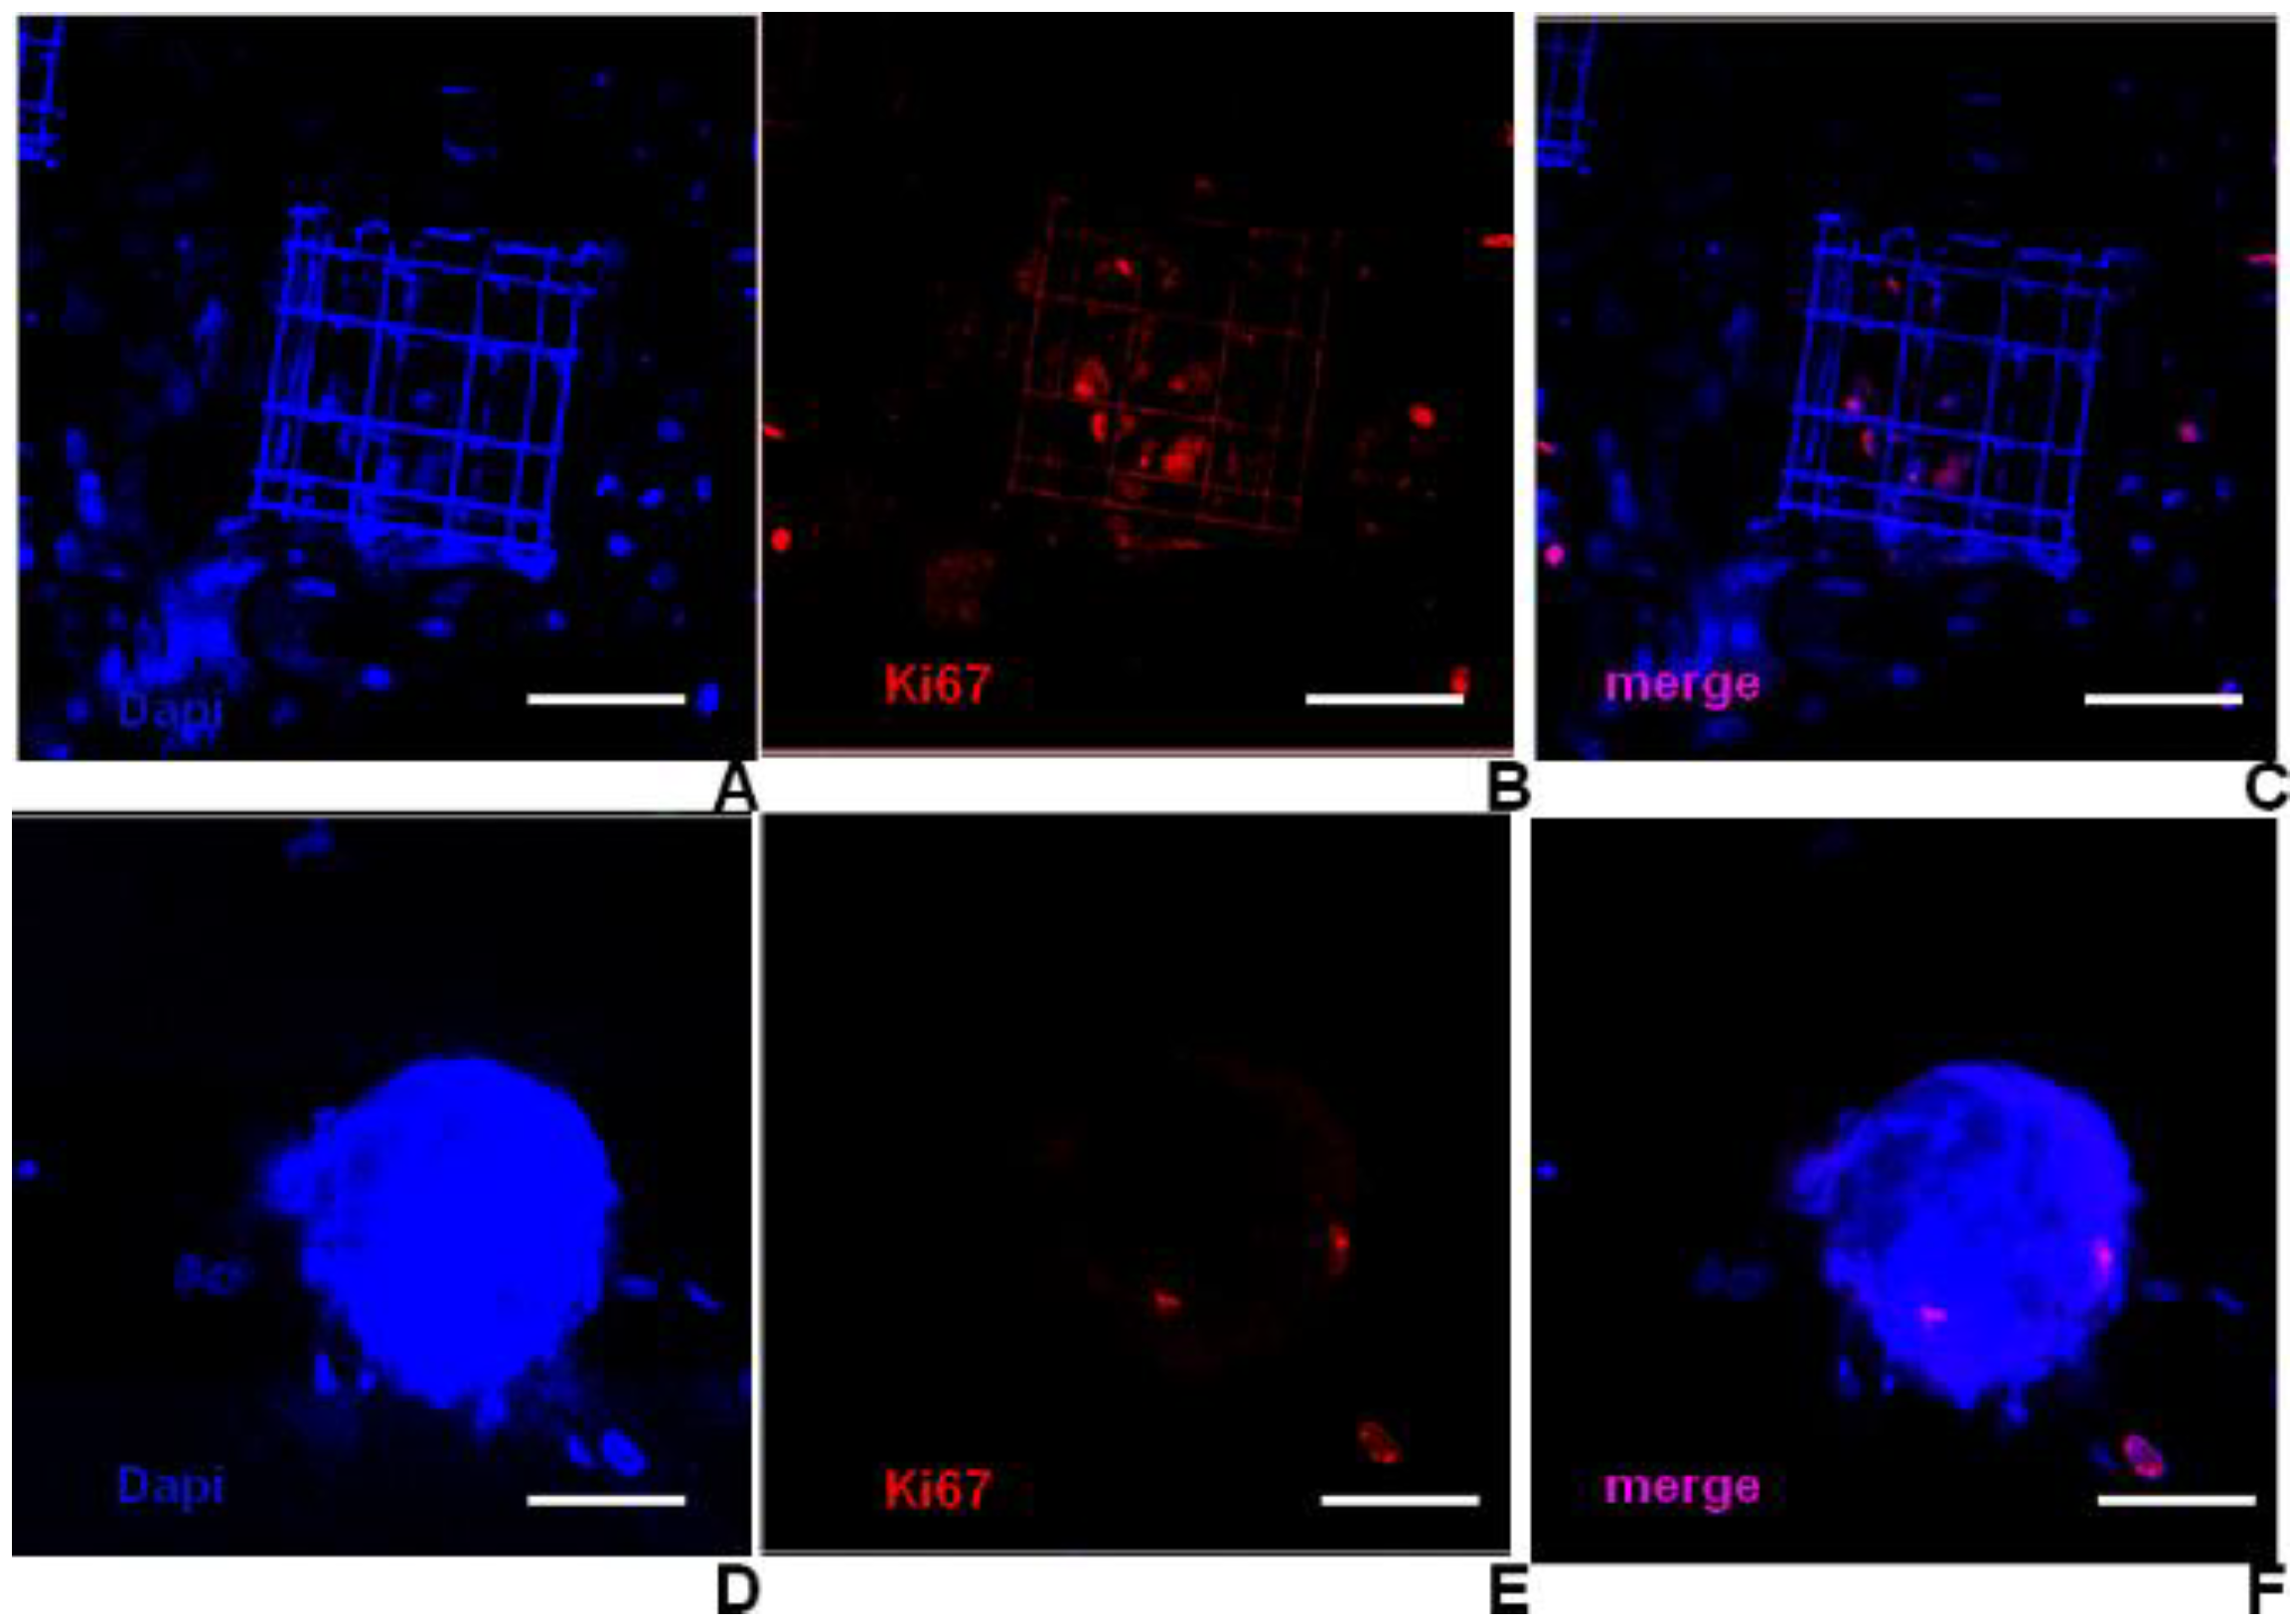
i.e., through paracrine mechanisms), which may impact proliferation and differentiation. In aggregates on the flat glass substrate, we found that only a few cells were positive to proliferative markers at the aggregate base (Figure 9D–F), i.e., at the interface between the aggregate and the flat glass surface, and to chondrogenic markers thoroughly. On the contrary, in aggregates growing on top of the niches, the proliferation markers were positive for the cells in the niches (Figure 9A–C), again located under the aggregates. Thus, structural niches were able not only to direct stem cell homing and colony formation, but also to guide aggregate formation, providing increased surface-to-volume ratios and space for stem cells to adhere and renew, respectively.
Cell differentiation showed quite different trends depending on the culture location (Figure 10 and Figure 11). It should be emphasized that chondrogenic, osteogenic, and adipogenic markers were stained in separate samples. The spherical cell aggregates were positive for early markers of chondrogenesis (aspecific collagen, GAG and collagen type 1) and negative for collagen type 2 and for all the other osteogenic and adipogenic markers tested. We are sure of this negativity because the positivity of the Ki67 marker was not masked by the autofluorescence of the structures. Cells adhering to the flat glass in regions far from the colonies were positive for early markers of osteogenic differentiation (collagen type 1 and mineral deposits) and negative for osteocalcin and all the other chondrogenic and adipogenic markers tested. Inside the niches however, cells were systematically negative for all the differentiation markers tested (Figure 10A–C and Figure 11B,C). In Figure 10A–C, we show the histological results in niches when the spacing is 200μm, to render possible the visualization of the internal niche areas, and in Figure 10D–F single aggregates. These results are likely correlated to the cell nuclear morphology, estimated from 3D image reconstruction, which varied significantly between the three regions of flat glass external niche walls, and internal niche lattice (Figure 7). Nuclear deformation was highest on flat glass and lowest inside structural niches.
Figure 9. Results of proliferation analysis using immunostaining for the Ki67 antigen. Images are z-stack projections of confocal acquisitions made over a thickness of 30 μm above the glass surface. The observation is performed in a region of the sample with a scaffold (A)–(C) and in a region with just flat glass (D)–(F). In both cases, a cell aggregate was present on top of the imaged region. (A), (D) Show the nuclei distribution; (B), (E) the proliferating cells; (C), (F) a merged image of the two previous ones. Proliferating cells are preferentially located in the central regions of the niches (B),while only a few active cells are observed at the bottom of cell aggregates spontaneously formed on flat glass (E). Scale is 50 µm.
Micromachines 05 00341 g009
Figure 10. Results of histology staining. (A), (D) Results of Von Kossa staining, in which cell nuclei stain pink and mineral deposits stain black. Sparse deposits are visible on the flat glass surface, in regions external to the niches and between aggregates; (B), (E) results of Masson Trichrome staining, in which cell nuclei stain black and collagen stains blue. Collagen is visualized in regions external to the niche and within spherical aggregates; (C, F) results of Safranin staining, in which nuclei stain pink and GAG stains orange. GAG is visualized within spherical aggregates. Scale bars are 50 µm.
Micromachines 05 00341 g010
Figure 11. MSC differentiation. Results of immunostaining for collagen type 1. (A)–(C) Collagen type 1 is typically visualized on the flat culture surface, externally to niches; (D)–(F) in cell aggregates, collagen type 1 is typically visualized on the spherical periphery of the aggregate. Scale bars are 50 µm.
Micromachines 05 00341 g011
This interpretation must be supported by a more in-depth characterization with specific markers, as well as with experiments which could establish a cause–effect relationship between the cell nuclear morphology and cell fate. However, cells adhered and grew in the structural niches as single cells and not aggregates, coherently with their 3D adhesion configuration, likely inducing an isotropic cytoskeletal tension state that mimics the one present in the native niche [25]. The combination of cytoskeletal isotropy and hypoxia (inevitably occurring in static culture at increasing cell densities, and presumably maximal at the bottom of the highly-consuming cell aggregates forming on top of the niches), is also emerging as a critical determinant of multipotency maintenance in stem cells [26]. The absence of positivity of all the tested differentiation markers in the niches may be a sign of maintenance of the cell multipotency, especially because it was also correlated to increased proliferation. However, further studies to detect the simultaneous presence of known membrane markers of MSC stemness (including CD29, CD44, CD90, CD105) are necessary to corroborate the hypothesis of maintenance of stemness inside the niches.

3.5. Potential Clinical Implications

If the observations reported here for animal cells are confirmed for human cells in our future experiments, our “structurally” biomimetic niche system could find potential applications in two main directions.
By extrapolation from our cell density measurements, showing no difference in the cell density occurring in glass colonies with respect to niche colonies at three culture weeks, we can hypothesize that a macroscopic culture plate, completely covered by niches, would induce a homogeneous cell density approaching colony density, i.e., 0.2 million cells/cm2, a cell density 67% greater than the average 0.12 million cells/cm2 measured in standard 2D culture (Figure 6, “average on sample” curve). Thus, one potential application of our niche system could be to produce therapeutic MSC cells in large, pharmaceutically relevant scales.
Secondly, we could exploit the ability of these niches to increase cell renewal while maintaining cell multipotency in the structured layer. MSCs from patients could be expanded and maintained in culture for longer periods, until the formation of niche aggregates, which could be easily harvested from the culture substrate and delivered as a customized cell therapy for chronic disorders, on a repeated basis. The cells with higher “stemness” found within niches could be maintained in culture after aggregate removal, and the process of aggregate fabrication would spontaneously restart production of a further therapeutic cell dose. In our observations, the aggregate cells consistently committed towards the chondrogenic lineage, thus they contained cells potentially useful for cartilage regeneration therapies.

4. Conclusions

In this work, we studied the response of mesenchymal stem cells over a three-week period in direct laser-written 3D synthetic polymer niches, showing strong proliferation compared to average locations on the sample. By fitting the nuclei of stem cells as ellipsoids, we demonstrated a flatter morphology of stem cells on the outer glass surface and niche outer side walls, whereas inside the niche, stem cells adhered in all spatial directions to the 3D environment and became more round in shape.
We found an average inter-colony distance of 400 μm on flat cover glass, and thus fabricated multiple niches in a hexagonal pattern, spaced by a similar distance. When the scaffolds were closely spaced (~200 μm), resulting in a strong interaction between cells on neighboring niches, this led to the formation of a single, large aggregate on top of the niche ensemble. However, when the distance between the scaffolds was on the same order as the spontaneous separation between colonies (400 μm), colonies were unable to bridge the gap between scaffolds and individual aggregates formed on top of each niche. The average cell density was not dependent on the inter-niche distance. In the hypothesis of using the aggregate cells in a therapeutic application, all the tested inter-niche distances would perform comparably. However, in the hypothesis of therapeutic application of the undifferentiated cells, it would be preferable to obtain large stem cell numbers in short expansion times. In this regard, a shorter inter-niche distance would be preferable.
Over 21 days, such aggregates of stem cells, initially flat and circular colonies, eventually became spherical in shape, both on niches and on the glass substrate, likely recapitulating the contraction phase that precedes the formation of limb drafts in the embryonic connective tissue (i.e., the “mesenchyme”). A different stem cell response was observed depending on the environment: a lineage commitment was observed in 2D (cover glass) and 2.5D (niche outer side walls) regions, even without supplements such as Dexamethasone. In the 3D engineered niches, however, we did not observe any evidence of cell differentiation, which is attributed to a reduced deformation of the cell nuclei following an isotropic cytoskeletal tension state. Such an effect could be exploited for the development of novel customized cell therapies.
To give more conclusive evidence of multipotency maintenance within niches, characterization at the gene expression level of cells inside and outside the niches is required, which was not possible on the relatively few cells (140 per sample, on average) contained inside the seven niches of each substrate in this study. To this purpose, we are now extending the culture surface covered by the niches to larger areas up to 1 cm2, with the aim of obtaining larger niche-cultured cell numbers compared to the average 17 cells/niche available now. In addition, we are currently performing experiments for functionalizing the niche surface with respect to its stiffness by a suitable coating, to further control cell adhesion.

Acknowledgments

We thank Renato Bertozzi for his outstanding technical assistance to this work. We thank Gugliemo Lanzani for use of the FemtoFab facility at CNST—IIT for the 2PP experiments. We thank Marina Figliuzzi and Irene Cattaneo for their expert help in the cell differentiation studies. This research is supported by the grant: “3D Micro structuring and Functionalisation of Polymeric Materials for Scaffolds in Regenerative Medicine” (Fondazione Cariplo, 2010). The funding source had no involvement in the study design, collection, analysis, interpretation of data, paper writing and in the decision to submit it for publication. This work is dedicated to the memory of Paulius Danilevičius, a young leader in the field of bioscaffolds, whose radiance will be deeply missed.

Author Contributions

M.T. Raimondi and R. Osellame designed the study; S.M. Eaton, A. Bernasconi, and M.M. Nava performed laser writing experiments; M.T. Raimondiand M.M. Nava performed stem cell culture and characterization on the niches; M.T. Raimondi, S.M. Eaton, R. Osellame and G. Cerullo wrote the manuscript; G. Cerullo and K.C. Vishnubhatla gave technical support and conceptual advice.

Conflicts of Interest

The authors declare no conflict of interest.

References

  1. Joddar, B.; Ito, Y. Artificial niche substrates for embryonic and induced pluripotent stem cell cultures. J. Biotechnol. 2013, 168, 218–228. [Google Scholar] [CrossRef]
  2. Kothapalli, C.R.; Kamm, R.D. 3D matrix microenvironment for targeted differentiation of embryonic stem cells into neural and glial lineages. Biomaterials 2013, 34, 5995–6007. [Google Scholar] [CrossRef]
  3. Nava, M.M.; Raimondi, M.T.; Pietrabissa, R. Controlling self-renewal and differentiation of stem cells via mechanical cues. J. Biomed. Biotechnol. 2012, 2012, 797410. [Google Scholar] [CrossRef]
  4. Tseng, P.-C.; Young, T.-H.; Wang, T.-M.; Peng, H.-W.; Hou, S.-M.; Yen, M.-L. Spontaneous osteogenesis of mscs cultured on 3D microcarriers through alteration of cytoskeletal tension. Biomaterials 2012, 33, 556–564. [Google Scholar] [CrossRef]
  5. Liu, H.; Peng, H.; Wu, Y.; Zhang, C.; Cai, Y.; Xu, G.; Li, Q.; Chen, X.; Ji, J.; Zhang, Y. The promotion of bone regeneration by nanofibrous hydroxyapatite/chitosan scaffolds by effects on integrin-BMP/Smad signaling pathway in BMSCs. Biomaterials 2013, 34, 4404–4417. [Google Scholar] [CrossRef]
  6. Badique, F.; Stamov, D.R.; Davidson, P.M.; Veuillet, M.; Reiter, G.; Freund, J.-N.; Franz, C.M.; Anselme, K. Directing nuclear deformation on micropillared surfaces by substrate geometry and cytoskeleton organization. Biomaterials 2013, 34, 2991–3001. [Google Scholar] [CrossRef]
  7. Nathan, A.S.; Baker, B.M.; Nerurkar, N.L.; Mauck, R.L. Mechano-topographic modulation of stem cell nuclear shape on nanofibrous scaffolds. Acta Biomater. 2011, 7, 57–66. [Google Scholar] [CrossRef]
  8. Kawata, S.; Sun, H.-B.; Tanaka, T.; Takada, K. Finer features for functional microdevices. Nature 2001, 412, 697–698. [Google Scholar] [CrossRef]
  9. Ovsianikov, A.; Mironov, V.; Stampfl, J.; Liska, R. Engineering 3D cell-culture matrices: Multiphoton processing technologies for biological and tissue engineering applications. Expert Rev. Med. Devices 2012, 9, 613–633. [Google Scholar] [CrossRef]
  10. Malinauskas, M.; Farsari, M.; Piskarskas, A.; Juodkazis, S. Ultrafast laser nanostructuring of photopolymers: A decade of advances. Phys. Rep. 2013, 533, 1–31. [Google Scholar]
  11. Amato, L.; Gu, Y.; Bellini, N.; Eaton, S.M.; Cerullo, G.; Osellame, R. Integrated three-dimensional filter separates nanoscale from microscale elements in a microfluidic chip. Lab Chip 2012, 12, 1135–1142. [Google Scholar] [CrossRef]
  12. Heller, C.; Schwentenwein, M.; Russmüller, G.; Koch, T.; Moser, D.; Schopper, C.; Varga, F.; Stampfl, J.; Liska, R. Vinylcarbonates and vinylcarbamates: Biocompatible monomers for radical photopolymerization. J. Poly. Sci. Part A Polym. Chem. 2011, 49, 650–661. [Google Scholar] [CrossRef]
  13. König, K.; Uchugonova, A.; Straub, M.; Zhang, H.; Licht, M.; Afshar, M.; Feili, D.; Seidel, H. Sub-100 nm material processing and imaging with a sub-15 femtosecond laser scanning microscope. J. Laser Appl. 2012, 24, 042009. [Google Scholar] [CrossRef]
  14. Tayalia, P.; Mendonca, C.R.; Baldacchini, T.; Mooney, D.J.; Mazur, E. 3D cell-migration studies using two-photon engineered polymer scaffolds. Adv. Mater. 2008, 20, 4494–4498. [Google Scholar] [CrossRef]
  15. Ovsianikov, A.; Viertl, J.; Chichkov, B.; Oubaha, M.; MacCraith, B.; Sakellari, I.; Giakoumaki, A.; Gray, D.; Vamvakaki, M.; Farsari, M.; et al. Ultra-low shrinkage hybrid photosensitive material for two-photon polymerization microfabrication. ACS Nano 2008, 2, 2257–2262. [Google Scholar] [CrossRef]
  16. Raimondi, M.T.; Eaton, S.M.; Nava, M.M.; Laganà, M.; Cerullo, G.; Osellame, R. Two-photon laser polymerization: From fundamentals to biomedical application in tissue engineering and regenerative medicine. J. Appl. Biomater. Funct. Mater. 2012, 10, 55–65. [Google Scholar]
  17. Raimondi, M.T.; Eaton, S.M.; Laganà, M.; Aprile, V.; Nava, M.M.; Cerullo, G.; Osellame, R. Three-dimensional structural niches engineered via two-photon laser polymerization promote stem cell homing. Acta Biomater. 2013, 9, 4579–4584. [Google Scholar] [CrossRef]
  18. Malinauskas, M.; Žukauskas, A.; Bičkauskaitė, G.; Gadonas, R.; Juodkazis, S. Mechanisms of three-dimensional structuring of photo-polymers by tightly focussed femtosecond laser pulses. Opt. Express 2010, 18, 10209–10221. [Google Scholar] [CrossRef]
  19. Zoja, C.; Garcia, P.B.; Rota, C.; Conti, S.; Gagliardini, E.; Corna, D.; Zanchi, C.; Bigini, P.; Benigni, A.; Remuzzi, G. Mesenchymal stem cell therapy promotes renal repair by limiting glomerular podocyte and progenitor cell dysfunction in adriamycin-induced nephropathy. Am. J. Physiol. Ren. Physiol. 2012, 303, F1370–F1381. [Google Scholar] [CrossRef]
  20. Danilevicius, P.; Rekstyte, S.; Balciunas, E.; Kraniauskas, A.; Jarasiene, R.; Sirmenis, R.; Baltriukiene, D.; Bukelskiene, V.; Gadonas, R.; Malinauskas, M. Micro-structured polymer scaffolds fabricated by direct laser writing for tissue engineering. J. Biomed. Opt. 2012, 17, 08145. [Google Scholar] [CrossRef]
  21. Buividas, R.; Rekstyte, S.; Malinauskas, M.; Juodkazis, S. Nano-groove and 3D fabrication by controlled avalanche using femtosecond laser pulses. Opt. Mater. Express 2013, 3, 1674–1686. [Google Scholar] [CrossRef]
  22. Serra, F.; Eaton, S.M.; Cerbino, R.; Buscaglia, M.; Cerullo, G.; Osellame, R.; Bellini, T. Nematic liquid crystals embedded in cubic microlattices: Memory effects and bistable pixels. Adv. Funct. Mater. 2013, 23, 3990–3994. [Google Scholar] [CrossRef]
  23. Raimondi, M.T.; Balconi, G.; Boschetti, F.; Di Metri, A.; Mohammed, S.A.A.; Quaglini, V.; Araneo, L.; Galvéz, B.G.; Lupi, M.; Latini, R.; et al. An opto-structural method to estimate the stress-strain field induced by cell contraction on substrates of controlled stiffness in vitro. J. Appl. Biomater. Funct. Mater. 2013, 11, e143–e150. [Google Scholar]
  24. Marino, A.; Ciofani, G.; Filippeschi, C.; Pellegrino, M.; Pellegrini, M.; Orsini, P.; Pasqualetti, M.; Mattoli, V.; Mazzolai, B. Two-photon polymerization of sub-micrometric patterned surfaces: Investigation of cell-substrate interactions and improved differentiation of neuron-like cells. ACS Appl. Mater. Interfaces 2013, 5, 13012–13021. [Google Scholar]
  25. Rompolas, P.; Mesa, K.R.; Greco, V. Spatial organization within a niche as a determinant of stem-cell fate. Nature 2013, 502, 513–518. [Google Scholar] [CrossRef]
  26. Hazeltine, L.B.; Selekman, J.A.; Palecek, S.P. Engineering the human pluripotent stem cell microenvironment to direct cell fate. Biotechnol. Adv. 2013, 31, 1002–1019. [Google Scholar]

