Article

FRoG—A New Calculation Engine for Clinical Investigations with Proton and Carbon Ion Beams at CNAO

1
Centro Nazionale di Adroterapia Oncologica, 27100 Pavia, Italy
2
Department of Physics, Pavia University, 27100 Pavia, Italy
3
Department of Physics, Heidelberg University, 69120 Heidelberg, Germany
4
Imaging and Radiation Oncology, German Cancer Research Center (DKFZ), 69210 Heidelberg, Germany
5
Radiation Oncology, Heidelberg University Clinic, 69120 Heidelberg, Germany
6
Heidelberg Ion Beam Therapy Center (HIT), 69120 Heidelberg, Germany
*
Author to whom correspondence should be addressed.
Cancers 2018, 10(11), 395; https://doi.org/10.3390/cancers10110395
Submission received: 28 August 2018 / Revised: 15 October 2018 / Accepted: 16 October 2018 / Published: 23 October 2018
(This article belongs to the Special Issue Proton and Carbon Ion Therapy)

Abstract

:
A fast and accurate dose calculation engine for hadrontherapy is critical for both routine clinical and advanced research applications. FRoG is a graphics processing unit (GPU)-based forward calculation tool developed at CNAO (Centro Nazionale di Adroterapia Oncologica) and at HIT (Heidelberg Ion Beam Therapy Center) for fast and accurate calculation of both physical and biological dose. FRoG calculation engine adopts a triple Gaussian parameterization for the description of the lateral dose distribution. FRoG provides dose, dose-averaged linear energy transfer, and biological dose-maps, -profiles, and -volume-histograms. For the benchmark of the FRoG calculation engine, using the clinical settings available at CNAO, spread-out Bragg peaks (SOBPs) and patient cases for both proton and carbon ion beams have been calculated and compared against FLUKA Monte Carlo (MC) predictions. In addition, FRoG patient-specific quality assurance (QA) has been performed for twenty-five proton and carbon ion fields. As a result, for protons, biological dose values, using a relative biological effectiveness (RBE) of 1.1, agree on average with MC within ~1% for both SOBPs and patient plans. For carbon ions, RBE-weighted dose (DRBE) agreement against FLUKA is within ~2.5% for the studied SOBPs and patient plans. Both MKM (Microdosimetric Kinetic Model) and LEM (Local Effect Model) DRBE are implemented and tested in FRoG to support the NIRS (National Institute of Radiological Sciences)-based to LEM-based biological dose conversion. FRoG matched the measured QA dosimetric data within ~2.0% for both particle species. The typical calculation times for patients ranged from roughly 1 to 4 min for proton beams and 3 to 6 min for carbon ions on a NVIDIA® GeForce® GTX 1080 Ti. This works demonstrates FRoG’s potential to bolster clinical activity with proton and carbon ion beams at CNAO.

1. Introduction

Radiation therapy requires dose computation on computed tomography (CT) images for each patient with high accuracy and fast calculation time. A clinical treatment planning system (TPS) for proton and carbon ions typically uses an analytical algorithm for dose calculation on a central processing unit (CPU). Recently, graphics processing unit (GPU)-based clinical TPSs have been made available (e.g., Raystation, RaySearch Laboratories, Stockholm, Sweden), promising enhanced calculation speeds for the even more time-consuming Monte Carlo (MC) codes [1]. The benefit of improved precision is clear for the more technologically demanding modalities such as particle therapy. In the near future, compact high-performance systems will become commonplace in the clinic, making routine integration of advanced physical and biophysical models feasible [1,2,3].
Presently, the commercial TPS used during clinical operation at CNAO (Centro Nazionale Adroterapia Oncologica [4]), Syngo-VC13 (Siemens AG, Mannheim, Germany), is a CPU-based system. Syngo-VC13 calculates biological dose by applying a fixed relative biological effectiveness (RBE) of 1.1 [5] for proton beams and the biological model LEM I (Local Effect Model [6]) for carbon ion beams. Syngo, as well as the other analytical systems, in comparison to MC approaches, has limitations in handling patient heterogeneities and small fields with and without the range shifter (RS) especially with proton beams [7]. Additionally, calculation features for clinically relevant biophysical quantities are often missing from such programs, such as dose-averaged linear energy transfer (LETd) distributions in water for proton beams or RBE-weighted dose (DRBE) for carbon ions with other biological models including the modified MKM (Microdosimetric Kinetic Model [8]). The modified MKM is applied at the carbon ion therapy facility NIRS (National Institute of Radiological Sciences) in Japan for carbon ion therapy planning [9]. At CNAO, the fractionation scheme used at NIRS has been employed requiring the introduction of a conversion between NIRS-based to LEM-based DRBE, as calculated by Syngo [10,11].
In order to overcome these limitations, we have introduced a new calculation platform, FRoG (Fast Recalculation on GPU), to perform fast physical and biological calculations for proton and carbon ion beam therapy. The FRoG project is a collaborative effort between the CNAO facility in Pavia, Italy, and the Heidelberg Ion Beam Therapy Center (HIT) [12] in Heidelberg, Germany. FRoG was designed to perform fast and accurate calculations, applying an analytical pencil beam algorithm on GPU to calculate physical/biological dose and LETd distributions. For proton beams, clinicians and medical physicists can assess both dose and LETd distributions (and eventually DRBE applying variable RBE scheme [13,14]) to further scrutinize plans for acceptance or potential re-planning purposes within minutes. For carbon ions, the user can quickly access MKM-based DRBE values and compare them with the converted LEM-based DRBE predictions by the use of a scaling factor introduced in Fossati et al. [10]. In presence of large hot or cold spots in the tumor, the plan can be readily re-optimized taking into account the FRoG MKM-based DRBE values.
In this work, the benchmarks performed are presented for both proton and carbon ions in preparation for FRoG’s integration into clinical activity. SOBPs and patient cases have been calculated and compared against FLUKA MC predictions [15,16,17], which serves as the reference MC code at CNAO and was used to generate the physical database of Syngo [18,19,20,21]. Various LETd maps and LEM vs. MKM DRBE distributions for patients treated with proton and carbon ion beams, respectively, are presented. Prior to patient treatment, the plan from Syngo is verified dosimetrically by performing field-specific quality assurance (QA) [18]. In this work, we have used twenty-five field-specific QA for each beam modality and we have compared them against FRoG predictions.

2. Results

2.1. Comparison of FLUKA- and FRoG-Calculated Spread Out Bragg Peaks

Syngo-optimized SOBPs without beam modifiers (i.e., range shifter), have been calculated with FRoG and compared against FLUKA predictions. For protons, the results are summarized in Table 1 in terms of percent DRBE difference of the RBE-weighted dose-volume histogram (DRBEVH) parameters DRBE,50, DRBE,2, and DRBE,98 for an SOBP with equal sides of 3 cm (target volume 27 cm3) and 6 cm (target volume of 216 cm3) at different depths: 3 cm, 12 cm, and 21 cm. For a definition of these parameters see Section 4.2.1. The RBE was assumed to be 1.1.
FRoG matches well with the MC predictions. Considering all resultant values (DRBE,50, DRBE,2, and DRBE,98), in terms of absolute variation, FRoG reproduces FLUKA results within 0.7% on average. The observed maximum variation was 1.1% for DRBE,98 for an SOBP of side 3 cm at 21 cm depth and for an SOBP of side 6 cm at 12 cm depth.
Carbon ions DRBEVH statistics for the target volume for the six studied SOBPs are summarized in Table 2 and Table 3 for LEM and MKM, respectively. For 27 cm3 (216 cm3) target volumes, applying the LEM model, percent DRBE differences for DRBE,50, DRBE,2, and DRBE,98 are 0.4% (0.7%), −1.9% (−0.6%), and −0.1% (2.0%), respectively. These results are obtained by averaging over the three SOBP depths.
For 27 cm3 (216 cm3) target volumes, applying the MKM model, percent DRBE differences for DRBE,50, DRBE,2, and DRBE,98 are −1.1% (−0.4%), −2.2% (−1.5%), and −1.7% (0.3%), respectively. Overall, the FRoG biological dose calculations with the studied SOBPs match FLUKA predictions within 2.5%. However, variations larger than or close to 3% have been found for LEM DRBE,98 at 12 cm (216 cm3 target volume) and MKM DRBE,98 at 21 cm (27 cm3 target volume).

2.2. Comparison of FLUKA- and FRoG-Calculated Patient Cases
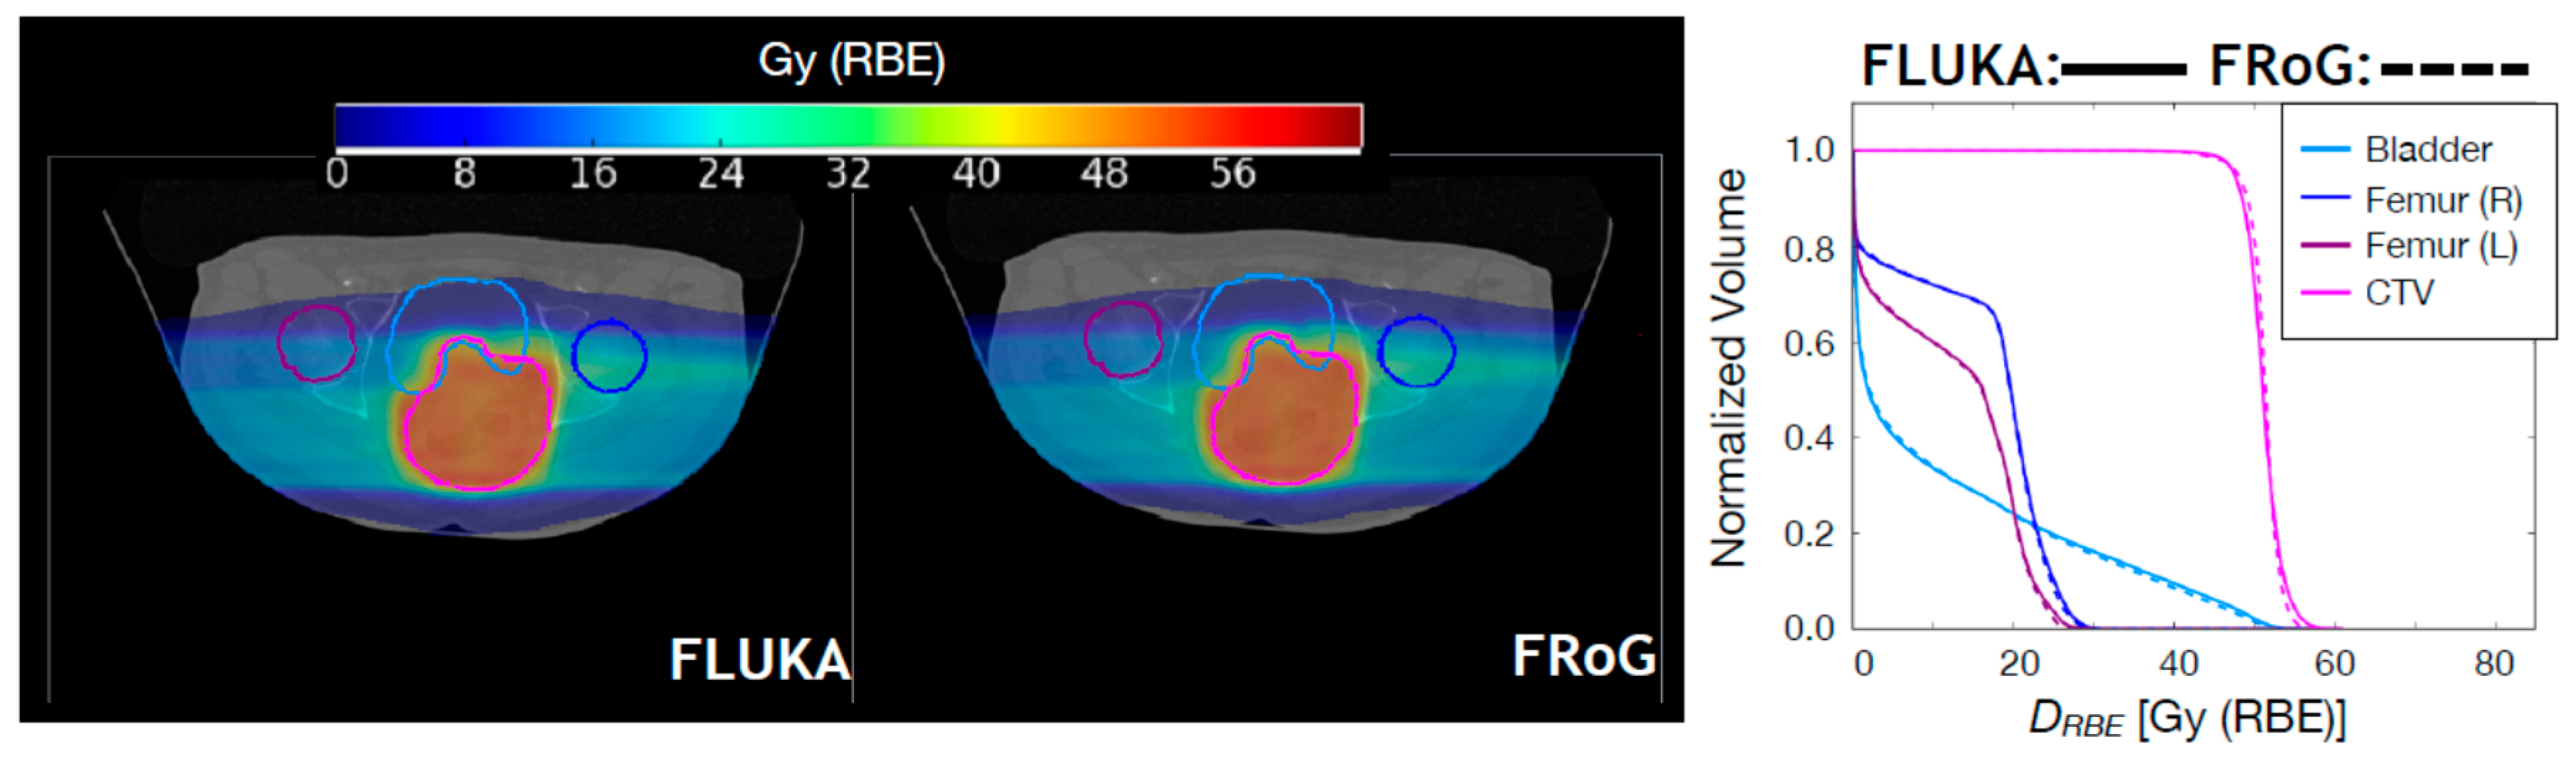
2.2.1. Proton Beams

For proton beams, fifteen CNAO patient cases have been recalculated with FRoG and FLUKA: five head and neck (H&N) without RS, five H&N with RS, and five pelvic cases without RS. The FRoG and FLUKA DRBE predictions (RBE = 1.1) have been compared in terms of variation of DRBE,50, DRBE,2, and DRBE,98 in the target volume and in terms of γ-analysis [22,23]. In Figure 1 and Figure 2, DRBE distributions and DRBEVH comparisons between FLUKA and FRoG are presented for a H&N case without RS and a pelvic case, respectively.
A summary of variations in target DRBE,50, DRBE,2, and DRBE,98, with respect to MC calculations for proton patient cases is reported in Table 4. Average percent DRBEVH differences between FLUKA simulation and FRoG over the whole patient set were within ~0.7%. γ-pass rates, i.e., percent of points for which the γ-index is ≤1, were 98.4%, 96.0%, and 97.2% for the H&N without RS, H&N with RS, and pelvic patient cases, respectively. The overall γ-pass rate was 97.2%.
The average calculation time for the ten H&N cases was approximately 90 s ± 22 s, with a maximum of 3 min and 57 s (PTV of 300 cm3, three beams with RS) and minimum of 44 s (PTV of 15.5 cm3, three beams with RS). For the pelvic cases, the average calculation time was approximately 175 s ± 60 s ranging from a maximum of 6 min and 35 s (PTV of 2134 cm3, two beams) to a minimum of 1 min and 2 s (PTV of 91 cm3, two beams). The reported runtime also includes calculating LETd (as well as RBE) distributions which are typically unavailable in a commercial TPS.
In Figure 3, LETd maps and LETd-volume-histograms (LETdVH) calculated by FRoG and FLUKA for the two patients of Figure 1 and Figure 2 are shown. For the head case, the left temporal lobe was examined in order to quantify the high LETd component found, as expected, in the distal region of the field. For the PTV, FRoG and FLUKA LETd values match within 0.05 keV/µm. The FRoG calculated mean LETd is approximately 3.0 keV/µm while the LETd,2 is 5.7 keV/µm, where LETd,2 is the LETd received by 2% of the volume. For the other ROIs, LETd,2 are 6.4 keV/µm, 3.0 keV/µm, and 9.5 keV/µm, for the brainstem and the right and left temporal lobe, respectively. These values agree with the FLUKA predictions within ~0.3 keV/ µm. For the pelvic case, the mean LETd for the CTV is 2.5 keV/µm while the LETd,2 is 4.0 keV/µm. For the bladder, LETd,2 is 4.1 keV/µm while for the lower value of LETd,2 for the femurs is ~1.2 keV/µm. These values agree with the FLUKA predictions within ~0.2 keV/µm for organs at risk (OAR) and ~0.05 keV/µm for the CTV.

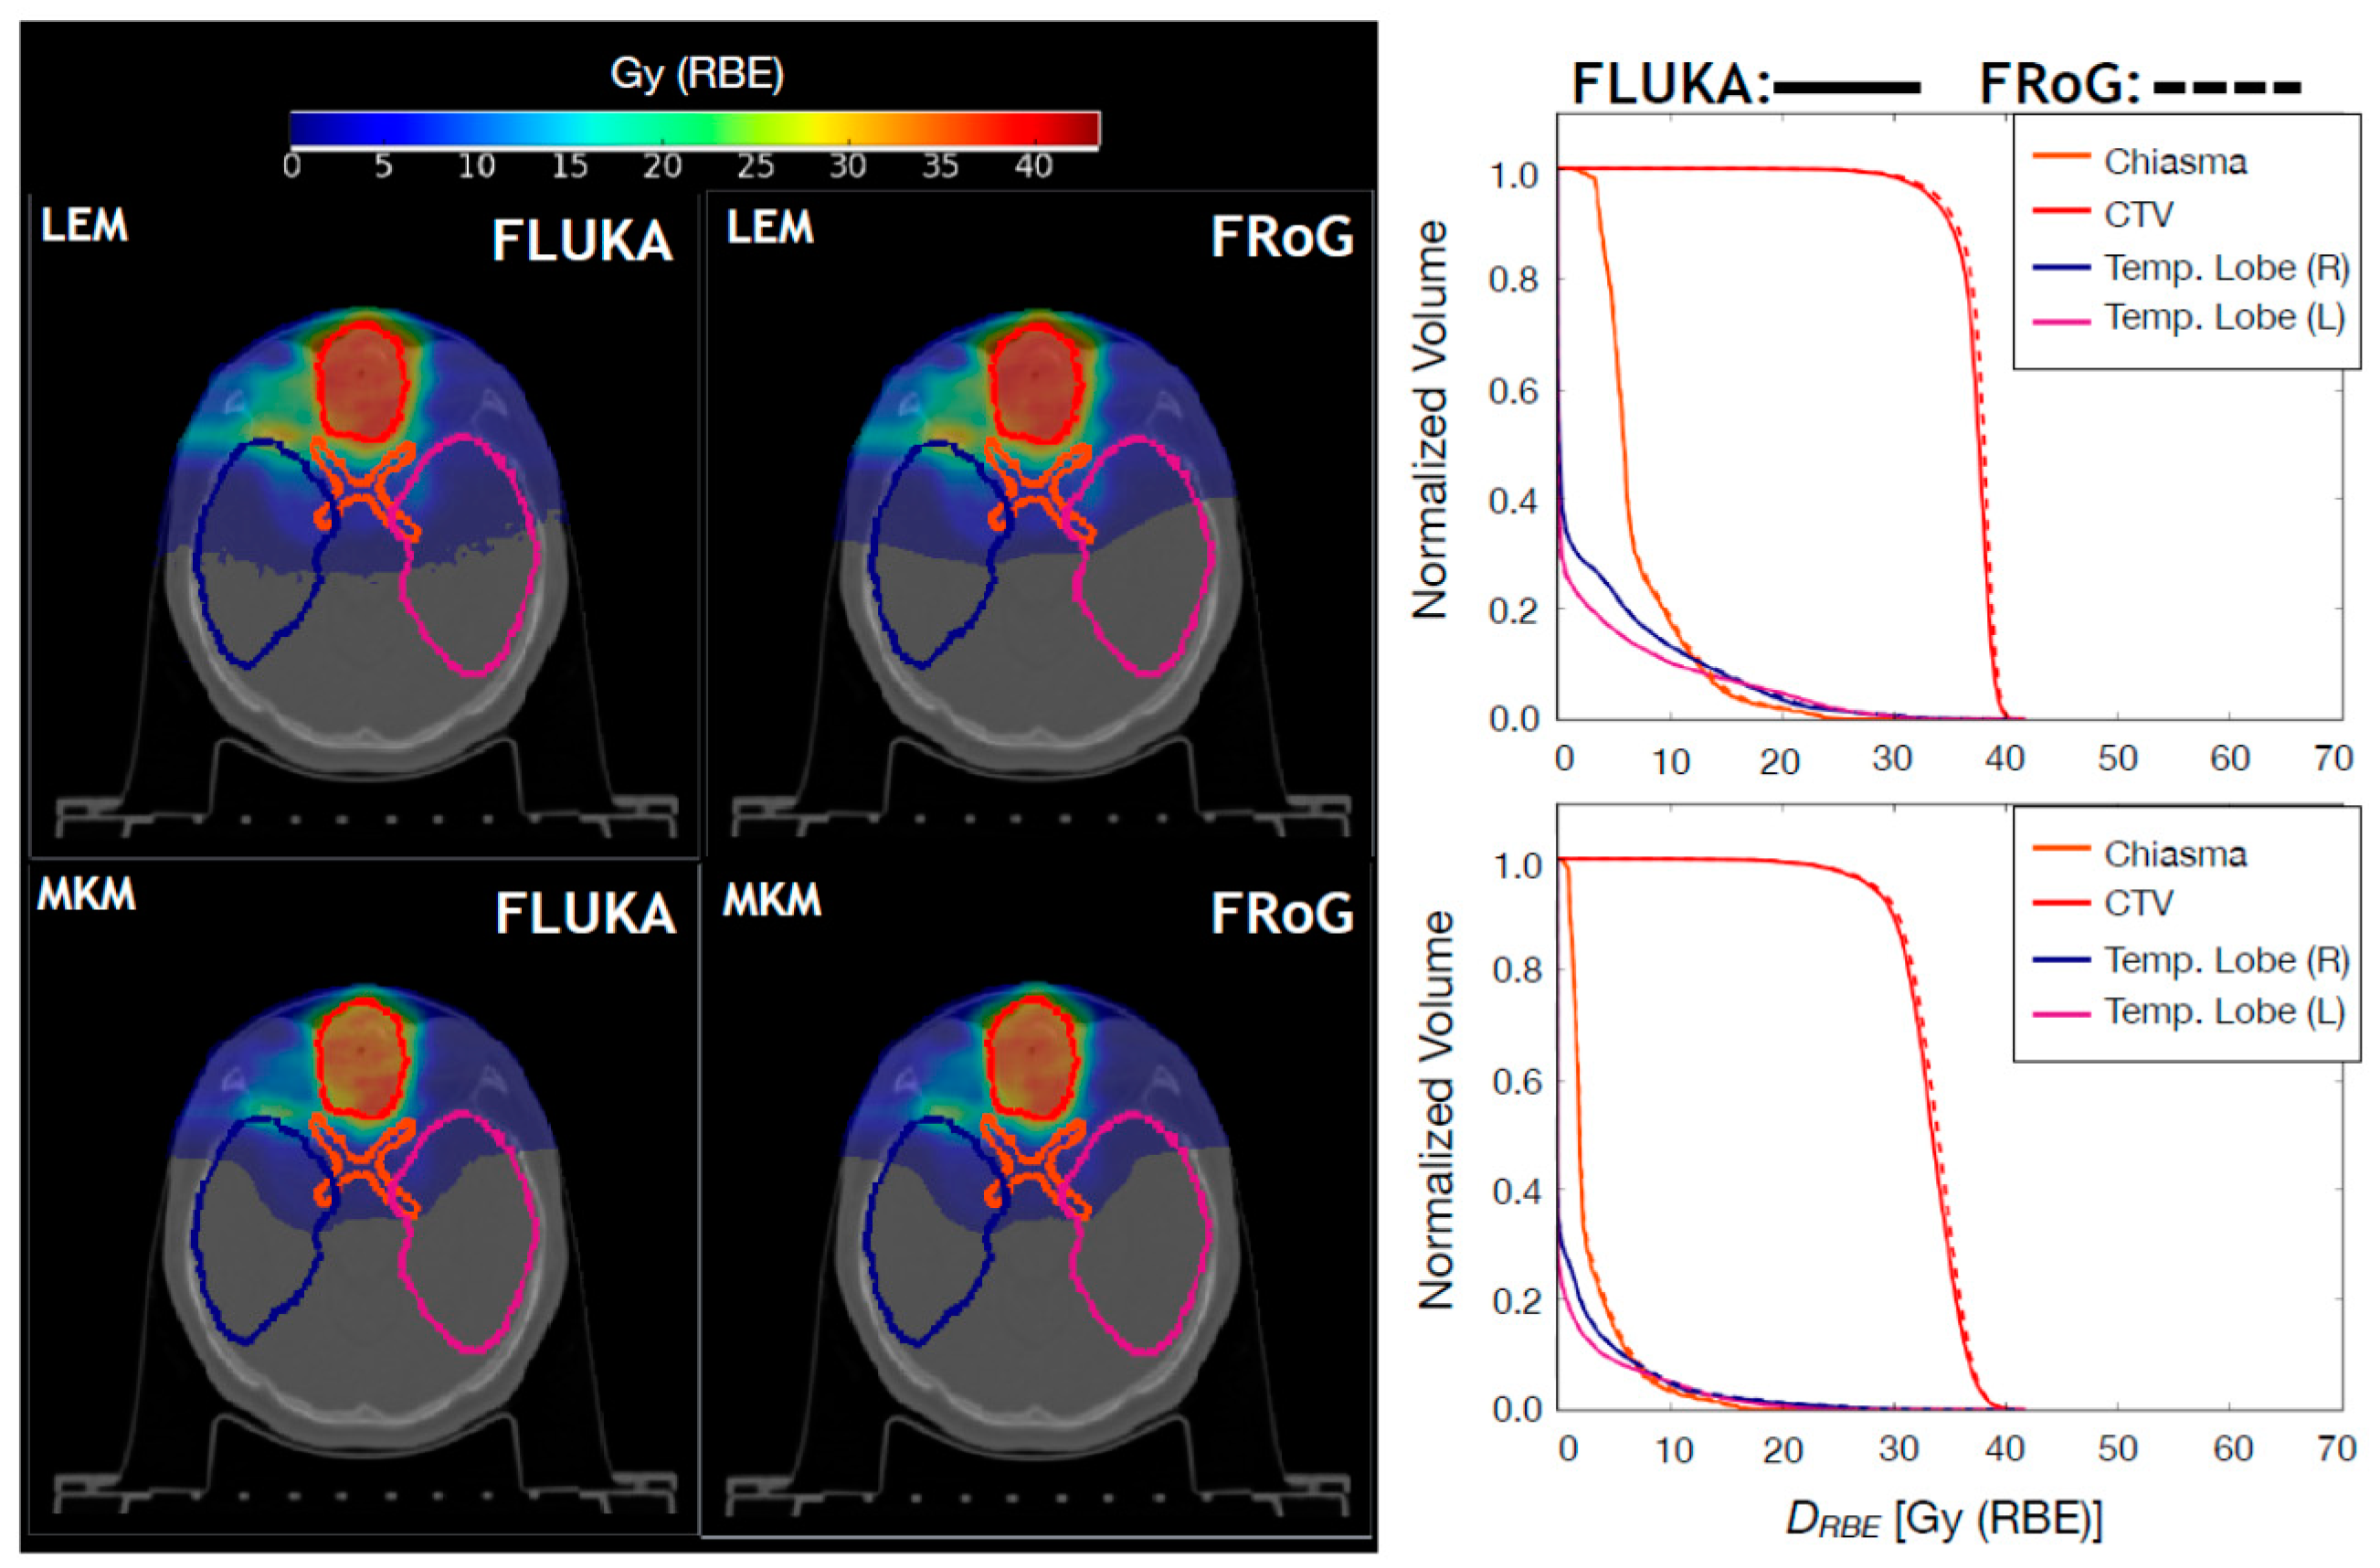
2.2.2. Carbon Ion Beams

For carbon ion beams, ten Syngo LEM-optimized CNAO patient cases were recalculated using FRoG and FLUKA: five H&N and five pelvic cases. The H&N cases include fields with and without RS. Resultant FLUKA and FRoG LEM/MKM-based DRBE distributions are compared. In Figure 4 and in Figure 5, FLUKA and FRoG LEM/MKM DRBE distributions and DRBEVH comparisons for a H&N case and a pelvic case, respectively, are shown. In Table 5, percent DRBEVH differences between FLUKA MC simulations and FRoG for the target in terms of DRBE,2, DRBE,50, and DRBE,98 are reported for both MKM and LEM DRBE values. Average percent differences over the whole patient set were within 2.5% for both LEM and MKM-based DRBE, respectively. γ-pass rates were ~99% for both LEM and MKM in both H&N and pelvic cases.
The average calculation time including absorbed dose, LEM and MKM DRBE for the five H&N cases was about 388 s ± 91 s, ranging from 4 min and 11 s (PTV of 25 cm3, 2 beams) to 11 min and 30 s (PTV of 204 cm3, two beams). For the pelvic cases, the average calculation time was about 205 s ± 60 s, ranging from 1 min and 33 s (PTV of 40 cm3, one beam) to 5 min and 50 s (PTV of 172 cm3, one beam).

2.3. Comparison against Dosimetric Data

For patient QA, FRoG dose calculations showed a high level of agreement, with the mean and standard deviation of the difference between calculated and measured dose over the twenty-five fields of 1.96% ± 0.79% and 2.21% ± 0.92%, for p and 12C, respectively. The Syngo-calculated values were 2.71% ± 1.25% and 2.57% ± 0.84%, for p and 12C, respectively. The improved agreement compared to Syngo is due to the employment of a triple Gaussian parameterization in FRoG instead of a double Gaussian model as in Syngo [24] and an improved handling of the RS for proton beams. In FRoG, facility-specific triple Gaussian parameterizations were implemented taking into account RS thickness and RS distance from the patients (or phantoms) entry point. Conversely, as explained previously [7], Syngo numerically accounts for the corresponding water equivalent thickness for radiological depth calculation, but the beam widening due to the RS is only covered by a single Gaussian scattering model [25]. For carbon ions, Syngo neglects the additional scattering of the beams in the RS while FRoG considers a beam energy-dependent parameterization of the beam widening due to the RS. The typical calculation time for a patient QA field is roughly 1 to 2 min depending on particle type, depth, and target volume.

3. Discussion

In this paper, benchmarks of FRoG against MC predictions for protons and carbon ions have been performed in both homogeneous (SOBP in water) and heterogeneous scenarios (patient cases). In general, on average discrepancies in terms of DRBE values have been found to be within 1% and 2.5% for proton and carbon ions, respectively. For carbon ions, variations larger than or close to 3% have been found for LEM and for MKM. The steep dose gradients of carbon ions make DRBE,98 a less robust metric in the evaluation of the target coverage. Additionally, we have analyzed the DRBE,95 (biological dose received by 95% of the PTV) and found an improved agreement with a variation of 1.94% for LEM DRBE,95 at 12 cm (side 6 cm) and −1.20% MKM DRBE,95 at 21 cm (side 3 cm). In general, the worsening of the agreement in the case of carbon ions is due to the limitations of handling the lateral dose distributions with a simple triple Gaussian approach [24] as well as the assumption that, for biological calculations, lateral variations of the mixed radiation field are not explicitly considered [26]. In order to overcome the latter, an approach similar to the one suggested by Inaniwa and Kanematsu [26] could be implemented. Nevertheless, the FRoG agreement with the MC has been considered highly satisfactorily keeping in mind the larger discrepancies, up to 5–10%, found using commercial TPS [7,27].
In terms of physical dose distributions for carbon ions, FRoG and FLUKA match on average within 1.4% for SOBPs and within 1.6% for patient cases (see Supplementary Material Table S1), in line with results presented previously [24] where calculations of SOBPs in homogenous settings using FRoG were within 1.3% of FLUKA calculations, while analysis of patient case calculations exhibited net deviations in the target within about 1.5%.
For the proton H&N patient cases, presence of the RS marginally reduces the agreement, with the γ-pass rate decreasing from 98.4% to 96.0% with use of the RS. Nonetheless, the high level of agreement found confirms that the RS handling in FRoG is sound, as described in Section 2.3.
For proton beams, LETd values have been found matching the MC predictions within 0.3 keV/µm in both target and organs at risk. This agreement is important when using FRoG for a retrospective study of clinical outcomes in proton therapy. A FRoG user could efficiently perform the analysis carried out in a previous paper [28], determining, for example, if areas of normal tissue damage indicated by post-treatment image changes are associated with increased LETd values.
Regarding the carbon ion biological dose, a conversion scheme is implemented at CNAO allowing to plan a NIRS-based median biological dose to the target starting from a prescribed LEM-based biological dose [10,11]. This, however, does not assure a satisfactory coverage in certain cases resulting in hot or cold spots in the biological dose distributions due to the different particle type, LET and tissue dependencies of the two biological models. As an example, in the left panel of Figure 6, the ratio between FRoG-calculated MKM DRBE and LEM DRBE, multiplied by the clinical scaling value for the patient shown in Figure 4, is displayed only in the region of the CTV. For this patient, the FRoG-calculated scaling factor (DRBE,LEM,50/DRBE,MKM,50 for the CTV) is 1.12 which matches the expected one of about 1.10 for 4.3 Gy (RBE) LEM per fraction scheme [10]. If a constant scaling factor were enough to modulate LEM-based biological dose to MKM-based biological dose, the ratio values reported in the left panel of Figure 6 should be close to 1. Instead, hot and cold spots have been found in the CTV as summarized in the DRBEVH shown in the right panel of Figure 6. In this context, the accessibility within few minutes of a FRoG MKM-based biological dose could help medical physicists in adjusting the LEM-based constraints, resulting in a more homogenous MKM biological dose mitigating hot and cold spots in the target.
For the studied patient cases, FRoG’s total calculation time was approximately 2 min for proton beams and 5 min for carbon ion beams. Further improvements could be made to FRoG’s calculation speed by upgrading the hardware and optimizing the code structure. For our calculations, we have used a consumer grade GPU card (NVIDIA Corporation, Santa Clara, CA, USA NVIDIA® GeForce® GTX 1080 Ti) as available at CNAO. For understanding the impact of upgrading the GPU card on the calculation time reduction, we have run the most time-consuming case presented in this work, i.e., a H&N carbon ion case (total time: 11 min and 30 s, PTV of 204 cm3, two beams) with a high-end graphics card (NVIDIA Corporation, Santa Clara, CA, USA NVIDIA® Tesla® V100) available at HIT. The time reduction was approximately 3.5-fold with a new total calculation time of about 3 min and 20 s.
In terms of dosimetric comparisons, considering both protons and carbon ions, FRoG agreed with measurements better than Syngo, with a 0.56% improvement, on average, in reproducing patient-specific QA measurements. The additional differences of about 2% found with respect to the experimental data could be due to uncertainties involved in the dose delivery process and in the water phantom positioning as described previously [18].
Here, the FRoG platform has been introduced at CNAO and it has been benchmarked successfully against MC prediction and dosimetric measurements for proton and carbon ion beams. Due to its accuracy and fast calculation time in comparison to the MC code, FRoG could be used for retrospective study of large patient cohorts as well as in clinical treatment planning workflow taking into account LETd distributions in proton plans and MKM-based DRBE in carbon ion plans. Organs at risk constraints resulting from toxicity studies of the long-term follow up of Japanese treatments were adopted at CNAO without any correction for the RBE model. This approach is overly conservative and it is currently under evaluation for critical structures such as the optic nerve, brainstem, and rectum.

4. Materials and Methods

4.1. FRoG Workflow and Design Information

In regard to the input physics database, FRoG handles depth dose distributions and lateral dose parametrizations generated with FLUKA simulated data [18,19,20,29]. As described previously [24], physical and biophysical quantities were simulated and scored depth-wise in water. For the physical dose, lateral evolution was additionally scored radially. Subsequently, lateral dose evolution parameterization as a function of depth using a triple Gaussian model was performed using the MINUIT package [30] in ROOT [31], as described previously [32].
For biological calculations, MC-derived depth-dependent databases for LETd, z*mix, alpha and beta are available. For carbon ions, z*mix is used for MKM-based calculations [8,33] while alpha and beta for LEM ones [6,34]. Alpha and beta are the dose-averaged linear (alpha) and quadratic (beta) parameters necessary for the LEM while z*mix is the dose-averaged saturation-corrected dose-mean specific energy of the domain delivered in a single event needed by the MKM. FRoG’s depth-dependent database for physical and biological calculations with carbon ion beams at CNAO are shown in Figure 7. The physical and biological input parameters employed for generating the database are explained in detail in previous works [33,34].
FRoG employs a pencil beam algorithm with GPU optimized raytracing [35]. Raytracing is performed with the resolution of the planning CT, whereas dose can be calculated on a downsized grid, following the clinical procedure at CNAO. For head treatments with proton beams, dose calculation is performed on a 2 × 2 × 2 mm3 grid with a 0.98 × 0.98 × 2 mm3 CT resolution, while for pelvic treatments, dose calculation is performed on a 3 × 3 × 3 mm3 grid with a 0.98 × 0.98 × 2 mm3 CT resolution. For carbon ions, for the studied cases, dose calculation is performed on a 2 × 2 × 2 mm3 grid with a 0.98 × 0.98 × 2 mm3 CT resolution. Pencil beam splitting was incorporated into FRoG’s framework following the mathematical procedures of beamlet superposition [36] handling variable lateral dose evolution in the presence of anatomical heterogeneity. In a two-dimensional grid space, the splitting method involves a superposition of N equally-spaced sub-Gaussians (bounded by ±3.5 σ) with equivalent FWHM but variable weighting. For protons ~350 subsplits were used while for carbon ions, ~350 and ~100 subsplits, were applied for patient cases in the H&N and in the pelvic region, respectively. In case of calculations in water phantoms, no splitting is needed. For each beam spot in the patient plan, source-to-surface distance was calculated and full width at half maximum (FWHM) in air projected to the entrance were interpolated using experimentally measured FWHM values for each ion, beam energy, foci, and treatment room as in clinical practice at CNAO using Syngo [20].
The FRoG dose calculation engine adopts a triple Gaussian distribution model for handling lateral dose distribution as a function of the water equivalent depth [24]. For carbon ion therapy, there are two biological models applied clinically, the modified MKM and LEM I. These models are implemented in FRoG and the two DRBE distributions are calculated at the same time of the physical dose. The implementation of the LEM and MKM biological calculations have been performed following the approaches described in the literature [6,8,9,27,33,34]. For proton beams, dose-averaged LET in water is calculated as described previously [27] but weighting only primary protons and secondary protons, deuterons, and tritons. This allows to quickly access DRBE values applying LET-based RBE models [13].

4.2. Benchmark of the FRoG Predictions with Proton and Carbon Ion Beams

4.2.1. Comparison against FLUKA Predictions

Six SOBPs for both proton and carbon ions have been optimized with Syngo using RBE = 1.1 for protons and LEM-based optimization for carbon ions [6,7]. The target volumes had cubic shapes with sides of 3 cm or 6 cm. They were contoured in water with the proximal face positioned at a depth of 6 cm, 12 cm, and 21 cm. The optimization goal was homogeneous target coverage to 2 Gy (RBE) for both proton and carbon ions. The results are analyzed in terms of percent DRBE difference of DRBE,50, DRBE,2, and DRBE,98. DRBE,50, DRBE,2, and DRBE,98 represent the biological dose received by 50%, 2%, and 98% of the planning target volume (PTV) in the cumulative DRBEVH, respectively. To evaluate the capability of FRoG in handling heterogeneities in clinically relevant scenarios, twenty-five patients previously treated at CNAO have been recalculated. Fifteen patients treated with proton beams (10 H&N, five pelvic cases) and ten with carbon ions (five H&N, five pelvic cases). We have included the most clinically representative targets and beam configurations. Five proton H&N patients have been selected with 3 cm RW3 range shifter, always positioned at 10 cm distance from the patient’s skin. In this way, we could quantify the FRoG predictions when an RS for proton beams was employed. γ-values have been calculated for the regions in the DRBE distributions with a 10% low-dose threshold of the maximum MC DRBE. The chosen criteria were 2 mm as distance-to-agreement (DTA) and 2% as DRBE difference.
The FLUKA MC code [15,16,17] was selected to perform forward plan recalculations to benchmark FRoG predictions. FLUKA represents the gold standard for clinical calculations in particle therapy at CNAO [18,19,20].
Patients records were obtained with informed consent and handled following the Helsinki Declaration. All methods were approved and followed applicable guidelines and regulations of CNAO. Considering the retrospective nature of the study, clearing from the ethical review committee was not required. All records were anonymized prior to the study.

4.2.2. Comparison against Dosimetric Data

For experimentally validating FRoG results, dosimetric verification of patient plans in water for proton and carbon ion beams has been performed following the same procedure as for patient quality assurance at CNAO [18]. Twenty-five fields of patient-specific QA for each beam modality have been acquired and compared against FRoG predictions. The measurements were performed using a water phantom (MP3-P T41029, PTW, Freiburg, Germany). The dosimetric system consists of a three-dimensional stack of pin point ionization chambers (ICS, PinPoint Ionization Chambers, TM31015, PTW, Freiburg, Germany), mounted on a robotic arm and positioned inside the water phantom [37]. The position of the block with the ICs can be remotely controlled with a step size of 0.1 mm. The dose distribution for each beam has been measured using 12 ICs simultaneously with the ICs connected to a 12-channel electrometer (MULTIDOS®, PTW, Freiburg, Germany). According to the CNAO QA protocol, results are accepted if the mean and the standard deviation of [(measured dose − calculated dose)/maximum field dose] over a data set of 12 points are both within ±5% and below 5%, respectively [18].

5. Conclusions

Through a multi-institutional collaboration, we introduce a unique software, FRoG, for rapid and robust dose calculation on GPU for protons and carbon ions at CNAO. As opposed to the commercial TPS used in the clinic, FRoG is a sandbox environment for radiation therapy research, providing the means to develop and evaluate sophisticated models for effective dose (e.g.,: MKM and LEM), as well as physical quantities such as LETd. Benchmark tests for the FRoG dose calculation engine using both SOBPs and patient cases were performed against FLUKA MC and dosimetric data, demonstrating satisfactorily agreement. Future efforts with FRoG include retrospective analysis of a large patient cohort to investigate clinical outcome, as well refinement of both physical and biological models in hadrontherapy.

Supplementary Materials

The following are available online at https://www.mdpi.com/2072-6694/10/11/395/s1, Table S1: Average percent variation in D50, D2 and D98 of the target for FRoG dose calculation with respect to MC for carbon ion patient cases. The values represent the mean ± standard error of the mean.

Author Contributions

A.M. wrote the main manuscript text with K.C. as assistant author. K.C., B.K., and S.B.M. are codevelopers, with A.M. as the lead designer of project FRoG. G.M. contributed to data acquisition through support with FLUKA MC simulation. S.M. performed the Syngo plans. S.M. and M.C. provided clinical direction during project development and manuscript writing. All authors reviewed the manuscript.

Funding

K.C. was funded by Marie Skłodowska-Curie Innovative Training Network Fellowship of the European Commission’s Horizon 2020 Programme under contract number 642889 MEDICIS-PROMED. The APC was funded by a Marie Skłodowska-Curie Innovative Training Network Fellowship of the European Commission’s Horizon 2020 Programme under contract number 642889 MEDICIS-PROMED.

Acknowledgments

S.B.M. is supported by PhD- Stipend of the Helmholtz International Graduate School (HIGS-DKFZ).

Conflicts of Interest

The authors declare no conflicts of interest.

References

  1. Saini, J.; Maes, D.; Egan, A.; Bowen, S.R.; James, S.S.; Janson, M.; Wong, T.; Bloch, C. Dosimetric evaluation of a commercial proton spot scanning Monte-Carlo dose algorithm: Comparisons against measurements and simulations. Phys. Med. Biol. 2017, 62, 7659–7681. [Google Scholar] [CrossRef] [PubMed]
  2. Jia, X.; Schümann, J.; Paganetti, H.; Jiang, S.B. GPU-based fast Monte Carlo dose calculation for proton therapy. Phys. Med. Biol. 2012, 57, 7783–7797. [Google Scholar] [CrossRef] [PubMed] [Green Version]
  3. Qin, N.; Pinto, M.; Tian, Z.; Dedes, G.; Pompos, A.; Jiang, S.B.; Parodi, K.; Jia, X. Initial development of goCMC: A GPU-oriented fast cross-platform Monte Carlo engine for carbon ion therapy. Phys. Med. Biol. 2017, 62, 3682–3699. [Google Scholar] [CrossRef] [PubMed]
  4. Rossi, S. The national centre for oncological hadrontherapy (CNAO): Status and perspectives. Phys. Med. 2015, 31, 333–351. [Google Scholar] [CrossRef] [PubMed]
  5. International Commission on Radiation Units & Measurements. Prescribing, Recording and Reporting Proton-Beam Therapy (ICRU Report 78). Available online: https://icru.org/home/reports/prescribing-recording-and-reporting-proton-beam-therapy-icru-report-78 (accessed on 15 August 2018).
  6. Scholz, M.; Kellerer, A.M.; Kraft-Weyrather, W.; Kraft, G. Computation of cell survival in heavy ion beams for therapy. Radiat. Environ. Biophys. 1997, 36, 59–66. [Google Scholar] [CrossRef] [PubMed]
  7. Magro, G.; Molinelli, S.; Mairani, A.; Mirandola, A.; Panizza, D.; Russo, S.; Ferrari, A.; Valvo, F.; Fossati, P.; Ciocca, M. Dosimetric accuracy of a treatment planning system for actively scanned proton beams and small target volumes: Monte Carlo and experimental validation. Phys. Med. Biol. 2015, 60, 6865–6880. [Google Scholar] [CrossRef] [PubMed]
  8. Inaniwa, T.; Furukawa, T.; Kase, Y.; Matsufuji, N.; Toshito, T.; Matsumoto, Y.; Furusawa, Y.; Noda, K. Treatment planning for a scanned carbon beam with a modified microdosimetric kinetic model. Phys. Med. Biol. 2010, 55, 6721–6737. [Google Scholar] [CrossRef] [PubMed]
  9. Inaniwa, T.; Kanematsu, N.; Matsufuji, N.; Kanai, T.; Shirai, T.; Noda, K.; Tsuji, H.; Kamada, T.; Tsujii, H. Reformulation of a clinical-dose system for carbon-ion radiotherapy treatment planning at the National Institute of Radiological Sciences, Japan. Phys. Med. Biol. 2015, 60, 3271–3286. [Google Scholar] [CrossRef] [PubMed] [Green Version]
  10. Fossati, P.; Molinelli, S.; Matsufuji, N.; Ciocca, M.; Mirandola, A.; Mairani, A.; Mizoe, J.; Hasegawa, A.; Imai, R.; Kamada, R.; et al. Dose prescription in carbon ion radiotherapy: A planning study to compare NIRS and LEM approaches with a clinically-oriented strategy. Phys. Med. Biol. 2012, 57, 7543–7554. [Google Scholar] [CrossRef] [PubMed]
  11. Molinelli, S.; Magro, G.; Mairani, A.; Matsufuji, N.; Kanematsu, N.; Inaniwa, T.; Mirandola, A.; Russo, S.; Mastella, E.; Hasegawa, A.; et al. Dose prescription in carbon ion radiotherapy: How to compare two different RBE-weighted dose calculation systems. Radiother. Oncol. 2016, 120, 307–312. [Google Scholar] [CrossRef] [PubMed]
  12. Haberer, T.; Debus, J.; Jäkel, O.; Schulz-Ertner, D.; Weber, U. The Heidelberg ion therapy center. Radiother. Oncol. 2004, 73, 186–190. [Google Scholar] [CrossRef]
  13. Giovannini, G.; Böhlen, T.T.; Cabal, G.; Bauer, J.; Tessonnier, T.; Frey, K.; Debus, J.; Mairani, K.; Parodi, A. Variable RBE in proton therapy: Comparison of different model predictions and their influence on clinical-like scenario. Radiat. Oncol. 2016, 11, 1–16. [Google Scholar] [CrossRef] [PubMed]
  14. Mairani, A.; Dokic, I.; Magro, G.; Tessonnier, T.; Bauer, J.; Böhlen, T.T.; Ciocca, M.; Ferrari, A.; Sala, P.R.; Jäkel, O.; et al. A phenomenological relative biological effectiveness approach for proton therapy based on an improved description of the mixed radiation field. Phys. Med. Biol. 2017, 61, 1378–1395. [Google Scholar] [CrossRef] [PubMed]
  15. Ferrari, A.; Sala, P.R.; Fassò, A.; Ranft, J. FLUKA: A Multi-Particle Transport Code. CERN-2005-10, SLAC-R-773. Available online: https://www.slac.stanford.edu/pubs/slacreports/reports16/slac-r-773.pdf (accessed on 15 August 2018).
  16. Böhlen, T.T.; Cerutti, F.; Chin, M.P.W.; Fassò, A.; Ferrari, A.; Ortega, P.G.; Mairani, A.; Sala, P.R.; Smirnov, G.; Vlachoudis, V. The FLUKA Code: Developments and Challenges for High Energy and Medical Applications. Nucl. Data Sheets 2014, 120, 211–214. [Google Scholar] [CrossRef]
  17. Battistoni, G.; Bauer, J.; Böhlen, T.T.; Cerutti, F.; Chin, M.P.W.; Dos Santos Augusto, R.; Ferrari, A.; Ortega, G.; Kozlowska, W.; Magro, G.; et al. The FLUKA Code: An Accurate Simulation Tool for Particle Therapy. Front. Oncol. 2016, 6, 1–24. [Google Scholar] [CrossRef] [PubMed]
  18. Molinelli, S.; Mairani, A.; Mirandola, A.; Vilches Freixas, G.; Tessonnier, T.; Giordanengo, S.; Parodi, K.; Ciocca, M.; Orecchia, R. Dosimetric accuracy assessment of a treatment plan verification system for scanned proton beam radiotherapy: One-year experimental results and Monte Carlo analysis of the involved uncertainties. Phys. Med. Biol. 2013, 58, 3837–3847. [Google Scholar] [CrossRef] [PubMed]
  19. Mairani, A.; Böhlen, T.T.; Schiavi, A.; Tessonnier, T.; Molinelli, S.; Brons, S.; Battistoni, G.; Parodi, K.; Patera, V. A Monte Carlo-based treatment planning tool for proton therapy. Phys. Med. Biol. 2013, 58, 2471–2490. [Google Scholar] [CrossRef] [PubMed]
  20. Mirandola, A.; Molinelli, S.; Vilches Freixas, G.; Mairani, A.; Gallio, E.; Panizza, D.; Russo, S.; Ciocca, M.; Donetti, M.; Magro, G.; et al. Dosimetric commissioning and quality assurance of scanned ion beams at the Italian National Center for Oncological Hadrontherapy. Med. Phys. 2015, 42, 5287–5300. [Google Scholar] [CrossRef] [PubMed]
  21. Parodi, K.; Mairani, A.; Sommerer, F. Monte Carlo-based parametrization of the lateral dose spread for clinical treatment planning of scanned proton and carbon ion beams. J. Radiat. Res. 2013, 54, i91–i96. [Google Scholar] [CrossRef] [PubMed]
  22. Low, D.A.; Harms, W.B.; Mutic, S.; Purdy, J.A. A technique for quantitative evaluation of dose distributions. Med. Phys. 1998, 25, 656–661. [Google Scholar] [CrossRef] [PubMed]
  23. Wendling, M.; Zijp, L.J.; McDermott, L.N.; Smit, E.J.; Sonke, J.J.; Mijnheer, B.J.; van Herk, M. A fast algorithm for gamma evaluation in 3D. Med. Phys. 2007, 34, 1647–1654. [Google Scholar] [CrossRef] [PubMed]
  24. Mein, S.; Choi, K.; Kopp, B.; Tessonnier, T.; Bauer, J.; Ferrari, A.; Haberer, T.; Debus, J.; Abdollahi, A.; Mairani, A. Fast robust dose calculation on GPU for high-precision 1H, 4He, 12C and 16O ion therapy: The FRoG platform. Sci. Rep. 2018, 8, 14829. [Google Scholar] [CrossRef] [PubMed]
  25. Szymanowski, H.; Oelfke, U. Two-dimensional pencil beam scaling: An improved proton dose algorithm for heterogeneous media. Phys. Med. Biol. 2002, 47, 3313–3330. [Google Scholar] [CrossRef] [PubMed]
  26. Inaniwa, T.; Kanematsu, N. A trichrome beam model for biological dose calculation in scanned carbon-ion radiotherapy treatment planning. Phys. Med. Biol. 2014, 60, 437–451. [Google Scholar] [CrossRef]
  27. Bauer, J.; Sommerer, F.; Mairani, A.; Unholtz, D.; Farook, R.; Handrack, J.; Frey, K.; Marcelos, T.; Tessonnier, T.; Ecker, S.; et al. Integration and evaluation of automated Monte Carlo simulations in the clinical practice of scanned proton and carbon ion beam therapy. Phys. Med. Biol. 2014, 59, 4635–4659. [Google Scholar] [CrossRef] [PubMed]
  28. Peeler, C.R.; Mirkovic, D.; Titt, U.; Blanchard, P.; Gunther, J.R.; Mahajan, A.; Mohan, R.; Grosshans, D.R. Clinical evidence of variable proton biological effectiveness in pediatric patients treated for ependymoma. Radiother. Oncol. 2016, 121, 395–401. [Google Scholar] [CrossRef] [PubMed] [Green Version]
  29. Parodi, K.; Mairani, A.; Brons, S.; Hasch, B.G.; Sommerer, F.; Naumann, J.; Jäkel, O.; Haberer, T.; Debus, J. Monte Carlo simulations to support start-up and treatment planning of scanned proton and carbon ion therapy at a synchrotron-based facility. Phys. Med. Biol. 2012, 57, 3759–3784. [Google Scholar] [CrossRef] [PubMed]
  30. James, F.; Roos, M. Minuit—A system for function minimization and analysis of the parameter errors and correlations. Comput. Phys. Commun. 1975, 10, 343–367. [Google Scholar] [CrossRef]
  31. Brun, R.; Rademakers, F. ROOT—An object oriented data analysis framework. Nucl. Instrum. Methods Phys. Res. A 1997, 389, 81–86. [Google Scholar] [CrossRef]
  32. Tessonnier, T.; Böhlen, T.T.; Ceruti, F.; Ferrari, A.; Sala, P.; Brons, S.; Haberer, T.; Debus, J.; Parodi, K.; Mairani, A. Dosimetric verification in water of a Monte Carlo treatment planning tool for proton, helium, carbon and oxygen ion beams at the Heidelberg Ion Beam Therapy Center. Phys. Med. Biol. 2017, 62, 6579–6594. [Google Scholar] [CrossRef] [PubMed]
  33. Magro, G.; Dahle, T.J.; Molinelli, S.; Ciocca, M.; Fossati, P.; Ferrari, A.; Inaniwa, T.; Matsufuji, N.; Ytre-Hauge, K.S.; Mairani, A. The FLUKA Monte Carlo code coupled with the NIRS approach for clinical dose calculations in carbon ion therapy. Phys. Med. Biol. 2017, 62, 3814–3827. [Google Scholar] [CrossRef] [PubMed]
  34. Mairani, A.; Brons, S.; Cerutti, F.; Fassò, A.; Ferrari, A.; Krämer, M.; Parodi, K.; Scholz, M.; Sommerer, F. The FLUKA Monte Carlo code coupled with the local effect model for biological calculations in carbon ion therapy. Phys. Med. Biol. 2010, 55, 4273–4289. [Google Scholar] [CrossRef] [PubMed]
  35. De Greef, M.; Crezee, J.; Van Eijk, J.C.; Pool, R.; Bel, A. Accelerated ray tracing for radiotherapy dose calculations on a GPU. Med. Phys. 2009, 36, 4095–4102. [Google Scholar] [CrossRef] [PubMed]
  36. Russo, G.; Attili, A.; Battistoni, G.; Bertrand, D.; Bourhaleb, F.; Cappucci, F.; Ciocca, M.; Mairani, A.; Milian, F.M.; Molinelli, S.; et al. A novel algorithm for the calculation of physical and biological irradiation quantities in scanned ion beam therapy: The beamlet superposition approach. Phys. Med. Biol. 2016, 61, 183–214. [Google Scholar] [CrossRef] [PubMed]
  37. Karger, C.P.; Jäkel, O.; Hartmann, G.H.; Heeg, P. A system for three-dimensional dosimetric verification of treatment plans in intensity-modulated radiotherapy with heavy ions. Med. Phys. 1999, 26, 2125–2132. [Google Scholar] [CrossRef] [PubMed]
Figure 1. FLUKA and FRoG recalculated DRBE distributions for a proton head case without range shifter (RS) are displayed in the left and middle panel, respectively, together with the contours of three regions of interest: the planning target volume (PTV), brainstem, and right temporal lobe. The DRBEVH for the regions of interest (ROIs) are shown in the right panel.
Cancers 10 00395 g001
Figure 2. FLUKA and FRoG recalculated DRBE distributions for a proton pelvic case are displayed in the left and middle panel, respectively, together with the contours of four regions of interest: the clinical target volume (CTV), right/left femur, and bladder. The DRBEVH for the ROIs are shown in the right panel.
Cancers 10 00395 g002
Figure 3. Upper panels: FLUKA and FRoG recalculated LETd distributions for a proton head case are displayed in the left and middle panel, respectively, together with the contours of four regions of interest: PTV, brainstem, and right and left temporal lobe. The LETdVH for the ROIs are shown in the right panel. Lower panels: FLUKA and FRoG recalculated LETd distributions for a proton pelvic case are displayed in the left and middle panel, respectively, together with the contours of four regions of interest: CTV, right and left femur, and bladder. The LETdVH for the ROIs are shown in the right panel.
Cancers 10 00395 g003
Figure 4. Upper panels: FLUKA and FRoG recalculated LEM-based DRBE distributions for a 12C ion head case are displayed in the left and middle panel, respectively, together with the contours of four representative regions of interest: CTV, brainstem, and left/right temporal lobe. The LEM-based DRBEVH for the ROIs are shown in the right panel. Lower panels: FLUKA and FRoG recalculated MKM-based DRBE distributions for a 12C ion head case are displayed in the left and middle panel, respectively, together with the contours of four regions of interest: CTV, brainstem, and left/right temporal lobe. The MKM-based DRBEVH for the ROIs are shown in the right panel.
Cancers 10 00395 g004
Figure 5. Upper panels: FLUKA and FRoG recalculated LEM-based DRBE distributions for a 12C ion pancreatic patient case are displayed in the left and middle panel, respectively, together with the contours of three representative regions of interest: CTV, left kidney and stomach. The LEM-based DRBEVH for the ROIs are shown in the right panel. Lower panels: FLUKA and FRoG recalculated MKM-based DRBE distributions for a 12C ion pancreatic patient case are displayed in the left and middle panel, respectively, together with the contours of three representative regions of interest: CTV, left kidney, and stomach. The MKM-based DRBEVH for the ROIs are shown in the right panel.
Cancers 10 00395 g005
Figure 6. Left panel: ratio between FRoG-calculated MKM DRBE and LEM DRBE multiplied by the clinical scaling value (see the next for more details) for the 12C ion patient shown in Figure 4. Only the values for the CTV are displayed. Right panel: FRoG-calculated LEM and MKM DRBEVH for the CTV are displayed with a red solid line and red dashed line, respectively. The DRBEVH for the LEM DRBE values rescaled by the clinical scaling factor is displayed with a black solid line.
Cancers 10 00395 g006
Figure 7. CNAO carbon ion depth-dependent database for all beam energies: (a) depth-dose distribution, (b) alpha for LEM, (c) beta for LEM, and (d) z*mix for MKM.
Cancers 10 00395 g007
Table 1. Percent RBE-weighted dose (DRBE) difference comparison for RBE-weighted dose-volume histogram (DRBEVH) between FRoG and Monte Carlo (MC) for proton beams.
Percent Difference ofTarget Volume3 cm12 cm21 cm
DRBE,5027 cm3
216 cm3
0.67%
0.59%
0.59%
0.61%
0.88%
0.71%
DRBE,227 cm3
216 cm3
0.91%
−0.60%
−0.09%
0.08%
0.47%
0.73%
DRBE,9827 cm3
216 cm3
0.52%
0.46%
0.43%
1.10%
1.07%
0.47%
Table 2. Percent DRBE difference comparison for Local Effect Model (LEM) DRBEVH between FRoG and MC for 12C ions.
Percent Difference ofTarget Volume3 cm12 cm21 cm
DRBE,5027 cm3
216 cm3
0.93%
0.58%
0.39%
0.64%
−0.01%
1.02%
DRBE,227 cm3
216 cm3
−1.01%
−1.14%
−2.45%
−0.65%
−2.27%
0.02%
DRBE,9827 cm3
216 cm3
−2.19%
2.14%
−0.18%
2.95%
2.03%
0.78%
Table 3. Percent DRBE difference comparison for Microdosimetric Kinetic Model (MKM) DRBEVH between FRoG and MC for 12C ions.
Percent Difference ofTarget Volume3 cm12 cm21 cm
DRBE,5027 cm3
216 cm3
−1.13%
−0.46%
−2.10%
−0.41%
−2.97%
−0.26%
DRBE,227 cm3
216 cm3
−0.19%
−0.68%
−0.90%
−1.41%
−2.11%
−2.48%
DRBE,9827 cm3
216 cm3
0.81%
−0.30%
−2.38%
1.91%
−3.86%
−0.84%
Table 4. Average percent variation of target DRBE,50, DRBE,2, and DRBE,98, with respect to MC calculations for proton patient cases. The values represent the mean ± standard error of the mean.
Percent Difference ofTotalH&N No RSH&N with RSPelvic
DRBE,500.68% ± 0.21%1.05% ± 0.32%0.34% ± 0.50%0.65% ± 0.31%
DRBE,2−0.57% ± 0.41%−0.91% ± 0.55%−0.84% ± 1.05%0.02% ± 0.67%
DRBE,980.41% ± 0.56%1.25% ± 0.42%−0.79% ± 1.55%0.77% ± 0.81%
Table 5. Average percent variation of target DRBE,50, DRBE,2, and DRBE,98, with respect to MC calculations for carbon ion patient cases applying LEM and MKM biological models. The values represent the mean ± standard error of the mean.
Percent Difference ofBiological ModelTotalH&NPelvic
DRBE,50LEM
MKM
0.96% ± 0.33%
1.46% ± 0.30%
0.52% ± 0.52%
1.23% ± 0.30%
1.40% ± 0.38%
1.69% ± 0.50%
DRBE,2LEM
MKM
0.97% ± 0.30%
1.81% ± 0.46%
0.93% ± 0.62%
2.57% ± 0.78%
1.01% ± 0.32%
1.05% ± 0.36%
DRBE,98LEM
MKM
2.23% ± 0.34%
2.36% ± 0.30%
2.80% ± 0.65%
2.93% ± 0.46%
1.67% ± 0.18%
1.79% ± 0.23%

