MYC Regulates α6 Integrin Subunit Expression and Splicing Under Its Pro-Proliferative ITGA6A Form in Colorectal Cancer Cells


Abstract
:1. Introduction
2. Results
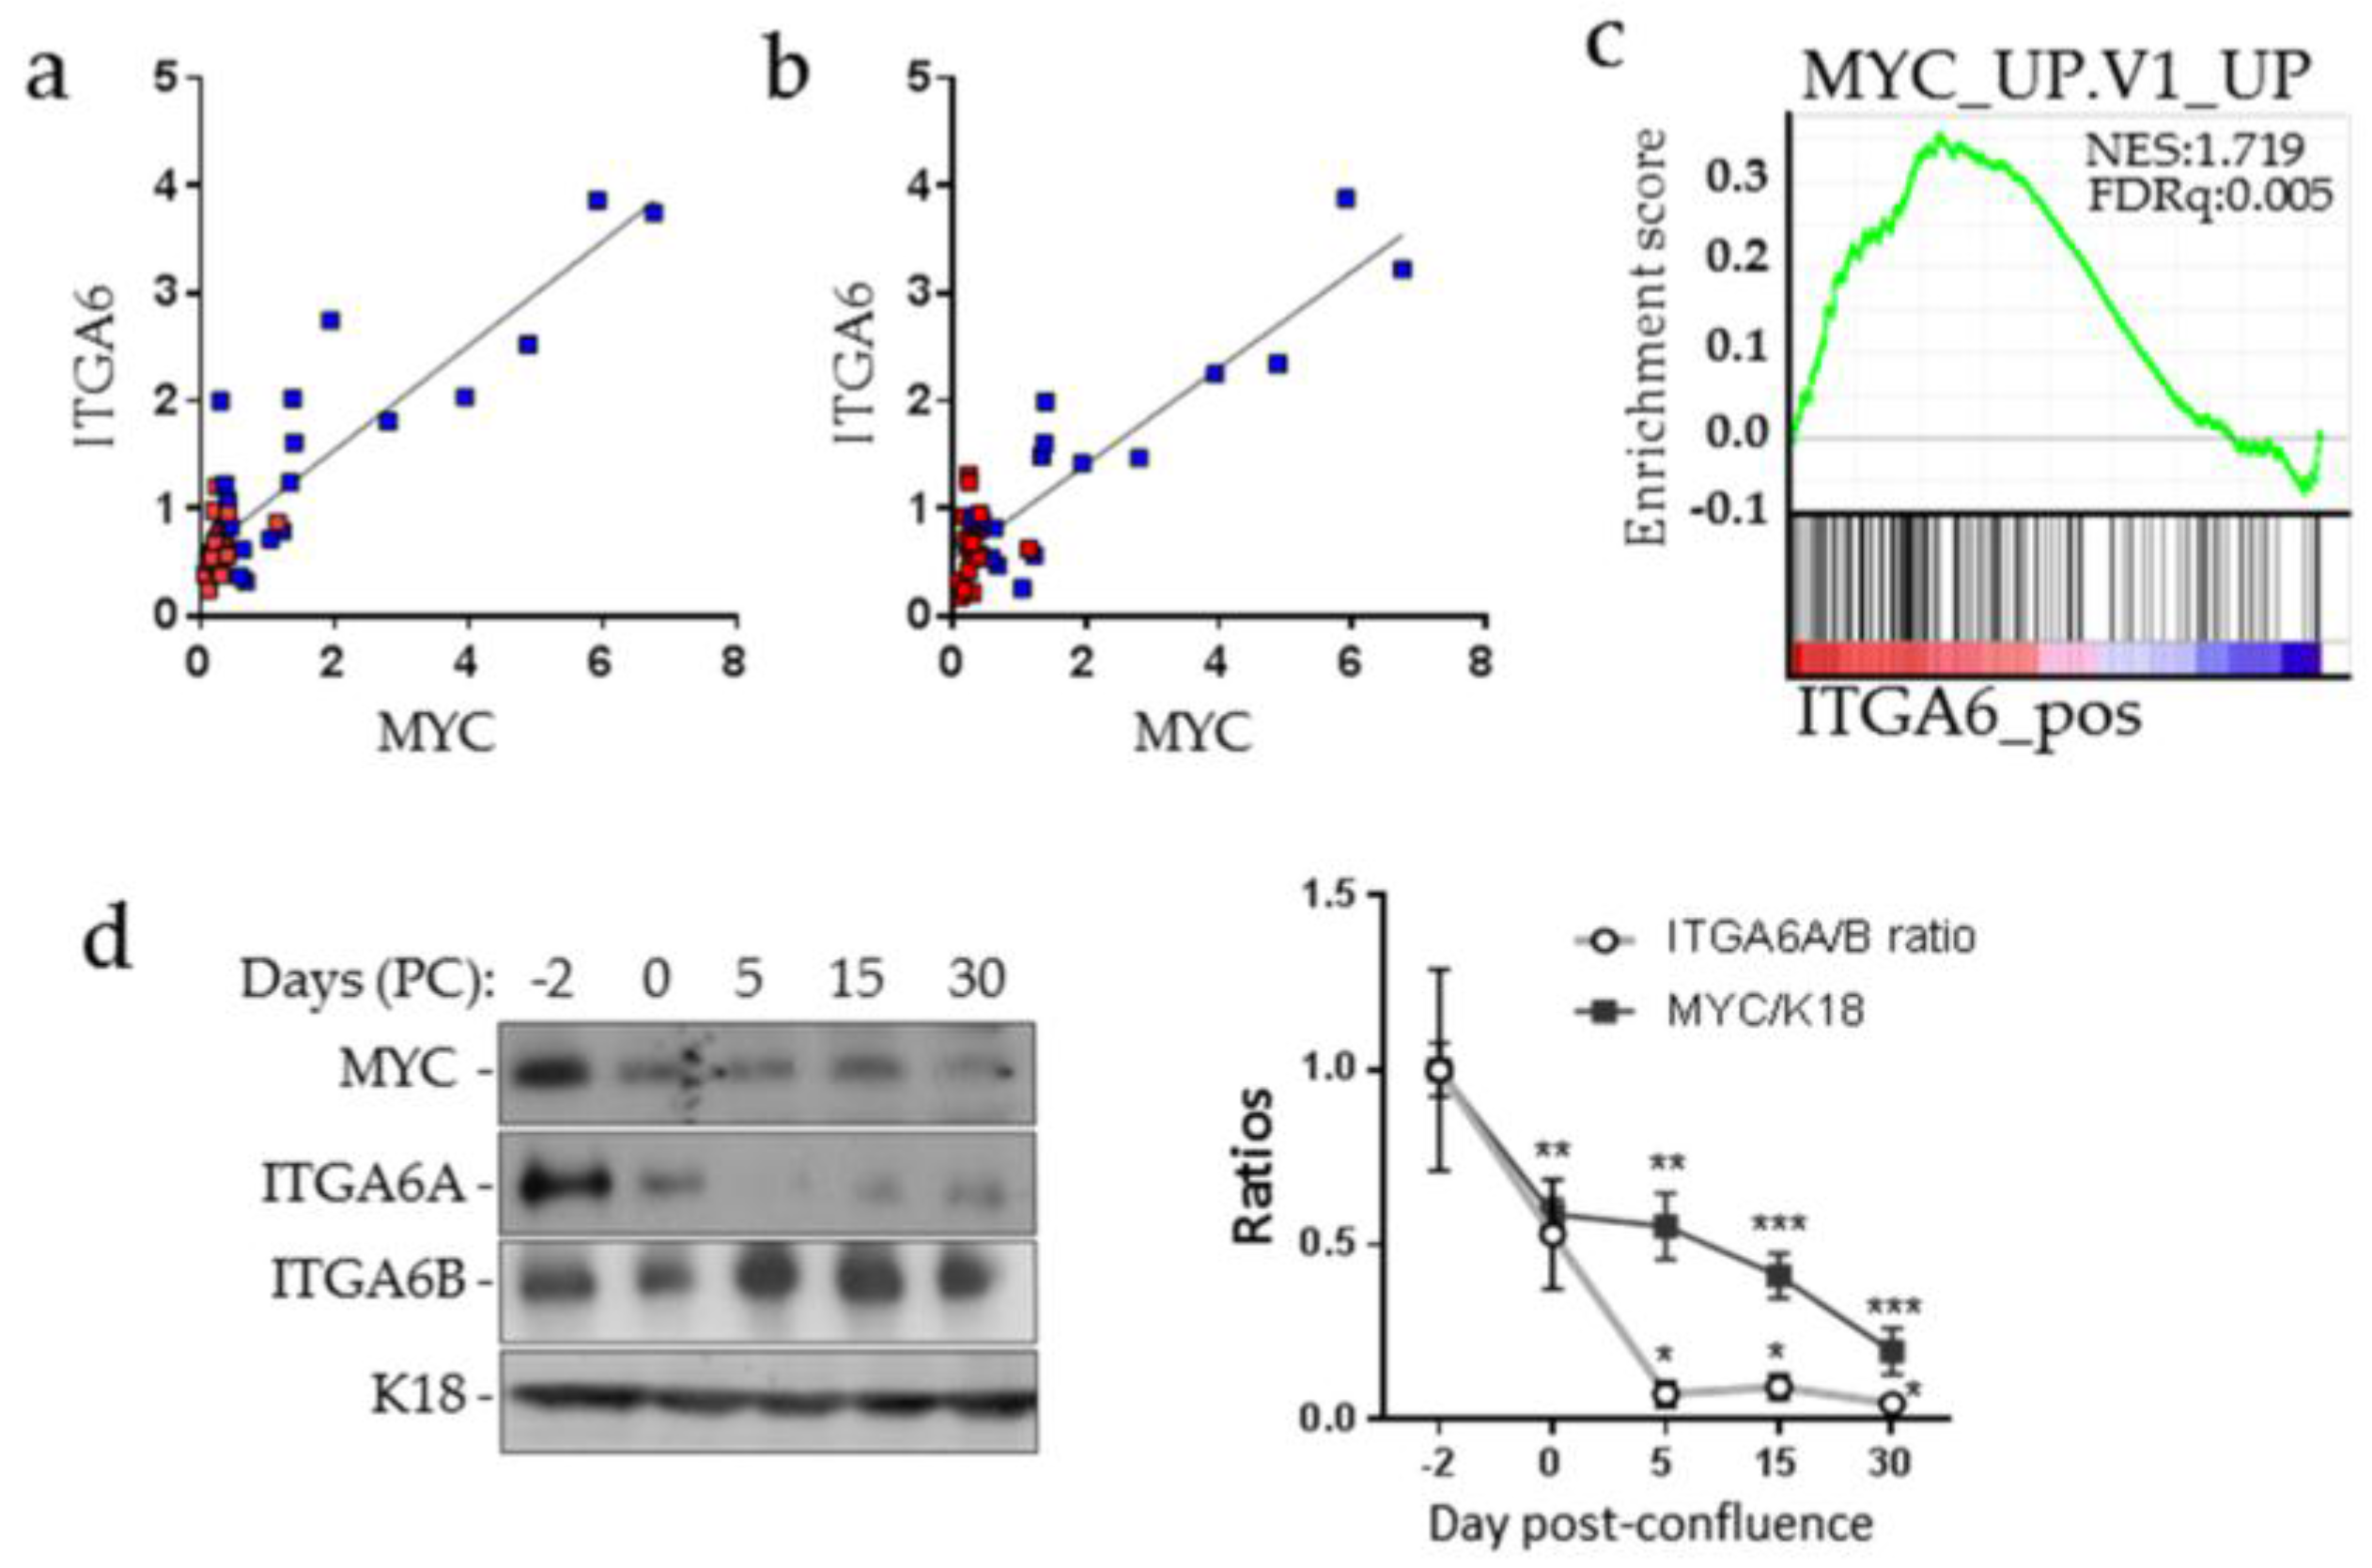
2.1. MYC and ITGA6A Expression Correlate in CRC Cells
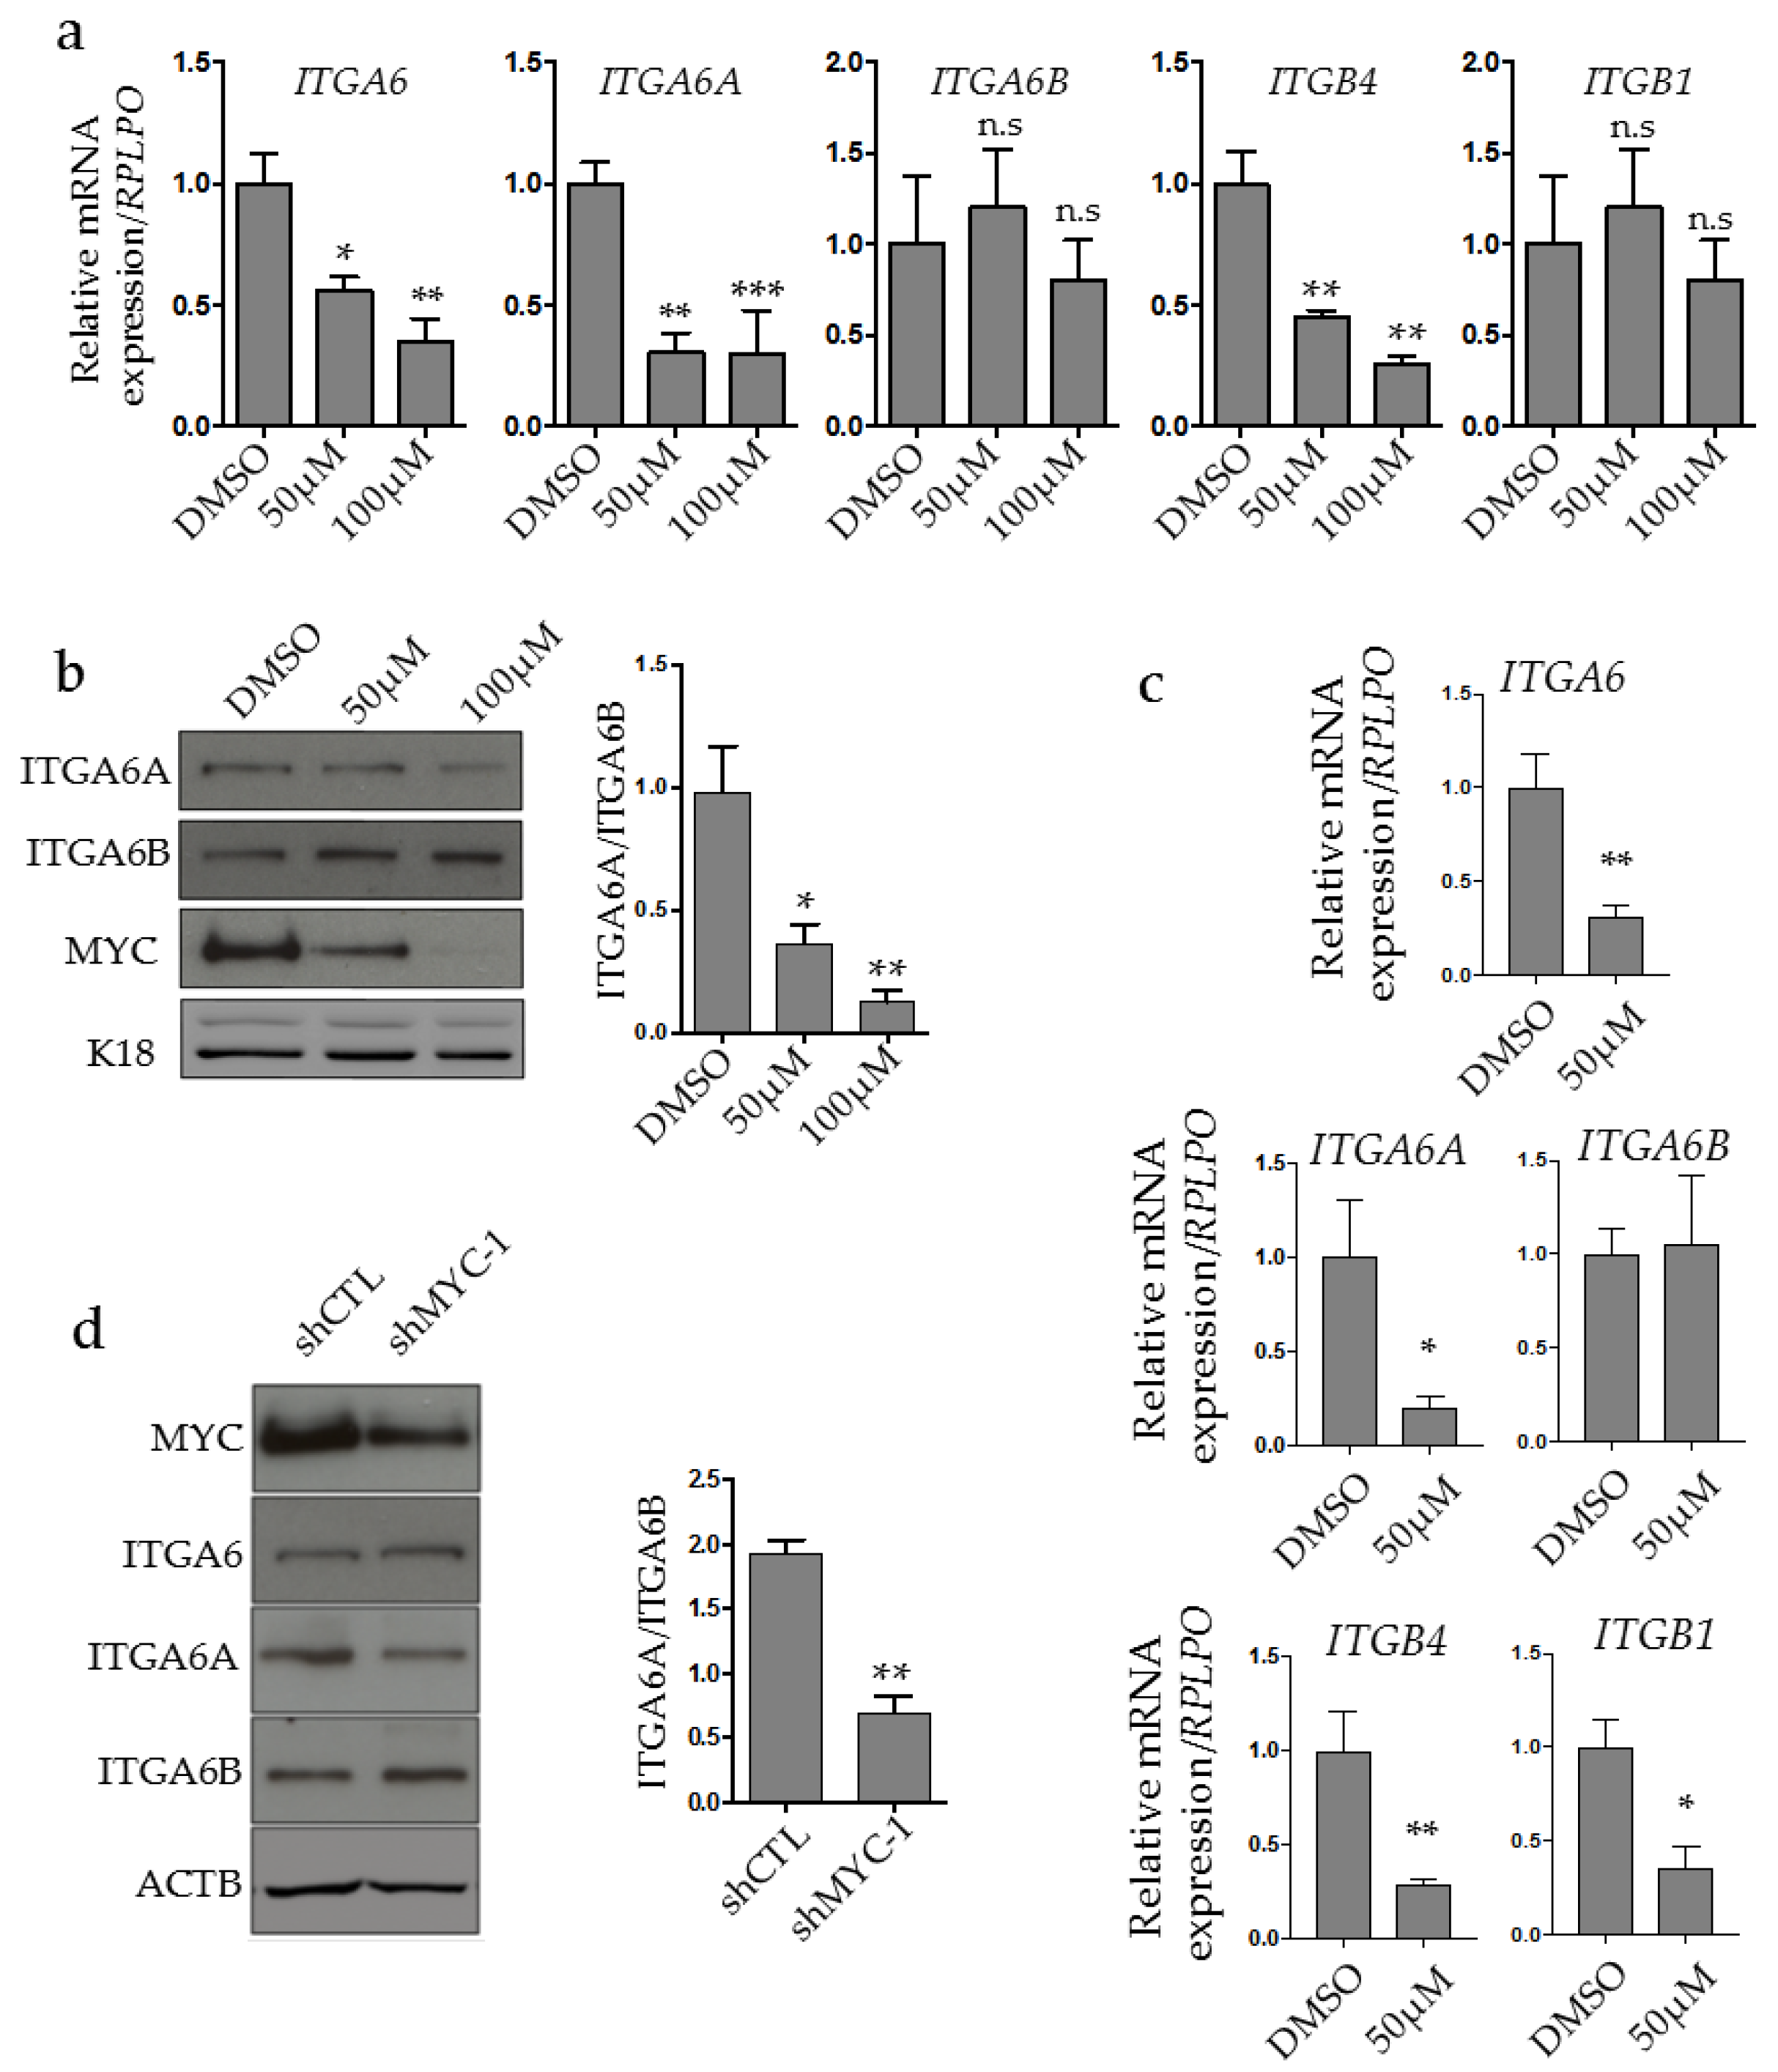
2.2. MYC Regulates ITGA6A Expression in CRC Cells
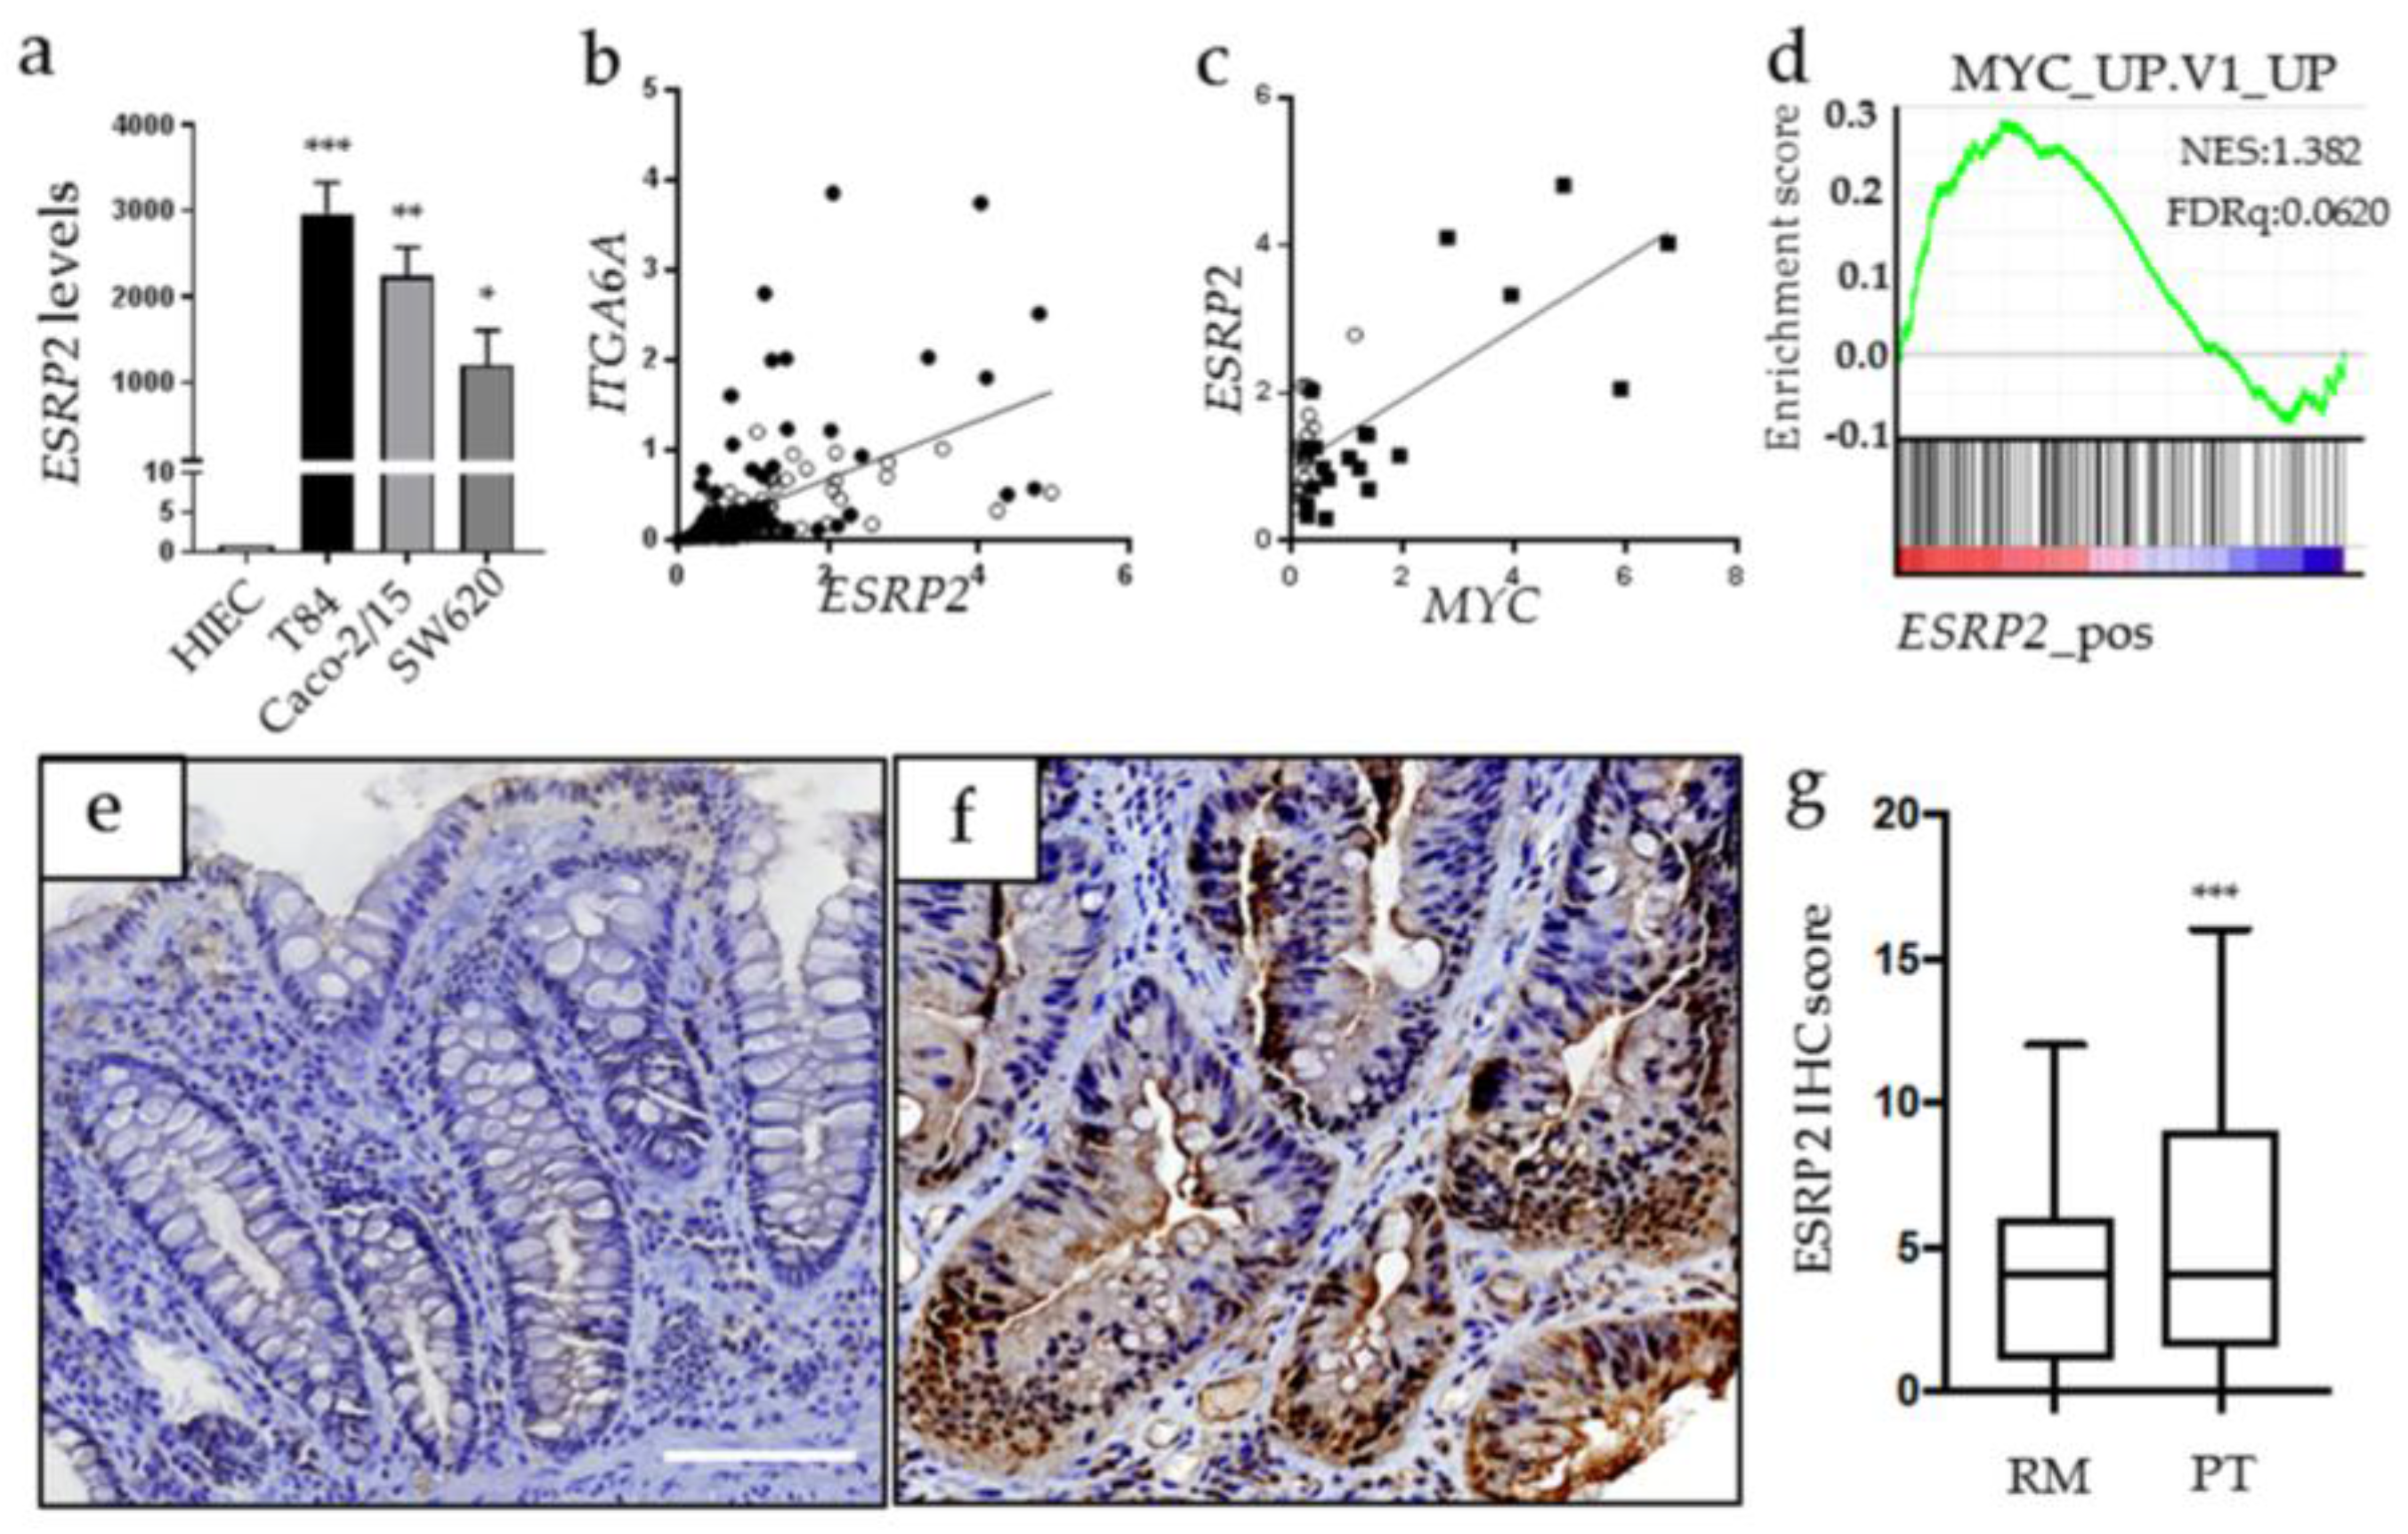
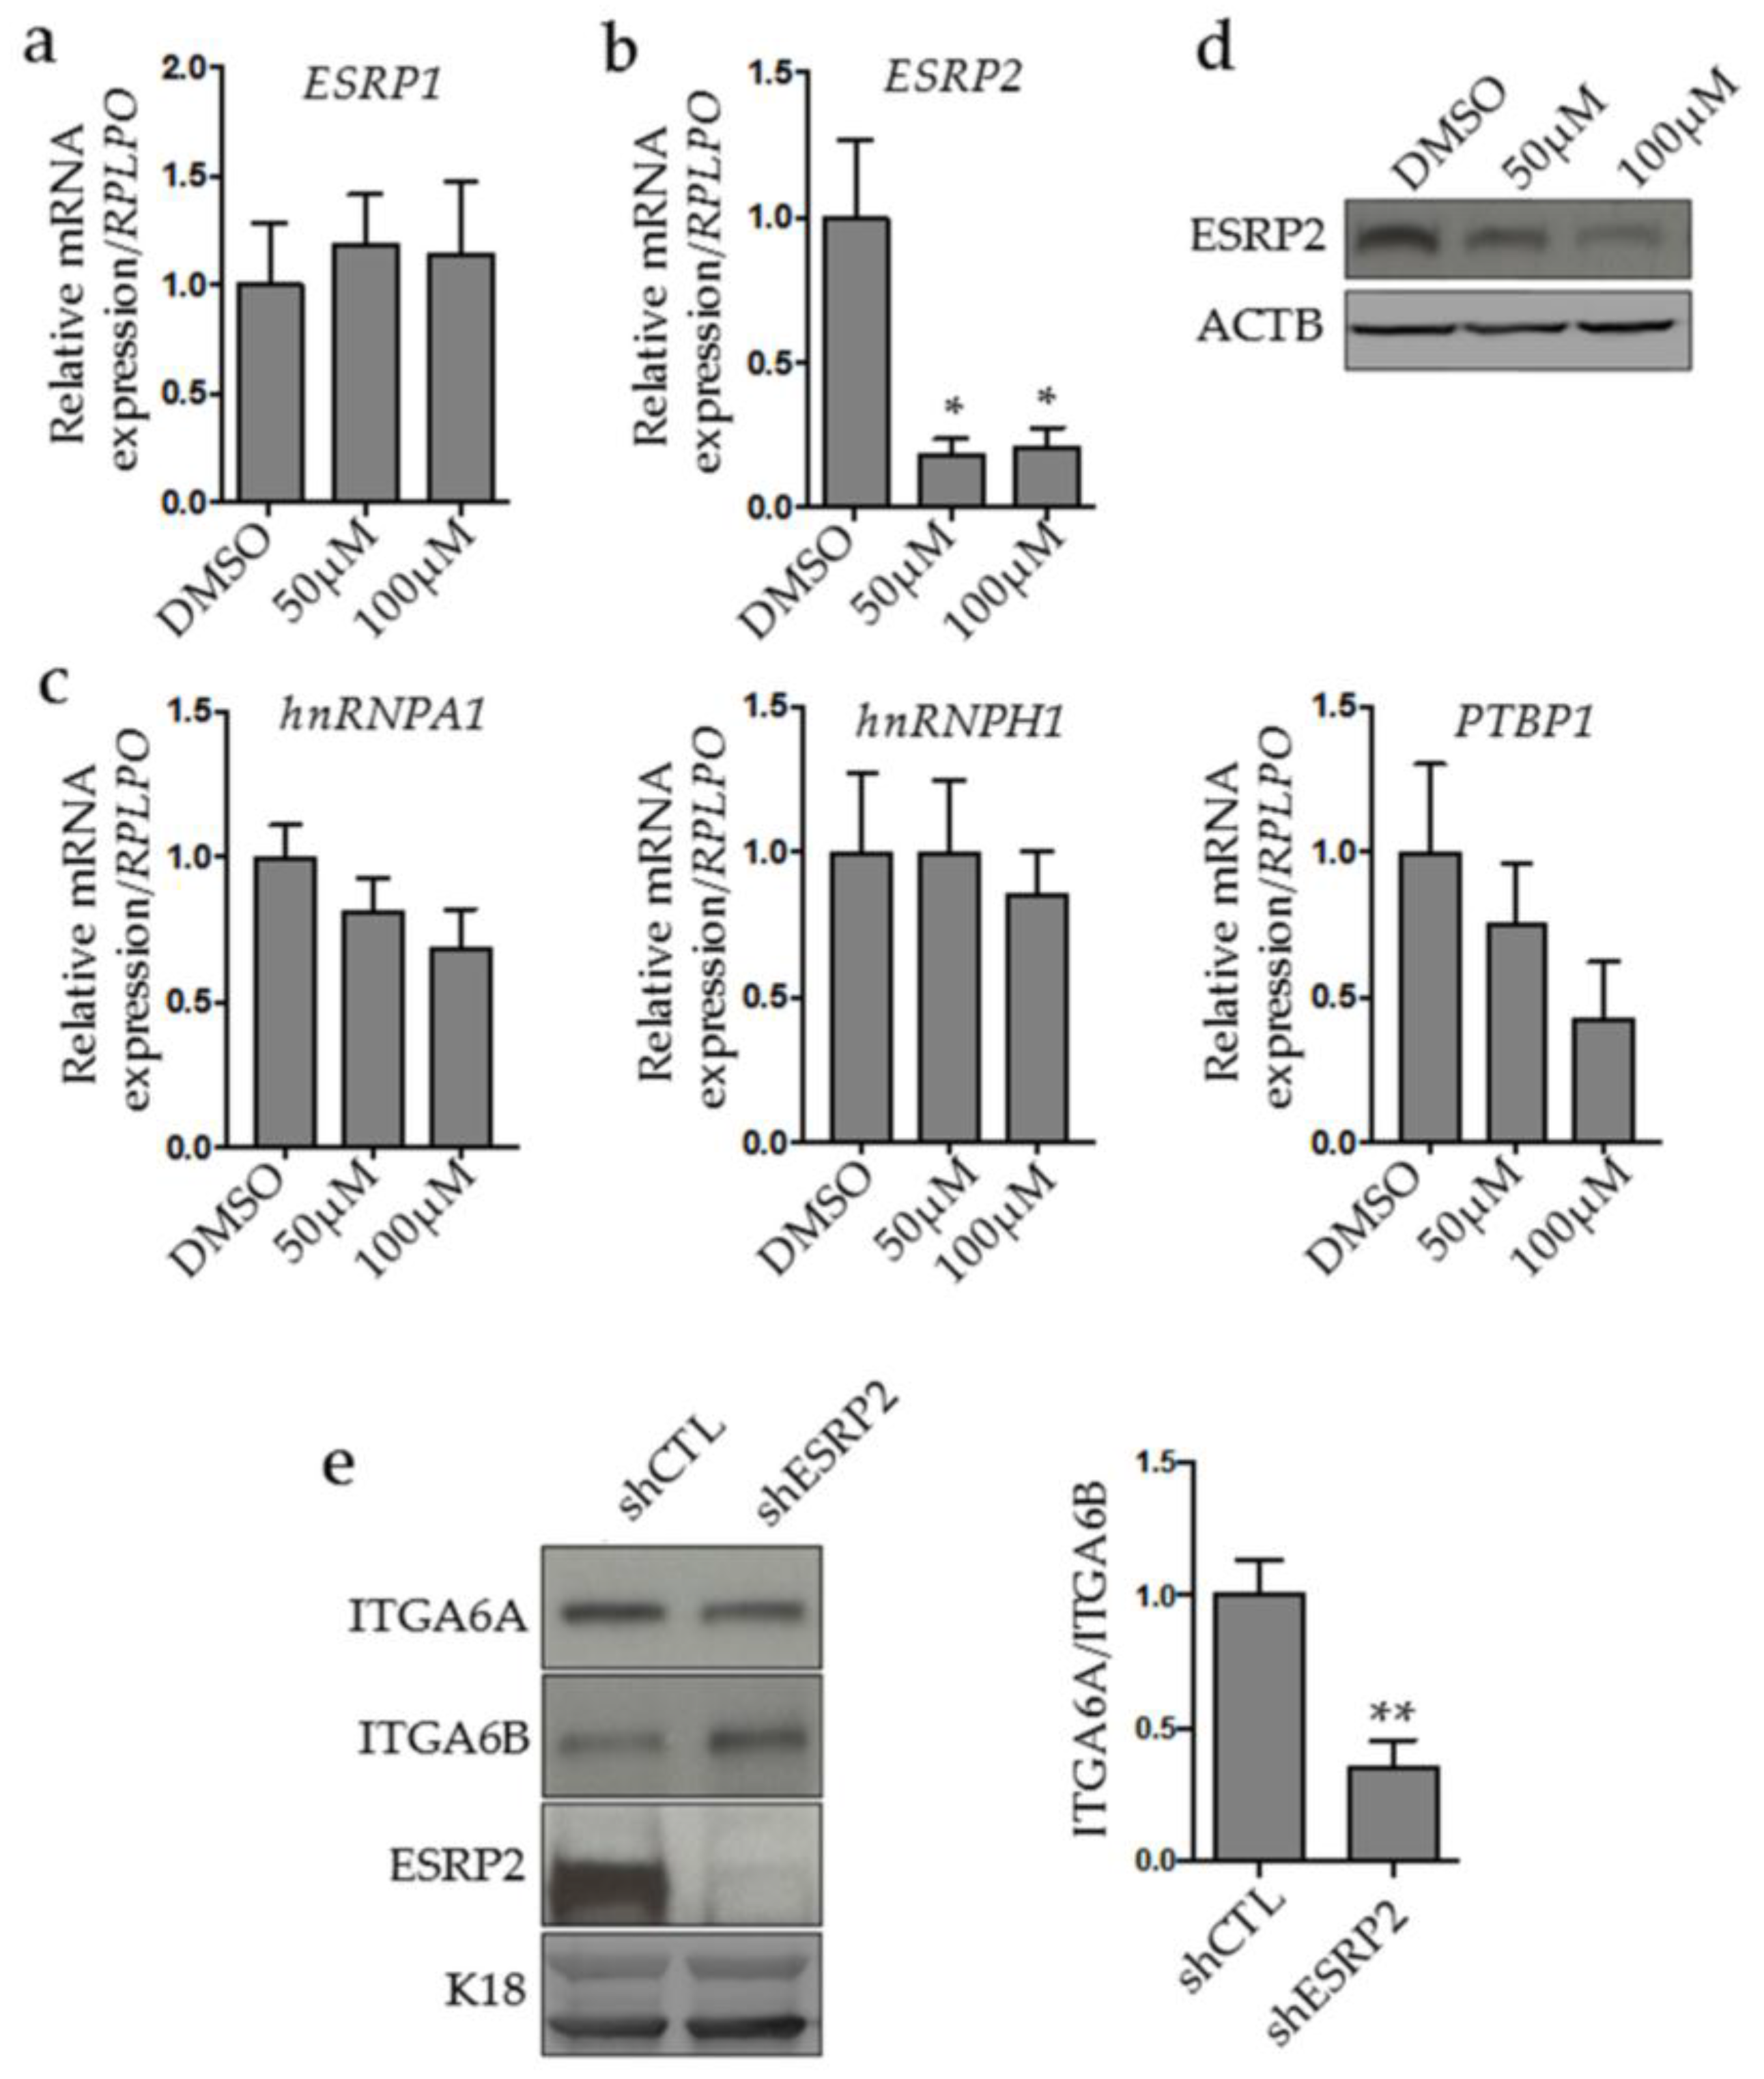
2.3. MYC Controls ESRP2 Expression to Regulate ITGA6 Splicing
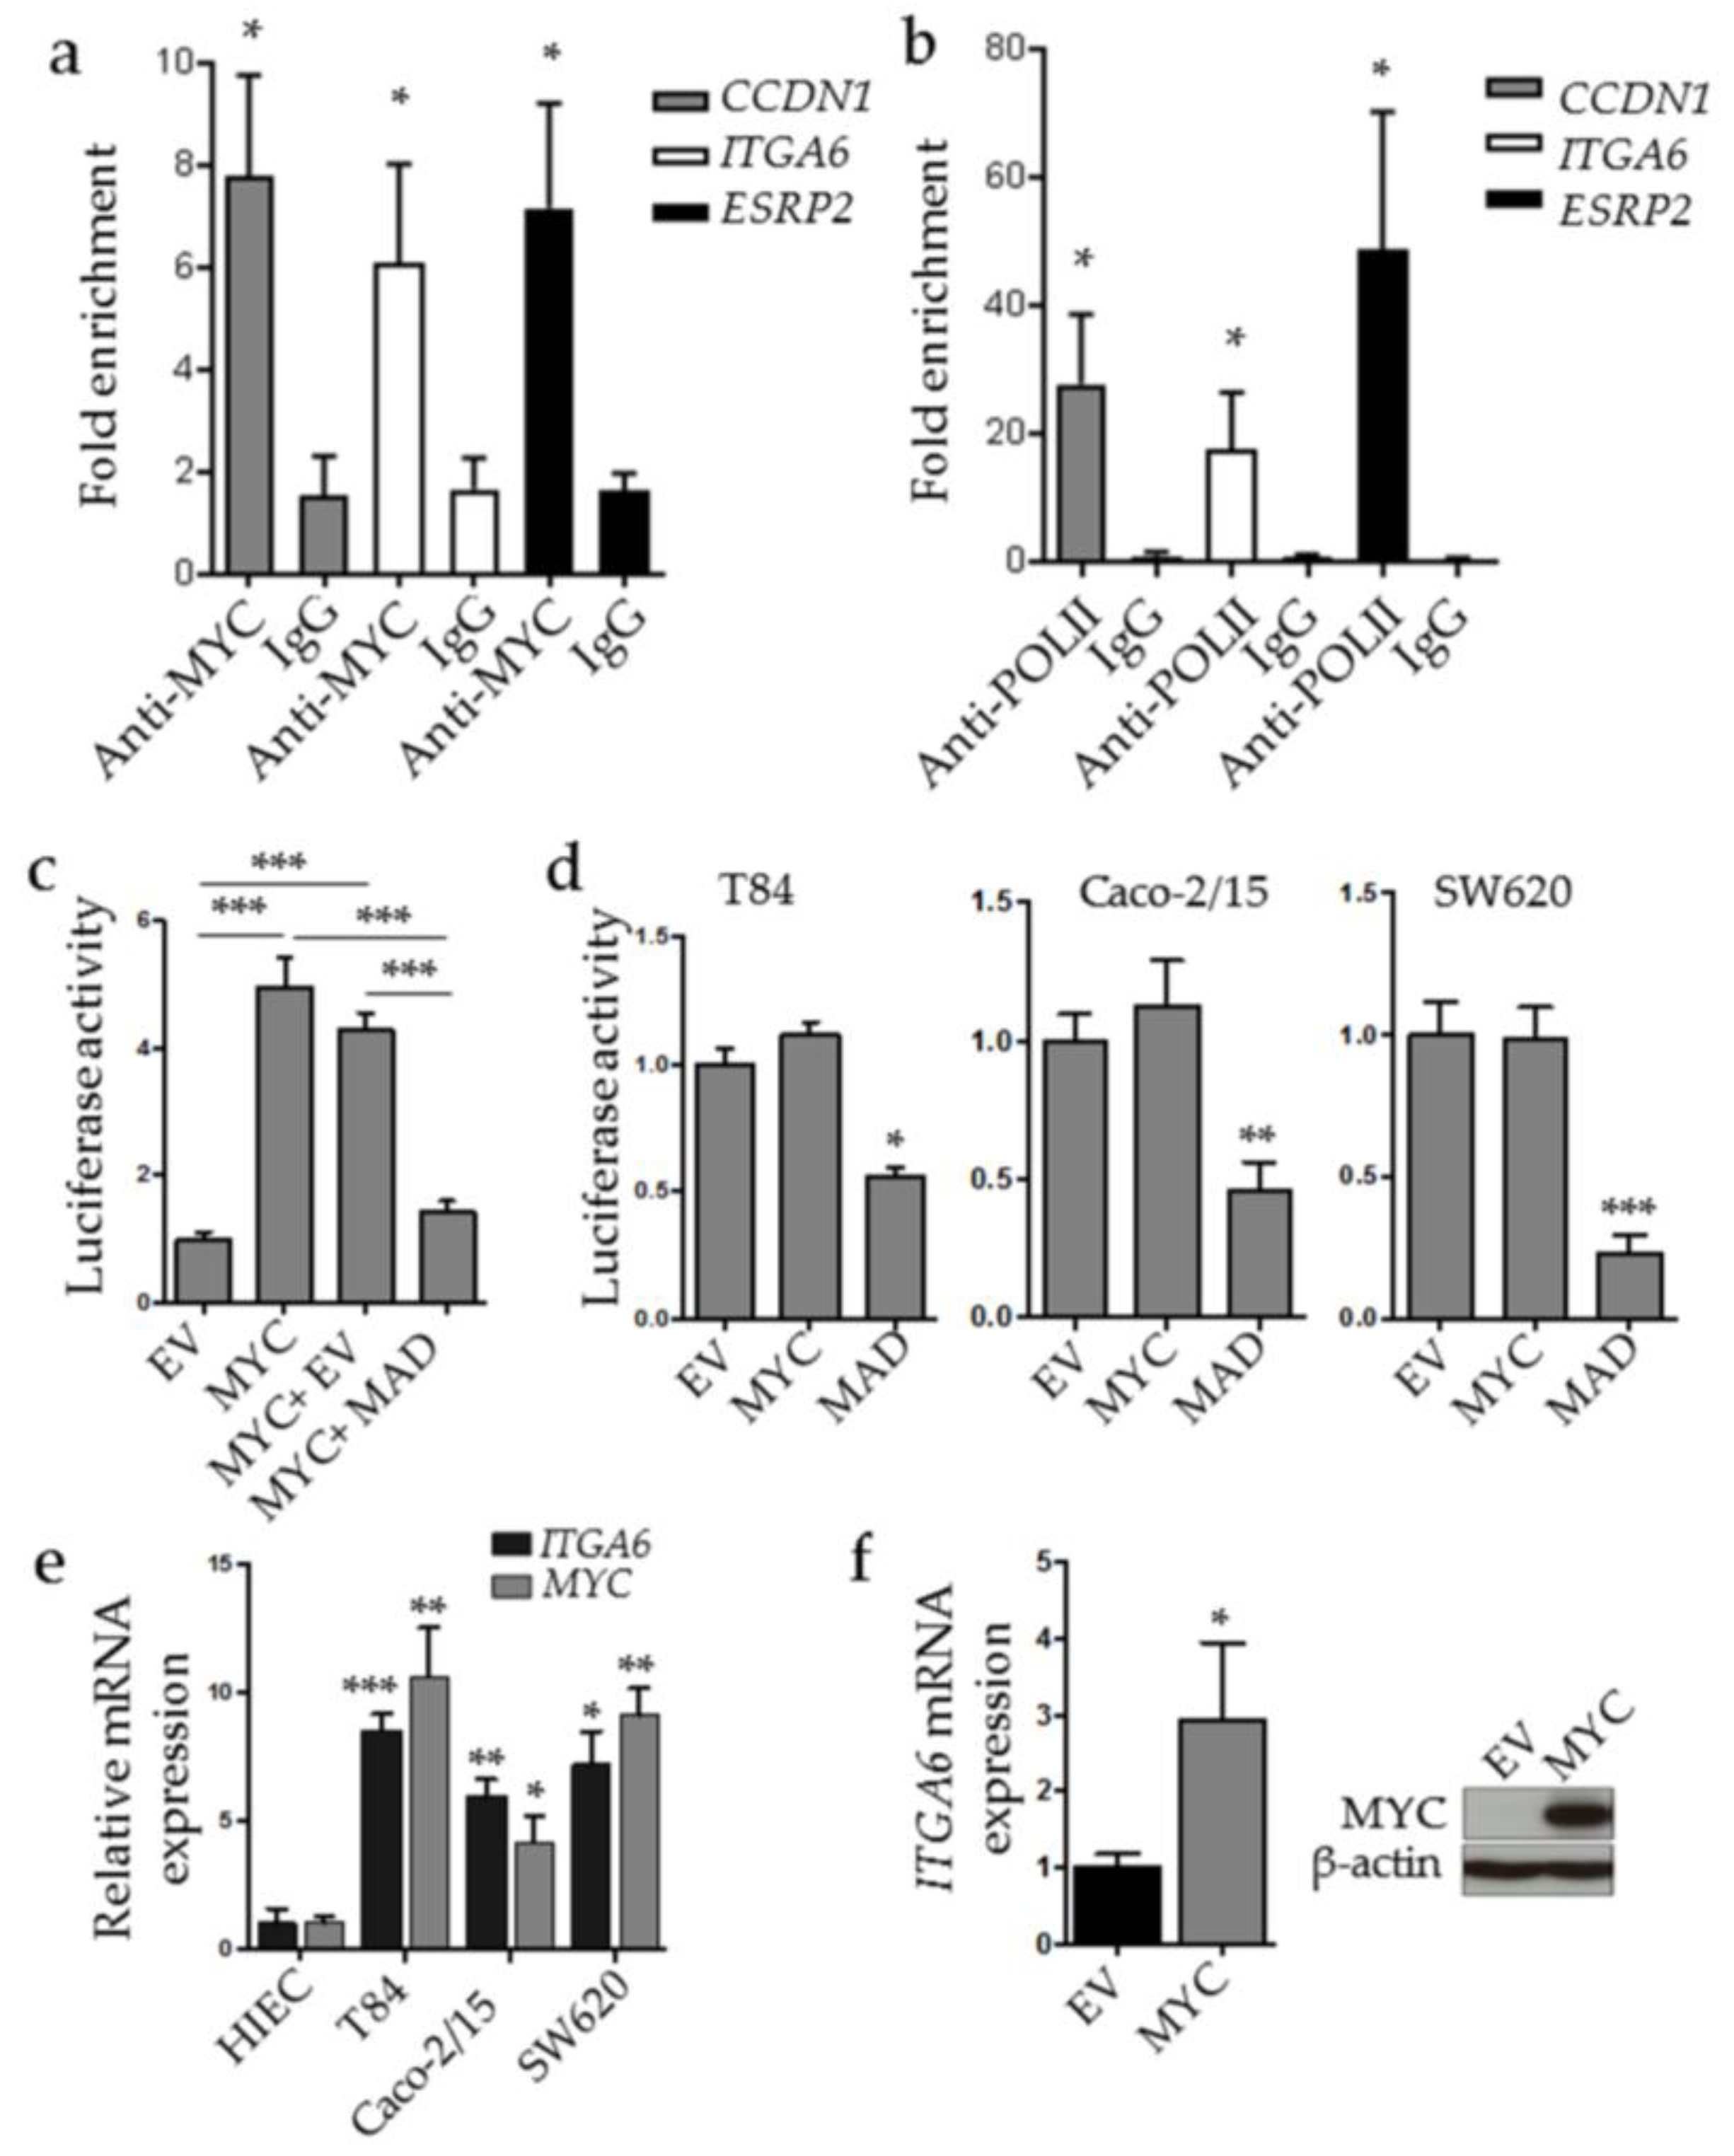
2.4. MYC Binds to ESRP2 and ITGA6 Promoters
2.5. ESRP2 Expression is Increased in CRC Cells in Cellulo and in Situ
3. Discussion
4. Materials and Methods
4.1. Human Colon Tissue Samples
4.2. Cell Culture, MYC and ESRP2 Stable Knockdown Cells and MYC Inhibition
4.3. Protein Extraction and Western Blot
4.4. Transfections and Luciferase Assays
4.5. RNA Extraction, RT-PCR and Quantitative RT-PCR
4.6. Chromatin Immunoprecipitation
4.7. Tissue Microarray and ESRP2 Immunohistochemistry Staining
4.8. Bioinformatic Analysis
4.9. Statistical Analysis
5. Conclusions
Acknowledgments
Author Contributions
Conflicts of Interest
References
- Margadant, C.; Monsuur, H.N.; Norman, J.C.; Sonnenberg, A. Mechanisms of integrin activation and trafficking. Curr. Opin. Cell Biol. 2011, 23, 607–614. [Google Scholar] [CrossRef] [PubMed]
- De Melker, A.A.; Sonnenberg, A. Integrins: Alternative splicing as a mechanism to regulate ligand binding and integrin signaling events. Bioessays 1999, 21, 499–509. [Google Scholar] [CrossRef]
- Geiger, B.; Yamada, K.M. Molecular architecture and function of matrix adhesions. Cold Spring Harb. Perspect. Biol. 2011, 3. [Google Scholar] [CrossRef] [PubMed]
- Sun, Z.; Guo, S.S.; Fassler, R. Integrin-mediated mechanotransduction. J. Cell Biol. 2016, 215, 445–456. [Google Scholar] [CrossRef] [PubMed]
- Moreno-Layseca, P.; Streuli, C.H. Signalling pathways linking integrins with cell cycle progression. Matrix Biol. 2014, 34, 144–153. [Google Scholar] [CrossRef] [PubMed]
- Desgrosellier, J.S.; Cheresh, D.A. Integrins in cancer: Biological implications and therapeutic opportunities. Nat. Rev. Cancer 2010, 10, 9–22. [Google Scholar] [CrossRef] [PubMed]
- Bianconi, D.; Unseld, M.; Prager, G.W. Integrins in the spotlight of cancer. Int. J. Mol. Sci. 2016, 17. [Google Scholar] [CrossRef] [PubMed]
- Stewart, R.L.; O’Connor, K.L. Clinical significance of the integrin α6β4 in human malignancies. Lab. Invest. 2015, 95, 976–986. [Google Scholar] [CrossRef] [PubMed]
- Guo, W.; Giancotti, F.G. Integrin signalling during tumour progression. Nat. Rev. Mol. Cell Biol. 2004, 5, 816–826. [Google Scholar] [CrossRef] [PubMed]
- Litjens, S.H.; de Pereda, J.M.; Sonnenberg, A. Current insights into the formation and breakdown of hemidesmosomes. Trends Cell Biol. 2006, 16, 376–383. [Google Scholar] [CrossRef] [PubMed]
- Ramovs, V.; Te Molder, L.; Sonnenberg, A. The opposing roles of laminin-binding integrins in cancer. Matrix Biol. 2017, 57–58, 213–243. [Google Scholar] [CrossRef] [PubMed]
- Dydensborg, A.B.; Teller, I.C.; Groulx, J.F.; Basora, N.; Pare, F.; Herring, E.; Gauthier, R.; Jean, D.; Beaulieu, J.F. Integrin α6Bβ4 inhibits colon cancer cell proliferation and c-MYC activity. BMC Cancer 2009, 9. [Google Scholar] [CrossRef] [PubMed]
- Ni, H.; Dydensborg, A.B.; Herring, F.E.; Basora, N.; Gagne, D.; Vachon, P.H.; Beaulieu, J.F. Upregulation of a functional form of the β4 integrin subunit in colorectal cancers correlates with c-MYC expression. Oncogene 2005, 24, 6820–6829. [Google Scholar] [CrossRef] [PubMed]
- Werner, M.E.; Chen, F.; Moyano, J.V.; Yehiely, F.; Jones, J.C.; Cryns, V.L. Caspase proteolysis of the integrin beta4 subunit disrupts hemidesmosome assembly, promotes apoptosis, and inhibits cell migration. J. Biol. Chem. 2007, 282, 5560–5569. [Google Scholar] [CrossRef] [PubMed]
- Giancotti, F.G.; Stepp, M.A.; Suzuki, S.; Engvall, E.; Ruoslahti, E. Proteolytic processing of endogenous and recombinant β 4 integrin subunit. J. Cell Biol. 1992, 118, 951–959. [Google Scholar] [CrossRef] [PubMed]
- Hogervorst, F.; Admiraal, L.G.; Niessen, C.; Kuikman, I.; Janssen, H.; Daams, H.; Sonnenberg, A. Biochemical characterization and tissue distribution of the a and b variants of the integrin α 6 subunit. J. Cell Biol. 1993, 121, 179–191. [Google Scholar] [CrossRef] [PubMed]
- Leivo, I.; Tani, T.; Laitinen, L.; Bruns, R.; Kivilaakso, E.; Lehto, V.P.; Burgeson, R.E.; Virtanen, I. Anchoring complex components laminin-5 and type VII collagen in intestine: Association with migrating and differentiating enterocytes. J. Histochem. Cytochem. 1996, 44, 1267–1277. [Google Scholar] [CrossRef] [PubMed]
- Simon-Assmann, P.; Duclos, B.; Orian-Rousseau, V.; Arnold, C.; Mathelin, C.; Engvall, E.; Kedinger, M. Differential expression of laminin isoforms and α6β4 integrin subunits in the developing human and mouse intestine. Dev. Dyn. 1994, 201, 71–85. [Google Scholar] [CrossRef] [PubMed]
- Basora, N.; Herring-Gillam, F.E.; Boudreau, F.; Perreault, N.; Pageot, L.P.; Simoneau, M.; Bouatrouss, Y.; Beaulieu, J.F. Expression of functionally distinct variants of the β(4)a integrin subunit in relation to the differentiation state in human intestinal cells. J. Biol. Chem. 1999, 274, 29819–29825. [Google Scholar] [CrossRef] [PubMed]
- Dydensborg, A.B.; Teller, I.C.; Basora, N.; Groulx, J.F.; Auclair, J.; Francoeur, C.; Escaffit, F.; Pare, F.; Herring, E.; Menard, D.; et al. Differential expression of the integrins α6Aβ4 and α6Bβ4 along the crypt-villus axis in the human small intestine. Histochem. Cell Biol. 2009, 131, 531–536. [Google Scholar] [CrossRef] [PubMed]
- Beaulieu, J.F. Integrin α6β4 in colorectal cancer. World J. Gastrointest. Pathophysiol. 2010, 1, 3–11. [Google Scholar] [CrossRef] [PubMed]
- Groulx, J.F.; Giroux, V.; Beausejour, M.; Boudjadi, S.; Basora, N.; Carrier, J.C.; Beaulieu, J.F. Integrin α6A splice variant regulates proliferation and the Wnt/β-catenin pathway in human colorectal cancer cells. Carcinogenesis 2014, 35, 1217–1227. [Google Scholar] [CrossRef] [PubMed]
- Warzecha, C.C.; Jiang, P.; Amirikian, K.; Dittmar, K.A.; Lu, H.; Shen, S.; Guo, W.; Xing, Y.; Carstens, R.P. An ESRP-regulated splicing programme is abrogated during the epithelial-mesenchymal transition. EMBO J. 2010, 29, 3286–3300. [Google Scholar] [CrossRef] [PubMed]
- Yang, Y.; Park, J.W.; Bebee, T.W.; Warzecha, C.C.; Guo, Y.; Shang, X.; Xing, Y.; Carstens, R.P. Determination of a comprehensive alternative splicing regulatory network and combinatorial regulation by key factors during the epithelial-to-mesenchymal transition. Mol. Cell Biol. 2016, 36, 1704–1719. [Google Scholar] [CrossRef] [PubMed]
- Goel, H.L.; Gritsko, T.; Pursell, B.; Chang, C.; Shultz, L.D.; Greiner, D.L.; Norum, J.H.; Toftgard, R.; Shaw, L.M.; Mercurio, A.M. Regulated splicing of the α6 integrin cytoplasmic domain determines the fate of breast cancer stem cells. Cell Rep. 2014, 7, 747–761. [Google Scholar] [CrossRef] [PubMed]
- Mizutani, A.; Koinuma, D.; Seimiya, H.; Miyazono, K. The Arkadia-ESRP2 axis suppresses tumor progression: Analyses in clear-cell renal cell carcinoma. Oncogene 2016, 35, 3514–3523. [Google Scholar] [CrossRef] [PubMed]
- Venables, J.P.; Lapasset, L.; Gadea, G.; Fort, P.; Klinck, R.; Irimia, M.; Vignal, E.; Thibault, P.; Prinos, P.; Chabot, B.; et al. MBNL1 and RBFOX2 cooperate to establish a splicing programme involved in pluripotent stem cell differentiation. Nat. Commun. 2013, 4. [Google Scholar] [CrossRef] [PubMed]
- Noiret, M.; Mereau, A.; Angrand, G.; Bervas, M.; Gautier-Courteille, C.; Legagneux, V.; Deschamps, S.; Lerivray, H.; Viet, J.; Hardy, S.; et al. Robust identification of PTBP1-dependent splicing events by a junction-centric approach in Xenopus laevis. Dev. Biol. 2017, 426, 449–459. [Google Scholar] [CrossRef] [PubMed]
- Nishida, K.; Kitazawa, R.; Mizuno, K.; Maeda, S.; Kitazawa, S. Identification of regulatory elements of human α6 integrin subunit gene. Biochem. Biophys. Res. Commun. 1997, 241, 258–263. [Google Scholar] [CrossRef] [PubMed]
- Gaudreault, M.; Vigneault, F.; Leclerc, S.; Guerin, S.L. Laminin reduces expression of the human α6 integrin subunit gene by altering the level of the transcription factors SP1 and SP3. Invest. Ophthalmol. Vis. Sci. 2007, 48, 3490–3505. [Google Scholar] [CrossRef] [PubMed]
- Dang, C.V. MYC on the path to cancer. Cell 2012, 149, 22–35. [Google Scholar] [CrossRef] [PubMed]
- Boudjadi, S.; Carrier, J.C.; Groulx, J.F.; Beaulieu, J.F. Integrin α1β1 expression is controlled by c-MYC in colorectal cancer cells. Oncogene 2016, 35, 1671–1678. [Google Scholar] [CrossRef] [PubMed]
- Shen, Y.; Miao, N.; Wang, B.; Xu, J.; Gan, X.; Xu, D.; Zhou, L.; Xue, H.; Zhang, W.; Yang, L.; et al. C-MYC promotes renal fibrosis by inducing integrin αv-mediated transforming growth factor-β signaling. Kidney Int. 2017, 92, 888–899. [Google Scholar] [CrossRef] [PubMed]
- Sikora, K.; Chan, S.; Evan, G.; Gabra, H.; Markham, N.; Stewart, J.; Watson, J. C-MYC oncogene expression in colorectal cancer. Cancer 1987, 59, 1289–1295. [Google Scholar] [CrossRef]
- Erisman, M.D.; Rothberg, P.G.; Diehl, R.E.; Morse, C.C.; Spandorfer, J.M.; Astrin, S.M. Deregulation of c-MYC gene expression in human colon carcinoma is not accompanied by amplification or rearrangement of the gene. Mol. Cell Biol. 1985, 5, 1969–1976. [Google Scholar] [CrossRef] [PubMed]
- Chabot, B.; Shkreta, L. Defective control of pre-messenger RNA splicing in human disease. J. Cell Biol. 2016, 212, 13–27. [Google Scholar] [CrossRef] [PubMed]
- Boudjadi, S.; Beaulieu, J.F. MYC and integrins interplay in colorectal cancer. Oncoscience 2016, 3, 50–51. [Google Scholar] [PubMed]
- Rauch, J.; Moran-Jones, K.; Albrecht, V.; Schwarzl, T.; Hunter, K.; Gires, O.; Kolch, W. C-MYC regulates RNA splicing of the A-Raf kinase and its activation of the ERK pathway. Cancer Res. 2011, 71, 4664–4674. [Google Scholar] [CrossRef] [PubMed]
- David, C.J.; Chen, M.; Assanah, M.; Canoll, P.; Manley, J.L. HnRNP proteins controlled by c-MYC deregulate pyruvate kinase mRNA splicing in cancer. Nature 2010, 463, 364–368. [Google Scholar] [CrossRef] [PubMed]
- Grandori, C.; Cowley, S.M.; James, L.P.; Eisenman, R.N. The MYC/MAX/MAD network and the transcriptional control of cell behavior. Annu. Rev. Cell Dev. Biol. 2000, 16, 653–699. [Google Scholar] [CrossRef] [PubMed]
- Hsu, T.Y.; Simon, L.M.; Neill, N.J.; Marcotte, R.; Sayad, A.; Bland, C.S.; Echeverria, G.V.; Sun, T.; Kurley, S.J.; Tyagi, S.; et al. The spliceosome is a therapeutic vulnerability in MYC-driven cancer. Nature 2015, 525, 384–388. [Google Scholar] [CrossRef] [PubMed]
- Koh, C.M.; Bezzi, M.; Low, D.H.; Ang, W.X.; Teo, S.X.; Gay, F.P.; Al-Haddawi, M.; Tan, S.Y.; Osato, M.; Sabo, A.; et al. MYC regulates the core pre-mRNA splicing machinery as an essential step in lymphomagenesis. Nature 2015, 523, 96–100. [Google Scholar] [CrossRef] [PubMed]
- Xu, J.; Chen, Y.; Olopade, O.I. MYC and breast cancer. Genes Cancer 2010, 1, 629–640. [Google Scholar] [CrossRef] [PubMed]
- Cariati, M.; Naderi, A.; Brown, J.P.; Smalley, M.J.; Pinder, S.E.; Caldas, C.; Purushotham, A.D. Alpha 6 integrin is necessary for the tumourigenicity of a stem cell-like subpopulation within the MCF7 breast cancer cell line. Int. J. Cancer 2008, 122, 298–304. [Google Scholar] [CrossRef] [PubMed]
- Koh, C.M.; Bieberich, C.J.; Dang, C.V.; Nelson, W.G.; Yegnasubramanian, S.; De Marzo, A.M. MYC and prostate cancer. Genes Cancer 2010, 1, 617–628. [Google Scholar] [CrossRef] [PubMed]
- Rabinovitz, I.; Nagle, R.B.; Cress, A.E. Integrin α6 expression in human prostate carcinoma cells is associated with a migratory and invasive phenotype in vitro and in vivo. Clin. Exp. Metastasis 1995, 13, 481–491. [Google Scholar] [CrossRef] [PubMed]
- Wang, L.; Wang, L.; Gu, Y.; Shu, Y.; Shen, Y.; Xu, Q. Integrin α6(high) cell population functions as an initiator in tumorigenesis and relapse of human liposarcoma. Mol. Cancer Ther. 2011, 10, 2276–2286. [Google Scholar] [CrossRef] [PubMed]
- Tran, D.; Verma, K.; Ward, K.; Diaz, D.; Kataria, E.; Torabi, A.; Almeida, A.; Malfoy, B.; Stratford, E.W.; Mitchell, D.C.; et al. Functional genomics analysis reveals a MYC signature associated with a poor clinical prognosis in liposarcomas. Am. J. Pathol. 2015, 185, 717–728. [Google Scholar] [CrossRef] [PubMed]
- Hirvonen, H.E.; Salonen, R.; Sandberg, M.M.; Vuorio, E.; Vastrik, I.; Kotilainen, E.; Kalimo, H. Differential expression of MYC, MAX and RB1 genes in human gliomas and glioma cell lines. Br. J. Cancer 1994, 69, 16–25. [Google Scholar] [CrossRef] [PubMed]
- Lathia, J.D.; Gallagher, J.; Heddleston, J.M.; Wang, J.; Eyler, C.E.; Macswords, J.; Wu, Q.; Vasanji, A.; McLendon, R.E.; Hjelmeland, A.B.; et al. Integrin α6 regulates glioblastoma stem cells. Cell Stem. Cell 2010, 6, 421–432. [Google Scholar] [CrossRef] [PubMed]
- Fagoonee, S.; Picco, G.; Orso, F.; Arrigoni, A.; Longo, D.L.; Forni, M.; Scarfo, I.; Cassenti, A.; Piva, R.; Cassoni, P.; et al. The RNA-binding protein ESRP1 promotes human colorectal cancer progression. Oncotarget 2017, 8, 10007–10024. [Google Scholar] [CrossRef] [PubMed]
- Yae, T.; Tsuchihashi, K.; Ishimoto, T.; Motohara, T.; Yoshikawa, M.; Yoshida, G.J.; Wada, T.; Masuko, T.; Mogushi, K.; Tanaka, H.; et al. Alternative splicing of CD44 mRNA by ESRP1 enhances lung colonization of metastatic cancer cell. Nat. Commun. 2012, 3. [Google Scholar] [CrossRef] [PubMed]
- Deloria, A.J.; Hoflmayer, D.; Kienzl, P.; Lopatecka, J.; Sampl, S.; Klimpfinger, M.; Braunschmid, T.; Bastian, F.; Lu, L.; Marian, B.; et al. Epithelial splicing regulatory protein 1 and 2 paralogues correlate with splice signatures and favorable outcome in human colorectal cancer. Oncotarget 2016, 7, 73800–73816. [Google Scholar] [CrossRef] [PubMed]
- David, C.J.; Manley, J.L. Alternative pre-mRNA splicing regulation in cancer: Pathways and programs unhinged. Genes Dev. 2010, 24, 2343–2364. [Google Scholar] [CrossRef] [PubMed]
- Boudjadi, S.; Bernatchez, G.; Senicourt, B.; Beausejour, M.; Vachon, P.H.; Carrier, J.C.; Beaulieu, J.F. Involvement of the integrin α1β1 in the progression of colorectal cancer. Cancers 2017, 9. [Google Scholar] [CrossRef] [PubMed]
- Beaulieu, J.F.; Quaroni, A. Clonal analysis of sucrase-isomaltase expression in the human colon adenocarcinoma caco-2 cells. Biochem. J. 1991, 280, 599–608. [Google Scholar] [CrossRef] [PubMed]
- Perreault, N.; Beaulieu, J.F. Use of the dissociating enzyme thermolysin to generate viable human normal intestinal epithelial cell cultures. Exp. Cell Res. 1996, 224, 354–364. [Google Scholar] [CrossRef] [PubMed]
- Beaulieu, J.F.; Menard, D. Isolation, characterization, and culture of normal human intestinal crypt and villus cells. Methods Mol. Biol. 2012, 806, 157–173. [Google Scholar] [PubMed]
- Dydensborg, A.B.; Herring, E.; Auclair, J.; Tremblay, E.; Beaulieu, J.-F. Normalizing genes for quantitative RT-PCR in differentiating human intestinal epithelial cells and adenocarcinomas of the colon. Am. J. Physiol. Gastrointest. Liver Physiol. 2006, 290, G1067–G1074. [Google Scholar] [CrossRef] [PubMed]
- Pfaffl, M.W. A new mathematical model for relative quantification in real-time RT-PCR. Nucl. Acids Res. 2001, 29, e45. [Google Scholar] [CrossRef] [PubMed]
- Bustin, S.A.; Beaulieu, J.F.; Huggett, J.; Jaggi, R.; Kibenge, F.S.; Olsvik, P.A.; Penning, L.C.; Toegel, S. Miqe precis: Practical implementation of minimum standard guidelines for fluorescence-based quantitative real-time PCR experiments. BMC Mol. Biol. 2010, 11. [Google Scholar] [CrossRef] [PubMed] [Green Version]
- Boudjadi, S.; Carrier, J.C.; Beaulieu, J.F. Integrin α1 subunit is up-regulated in colorectal cancer. Biomark. Res. 2013, 1, 1–7. [Google Scholar] [CrossRef] [PubMed]


© 2018 by the authors. Licensee MDPI, Basel, Switzerland. This article is an open access article distributed under the terms and conditions of the Creative Commons Attribution (CC BY) license (http://creativecommons.org/licenses/by/4.0/).
Share and Cite
Groulx, J.-F.; Boudjadi, S.; Beaulieu, J.-F. MYC Regulates α6 Integrin Subunit Expression and Splicing Under Its Pro-Proliferative ITGA6A Form in Colorectal Cancer Cells. Cancers 2018, 10, 42. https://doi.org/10.3390/cancers10020042
Groulx J-F, Boudjadi S, Beaulieu J-F. MYC Regulates α6 Integrin Subunit Expression and Splicing Under Its Pro-Proliferative ITGA6A Form in Colorectal Cancer Cells. Cancers. 2018; 10(2):42. https://doi.org/10.3390/cancers10020042
Chicago/Turabian StyleGroulx, Jean-François, Salah Boudjadi, and Jean-François Beaulieu. 2018. "MYC Regulates α6 Integrin Subunit Expression and Splicing Under Its Pro-Proliferative ITGA6A Form in Colorectal Cancer Cells" Cancers 10, no. 2: 42. https://doi.org/10.3390/cancers10020042