Article

The Circulating Transcriptome as a Source of Biomarkers for Melanoma

by
Carla Solé
1,
Daniela Tramonti
2,
Maike Schramm
1,3,
Ibai Goicoechea
1,
María Armesto
1,
Luiza I. Hernandez
1,
Lorea Manterola
1,
Marta Fernandez-Mercado
1,
Karmele Mujika
4,
Anna Tuneu
5,
Ane Jaka
5,
Maitena Tellaetxe
1,
Marc R. Friedländer
6,7,8,9,10,
Xavier Estivill
6,7,8,9,
Paolo Piazza
11,12,
Pablo L. Ortiz-Romero
13,14,
Mark R. Middleton
2 and
Charles H. Lawrie
1,15,16,*
1
Molecular Oncology group, Biodonostia Research Institute, San Sebastián 20012, Spain
2
Department of Oncology, University of Oxford, Oxford OX3 9DU, UK
3
Faculty of Biosciences, University of Heidelberg, Heidelberg 69120, Germany
4
Onkologikoa-Oncology Institute Gipuzkoa, Gipuzkoa 20012, Spain
5
Department of Dermatology, Hospital Universitario de Donostia, San Sebastian 20012, Spain
6
Genomics and Disease group, Centre for Genomic Regulation (CRG), Barcelona 08003, Spain
7
Universitat Pompeu Fabra (UPF), Barcelona 08002, Spain
8
Centro de Investigación Biomédica en Red Epidemiología y Salud Pública (CIBERESP), Barcelona 08002, Spain
9
Hospital del Mar Research Institute (IMIM), Barcelona 08003, Spain
10
Science for Life Laboratory, The Wenner-Gren Institute, Stockholm University, Stockholm SE-106 9, Sweden
11
Wellcome Trust Centre for Human Genetics, University of Oxford, Oxford OX3 7BN, UK
12
Imperial BRC Genomics Facility, Imperial College London, London SW7 2AZ, UK
13
Department of Dermatology, 12 de Octubre Hospital, Madrid 28041, Spain
14
Medical School, Universidad Complutense, Institute i+12, Centro de Investigación Biomédica en Red en Oncologia (CIBERONC), Madrid 28040, Spain
15
Radcliffe Department of Medicine, University of Oxford, Oxford OX3 9DU, UK
16
IKERBASQUE, Basque Foundation for Science, Bilbao 48013, Spain
*
Author to whom correspondence should be addressed.
Cancers 2019, 11(1), 70; https://doi.org/10.3390/cancers11010070
Submission received: 15 November 2018 / Revised: 2 January 2019 / Accepted: 4 January 2019 / Published: 10 January 2019
(This article belongs to the Special Issue Liquid Biopsy for Cancer)

Abstract

:
The circulating transcriptome is a valuable source of cancer biomarkers, which, with the exception of microRNAs (miRNAs), remains relatively unexplored. To elucidate which RNAs are present in plasma from melanoma patients and which could be used to distinguish cancer patients from healthy individuals, we used next generation sequencing (NGS), and validation was carried out by qPCR and/or ddPCR. We identified 442 different microRNAs in samples, eleven of which were differentially expressed (p < 0.05). Levels of miR-134-5p and miR-320a-3p were significantly down-regulated (p < 0.001) in melanoma samples (n = 96) compared to healthy controls (n = 28). Differentially expressed protein-encoding mRNA 5′-fragments were enriched for the angiopoietin, p21-activated kinase (PAK), and EIF2 pathways. Levels of ATM1, AMFR, SOS1, and CD109 gene fragments were up-regulated (p < 0.001) in melanoma samples (n = 144) compared to healthy controls (n = 41) (AUC = 0.825). Over 40% of mapped reads were YRNAs, a class of non-coding RNAs that to date has been little explored. Expression levels of RNY3P1, RNY4P1, and RNY4P25 were significantly higher in patients with stage 0 disease than either healthy controls or more advanced stage disease (p < 0.001). In conclusion, we have identified a number of novel RNA biomarkers, which, most importantly, we validated in multi-center retrospective and prospective cohorts, suggesting potential diagnostic use of these RNA species.

1. Introduction

Although malignant melanoma accounts for ~4% of skin cancer cases, it accounts for ~75% of all associated mortalities. In the US alone, it is estimated there were 87,000 new cases and nearly 10,000 deaths due to melanoma in 2017 [1]. Furthermore, the incidence of melanoma has been increasing at faster rate than any other cancer type, having doubled since 1973 [2]. The clinical case for early diagnosis of melanoma is compelling, as if detected early enough, (stage I) 5 year survival is >95%, whereas in advanced melanoma (stage IV) survival is just 10–20% [3].
Non-invasive diagnostics, or liquid biopsies, represent a major advance towards earlier diagnosis and disease monitoring of cancer patients, including those with melanoma. As a consequence, there has been a great deal of interest in recent years in the potential of circulating nucleic acids, and in particular circulating microRNAs (miRNAs) [4,5]. In melanoma, several studies have implemented circulating miRNA in metastasis and risk of recurrence [6,7]. However, outside of miRNAs there has been little research on other cell-free (cf) RNA species in the circulating transcriptome. Part of the reason for this paucity of knowledge is the presence of high levels of RNase activity in blood, which typically results in fragmentation of longer RNA species such as mRNA [8,9]. This makes detection of these molecules particularly challenging. The advent of next-generation sequencing (NGS) technology, however, presents new opportunities for the field, as sequences can be elucidated in a ‘bottom-up’ manner without the need of a priori probe sequence knowledge. We used next generation sequencing (NGS) to characterize and compare the circulating transcriptomes of plasma from melanoma patients with different stage disease, along with sex-/age-matched healthy individuals, in order to identify novel biomarkers for this cancer.
We identified not only circulating miRNAs with biomarker potential, but also mRNA gene fragments and non-coding YRNAs. YRNAs (Ro-associated Y) are poorly characterized, non-coding RNAs, which were initially identified in the blood of rheumatic autoimmune disease patients [10]. They are a family based around four highly conserved sequences (RNY1, RNY3, RNY3, RNY5) involved in Ro60 inhibition, DNA replication, and quality control of non-coding RNAs [11,12,13]. Our possible biomarkers were validated in an independent cohort of 327 plasma samples from melanoma patients, collected retrospectively and prospectively. This study provides evidence that the largely unexplored circulating transcriptome could provide a valuable source of liquid biopsy biomarkers for melanoma in particular, and cancer in general.

2. Results

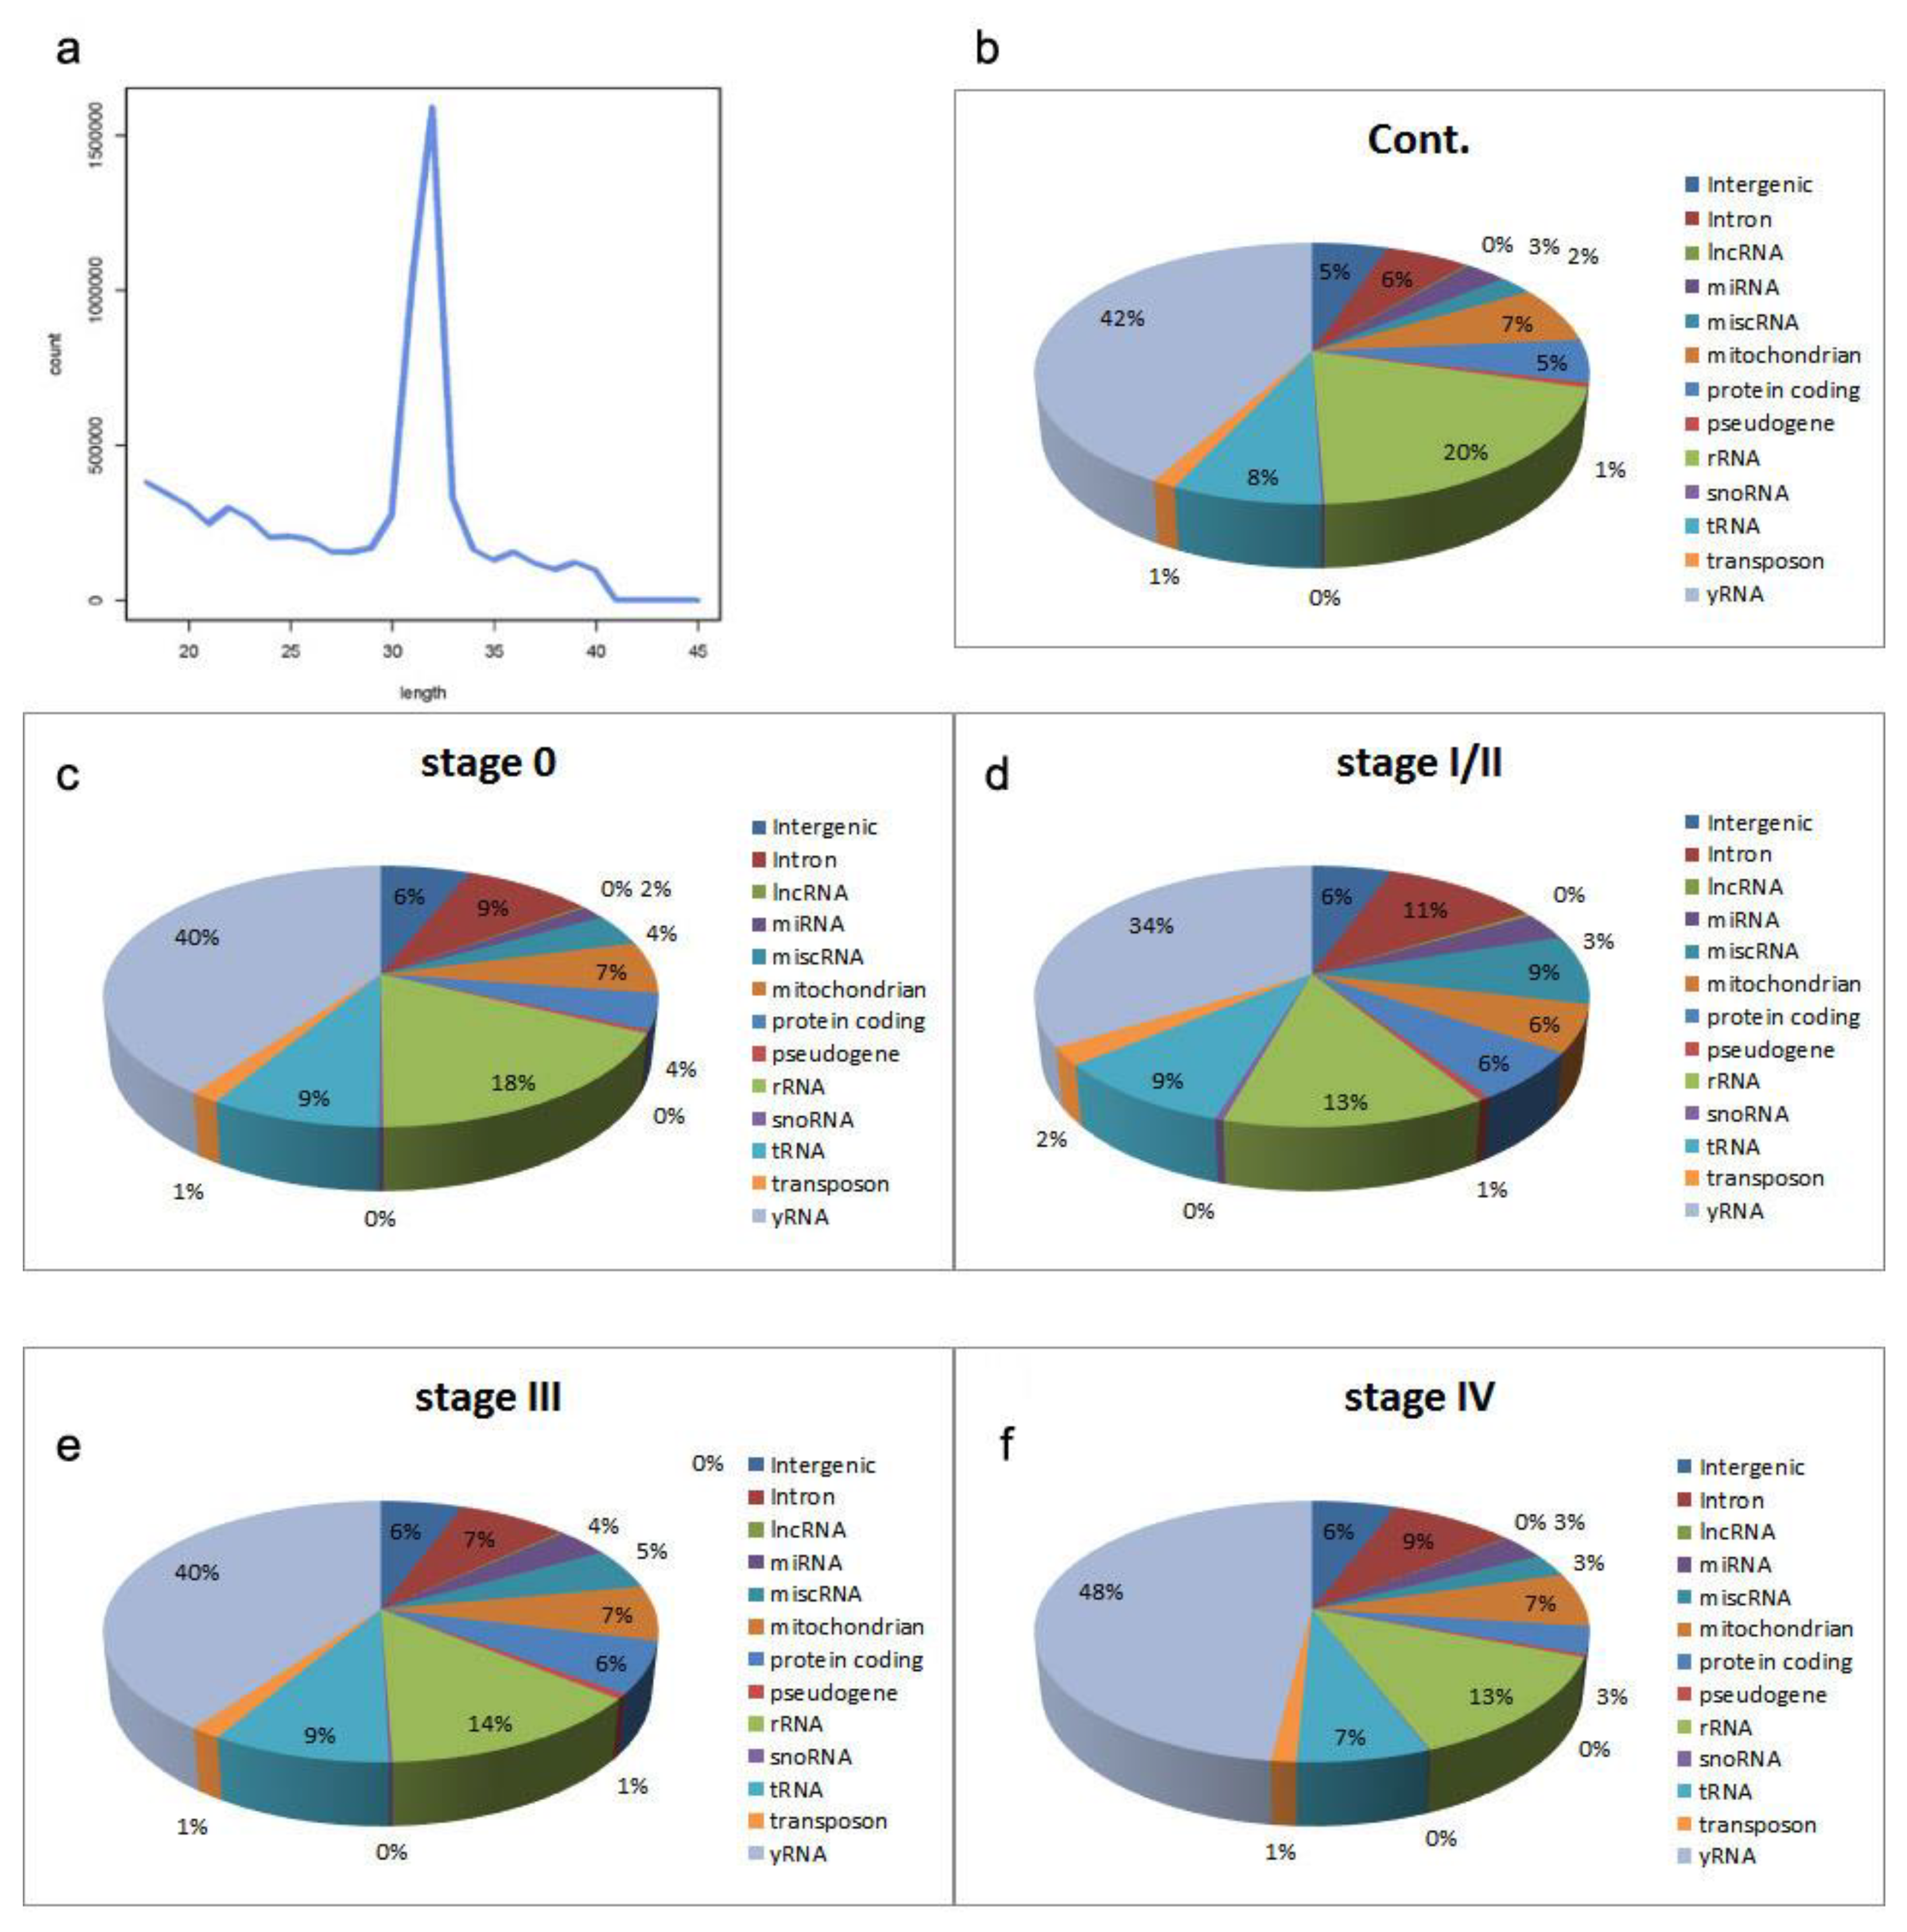
2.1. Sequencing the Circulating Transcriptome of Melanoma Patients

We optimized library construction by comparing several protocols, including different ribodepletion methodologies, using plasma from healthy controls in a pilot study, before settling on the protocol described in materials and methods [14]. It should be noted, however, that this protocol might result in some ligation-based bias [15]. Using this protocol, we sequenced cfRNA derived from plasma of melanoma patients, along with age-/sex-matched controls (Table 1).
Due to the low quantity of cfRNA in plasma, we decided to pool plasma samples according to clinical stage, as depicted in Table 1. For each pooled sample, 40–50 million reads were obtained, with an average Phred score of 37.9 (Supplementary Table S1). Between 50–55% of reads were mapped to the human genome (hg19), and approximately half of these sequences were considered small RNA (sRNA), representing sequences between 18–43 nt (Supplementary Table S1; Figure 1a). By far the largest category by frequency of reads was YRNAs, accounting for an average of 40.6% of reads (range 34–48%; Figure 1). Indeed, this category accounted for >95% of reads that composed the major peak at 32 nt seen in the size profiles of samples (typical example shown in Figure 1a).

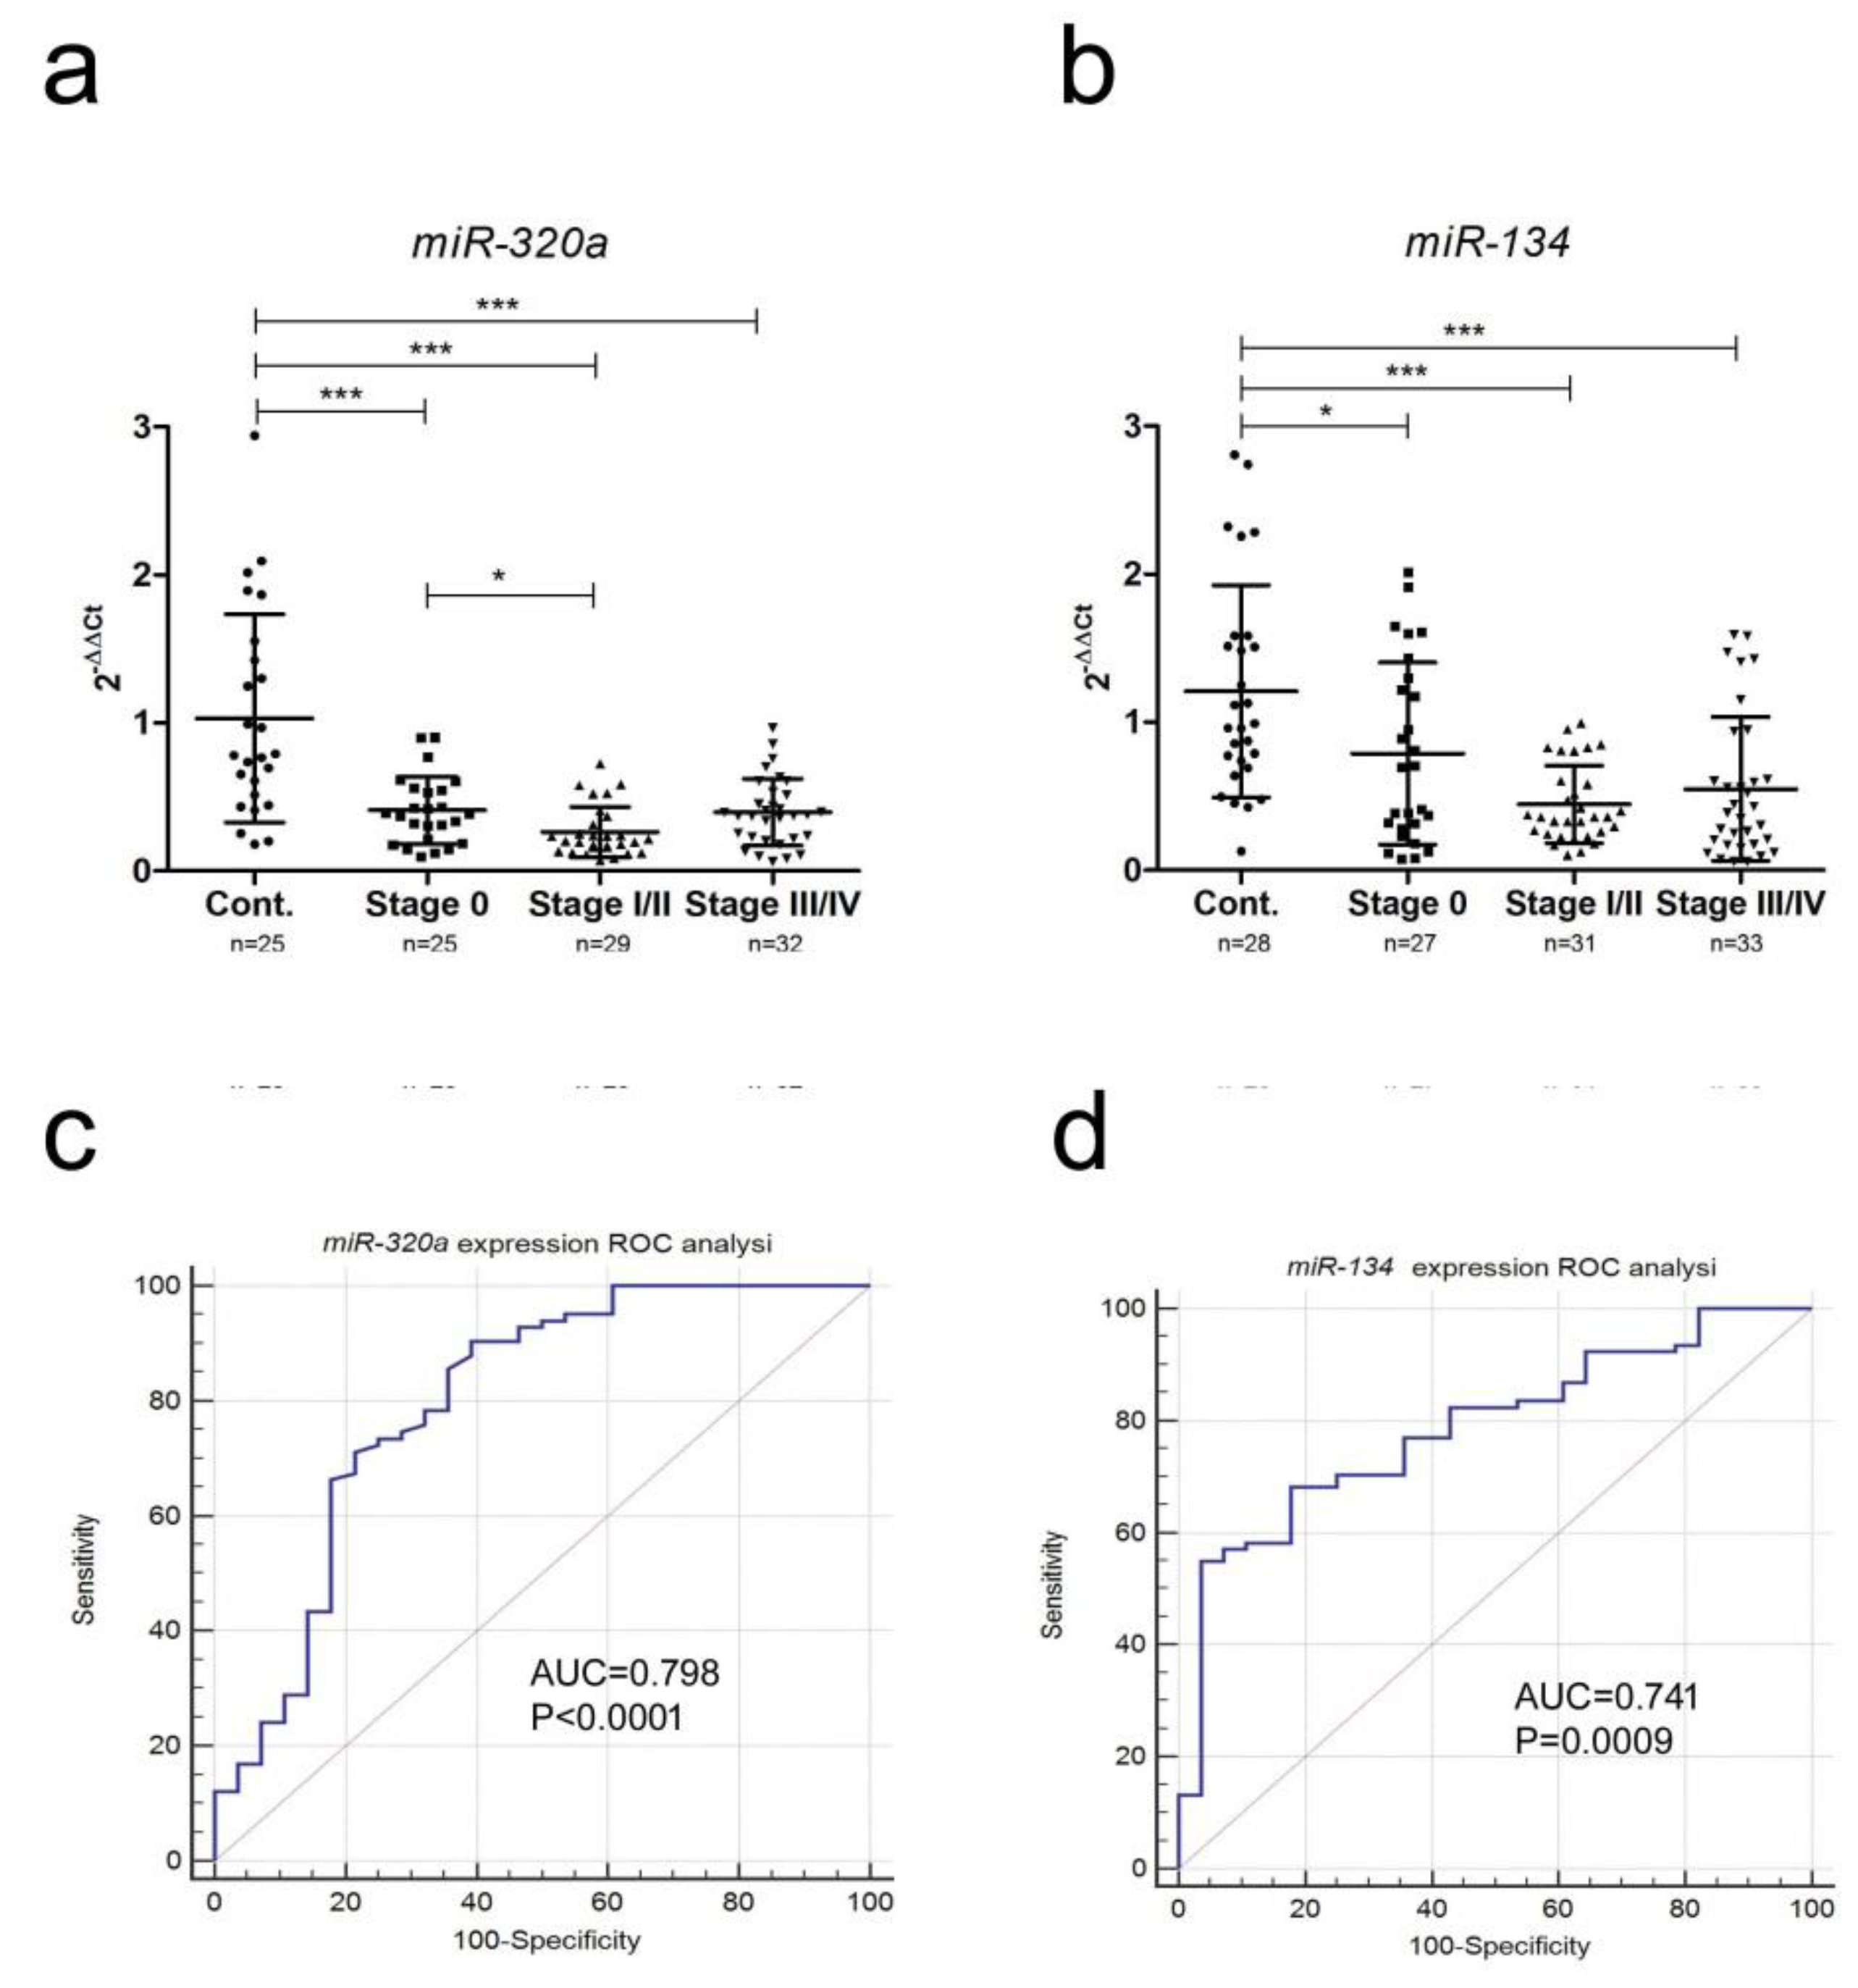
2.2. miRNA Expression

We detected 442 different human miRNA sequences in the samples, which accounted for between 1.38 × 10⁵ and 3.14 × 10⁵ reads per sample. The most abundant miRNAs were members of the let-7 family, which accounted for >70% of mapped miRNAs reads, followed by miR-423 and miR-320a-3p. Eleven miRNAs were identified by ANOVA as being differentially expressed between the different disease stages and healthy controls (p < 0.05, >50 reads per sample; Table 2). We measured levels of the four most differentially expressed miRNAs (miR-134-5p and miR-320a-3p, miR-21-5p and miR-92b-3p) by qRT-PCR plasma samples in 28 healthy controls and 96 melanoma patients (Table 1). We were unable to detect miR-21-5p and miR-92b-3p [16].
Consistent with the NGS data, we found that miR-134-5p and miR-320a-3p were significantly down-regulated in patients compared to controls (Figure 2a,b). Levels of these miRNAs were lower in stage 0 patients than in healthy controls, and even lower in stage I/II patients (p < 0.05). Receiver operating characteristic (ROC) analysis gave area under curve (AUC) values of 0.798 (miR-320a-3p) and 0.788 (miR-134-5p), with a higher sensitivity (90%) for miR-320a-3p and a higher specificity for miR-134-5p (96%) (Figure 2c,d and Table 3).

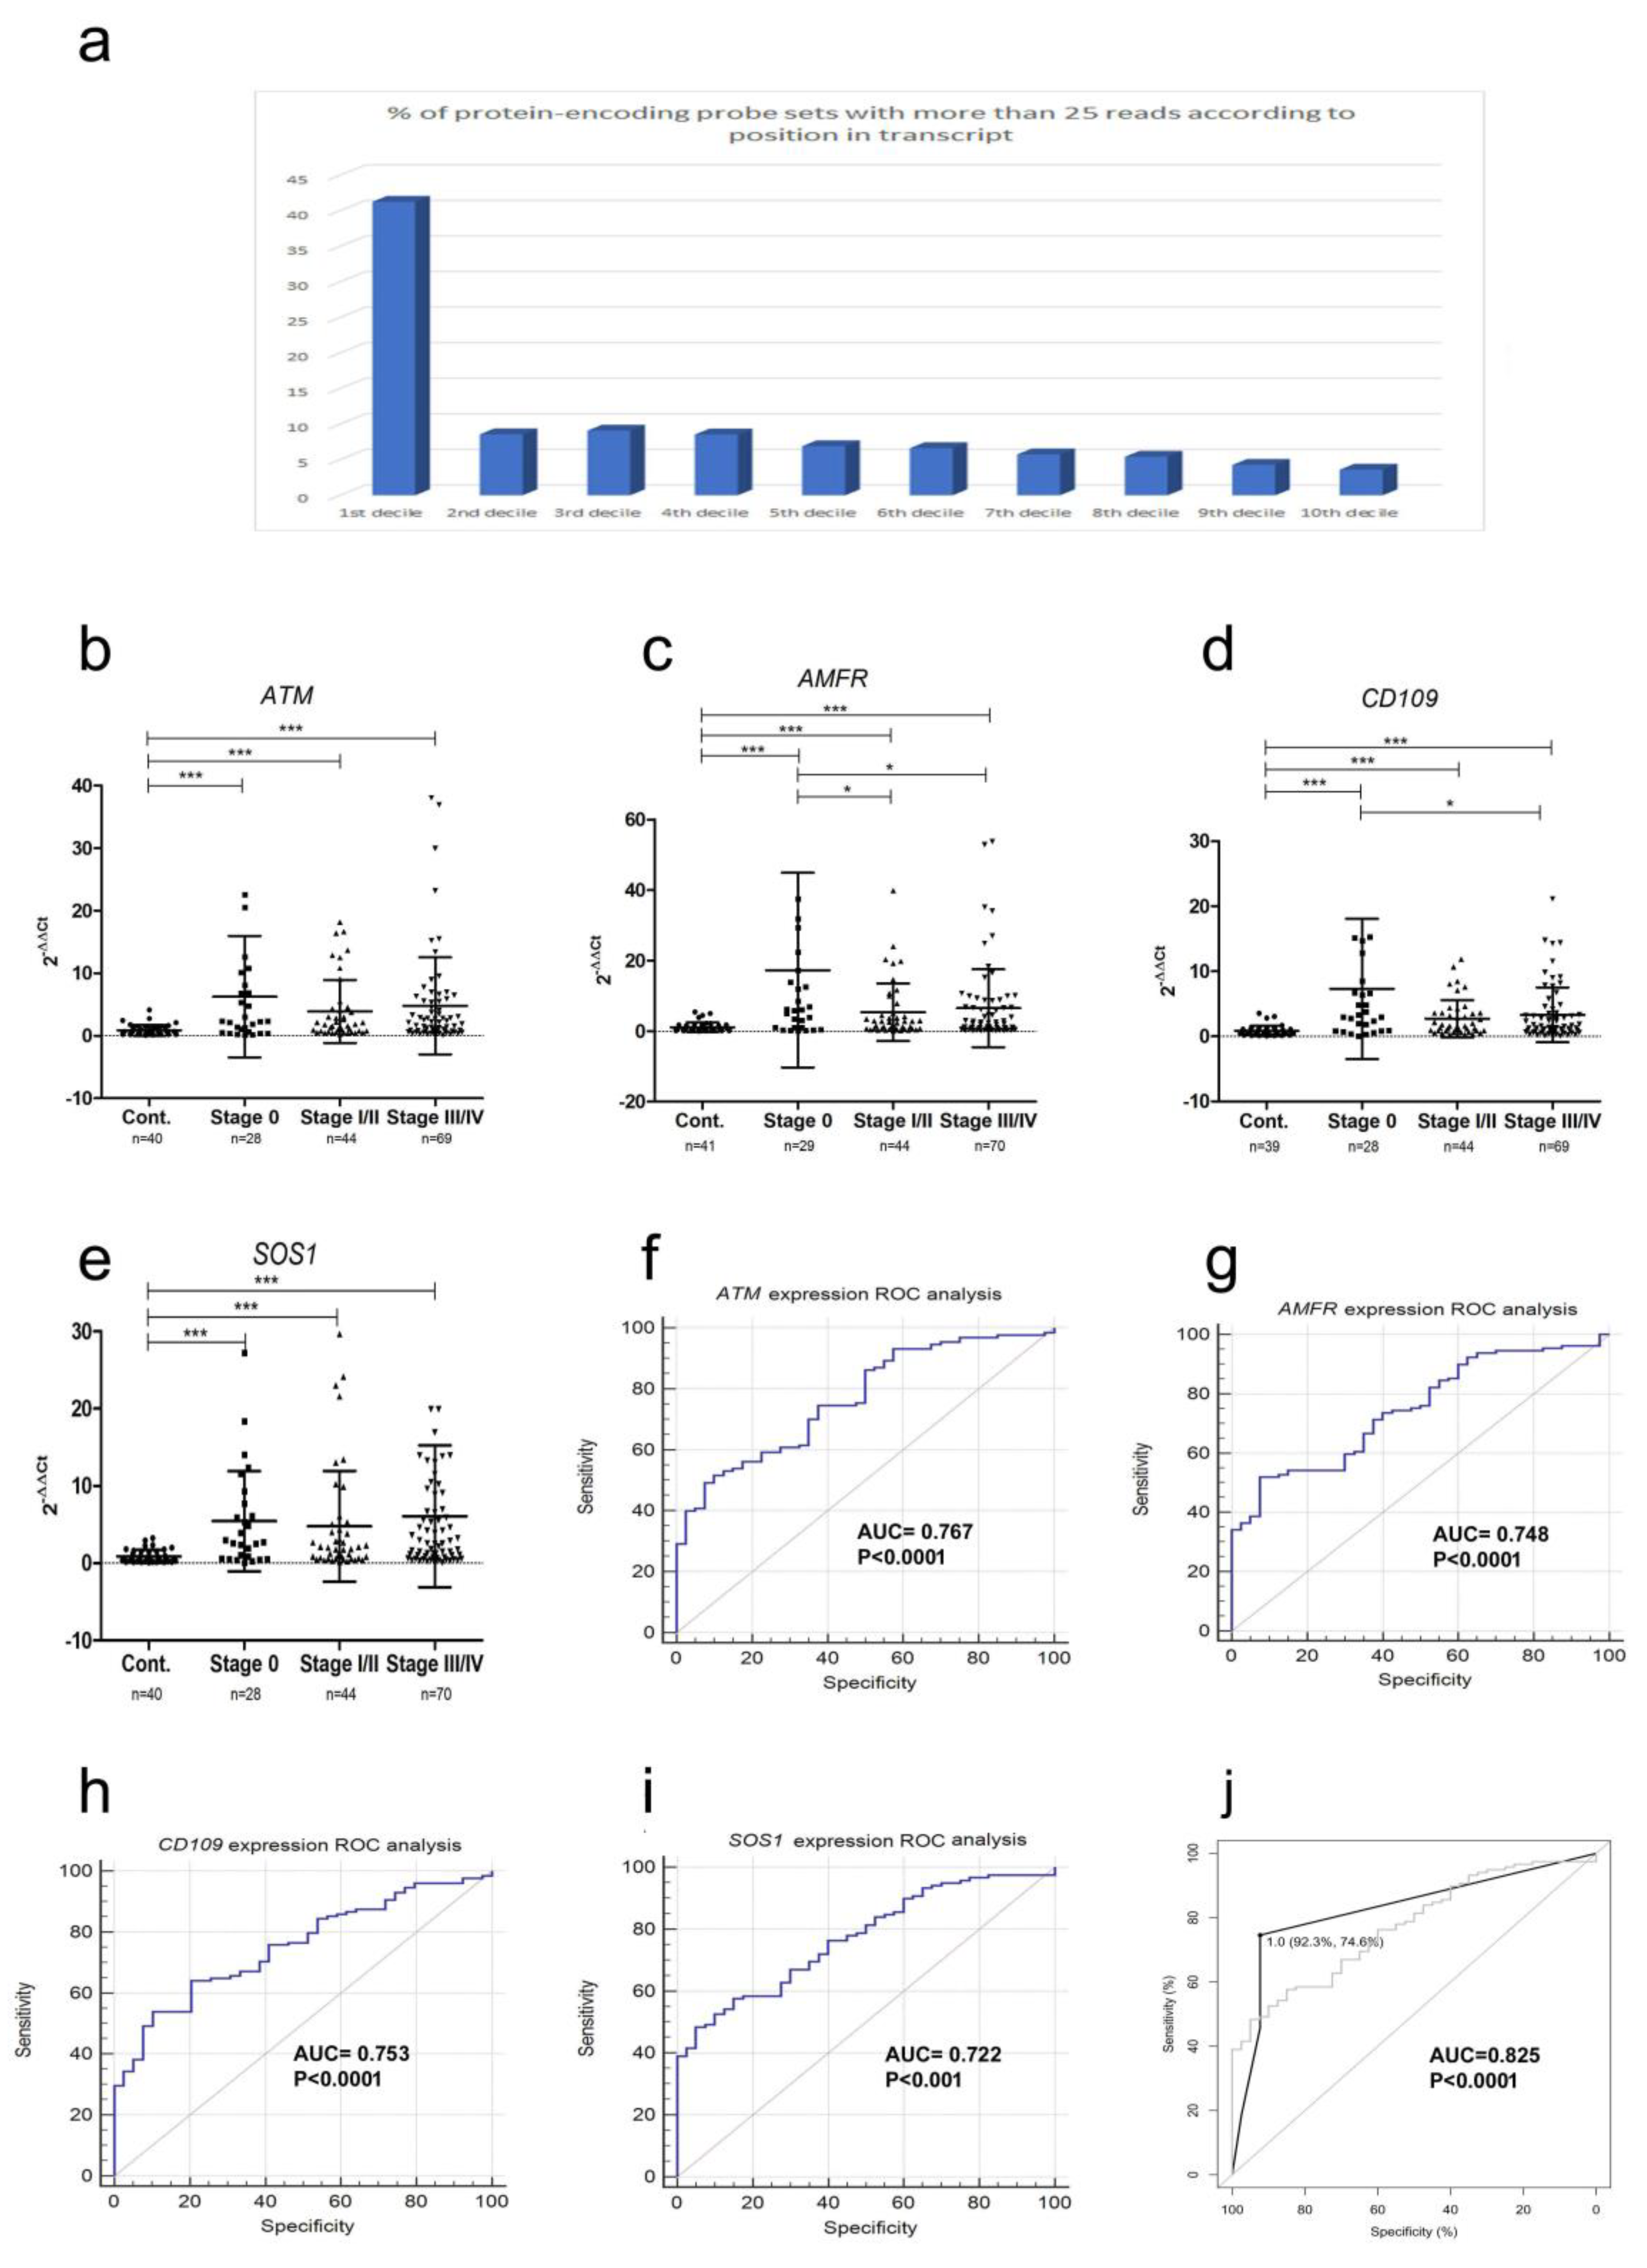
2.3. mRNA Fragment Expression

Because mRNA is degraded by RNase activity in the blood into fragments with an average size of 200 bases [8], rather than mapping reads to whole genes or exons, we mapped them to short annotated probe sets (<500 bases). There were 3672 different probe sets (median length of 244 nt), with greater than 25 reads per probe set mapping to 13,641 different transcripts. For each probe set we analyzed their relative position within the respective transcripts as a percentage of the entire transcript length. By far the largest proportion (5350/13641 (39%)) of probe sets mapped to the first decile (10%) (i.e., 5′-end) of the transcript, compared to an average of 6% for the other nine deciles of the transcript length (Figure 3a).
Seventy of the probe sets were identified as being differentially expressed between samples (p < 0.05; Table A1). We designed custom Taqman probes to detect fragments from the five most differentially expressed probe sets (i.e., corresponding to ATM, ARHGAP, AMFR, CD109, and SOS1 genes) (Supplementary Table S2; Figure S1). We were unable to design a specific probe for the ARHGAP probe set due to a high level of repetitive sequences. None of the mRNAs validated are predicted targets of miRNAs studied (i.e., miR-134-5p and miR-320a) using the predictive algorithms TargetScan and miRDB [17]. The four probe sets were measured by qRT-PCR in 47 control and 173 melanoma patient samples (Table 1).
Levels of ATM, AMFR, CD109, and SOS1 were all significantly higher (p < 0.001) in plasma samples from either stage 0, stage I/II, or stage III/IV melanoma patients than in healthy controls (Figure 3b–e, respectively), consistent with the NGS data (Table A1). Surprisingly, levels of AMFR and CD109 were higher in plasma from stage 0 patients than samples with more advanced disease. We carried out ROC analysis to determine the diagnostic ability of the mRNA fragments (Table 3; Figure 3f–i), and to discriminate between different disease stages (Table 3; Supplementary Figure S2a–d). We looked at combinations of these biomarkers using the PanelomiX ROC comparison algorithm [18]. A combination of ATM, SOS1, and AMFR with cut-off values of 2.13, 2.96, and 2.26 respectively, gave the best diagnostic accuracy (AUC = 0.825) (Table 3, Figure 3j).

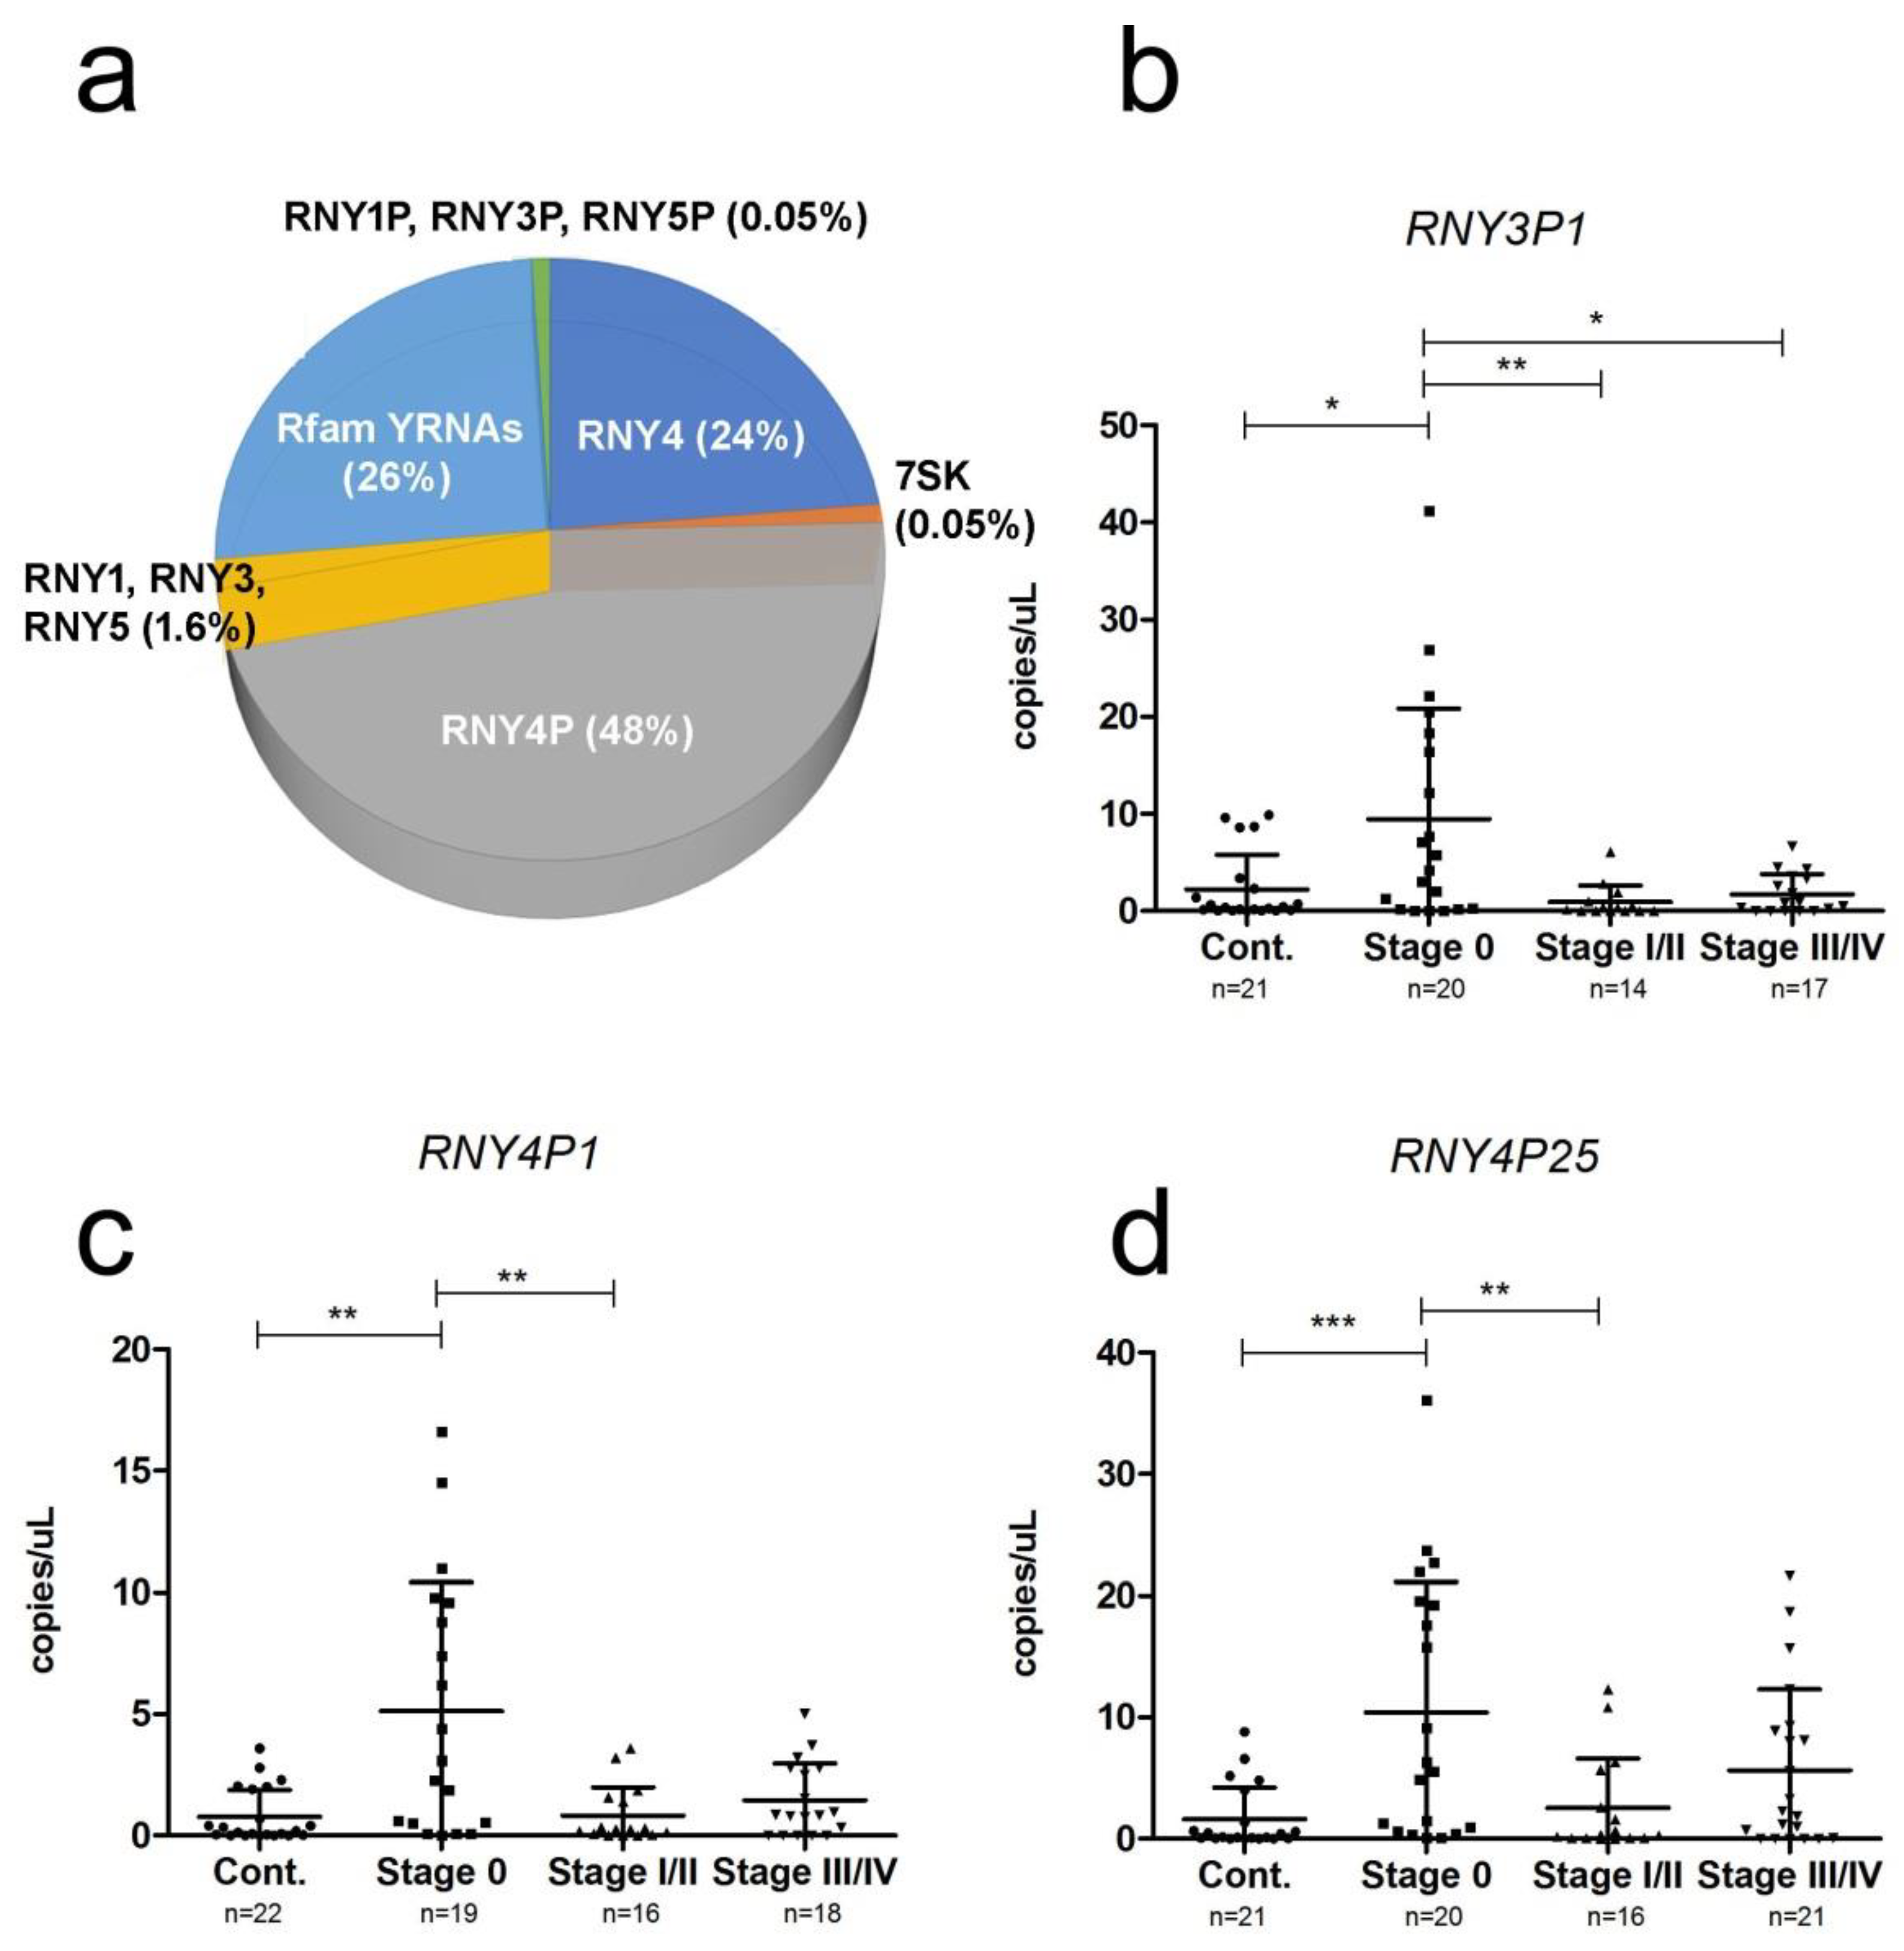
2.4. YRNA Expression

As nearly half of all mapped sRNA reads were identified as YRNA sequences (Figure 1), we examined this class of non-coding RNAs further. There were 322 different YRNA and YRNA-associated sequences identified in our samples, consisting of three YRNA sequences (RNY1, RNY3, and RNY4) representing an average of 26.1% of reads, 30 YRNA pseudogenes representing an average of 48.4% of reads, 69 7SK sequences (average 0.05% of reads), and 194 Rfam predicted YRNA sequences representing an average of 25.5% of reads (Supplementary Table S3). The vast majority of reads were represented by RNY4 and RNY4P sequences, accounting for >98% of their respective YRNA class (Figure 4a).
We compared the expression of YRNAs between low-stage disease (i.e., stage 0 and I/II) and high-stage disease (i.e., stage III and IV), and identified five differentially expressed YRNA fragments (p < 0.05; Table 4). We designed custom Taqman probes to measure three of these YRNAs (RNY3P1, RNY4P1, and RNY4P25), selected on the basis of fold-change and read count. We measured levels of the YRNAs in a validation cohort of 80 samples (22 controls and 58 melanoma patients, Table 1). Levels of all three YRNAs were significantly higher in stage 0 samples than control samples or stage I/II samples (Figure 4b–d).

3. Discussion

The presence and relative stability of cfRNA in biological fluids has led to a great deal of interest in their use as ‘liquid biopsies’ for disease, in particular for cancer. However, with the exception of miRNAs, the circulating transcriptome remains largely unexplored. While NGS offers researchers the ability to elucidate the circulating transcriptome in its entirety, and therefore to identify novel biomarkers of disease, the application of RNAseq to biofluids such as plasma poses many challenges, not least the low quantity and quality of RNA present in these samples. As a consequence, studies to date have focused on the technical optimization of these techniques [19,20,21]. However, very few studies to date have sought to assess the potential usefulness of their findings through validation in independent cohorts.
In order to fully explore the complexity and biomarker potential of the melanoma circulating transcriptome, we pooled samples to maximize the starting quantity of cfRNA. As a result, we were able to obtain 40–50 million reads per pooled sample, an order of magnitude higher than comparable studies [20,22]. In contrast to exosomal cfRNA [22], we found that miRNAs only represented a minor component (<3%) of the whole plasma circulating transcriptome, levels similar to other plasma NGS studies [19,20,21]. We identified 442 different miRNAs in our samples, somewhat higher than that reported in comparable studies [23,24], probably as a result of the pooled design and the higher quantity of RNA that we used. Consistent with other studies, we found that let-7b, miR-423, and miR-320a-3p were the most highly expressed miRNAs in our plasma samples [20]. We identified eleven miRNAs that were differentially expressed between healthy controls and the different clinical stages of melanoma (Table 2). This included miR-21, which has previously been shown to be upregulated in melanoma plasma samples [25], and miR-92b and miR-628, both of which are more highly expressed in plasma from monosomy 3 uveal melanoma patients [26].
Based on our sequencing results, we measured the expression of miR-320a-3p and miR-134-5p, the two miRNAs most differentially expressed between samples, in a validation cohort of 96 melanoma patients and 28 controls. Both miRNAs were significantly down-regulated (p < 0.0001) in plasma from all stages of melanoma patients when compared to samples from healthy controls. MiR-320a has also been found to be down-regulated in melanoma tumor cells when compared to heathy skin samples [27]. Furthermore, this miRNA was shown to function as an inhibitor of cell proliferation. The down-regulation of miR-320a has been observed in the blood of several cancers including colorectal cancer [28], gastric cancer [29], and retinoblastoma [30]. Moreover, miR-320a is up-regulated in melanoma cells after treatment with bevacizumab or rapamycin + bevacizumab [31]. Furthermore, miR-134 has been characterized as a tumor suppressor, acting to regulate proliferation, apoptosis, and invasion and migration in a wide range of cancer types, including melanoma [32,33]. ROC analysis of miRNA expression gave AUC values of 0.798 and 0.788 respectively. The miR-320a miRNA had a sensitivity of 90%, whereas miR-134 had a specificity of 96%, suggesting these two miRNAs in combination could be useful biomarkers for melanoma.
Even though circulating extracellular mRNA was first detected in 1999 (in melanoma) [34], as the vast majority of circulating mRNA is degraded by blood RNase activity [35], this potential source of biomarkers has largely been overlooked, even though mRNA fragments can represent up to 75% of total cfRNA [19]. In our study, just over 5% of mapped reads corresponded to protein-encoding mRNA fragments. We detected 3672 probes (<500 bases in length) that had at least 25 mapped reads in our samples. Nearly 40% of the probes mRNA fragments mapped to the 5´-terminus (i.e., first 10%) of their respective gene transcripts, probably reflecting the 3´to 5´ cleavage activity of RNase A, the major RNase species in blood [26]. We did not notice a corresponding shift in the length profile between healthy and melanoma patient samples [36].
Pathway analysis of the genes corresponding to differentially-expressed mRNA fragments showed significant enrichment in the angiopoietin, p21-activated kinase (PAK) and Eukaryotic Initiation Factor 2 (EIF2) pathways. It has been previously reported that circulating level of Angiopoietin-2 (Ang-2) protein in melanoma patient sera closely correlates with disease progression [37]. Similarly, amplification of the PAK (p21-activated kinase) pathway is characteristic of BRAF-wild type melanoma [38], while in BRAF-mutant melanoma it is responsible for resistance to MAPK-inhibitor treatment [39]. Interestingly, both SOS1 and ATM1, which were the third and fourth most differentially expressed probe sets in our analysis, form part of the angiopoietin, PAK, and EIF2 pathways. We measured levels of SOS1, ATM1, CD109, and AMFR mRNA fragments in plasma samples from 173 melanoma patients and 47 healthy controls. With the exception of CD109, these mRNA fragments mapped to regions corresponding to the 5′-terminus of the reference gene transcript and included the initiation codon. Consistent with the NGS data (Table A1), levels of all these mRNA fragments were up-regulated in melanoma patient samples compared to samples from healthy controls. Particularly intriguing was the up-regulation of CD109 and AMFR in stage 0 samples compared to samples from more advanced stage melanoma, suggesting that these mRNA fragments could be used for early diagnosis of melanoma, although we do not have data on how many of these patients went on to develop advanced disease. (Figure 3b–e). CD109 has been identified as an important regulator of the Epithelial–mesenchymal transition (EMT pathway), and has also been found to be down-regulated in more advanced stage hepatocellular carcinoma [40]. The product of the AMFR gene, gp78, also regulates EMT, and increasing levels of AMFR are associated with metastatic melanoma [41,42]. Intriguingly, CD109 is a predicted target of miR-134 by the Targetscan algorithm; we are currently carrying out experiments to confirm this. ATM1 is a serine/threonine kinase induced by DNA damage and associated with risk in many cancer types [43]. SOS1 is a guanine nucleotide exchange factor for RAS proteins frequently mutated in melanoma [44]. Interestingly, all four of these gene fragments were more highly expressed not only in advanced stage disease, but also stage 0 disease; indeed, levels of CD109 and AMFR were higher in plasma from stage 0 disease than more advanced stage disease, suggesting that these biomarkers maybe non-tumoral in origin. Consistent with this hypothesis, the release of CD109 by bone marrow mesenchymal stem cells has recently been shown to attenuate EMT in skin squamous cell carcinoma [45], and AMFR plays an important role in regulation of the anti-cancer immune Stimulator of interferon genes (STING) pathway [46].
To test the potential diagnostic ability of these biomarkers, we carried out ROC analysis, however the results from individual mRNA fragments were poor (AUC range 0.722 (SOS1) to 0.767 (ATM1). In contrast, a combination of ATM1, SOS1, and AMFR resulted in an AUC value of 0.825 with a sensitivity of 75% and specificity of 92%. Although these findings need to be confirmed independently, this combination compares very favorably with existing sera markers such as LDH and S100B with reported sensitivities/specificities of 41.6/84.2% and 36.3/96.5%, respectively [47].
By far the largest class of circulating cfRNA that we identified in the samples corresponded to YRNA sequences, accounting for close to 50% of sRNA mapped reads. Remarkably, despite the prevalence of cfYRNAs in the blood, there is very little known about this class of ncRNA. YRNAs are short 80–110 nt ncRNAs, first identified in the early 1980s as an RNA component of the soluble Ro60 ribonucleoprotein particle found in the blood of patients with autoimmune diseases [48]. The function of YRNAs is still poorly understood; they appear to be essential for DNA replication [49] and are up-regulated in cancers [50], presumably as a result of their association with apoptosis [51]. The first description of circulating cfYRNAs came in 2013 from Dhahbi et al., who observed that 33% of mapped reads from sera of healthy individuals were YRNA sequences [52]. The same group later reported that YRNA accounts for 38% of cfRNA in sera from breast cancer patients [53], and subsequently, in the sera of head and neck squamous cell carcinoma patients [54]. More recently, a study of 183 plasma samples from healthy individuals found that YRNAs accounted for 63% of cfRNA [55]. As far as we are aware, apart from a recent study that measured YRNAs in the sera of 30 renal carcinoma patients [56], this the first study to look at the biomarker potential of YRNAs in cancer patients. Interestingly, we found that levels of YRNAs were significantly higher in samples from patients with stage 0 disease, maybe pointing to increased levels of tumor-associated apoptosis [51] even despite the small tumor sizes compared to more advanced disease stages.
In summary, we have elucidated the circulating transcriptome of plasma samples from melanoma patients and found a number of novel RNA biomarker species that we validated independently using qRT-PCR and ddRT-PCR in combined retrospective and prospective cohorts, detected from only 1mL of serum. These findings have potential clinical utility as new tools for early detection of melanoma, particularly as our results suggest that these biomarkers can detect disease much earlier than current diagnostic techniques. Furthermore, as blood-based biomarkers, there is potential for screening of non-symptomatic individuals. Whilst it is clear that much further validation is required, this study provides strong evidence that the circulating transcriptome holds much promise as a source of liquid biopsies for melanoma that surely merits further exploration.

4. Materials and Methods

4.1. Patient Cohorts

Patient plasma samples were collected both retrospectively (n = 119) and prospectively (n = 289). Retrospective samples were obtained from the John Radcliffe Hospital, Oxford (Oxford cohort; n = 30), and the AVAST-M multi-center phase 3 clinical trial (AVAST-M cohort; n = 89) [57]. Samples collected prospectively came either from the Hospital 12 de Octubre in Madrid (Madrid cohort; n = 67) or the Onkologikoa Cancer Hospital and Donostia University Hospital of San Sebastián (San Sebastián cohort; n = 102): a total of 327 melanoma patients (Table 5). The clinical details of the individual patients included in these cohorts are given in Supplementary Tables S4–S7. Samples were collected at the time of diagnosis and prior to any treatment. Unfortunately, no information was available regarding the sequence of CDKN2A. Plasma samples from age/sex matched healthy controls (n = 99) were obtained from the Basque Biobank for Research O+EHUN. Plasma preparation was carried out within 1 h of phlebotomy, with blood collected in EDTA-coated tubes followed by centrifugation for 1000× g for 15 min at 4 °C.
With the exception of the 37 prospectively collected samples used for NGS (Table 1), only a limited volume (1–2 mL) of plasma was available for validation studies. Therefore, we divided samples into three separate validation cohorts; a miRNA cohort of 96 melanoma patients and 28 controls; an mRNA cohort of 173 melanoma patients and 47 controls; and a YRNA cohort of 58 melanoma patients and 22 controls. The clinical details of the patients used are summarized in Table 1, and details of individual cohorts are provided in Table 4 and Supplementary Tables S4–S7. Written informed consent was obtained from patients for the inclusion of their samples in this study, and samples were collected in accordance with the Declaration of Helsinki and approved by local ethics committees (CEIC-Euskadi approval number PI2015024).
For the plasma samples used for NGS (5–8 mL), cfRNA was purified using the plasma RNA purification kit from Norgen Biotek (Ontario, Canada), and for validation studies (1 mL samples) the miRCURY™ RNA Isolation Kit Biofluids from Exiqon (Vedbaek, Denmark) was used.

4.2. Library Construction and Next-Generation Sequencing

The samples used for NGS were pooled according to disease stage, as shown in Table 1. Ribosomal RNA (rRNA) was removed from total cfRNA using the Ribozero Magnetic Human/Mouse/Rat kit (Epicentre (Maidon, WI, USA), #MRZH116), according to the low input protocol recommended by the manufacturer. Phosphatase and T4 polynucleotide kinase (PNK) treatments were carried out on the ribo-depleted RNA, and Illumina small RNA adapters ligated. Libraries were amplified using 15 cycles of PCR of barcoded primers [58]. Sequencing was performed on an Illumina HiSeq 2500 as 50 PE in rapid mode.

4.3. Bioinformatic Analysis

Sequencing reads were quality filtered using the fastx_artifacts_filter tool, and ligation adapters were removed using the AdRec.jar program (seqBuster suite of programs (omicX (Le-Petit-Quevilly, Le Petit-Quevilly, France))). Reads were mapped to the GRCh37 build of the human genome using the Bowtie 2.0 algorithm. A custom annotated probe set was built by combining probes from GENCODE version 8 [59], supplemented with rRNA and repeat annotations from RepeatMasker GRCh37, and snoRNA annotations from the UCSC table browser [60]. Expression of miRNA was calculated using the miraligner algorithm from the seqBuster suite, and YRNA expression was calculated using the HTseq-count algorithm. Differential expression analysis was carried out using the DESeq bioconductor package [61].

4.4. qRT-PCR (mRNA and miRNA) and ddPCR(yRNAs)

mRNA was reverse transcribed (RT) using random primers with the High Capacity cDNA Reverse Transcription Kit from Applied Biosystems following the manufacturers’ protocol with DNase treatment. Due to the difficulty in quantifying cfRNA reliably, we used fixed volumes in reactions [4,62]. For gene fragments, we designed custom Taqman probes using the Custom TaqMan® Assay Design Tool from Applied Biosystems (Foster City, CA, USA), using the sequences corresponding to the respective probe sets (Supplementary Table S2 and Figure S1). The reference gene used for mRNA analysis was 18S rRNA, as previously described [63].
For miRNA detection, we used the Megaplex RT Primers Human Pool A v2.1 for RT, and specific Taqman probes as described in the text. As the problems of defining suitable reference genes for miRNA detection in plasma are well documented [4], we measured levels of three previously described reference miRNAs (miR-24, miR-16 and miR-191) [64,65], in a cohort of 63 samples (control/stage 0 (n = 22), stage I/II (n = 26), stage III/IV (n = 15)). Using the NormFinder algorithm we identified miR-24 and miR-191 as the most stable combination of reference genes in our samples (Supplementary Figure S3).
Custom primers and Taqman probes for Y3P1, Y4P1 and Y4P25 were designed using the Custom Taqman® Small RNA Assay Design Tool from Applied Biosystems. We performed ddPCR using QX200TM Droplet DigitalTM PCR system (Bio Rad, Hercules CA, USA), following the manufacturers’ protocol. Data analysis was performed by QuantaSoft analysis software from Bio-Rad. Expression levels were compared using the Kruskal–Wallis multiple comparison test, and the Mann–Whitney independent t-test to carry out a pairwise comparison between individual groups (Graphpad Prism v. 5.0, La Jolla, CA, USA). ROC analysis and comparisons were carried out using the method of DeLong et al., as implemented in MedCalc v. 14.8 software [66].

5. Conclusions

We have carried out a comprehensive, non-biased elucidation of the circulating transcriptome of melanoma patients and identified a number of promising candidate biomarker RNA species, not only miRNAs. These candidates were validated in independent cohorts by ourselves, however it is clear that further studies should be carried out by independent research groups in order to strengthen our findings and facilitate the translation of this knowledge into the clinic.
What is obvious is that many virtually unexplored classes of the circulating transcriptome are yet to be fully assessed for their ability to serve as useful cancer biomarkers. As a consequence, while the discovery of circulating miRNAs represented an important event in the history of the liquid biopsy field, it is clear that there is much that we have still to explore.

Supplementary Materials

The following are available online at https://www.mdpi.com/2072-6694/11/1/70/s1, Figure S1: Mapping positions (GRCh37) of selected gene fragment probe sets used to design Taqman probes. Figure S2: Variation of Ct values in levels of miRNA reference genes in selected cohort measured by qRT-PCR. Figure S3: ROC analysis of mRNA expression in different melanoma stage cohorts. Table S1: Summary of NGS results from pooled RNA samples. Table S2: Characteristics of selected differentially protein-encoding gene fragment probe sets. Table S3: YRNA reads from NGS. Table S4: Clinical details of patients used for NGS cohort. Table S5: Clinical details of patients used in mRNA validation cohort. Table S6: Clinical details of patients used in miRNA validation cohort. Table S7: Clinical details of patients used in yRNA validation cohort.

Author Contributions

conceptualization, C.S.; D.T. and C.H.L.; methodology, C.S., M.S., I.G., M.T. and C.H.L; validation, C.S., M.A., L.I.H., L.M., M.S.; formal analysis, M.R.F., M.F.-M., P.P., X.E., I.G., M.T. and C.H.L; resources, D.T., K.M., A.T., A.J., P.L.O.-R., M.R.M.; data curation, P.L.O.-R., M.T., M.R.M.; writing—original draft preparation, C.S. and C.H.L.; writing—review and editing, C.S. and C.H.L.

Funding

C.H.L. and his research is supported by grants from the IKERBASQUE foundation for science, the Starmer-Smith memorial fund, Ministerio de Economía y Competitividad (MINECO) of the Spanish Central Government and FEDER funds (PI12/00663, PIE13/00048, DTS14/00109, PI15/00275), Departamento de Desarrollo Económico y Competitividad y Departamento de Sanidad of the Basque government, Asociación Española Contra el Cancer (AECC), and the Diputación Foral de Guipuzcoa (DFG). M.R.F. was supported by EMBO Long-Term fellowship ALTF 225–2011. M.F.-M also acknowledges support from MINECO (PI16/00159), DFG and AECC.

Acknowledgments

We thank the Basque Biobank for Research O+EHUN for the plasma samples.

Conflicts of Interest

The authors declare no conflict of interest.

Appendix A

Table A1. Differentially expressed protein-encoding probe sets (p < 0.05). Gene names and coordinates are given. Counts were normalized per million reads. mRNAs validated are depicted in bold.
GeneChromosome PositionLengthp-ValueCont.St. 0St. I/IISt. IIISt. IV
CD1096:74446106–744462311250.0010339102126207318
ARHGAP4:148744047–148744108610.001845911108
SOS12:39237725–392378441190.001962316130121139
ATM11:108099905–1081000501450.0031652087105
AMFR16:56396751–563968551040.0032911325959121
KCNIP32:95976103–959765444410.00362114221628
POLE12:133248801–1332489081070.00456036111272
KLHL77:23213634–232140404060.004790610840
ZMYM41:35824626–358250474210.005475423252722
GTDC12:144966170–1449663712110.006325815162114
RFWD21:176132951–176133027760.006512711101312
ARHGAP104:148778704–1487790393350.006723110131113
RHBDD12:227778924–2277793534290.007747163393328
HNRNPM19:8527413–8527473600.007984215201719
DYNC2H111:102988360–1029885922320.00835015171560
ITIH510:7613668–76140613930.0088501112632
TNFA1P214:103592664–1035930293650.009742928847660
SLC40A12:190430080–1904303252450.009962120312834
SETDB11:150902443–1509029324890.0106120231760
IGF2BP37: 23385559–233857802210.01182727111415
DENND38:142152302–1421537072050.01180133243
GAK4:866054–8664614070.014011161040
ARHGEF1211: 120278447–120282546990.0157278523944
HINT36: 126298790–1263013874970.0157766681911
HTR1E6: 87647124–876475414170.015841951067592
UXS12:106780123–106780166430.0171605562
MPP217: 41983448–41983519710.0173119222918
NAIP5: 70308275–703087454700.01830104152
SNCA4:90757894–907583794850.01857344494941
TRAPPC98:140922366–1409225441780.01852868765359
PISD22:32034352–320344881360.0189225533600413557
SERPINB16: 2836090–28362572330.01932914101413
GRN17:42429383–424296161670.0193072522
EIF4G31: 21231376–21231464880.01954945383333
ILK11: 6624961–66254564950.01962849465947
C14ORF3814:60031765–600319932400.01972671197
PSAP10:73578788–735790282280.0197113274413
TMEM10417: 72835466–728359184520.02124635111916
TAOK117:27849298–278495372390.021742912611
SIAE11: 124506788–1245070983100.02226226127
CDK5RAP29: 123165584–1231659403560.0229434795831203181149164
TPT113: 45911208–459116144060.02395531383430
SSH311:67070919–670711622430.02423673714640
SSB2:170667368–1706675541860.0247082871
ZNF43019:21216892–21216990980.025481117128
HBA216:222846–2232624940.0266266141135177134
ZFPM28:106456508–1064566091010.03047041434949
RBM53:50145665–50145738730.03086019162816
ITGB110:33218750–332189722220.03128037294532
ZCCHC171: 31821676–318218211450.03291517202326
PRKG24: 82136085–821362181330.03324049202926
IFI61: 27992572–279929864140.0341004612
MX221: 42774561–427768004580.0363003111
PSMD23:184020467–1840206111440.03660212281
HERC64:89363186–893640634770.0376035441
PPBP4:74853673–748539142410.0387685259301403260
PKN21:89206671–892069713000.03896627272215
TNIP15: 150415143–1504152681250.03975361614
ARGLU113: 107209096–1072100433470.03960114256
LRRN21:204654448–2046548614130.03991343292532
ACACB12:109625804–1096259671630.04011946433040
EIF5B2: 99980108–999803252170.04153914221815
FRA10AC110:95441237–954413551180.0419336652
RASA15:86627165–866273171520.04373510151716
CHD916:53301839–533020381990.04414110112013
TPM115:63351762–633518791170.04433812181912
ACVR22:148657313–1486574671540.04622621161014
MCTP15:94224580–942246772500.0475612201925
HOXC612:54404873–54407570970.04812662714549
ATF422:39916183–399176762670.04872628181818

References

  1. Siegel, R.L.; Miller, K.D.; Jemal, A. Cancer Statistics, 2017. CA Cancer J. Clin. 2017, 67, 7–30. [Google Scholar] [CrossRef] [PubMed]
  2. Weinstock, M.A. Epidemiology, etiology, and control of melanoma. Med. Health R. I. 2001, 84, 234–236. [Google Scholar] [PubMed]
  3. Forsea, A.M.; Del Marmol, V.; de Vries, E.; Bailey, E.E.; Geller, A.C. Melanoma incidence and mortality in Europe: New estimates, persistent disparities. Br. J. Dermatol. 2012, 167, 1124–1130. [Google Scholar] [CrossRef] [PubMed]
  4. Fernandez-Mercado, M.; Manterola, L.; Larrea, E.; Goicoechea, I.; Arestin, M.; Armesto, M.; Otaegui, D.; Lawrie, C.H. The circulating transcriptome as a source of non-invasive cancer biomarkers: Concepts and controversies of non-coding and coding RNA in body fluids. J. Cell. Mol. Med. 2015, 19, 2307–2323. [Google Scholar] [CrossRef] [PubMed]
  5. Lawrie, C.H.; Gal, S.; Dunlop, H.M.; Pushkaran, B.; Liggins, A.P.; Pulford, K.; Banham, A.H.; Pezzella, F.; Boultwood, J.; Wainscoat, J.S.; et al. Detection of elevated levels of tumour-associated microRNAs in serum of patients with diffuse large B-cell lymphoma. Br. J. Haematol. 2008, 141, 672–675. [Google Scholar] [CrossRef] [PubMed] [Green Version]
  6. Shiiyama, R.; Fukushima, S.; Jinnin, M.; Yamashita, J.; Miyashita, A.; Nakahara, S.; Kogi, A.; Aoi, J.; Masuguchi, S.; Inoue, Y.; et al. Sensitive detection of melanoma metastasis using circulating microRNA expression profiles. Melanoma Res. 2013, 23, 366–372. [Google Scholar] [CrossRef] [PubMed]
  7. Friedman, E.B.; Shang, S.; de Miera, E.V.; Fog, J.U.; Teilum, M.W.; Ma, M.W.; Berman, R.S.; Shapiro, R.L.; Pavlick, A.C.; Hernando, E.; et al. Serum microRNAs as biomarkers for recurrence in melanoma. J. Transl. Med. 2012, 10, 155. [Google Scholar] [CrossRef] [PubMed] [Green Version]
  8. Savelyeva, A.V.; Kuligina, E.V.; Bariakin, D.N.; Kozlov, V.V.; Ryabchikova, E.I.; Richter, V.A.; Semenov, D.V. Variety of RNAs in Peripheral Blood Cells, Plasma, and Plasma Fractions. Biomed. Res. Int. 2017, 2017, 7404912. [Google Scholar] [CrossRef]
  9. Wong, B.C.; Lo, Y.M. Plasma RNA integrity analysis: Methodology and validation. Ann. N. Y. Acad. Sci. 2006, 1075, 174–178. [Google Scholar] [CrossRef]
  10. Pruijn, G.J.; Wingens, P.A.; Peters, S.L.; Thijssen, J.P.; van Venrooij, W.J. Ro RNP associated Y RNAs are highly conserved among mammals. Biochim. Biophys. Acta 1993, 1216, 395–401. [Google Scholar] [CrossRef]
  11. Stein, A.J.; Fuchs, G.; Fu, C.; Wolin, S.L.; Reinisch, K.M. Structural insights into RNA quality control: The Ro autoantigen binds misfolded RNAs via its central cavity. Cell 2005, 121, 529–539. [Google Scholar] [CrossRef]
  12. Christov, C.P.; Gardiner, T.J.; Szuts, D.; Krude, T. Functional requirement of noncoding Y RNAs for human chromosomal DNA replication. Mol. Cell. Biol. 2006, 26, 6993–7004. [Google Scholar] [CrossRef]
  13. Sim, S.; Wolin, S.L. Emerging roles for the Ro 60-kDa autoantigen in noncoding RNA metabolism. Wiley Interdiscip. Rev. RNA 2011, 2, 686–699. [Google Scholar] [CrossRef] [Green Version]
  14. Sole, C.; Tramonti, D.; Schramm, M.; Goicoechea, I.; Armesto, M.; Hernandez, L.I.; Manterola, L.; Fernandez-Mercado, M.; Mujika, K.; Tuneu, A.; Jaka, A.; et al. Biodonostia Research Institute; University of Oxford; University of Heidelberg; Oncology Institute of Gipuzkoa; Hospital Universitario Donostia; Centre for Genomic Regulation; Universitat Pompeu Fabra; CIBERESP; Hospital del Mar Research Institute; Stockholm University; Imperial College London; de Octubre Hospital; CIBERONC; IKERBASQUE. (Library optimization for sequencing of circulating transcriptome in melanoma patients) San Sebastian, Spain, unpublished work, 2018.
  15. Fuchs, R.T.; Sun, Z.; Zhuang, F.; Robb, G.B. Bias in ligation-based small RNA sequencing library construction is determined by adaptor and RNA structure. PLoS ONE 2015, 10, e0126049. [Google Scholar] [CrossRef]
  16. Sole, C.; Tramonti, D.; Schramm, M.; Goicoechea, I.; Armesto, M.; Hernandez, L.I.; Manterola, L.; Fernandez-Mercado, M.; Mujika, K.; Tuneu, A.; et al. Biodonostia Research Institute; University of Oxford; University of Heidelberg; Oncology Institute of Gipuzkoa; Hospital Universitario Donostia; Centre for Genomic Regulation; Universitat Pompeu Fabra; CIBERESP; Hospital del Mar Research Institute; Stockholm University; Imperial College London; de Octubre Hospital; CIBERONC; IKERBASQUE. miR-21-5p and miR-92b-3p detection in Melanoma. San Sebastian, Spain, unpublished work, 2018.
  17. Sole, C.; Tramonti, D.; Schramm, M.; Goicoechea, I.; Armesto, M.; Hernandez, L.I.; Manterola, L.; Fernandez-Mercado, M.; Mujika, K.; Tuneu, A.; et al. Biodonostia Research Institute; University of Oxford; University of Heidelberg; Oncology Institute of Gipuzkoa; Hospital Universitario Donostia; Centre for Genomic Regulation; Universitat Pompeu Fabra; CIBERESP; Hospital del Mar Research Institute; Stockholm University; Imperial College London; de Octubre Hospital; CIBERONC; IKERBASQUE. mRNA targets of miR-134-5p and miR-320a using predictive algorithms TargetScan and miRDB. San Sebastian, Spain, unpublished work, 2018.
  18. Robin, X.; Turck, N.; Hainard, A.; Tiberti, N.; Lisacek, F.; Sanchez, J.C.; Müller, M. PanelomiX: A threshold-based algorithm to create panels of biomarkers. Transl. Proteom. 2013, 1, 57–64. [Google Scholar] [CrossRef] [Green Version]
  19. Qin, Y.; Yao, J.; Wu, D.C.; Nottingham, R.M.; Mohr, S.; Hunicke-Smith, S.; Lambowitz, A.M. High-throughput sequencing of human plasma RNA by using thermostable group II intron reverse transcriptases. RNA 2016, 22, 111–128. [Google Scholar] [CrossRef]
  20. Danielson, K.M.; Rubio, R.; Abderazzaq, F.; Das, S.; Wang, Y.E. High Throughput Sequencing of Extracellular RNA from Human Plasma. PLoS ONE 2017, 12, e0164644. [Google Scholar] [CrossRef]
  21. Guo, Y.; Vickers, K.; Xiong, Y.; Zhao, S.; Sheng, Q.; Zhang, P.; Zhou, W.; Flynn, C.R. Comprehensive evaluation of extracellular small RNA isolation methods from serum in high throughput sequencing. BMC Genom. 2017, 18, 50. [Google Scholar] [CrossRef] [PubMed]
  22. Yuan, T.; Huang, X.; Woodcock, M.; Du, M.; Dittmar, R.; Wang, Y.; Tsai, S.; Kohli, M.; Boardman, L.; Patel, T.; et al. Plasma extracellular RNA profiles in healthy and cancer patients. Sci. Rep. 2016, 6, 19413. [Google Scholar] [CrossRef] [PubMed]
  23. Guo, S.; Guo, W.; Li, S.; Dai, W.; Zhang, N.; Zhao, T.; Wang, H.; Ma, J.; Yi, X.; Ge, R.; et al. Serum miR-16: A Potential Biomarker for Predicting Melanoma Prognosis. J. Investig. Dermatol. 2016, 136, 985–993. [Google Scholar] [CrossRef]
  24. Armand-Labit, V.; Meyer, N.; Casanova, A.; Bonnabau, H.; Platzer, V.; Tournier, E.; Sansas, B.; Verdun, S.; Thouvenot, B.; Hilselberger, B.; et al. Identification of a Circulating MicroRNA Profile as a Biomarker of Metastatic Cutaneous Melanoma. Acta Derm-Venereol. 2016, 96, 29–34. [Google Scholar] [CrossRef] [PubMed] [Green Version]
  25. Saldanha, G.; Potter, L.; Shendge, P.; Osborne, J.; Nicholson, S.; Yii, N.; Varma, S.; Aslam, M.I.; Elshaw, S.; Papadogeorgakis, E.; et al. Plasma microRNA-21 is associated with tumor burden in cutaneous melanoma. J. Investig. Dermatol. 2013, 133, 1381–1384. [Google Scholar] [CrossRef]
  26. Triozzi, P.L.; Achberger, S.; Aldrich, W.; Crabb, J.W.; Saunthararajah, Y.; Singh, A.D. Association of tumor and plasma microRNA expression with tumor monosomy-3 in patients with uveal melanoma. Clin. Epigenet. 2016, 8, 80. [Google Scholar] [CrossRef] [PubMed]
  27. Kozubek, J.; Ma, Z.; Fleming, E.; Duggan, T.; Wu, R.; Shin, D.G.; Dadras, S.S. In-depth characterization of microRNA transcriptome in melanoma. PLoS ONE 2013, 8, e72699. [Google Scholar] [CrossRef]
  28. Fang, Z.; Tang, J.; Bai, Y.; Lin, H.; You, H.; Jin, H.; Lin, L.; You, P.; Li, J.; Dai, Z.; et al. Plasma levels of microRNA-24, microRNA-320a, and microRNA-423-5p are potential biomarkers for colorectal carcinoma. J. Exp. Clin. Cancer Res. 2015, 34, 86. [Google Scholar] [CrossRef] [PubMed]
  29. Xu, Q.; Dong, Q.G.; Sun, L.P.; He, C.Y.; Yuan, Y. Expression of serum miR-20a-5p, let-7a, and miR-320a and their correlations with pepsinogen in atrophic gastritis and gastric cancer: A case-control study. BMC Clin. Pathol. 2013, 13, 11. [Google Scholar] [CrossRef] [PubMed]
  30. Liu, S.S.; Wang, Y.S.; Sun, Y.F.; Miao, L.X.; Wang, J.; Li, Y.S.; Liu, H.Y.; Liu, Q.L. Plasma microRNA-320, microRNA-let-7e and microRNA-21 as novel potential biomarkers for the detection of retinoblastoma. Biomed. Rep. 2014, 2, 424–428. [Google Scholar] [CrossRef] [PubMed]
  31. Wagenseller, A.G.; Shada, A.; D’Auria, K.M.; Murphy, C.; Sun, D.; Molhoek, K.R.; Papin, J.A.; Dutta, A.; Slingluff, C.L., Jr. MicroRNAs induced in melanoma treated with combination targeted therapy of Temsirolimus and Bevacizumab. J. Transl. Med. 2013, 11, 218. [Google Scholar] [CrossRef] [Green Version]
  32. Pan, J.Y.; Zhang, F.; Sun, C.C.; Li, S.J.; Li, G.; Gong, F.Y.; Bo, T.; He, J.; Hua, R.X.; Hu, W.D.; et al. miR-134: A Human Cancer Suppressor? Mol. Ther. Nucleic Acids 2017, 6, 140–149. [Google Scholar] [CrossRef]
  33. Venkatesan, N.; Kanwar, J.; Deepa, P.R.; Khetan, V.; Crowley, T.M.; Raguraman, R.; Sugneswari, G.; Rishi, P.; Natarajan, V.; Biswas, J.; et al. Clinico-Pathological Association of Delineated miRNAs in Uveal Melanoma with Monosomy 3/Disomy 3 Chromosomal Aberrations. PLoS ONE 2016, 11, e0146128. [Google Scholar] [CrossRef]
  34. Kopreski, M.S.; Benko, F.A.; Kwak, L.W.; Gocke, C.D. Detection of tumor messenger RNA in the serum of patients with malignant melanoma. Clin. Cancer Res. 1999, 5, 1961–1965. [Google Scholar]
  35. Reddi, K.K.; Holland, J.F. Elevated serum ribonuclease in patients with pancreatic cancer. Proc. Natl. Acad. Sci. USA 1976, 73, 2308–2310. [Google Scholar] [CrossRef]
  36. Sole, C.; Tramonti, D.; Schramm, M.; Goicoechea, I.; Armesto, M.; Hernandez, L.I.; Manterola, L.; Fernandez-Mercado, M.; Mujika, K.; Tuneu, A.; et al. Biodonostia Research Institute; University of Oxford; University of Heidelberg; Oncology Institute of Gipuzkoa; Hospital Universitario Donostia; Centre for Genomic Regulation; Universitat Pompeu Fabra; CIBERESP; Hospital del Mar Research Institute; Stockholm University; Imperial College London; de Octubre Hospital; CIBERONC; IKERBASQUE. Length profile in sequencing between healthy and melanoma patient samples. San Sebastian, Spain, unpublished work, 2018.
  37. Helfrich, I.; Edler, L.; Sucker, A.; Thomas, M.; Christian, S.; Schadendorf, D.; Augustin, H.G. Angiopoietin-2 levels are associated with disease progression in metastatic malignant melanoma. Clin. Cancer Res. 2009, 15, 1384–1392. [Google Scholar] [CrossRef] [PubMed]
  38. Smalley, K.S.; Weber, J.S. Taming the wild-types: Targeting PAK1 in melanomas that lack BRAF mutations. J. Natl. Cancer Inst. 2013, 105, 591–592. [Google Scholar] [CrossRef]
  39. Lu, H.; Liu, S.; Zhang, G.; Bin, W.; Zhu, Y.; Frederick, D.T.; Hu, Y.; Zhong, W.; Randell, S.; Sadek, N.; et al. PAK signalling drives acquired drug resistance to MAPK inhibitors in BRAF-mutant melanomas. Nature 2017, 550, 133–136. [Google Scholar] [CrossRef] [PubMed]
  40. Emori, M.; Tsukahara, T.; Murase, M.; Kano, M.; Murata, K.; Takahashi, A.; Kubo, T.; Asanuma, H.; Yasuda, K.; Kochin, V.; et al. High expression of CD109 antigen regulates the phenotype of cancer stem-like cells/cancer-initiating cells in the novel epithelioid sarcoma cell line ESX and is related to poor prognosis of soft tissue sarcoma. PLoS ONE 2013, 8, e84187. [Google Scholar] [CrossRef]
  41. Fang, S.; Ferrone, M.; Yang, C.; Jensen, J.P.; Tiwari, S.; Weissman, A.M. The tumor autocrine motility factor receptor, gp78, is a ubiquitin protein ligase implicated in degradation from the endoplasmic reticulum. Proc. Natl. Acad. Sci. USA 2001, 98, 14422–14427. [Google Scholar] [CrossRef] [Green Version]
  42. Timar, J.; Raso, E.; Dome, B.; Ladanyi, A.; Banfalvi, T.; Gilde, K.; Raz, A. Expression and function of the AMF receptor by human melanoma in experimental and clinical systems. Clin. Exp. Metastasis 2002, 19, 225–232. [Google Scholar] [CrossRef]
  43. Russell, R.; Perkhofer, L.; Liebau, S.; Lin, Q.; Lechel, A.; Feld, F.M.; Hessmann, E.; Gaedcke, J.; Guthle, M.; Zenke, M.; et al. Loss of ATM accelerates pancreatic cancer formation and epithelial-mesenchymal transition. Nat. Commun. 2015, 6, 7677. [Google Scholar] [CrossRef]
  44. Halaban, R.; Krauthammer, M. RASopathy Gene Mutations in Melanoma. J. Investig. Dermatol. 2016, 136, 1755–1759. [Google Scholar] [CrossRef] [PubMed] [Green Version]
  45. Zhou, S.; Cecere, R.; Philip, A. CD109 released from human bone marrow mesenchymal stem cells attenuates TGF-beta-induced epithelial to mesenchymal transition and stemness of squamous cell carcinoma. Oncotarget 2017, 8, 95632–95647. [Google Scholar] [CrossRef] [PubMed]
  46. Wang, Q.; Liu, X.; Cui, Y.; Tang, Y.; Chen, W.; Li, S.; Yu, H.; Pan, Y.; Wang, C. The E3 ubiquitin ligase AMFR and INSIG1 bridge the activation of TBK1 kinase by modifying the adaptor STING. Immunity 2014, 41, 919–933. [Google Scholar] [CrossRef] [PubMed]
  47. Garnier, J.P.; Letellier, S.; Cassinat, B.; Lebbe, C.; Kerob, D.; Baccard, M.; Morel, P.; Basset-Seguin, N.; Dubertret, L.; Bousquet, B.; et al. Clinical value of combined determination of plasma L-DOPA/tyrosine ratio, S100B, MIA and LDH in melanoma. Eur. J. Cancer 2007, 43, 816–821. [Google Scholar] [CrossRef] [PubMed]
  48. Hendrick, J.P.; Wolin, S.L.; Rinke, J.; Lerner, M.R.; Steitz, J.A. Ro small cytoplasmic ribonucleoproteins are a subclass of La ribonucleoproteins: Further characterization of the Ro and La small ribonucleoproteins from uninfected mammalian cells. Mol. Cell. Biol. 1981, 1, 1138–1149. [Google Scholar] [CrossRef] [PubMed]
  49. Zhang, A.T.; Langley, A.R.; Christov, C.P.; Kheir, E.; Shafee, T.; Gardiner, T.J.; Krude, T. Dynamic interaction of Y RNAs with chromatin and initiation proteins during human DNA replication. J. Cell Sci. 2011, 124, 2058–2069. [Google Scholar] [CrossRef] [PubMed] [Green Version]
  50. Christov, C.P.; Trivier, E.; Krude, T. Noncoding human Y RNAs are overexpressed in tumours and required for cell proliferation. Br. J. Cancer 2008, 98, 981–988. [Google Scholar] [CrossRef] [PubMed] [Green Version]
  51. Kowalski, M.P.; Krude, T. Functional roles of non-coding Y RNAs. Int. J. Biochem. Cell Biol. 2015, 66, 20–29. [Google Scholar] [CrossRef] [PubMed] [Green Version]
  52. Dhahbi, J.M.; Spindler, S.R.; Atamna, H.; Boffelli, D.; Mote, P.; Martin, D.I. 5′-YRNA fragments derived by processing of transcripts from specific YRNA genes and pseudogenes are abundant in human serum and plasma. Physiol. Genom. 2013, 45, 990–998. [Google Scholar] [CrossRef] [PubMed]
  53. Dhahbi, J.M.; Spindler, S.R.; Atamna, H.; Boffelli, D.; Martin, D.I. Deep Sequencing of Serum Small RNAs Identifies Patterns of 5′ tRNA Half and YRNA Fragment Expression Associated with Breast Cancer. Biomark. Cancer 2014, 6, 37–47. [Google Scholar] [CrossRef]
  54. Victoria Martinez, B.; Dhahbi, J.M.; Nunez Lopez, Y.O.; Lamperska, K.; Golusinski, P.; Luczewski, L.; Kolenda, T.; Atamna, H.; Spindler, S.R.; Golusinski, W.; et al. Circulating small non-coding RNA signature in head and neck squamous cell carcinoma. Oncotarget 2015, 6, 19246–19263. [Google Scholar]
  55. Yeri, A.; Courtright, A.; Reiman, R.; Carlson, E.; Beecroft, T.; Janss, A.; Siniard, A.; Richholt, R.; Balak, C.; Rozowsky, J.; et al. Total Extracellular Small RNA Profiles from Plasma, Saliva, and Urine of Healthy Subjects. Sci. Rep. 2017, 7, 44061. [Google Scholar] [CrossRef] [PubMed]
  56. Nientiedt, M.; Schmidt, D.; Kristiansen, G.; Muller, S.C.; Ellinger, J. YRNA Expression Profiles are Altered in Clear Cell Renal Cell Carcinoma. Eur. Urol. Focus 2016. [Google Scholar] [CrossRef] [PubMed]
  57. Corrie, P.G.; Marshall, A.; Dunn, J.A.; Middleton, M.R.; Nathan, P.D.; Gore, M.; Davidson, N.; Nicholson, S.; Kelly, C.G.; Marples, M.; et al. Adjuvant bevacizumab in patients with melanoma at high risk of recurrence (AVAST-M): Preplanned interim results from a multicentre, open-label, randomised controlled phase 3 study. Lancet Oncol. 2014, 15, 620–630. [Google Scholar] [CrossRef]
  58. Lamble, S.; Batty, E.; Attar, M.; Buck, D.; Bowden, R.; Lunter, G.; Crook, D.; El-Fahmawi, B.; Piazza, P. Improved workflows for high throughput library preparation using the transposome-based Nextera system. BMC Biotechnol. 2013, 13, 104. [Google Scholar] [CrossRef] [PubMed]
  59. Harrow, J.; Frankish, A.; Gonzalez, J.M.; Tapanari, E.; Diekhans, M.; Kokocinski, F.; Aken, B.L.; Barrell, D.; Zadissa, A.; Searle, S.; et al. GENCODE: The reference human genome annotation for The ENCODE Project. Genome Res. 2012, 22, 1760–1774. [Google Scholar] [CrossRef] [PubMed] [Green Version]
  60. Meyer, L.R.; Zweig, A.S.; Hinrichs, A.S.; Karolchik, D.; Kuhn, R.M.; Wong, M.; Sloan, C.A.; Rosenbloom, K.R.; Roe, G.; Rhead, B.; et al. The UCSC Genome Browser database: Extensions and updates 2013. Nucleic Acids Res. 2013, 41, D64–D69. [Google Scholar] [CrossRef]
  61. Anders, S.; Huber, W. Differential expression analysis for sequence count data. Genome Biol. 2010, 11, R106. [Google Scholar] [CrossRef]
  62. Moret, I.; Sanchez-Izquierdo, D.; Iborra, M.; Tortosa, L.; Navarro-Puche, A.; Nos, P.; Cervera, J.; Beltran, B. Assessing an improved protocol for plasma microRNA extraction. PLoS ONE 2013, 8, e82753. [Google Scholar] [CrossRef]
  63. Lardizabal, M.N.; Nocito, A.L.; Daniele, S.M.; Ornella, L.A.; Palatnik, J.F.; Veggi, L.M. Reference genes for real-time PCR quantification of microRNAs and messenger RNAs in rat models of hepatotoxicity. PLoS ONE 2012, 7, e36323. [Google Scholar] [CrossRef]
  64. Xiang, M.; Zeng, Y.; Yang, R.; Xu, H.; Chen, Z.; Zhong, J.; Xie, H.; Xu, Y.; Zeng, X. U6 is not a suitable endogenous control for the quantification of circulating microRNAs. Biochem. Biophys. Res. Commun. 2014, 454, 210–214. [Google Scholar] [CrossRef]
  65. Marabita, F.; de Candia, P.; Torri, A.; Tegner, J.; Abrignani, S.; Rossi, R.L. Normalization of circulating microRNA expression data obtained by quantitative real-time RT-PCR. Brief Bioinform. 2016, 17, 204–212. [Google Scholar] [CrossRef] [PubMed]
  66. DeLong, E.R.; DeLong, D.M.; Clarke-Pearson, D.L. Comparing the areas under two or more correlated receiver operating characteristic curves: A nonparametric approach. Biometrics 1988, 44, 837–845. [Google Scholar] [CrossRef] [PubMed]
Figure 1. RNAseq results from circulating transcriptome. (a) Typical length–frequency of obtained reads in library. Proportion of reads mapping to different categories of sRNA for (b) control pool, (c) stage 0 pool, (d) stage I/II pool, (e) stage III pool, (f) stage IV pool.
Cancers 11 00070 g001
Figure 2. Expression levels of miRNAs measured by qRT-PCR in independent validation cohorts. (a,b) Levels of miR-320a and miR-134 were measured in a cohort of 124 plasma samples (28 controls and 96 melanoma patients). Expression levels were compared using the Kruskal–Wallis multiple comparison test (both miR-134 and miR-320a had p-values of <0.0001) and the Mann–Whitney independent t-test to carry out a pairwise comparison between groups (* p < 0.5; *** p < 0.001) (c,d) ROC analysis of miRNA probe expression levels as diagnostic biomarker (i.e., control vs. all melanoma patients, regardless of stage).
Cancers 11 00070 g002
Figure 3. Expression levels of mRNA fragments measured by qRT-PCR in independent validation cohorts. (a) Proportions of probe sets containing at least 25 reads (>500 bases in length) relative to their position (5′ to 3′ direction) along the respective transcript. (be) Levels of ATM, AMFR, CD109, and SOS1 probes were measured in a cohort of 185 plasma samples (41 controls and 144 melanoma patients). Levels are shown relative to the mean expression of the control sample cohort (i.e., 2−ΔΔCt). Expression levels were compared using the Kruskal–Wallis multiple comparison test (all the mRNA fragments had p-values of <0.0001), and the Mann–Whitney independent t-test to carry out a pairwise comparison between groups (* p < 0.5; *** p < 0.001) (fi) ROC analysis of mRNA probe expression levels as diagnostic biomarker (i.e., control vs. melanoma patient). (j) Panel (ATM, AMFR, and SOS1) performance shown with black line, and SOS1 is shown as a gray line for comparison.
Cancers 11 00070 g003
Figure 4. YRNA expression in plasma samples. (a) Mean proportions of different YRNA species in NGS cohort plasma samples. Levels of (b) RNY3P1, (c) RNY4P1 and (d) RNY4P25 measured by ddPCR in an independent validation cohort of 80 plasma samples (22 controls and 58 melanoma patients). Values are shown as absolute copies per µl. Expression levels were compared using the Kruskal–Wallis multiple comparison test (all the YRNA fragments had p-values of < 0.001), and the Mann–Whitney independent t-test to carry out a pairwise comparison between groups, (* p < 0.5; **p < 0.01*** p < 0.001).
Cancers 11 00070 g004
Table 1. Summary of clinical details of patient cohorts used in study. NK: not known.
StagenAge (Median)Sex (M/F/(NK))
Control8584/4
Pool 05763/2
NGS cohortPool I/II8634/4
Pool III8683/5
Pool IV8593/5
Control475418/23
mRNAStage 0346411/17/(1)
validation cohortStage I/II525819/25
Stage III/IV8757.532/37/(2)
Control285812/14/(2)
miRNAStage 029516/19/(4)
validation cohortStage I/II336010/14/(9)
Stage III/IV345511/15/(8)
Control2257.511/11/
YRNAStage 0205111/5/(4)
validation cohortStage I/II17489/8
Stage III/IV21618/13
Total-42658175/221/(30)
Table 2. Differentially expressed microRNAs (miRNAs) (p < 0.05). Counts were normalized per million reads. miRNAs validated are depicted in bold.
miRNACont.Stage 0Stage I/IIStage IIIStage IVp-Value
miR-134-5p747472902293420048760.0158
miR-320a-3p117,41176,95256,70586,93374,1540.0181
miR-21-5p3564053687824690.0183
miR-92b-3p14142025510.0232
miR-98-5p985012,999912414,24313,6270.0232
miR-16-3p21294939530.0277
Let-7b3855073262673960.0286
miR-1827582877110.0375
miR-11801071454945420.0392
miR-6284996673755024070.0496
miR-4864581.236014.451501.332704.891879.670.0497
Table 3. ROC analysis values of expression levels of differentially expressed miRNAs and gene fragments. * AUC values of different stage vs. control sample. Panel was a combination of ATM, AMFR, and SOS1.
ProbeAUCSensitivitySpecificity95% CI0 *I/II *III/IV *
miR-320a-3p0.79890%61%0.712–0.8690.7510.8700.828
miR-134-5p0.78855%96%0.704–0.8580.6800.8680.811
ATM0.76761%72%0.697–0.8290.7690.7340.715
AMFR0.74852%92%0.676–0.8120.8220.7090.641
CD1090.75354%90%0.680–0.8160.8160.7060.702
SOS10.77248%95%0.699–0.8350.7960.6940.693
Panel0.82575%92%----
Table 4. Differentially expressed YRNAs (p < 0.05). Counts were normalized per million reads. YRNAs validated are depicted in bold.
Stage 0/I/IIStage III/IVFold Changep-Value
RNY4P18851932.20.00033
RNY3P1862102.40.00063
RNY4P612,44224,4731.90.00072
RNY4P1681462.10.00090
RNY4P251803171.70.0032
Table 5. Details of origin of patient cohorts used in study.
Cohortn Samples
mRNAOxford30
AVAST-M83
Madrid51
San Sebastián67
miRNAAVAST-M6
Madrid35
San Sebastián83
yRNAMadrid51
San Sebastián67

