DNA Repair Gene Expression Adjusted by the PCNA Metagene Predicts Survival in Multiple Cancers


Abstract
:1. Introduction
2. Data
2.1. Cancer Data
2.2. Expression, Mutations, Deletions, and Amplifications
2.3. DNA Repair Gene Lists
3. Results
3.1. Cancer Survival Prediction—Univariate
3.2. Cancer Survival Prediction—Multivariate Gene Sets for Multiple Pathways
3.3. Multivariate Sets of DNA Repair Genes which Predict Overall Survival for each Cancer
3.4. Cluster Analysis of Genomic Event Rates
4. Discussion
5. Materials and Methods
5.1. PCNA Metagene
5.2. Maximum Likelihood Survival Prediction
5.3. Empirical p-Value Tests of Survival Using Randomly Selected Genes
5.4. Genomic Event Rates
5.5. Removing Redundant Genes in Gene Lists
6. Conclusions
Supplementary Materials
Author Contributions
Funding
Conflicts of Interest
References
- Hanahan, D.; Weinberg, R.A. The hallmarks of cancer. Cell 2000, 100, 57–70. [Google Scholar] [CrossRef]
- Curtin, N.J. DNA repair dysregulation from cancer driver to therapeutic target. Nat. Rev. Cancer 2012, 12, 801–817. [Google Scholar] [CrossRef] [PubMed]
- Cannan, W.J.; Pederson, D.S. Mechanisms and Consequences of Double-Strand DNA Break Formation in Chromatin. J. Cell Physiol. 2016, 231, 3–14. [Google Scholar] [CrossRef]
- Forment, J.V.; Kaidi, A.; Jackson, S.P. Chromothripsis and cancer: Causes and consequences of chromosome shattering. Nat. Rev. Cancer 2012, 12, 663–670. [Google Scholar] [CrossRef] [PubMed]
- Bryant, H.E.; Schultz, N.; Thomas, H.D.; Parker, K.M.; Flower, D.; Lopez, E.; Kyle, S.; Meuth, M.; Curtin, N.J.; Helleday, T. Specific killing of BRCA2-deficient tumours with inhibitors of poly(ADP-ribose) polymerase. Nature 2005, 434, 913–917. [Google Scholar] [CrossRef]
- Farmer, H.; McCabe, N.; Lord, C.J.; Tutt, A.N.; Johnson, D.A.; Richardson, T.B.; Santarosa, M.; Dillon, K.J.; Hickson, I.; Knights, C.; et al. Targeting the DNA repair defect in BRCA mutant cells as a therapeutic strategy. Nature 2005, 434, 917–921. [Google Scholar] [CrossRef]
- Shaheen, M.; Allen, C.; Nickoloff, J.A.; Hromas, R. Synthetic lethality: Exploiting the addiction of cancer to DNA repair. Blood 2011, 117, 6074–6082. [Google Scholar] [CrossRef]
- Nickoloff, J.A.; Jones, D.; Lee, S.H.; Williamson, E.A.; Hromas, R. Drugging the Cancers Addicted to DNA Repair. J. Natl. Cancer Inst. 2017, 109. [Google Scholar] [CrossRef]
- Budzowska, M.; Kanaar, R. Mechanisms of dealing with DNA damage-induced replication problems. Cell Biochem. Biophys. 2009, 53, 17–31. [Google Scholar] [CrossRef]
- Allen, C.; Ashley, A.K.; Hromas, R.; Nickoloff, J.A. More forks on the road to replication stress recovery. J. Mol. Cell. Biol. 2011, 3, 4–12. [Google Scholar] [CrossRef]
- Ashworth, A.; Lord, C.J. Synthetic lethal therapies for cancer: what’s next after PARP inhibitors? Nat. Rev. Clin. Oncol. 2018, 15, 564–576. [Google Scholar] [CrossRef] [PubMed]
- Dedes, K.J.; Wilkerson, P.M.; Wetterskog, D.; Weigelt, B.; Ashworth, A.; Reis-Filho, J.S. Synthetic lethality of PARP inhibition in cancers lacking BRCA1 and BRCA2 mutations. Cell Cycle 2011, 10, 1192–1199. [Google Scholar] [CrossRef] [PubMed]
- Rehman, F.L.; Lord, C.J.; Ashworth, A. Synthetic lethal approaches to breast cancer therapy. Nat. Rev. Clin. Oncol. 2010, 7, 718–724. [Google Scholar] [CrossRef]
- Gavande, N.S.; VanderVere-Carozza, P.S.; Hinshaw, H.D.; Jalal, S.I.; Sears, C.R.; Pawelczak, K.S.; Turchi, J.J. DNA repair targeted therapy: The past or future of cancer treatment? Pharmacol. Ther. 2016, 160, 65–83. [Google Scholar] [CrossRef]
- Essers, J.; Theil, A.F.; Baldeyron, C.; van Cappellen, W.A.; Houtsmuller, A.B.; Kanaar, R.; Vermeulen, W. Nuclear dynamics of PCNA in DNA replication and repair. Mol. Cell. Biol. 2005, 25, 9350–9359. [Google Scholar] [CrossRef]
- Venet, D.; Dumont, J.E.; Detours, V. Most random gene expression signatures are significantly associated with breast cancer outcome. PLoS Comput. Biol. 2011, 7, e1002240. [Google Scholar] [CrossRef]
- Moldovan, G.L.; Pfander, B.; Jentsch, S. PCNA, the maestr of the replication fork. Cell 2007, 129, 665–679. [Google Scholar] [CrossRef]
- Ge, X.; Yamamoto, S.; Tsutsumi, S.; Midorikawa, Y.; Ihara, S.; Wang, S.M.; Aburatani, H. Interpreting expression profiles of cancers by genome-wide survey of breadth of expression in normal tissues. Genomics 2005, 86, 127–141. [Google Scholar] [CrossRef] [PubMed]
- Shimoni, Y. Association between expression of random gene sets and survival is evident in multiple cancer types and may be explained by sub-classification. PLoS Comput. Biol. 2018, 14, e1006026. [Google Scholar] [CrossRef]
- Davidson, D.; Amrein, L.; Panasci, L.; Aloyz, R. Small Molecules, Inhibitors of DNA-PK, Targeting DNA Repair, and Beyond. Front. Pharmacol. 2013, 4, 5. [Google Scholar] [CrossRef]
- O’Cearbhaill, R.E. Using PARP Inhibitors in Advanced Ovarian Cancer. Oncology 2018, 32, 339–343. [Google Scholar]
- Waks, Z.; Weissbrod, O.; Carmeli, B.; Norel, R.; Utro, F.; Goldschmidt, Y. Driver gene classification reveals a substantial overrepresentation of tumor suppressors among very large chromatin-regulating proteins. Sci. Rep. 2016, 6, 38988. [Google Scholar] [CrossRef]
- National Cancer Institute; National Human Genome Research Institute. The Cancer Genome Atlas; NCI: Bethesda, MD, USA; NHGRI: Bethesda, MD, USA, 2005. [Google Scholar]
- Cerami, E.; Gao, J.; Dogrusoz, U.; Gross, B.E.; Sumer, S.O.; Aksoy, B.A.; Jacobsen, A.; Byrne, C.J.; Heuer, M.L.; Larsson, E.; et al. The cBio Cancer Genomics Portal: An Open Platform for Exploring Multidimensional Cancer Genomics Data. Cancer Discov. 2012, 2, 401. [Google Scholar] [CrossRef]
- Gao, J.; Aksoy, B.A.; Dogrusoz, U.; Dresdner, G.; Gross, B.; Sumer, S.O.; Sun, Y.; Larsson, E.; Sander, C.; Sinha, R.; et al. Integrative analysis of complex cancer genomics and clinical profiles using the cBioPortal. Sci. Signal. 2013, 6, 11. [Google Scholar] [CrossRef]
- Mermel, C.H.; Schumacher, S.E.; Hill, B.; Meyerson, M.L.; Beroukhim, R.; Getz, G. GISTIC 2.0 facilitates sensitive and confident localization of the targets of focal somatic copy-number alteration in human cancers. Genome Biol. 2011, 12, R41. [Google Scholar] [CrossRef]
- Wood, R.D. Human DNA Repair Genes. Available online: https://www.mdanderson.org/documents/Labs/Wood-Laboratory/human-dna-repair-genes.html (accessed on 11 August 2015).
- Wood, R.D.; Mitchell, M.; Sgouros, J.G.; Lindahl, T. Human DNA Repair Genes. Science. 2001, 291, 1284. [Google Scholar] [CrossRef]
- Friedberg, E.C.; Walker, G.C.; Siede, W.; Wood, R.D.; Schulz, R.A.; Ellenberger, T. DNA Repair and Mutagenesis, 2nd ed.; ASM Press: Washington, DC, USA, 2006. [Google Scholar]
- Lange, S.S.; Takata, K.; Wood, R.D. DNA Polymerases and Cancer. Nat. Rev. Cancer. 2011, 11, 96. [Google Scholar] [CrossRef]
- Ronen, A.; Glickman, B.W. Human DNA repair genes. Environ. Mol. Mutagen. 2001, 37, 241. [Google Scholar] [CrossRef]
- Eisen, J.A.; Hanawalt, P.C. A phylogenomic study of DNA repair genes, proteins, and processes. Mutat. Res. DNA Repair. 1999, 435, 171. [Google Scholar] [CrossRef]
- Aravind, L.; Walker, D.R.; Koonin, E.V. Conserved domains in DNA repair proteins and evolution of repair systems. Nucleic Acids Res. 1999, 27, 1223. [Google Scholar] [CrossRef]
- Strand, M.; Prolla, T.A.; Liskay, R.M.; Petes, T.D. Destabilization of tracts of simple repetitive DNA in yeast by mutations affecting DNA mismatch repair. Nature 1993, 365, 274–276. [Google Scholar] [CrossRef]
- Weber, A.M.; Ryan, A.J. ATM and ATR as therapeutic targets in cancer. Pharmacol. Ther. 2015, 149, 124–138. [Google Scholar] [CrossRef]
- Choi, S.; Gamper, A.M.; White, J.S.; Bakkenist, C.J. Inhibition of ATM kinase activity does not phenocopy ATM protein disruption: Implications for the clinical utility of ATM kinase inhibitors. Cell Cycle 2010, 9, 4052–4057. [Google Scholar] [CrossRef]
- Erasimus, H.; Gobin, M.; Niclou, S.; Van Dyck, E. DNA repair mechanisms and their clinical impact in glioblastoma. Mutat. Res. 2016, 769, 19–35. [Google Scholar] [CrossRef]
- Lawrence, M.S.; Stojanov, P.; Polak, P.; Kryukov, G.V.; Cibulskis, K.; Sivachenko, A.; Carter, S.L.; Stewart, C.; Mermel, C.H.; Roberts, S.A.; et al. Mutational heterogeneity in cancer and the search for new cancer-associated genes. Nature 2013, 499, 214–218. [Google Scholar] [CrossRef]
- Tate, J.G.; Bamford, S.; Jubb, H.C.; Sondka, Z.; Beare, D.M.; Bindal, N.; Boutselakis, H.; Cole, C.G.; Creatore, C.; Dawson, E.; et al. COSMIC: The Catalogue of Somatic Mutations in Cancer. Nucleic Acids Res. 2019, 47, D941–D947. [Google Scholar] [CrossRef]
- Li, J.F.; Konstantinopoulos, P.A.; Matulonis, U.A. PARP inhibitors in ovarian cancer: Current status and future promise. Gynecol. Oncol. 2014, 133, 362–369. [Google Scholar] [CrossRef]
- Dizdar, O.; Arslan, C.; Altundag, K. Advances in PARP inhibitors for the treatment of breast cancer. Expert. Opin. Pharmacother. 2015, 16, 2751–2758. [Google Scholar] [CrossRef]
- Sonnenblick, A.; de Azambuja, E.; Azim, H.A.; Piccart, M. An update on PARP inhibitors–moving to the adjuvant setting. Nat. Rev. Clin. Oncol. 2015, 12, 27–41. [Google Scholar] [CrossRef]
- Liu, J.; Lichtenberg, T.; Hoadley, K.A.; Poisson, L.M.; Lazar, A.J.; Cherniack, A.D.; Kovatich, A.J.; Benz, C.C.; Levine, D.A.; Lee, A.V.; et al. An Integrated TCGA Pan-Cancer Clinical Data Resource to Drive High-Quality Survival Outcome Analytics. Cell 2018, 173, 400–416. [Google Scholar] [CrossRef]
- Bonneville, R.; Krook, M.A.; Kautto, E.A.; Miya, J.; Wing, M.R.; Chen, H.Z.; Reeser, J.W.; Yu, L.; Roychowdhury, S. Landscape of Microsatellite Instability Across 39 Cancer Types. JCO Precis. Oncol. 2017, 2017. [Google Scholar] [CrossRef] [PubMed]
- Peterson, L.E.; Kovyrshina, T. Progression inference for somatic mutations in cancer. Heliyon 2017, 3, 00277. [Google Scholar] [CrossRef] [PubMed]
- Cheng, W.C.; Chung, I.F.; Chen, C.Y.; Sun, H.J.; Fen, J.J.; Tang, W.C. DriverDB: An exome sequencing database for cancer driver gene identification. Nucleic Acids Res. 2014, 42, D1048–D1054. [Google Scholar] [CrossRef] [PubMed]


| DNA Repair Pathway | Genes |
|---|---|
| Direct reversal repair (DRR) | ALKBH2, ALKBH3, MGMT |
| Base excision repair (BER) | APEX1, APEX2, APTX, FEN1, LIG1, LIG3, MBD4, MPG, MUTYH, NEIL1, NEIL2, NEIL3, NTHL1, OGG1, PARP1, PARP2, PCNA, PNKP, POLB, POLD1, POLE, POLL, WRN, SMUG1, TDG, UNG, XRCC1 |
| Non-homologous end-joining (NHEJ) | DCLRE1C, XRCC6, XRCC5, LIG4, NHEJ1, POLM, PRKDC, XRCC4 |
| Mismatch repair (MMR) | EXO1, MLH1, MLH3, MSH2, MSH3, MSH6, PMS1, PMS2 |
| Translesion synthesis (TLS) | POLH, POLI, POLK, POLN, POLQ, REV1, REV3L |
| DNA damage signaling (DDS) | ATM, ATR, ATRIP, BLM, BRCA1, CCNH, CDK7, CDKN1A, CHEK1, CHEK2, COPS5, DCLRE1A, DCLRE1B, FANCA, FANCC, GPS1, HUS1, MDC1, MNAT1, MRE11A, NBN, RAD1, RAD17, RAD18, RAD23A, RAD50, RAD9A, RFC1, RFC2, RFC3, RFC4, RFC5, TOPBP1, TP53 |
| Homologous recombination repair (HRR) | BRCA2, FAAP24, EME1, EME2, FANCB, FANCD2, FANCE, FANCF, FANCG, FANCI, FANCL, MSH4, MSH5, MUS81, RAD51, RAD52 |
| Nucleotide excision repair (NER) | ERCC8, ERCC6, CUL4A, DDB1, DDB2, ERCC1, GTF2H1, GTF2H2, GTF2H3, GTF2H4, GTF2H5, MMS19, RAD23B, RPA1, XPA, ERCC3, XPC, ERCC2, ERCC4, ERCC5 |
| Cancer | n | Kaplan-Meier Logrank a | Random genes (B = 1000) b | ||||||
|---|---|---|---|---|---|---|---|---|---|
| A | P | A,P | N | A | P | A,P | N | ||
| AML | 200 | 0.0062 | 0.0018 | 0.0157 | 0.0062 | 0.0120 | 0.0020 | 0.0130 | 0.0130 |
| Bladder | 413 | 0.0000 | 0.0000 | 0.0000 | 0.0001 | 0.0190 | 0.0180 | 0.0160 | 0.0360 |
| Low Grade Gliomas | 530 | 0.0000 | 0.0000 | 0.0000 | 0.0000 | 0.5740 | 0.2760 | 0.3880 | 0.3520 |
| GBM | 604 | 0.0090 | 0.0005 | 0.0231 | 0.0008 | 0.0270 | 0.0040 | 0.1600 | 0.0030 |
| Head & Neck | 530 | 0.0005 | 0.0009 | 0.0006 | 0.0008 | 0.0150 | 0.1370 | 0.1120 | 0.0110 |
| Sarcoma | 265 | 0.0011 | 0.0032 | 0.0008 | 0.0001 | 0.1200 | 0.0520 | 0.0120 | 0.0150 |
| Cancer | n | Kaplan-Meier Logrank a | Random Genes (B = 1000) b | ||||||||||
|---|---|---|---|---|---|---|---|---|---|---|---|---|---|
| A | S | P | A, S | A, S, P | N | A | S | A, S | P | A, S, P | N | ||
| Breast | 1105 | 0.0057 | 0.0049 | 0.0004 | 0.0069 | 0.0015 | 0.0060 | 0.0790 | 0.0450 | 0.0050 | 0.0860 | 0.0350 | 0.0650 |
| Cervical | 309 | 0.0071 | 0.0014 | 0.0015 | 0.0100 | 0.0151 | 0.0088 | 0.2150 | 0.0630 | 0.0120 | 0.2530 | 0.0730 | 0.2810 |
| Colorectal | 633 | 0.0550 | 0.0255 | 0.0048 | 0.0188 | 0.0106 | 0.0330 | 0.2050 | 0.0700 | 0.0120 | 0.0450 | 0.0340 | 0.1160 |
| Liver | 379 | 0.0000 | 0.0002 | 0.0004 | 0.0001 | 0.0027 | 0.0001 | 0.1150 | 0.2220 | 0.0020 | 0.2140 | 0.0130 | 0.1720 |
| Lung | 522 | 0.0120 | 0.0008 | 0.0003 | 0.0021 | 0.0036 | 0.0070 | 0.4850 | 0.0560 | 0.0070 | 0.1030 | 0.0400 | 0.3570 |
| Lung SC | 505 | 0.0057 | 0.0050 | 0.0040 | 0.0050 | 0.0040 | 0.0057 | 0.0400 | 0.0290 | 0.0110 | 0.0290 | 0.0100 | 0.0330 |
| Ovarian | 603 | 0.0259 | 0.0088 | 0.0184 | 0.0722 | 0.0100 | 0.0183 | 0.2310 | 0.1250 | 0.2010 | 0.5240 | 0.0700 | 0.2060 |
| Melanoma | 479 | 0.0000 | 0.0001 | 0.0002 | 0.0000 | 0.0001 | 0.0001 | 0.0170 | 0.0710 | 0.0190 | 0.0250 | 0.0040 | 0.0670 |
| Renal CC | 538 | 0.0000 | 0.0000 | 0.0000 | 0.0000 | 0.0003 | 0.0000 | 0.2570 | 0.4230 | 0.0100 | 0.1340 | 0.2780 | 0.4710 |
| Renal Pap. | 292 | 0.0000 | 0.0001 | 0.0011 | 0.0000 | 0.0012 | 0.0000 | 0.0770 | 0.0100 | 0.1060 | 0.0040 | 0.0190 | 0.0320 |
| Stomach | 478 | 0.6412 | 0.0103 | 0.0180 | 0.0103 | 0.0107 | 0.6412 | 0.6570 | 0.0070 | 0.0300 | 0.0060 | 0.0160 | 0.6780 |
| Uterine | 548 | 0.0013 | 0.0024 | 0.0150 | 0.0010 | 0.0072 | 0.0009 | 0.0250 | 0.0390 | 0.3620 | 0.0070 | 0.1070 | 0.0190 |
| Cancer | Predictors | Upregulation Prolongs OS | Downregulation Prolongs OS |
|---|---|---|---|
| AML * | Genes | POLN | RAD23A, APEX2, EME2 |
| Pathways (%) | TLS (100.0) | DDS (33), BER (33), HRR (33), | |
| Bladder * | Genes | BLM, RAD9A, MGMT, LIG1, MUTYH, DDB1, ERCC5, XPC, FANCD2, MSH5, DCLRE1C, REV1 | FANCC, ALKBH2, APEX2, LIG3, POLB, GTF2H5, PMS1, PRKDC, REV3L |
| Pathways (%) | DDS (16.7), DRR (8.3), BER (16.7), NER (25.0), HRR (16.7), NHEJ (8.3), TLS (8.3) | DDS (11.1), DRR (11.1), BER (33.3), NER (11.1), MMR (11.1), NHEJ (11.1), TLS (11.1) | |
| Sarcoma * | Genes | MNAT1, APEX1, APTX, FEN1, NEIL3, DDB1, GTF2H3, FANCI, PRKDC | DCLRE1B, POLL, CUL4A, ERCC2, MSH2, FANCG |
| Pathways (%) | DDS (11.1), BER (44.4), NER (22.2), HRR (11.1), NHEJ (11.1) | DDS (16.7), BER (16.7), NER (33.3), MMR (16.7), HRR (16.7) | |
| Breast | Genes | RAD50, PMS1 | ATRIP, FANCC, RAD1, RFC3, NEIL3, EXO1, FANCB, FANCD2, FANCI, RAD51, XRCC4 |
| Pathways (%) | DDS (50.0), MMR (50.0) | DDS (36.4), BER (9.1), MMR (9.1), HRR (36.4), NHEJ (9.1) | |
| Colorectal | Genes | DCLRE1C | RAD23A, RFC2, POLL, MLH3, FANCL |
| Pathways (%) | NHEJ (100.0) | DDS (40.0), BER (20.0), MMR (20.0), HRR (20.0) | |
| Renal Papillary | Genes | RAD17, OGG1, DDB2, ERCC2 | BLM, RAD1, FEN1, LIG1, EXO1, MSH6, BRCA2, EME1, FANCB, LIG4 |
| Pathways (%) | DDS (25.0), BER (25.0), NER (50.0) | DDS (20.0), BER (20.0), MMR (20.0), HRR (30.0), NHEJ (10.0) | |
| Lung | Genes | RAD17, ALKBH3, MGMT, MPG, NEIL1, XPC, LIG4, POLK, REV3L | BRCA1, NBN, RAD1, NEIL3, MMS19, FANCI, XRCC5 |
| Pathways (%) | DDS (11.1), DRR (22.2), BER (22.2), NER (11.1), NHEJ (11.1), TLS (22.2) | DDS (42.9), BER (14.3), NER (14.3), HRR (14.3), NHEJ (14.3) | |
| Lung Sq. Cell | Genes | CHEK2, MNAT1, APTX, TDG, FANCE, FANCL | XRCC1 |
| Pathways (%) | DDS (33.3), BER (33.3), HRR (33.3) | BER (100.0) | |
| Melanoma | Genes | ATM, MNAT1, MBD4, NEIL1, ERCC5, RAD23B, DCLRE1C | MDC1, NBN, MUTYH, POLE, UNG, FANCE, FANCI, POLI, POLK |
| Pathways (%) | DDS (28.6), BER (28.6), NER (28.6), NHEJ (14.3) | DDS (22.2), BER (33.3), HRR (22.2), TLS (22.2) | |
| Stomach | Genes | CUL4A, POLQ | |
| Pathways (%) | NER (50.0), TLS (50.0) |
| Cluster | Cancer | Driver Genes | DNA Repair Genes | ||||
|---|---|---|---|---|---|---|---|
| Mut. | Del. | Amp. | Mut. | Del. | Amp. | ||
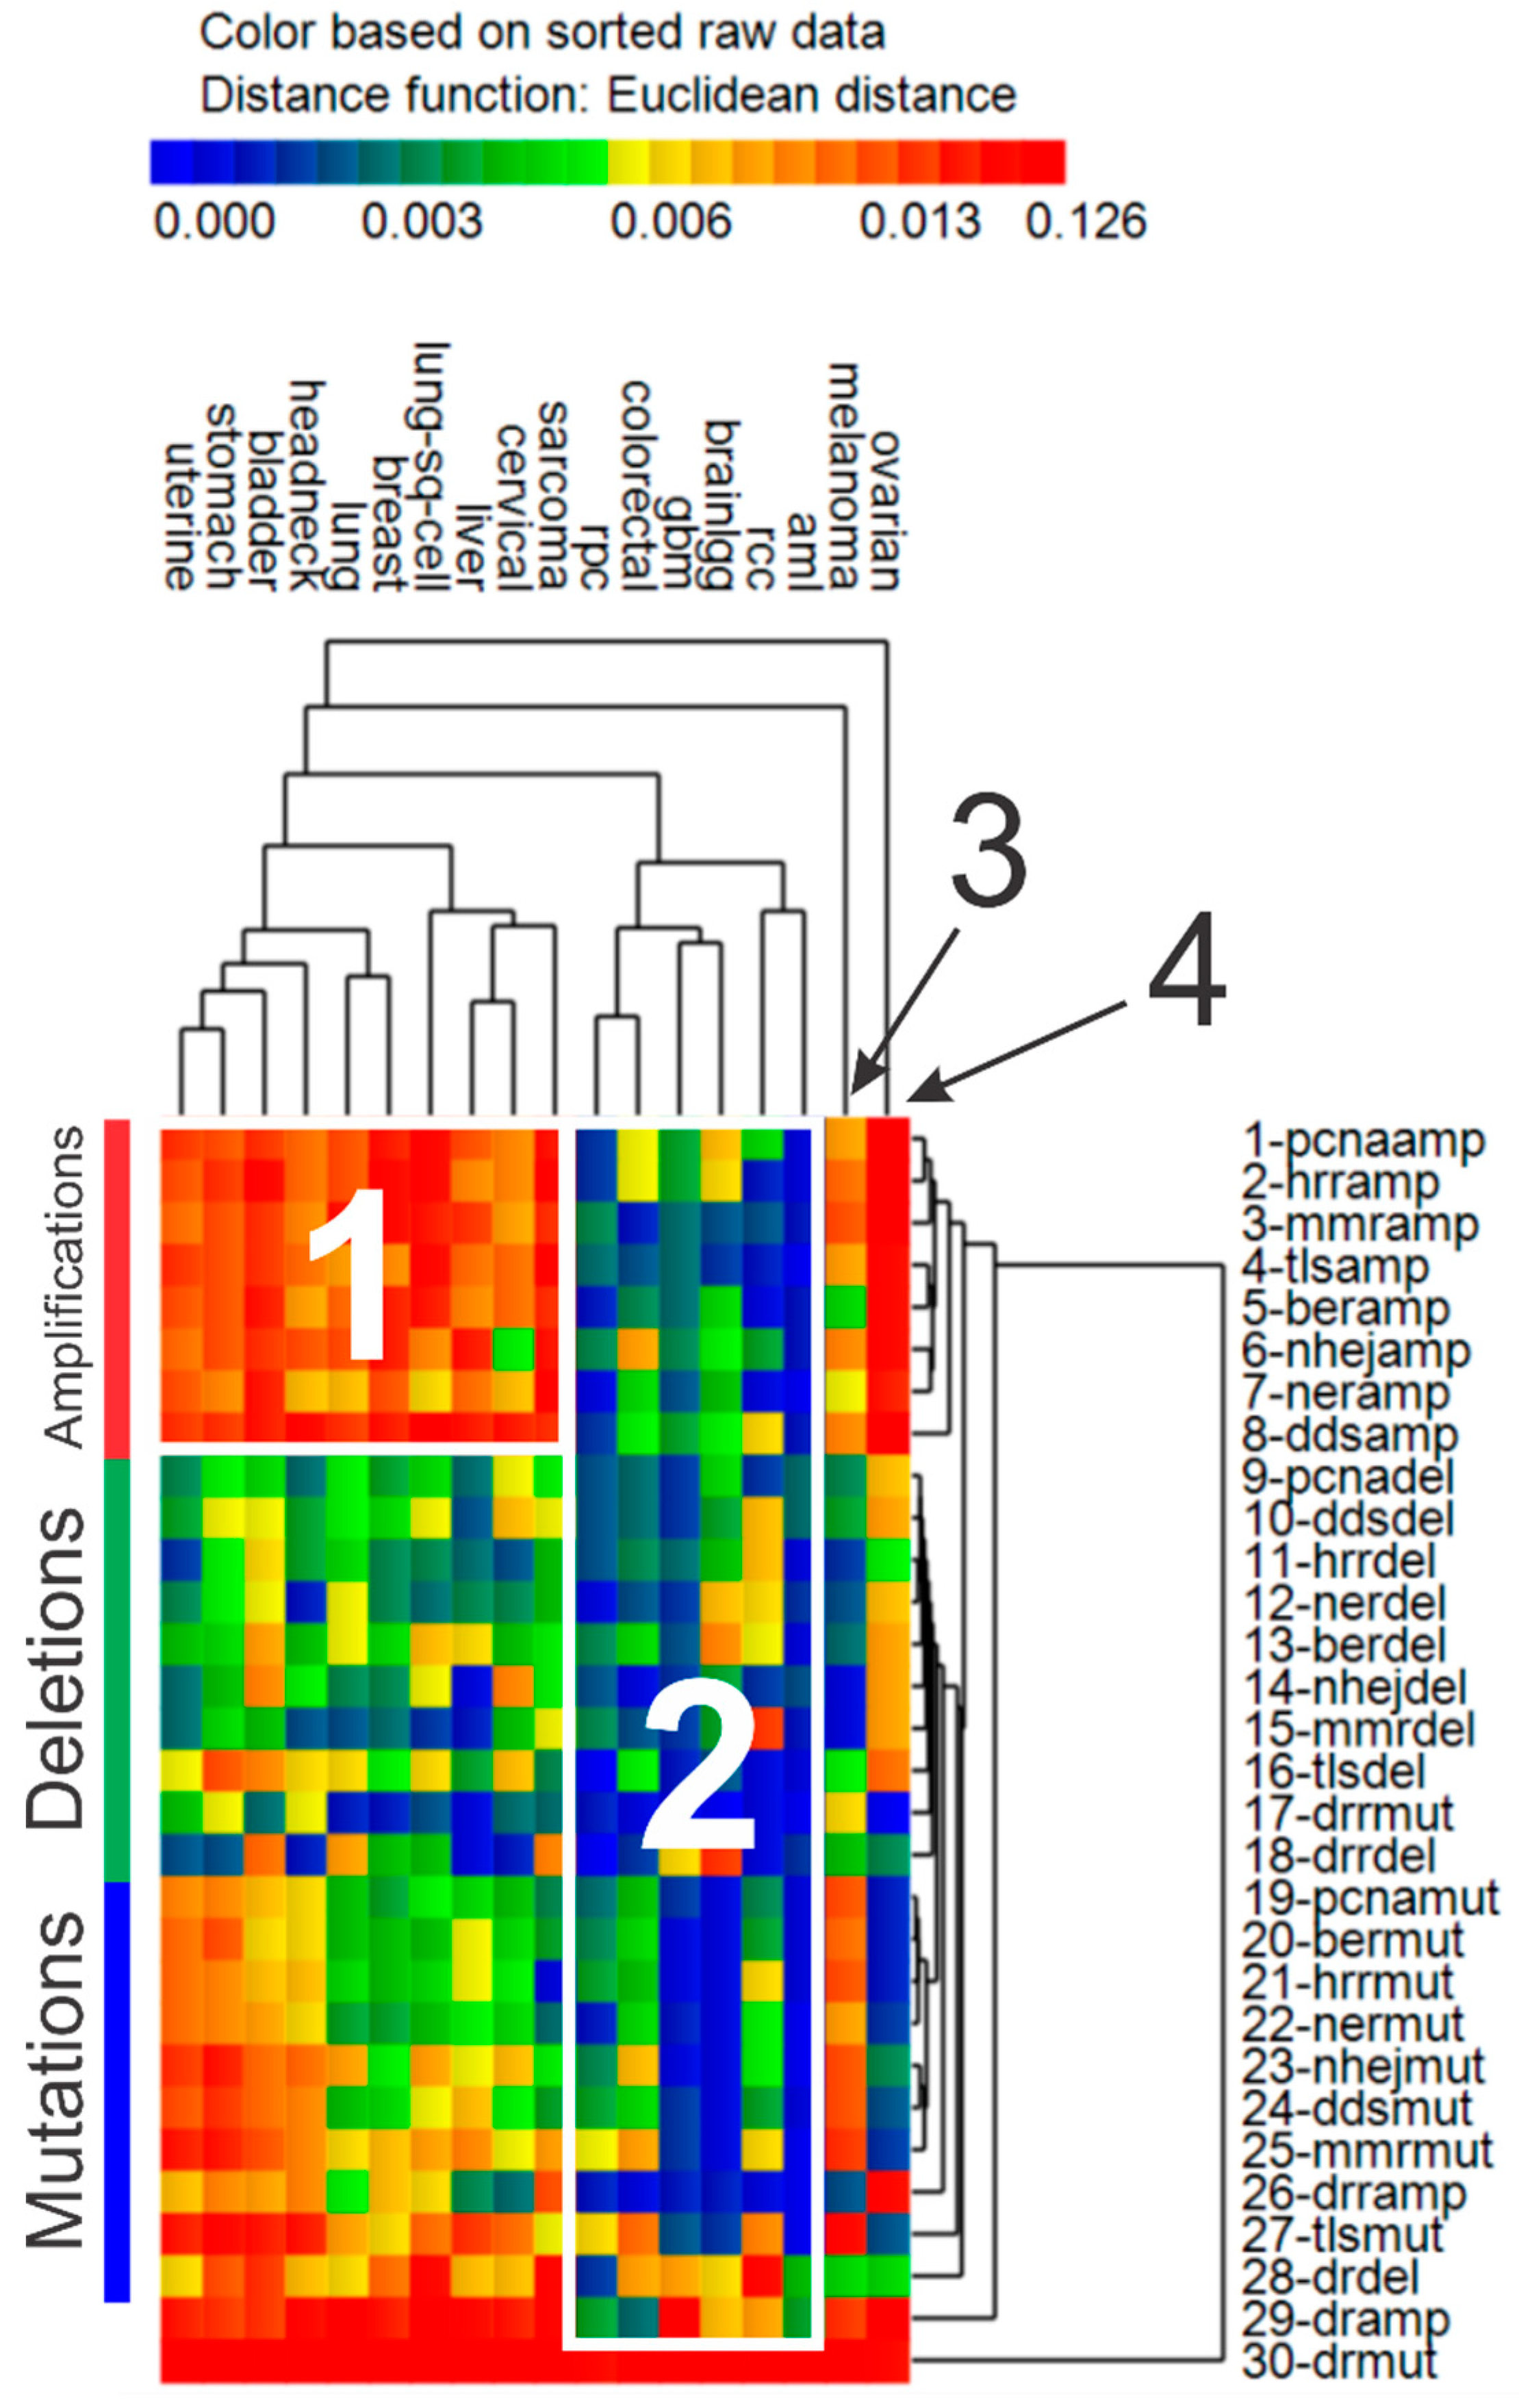
| 1 | Uterine *, stomach, bladder, head & neck *, lung, breast, lung sq. cell, liver, cervical *, sarcoma | ↑ | ↑ | ↑ | ↑ | ↓ | ↑ |
| 2 | AML, colorectal, GBM *, low grade gliomas *, renal papillary, renal clear cell * | ↑ | ↓ | ↓ | ↓ | ↓ | ↓ |
| 3 | Melanoma | ↑ | ↓ | ↑ | ↑ | ↓ | ↑ |
| 4 | Ovarian * | ↑ | ↓ | ↑ | ↓ | ↑ | ↑ |
© 2019 by the authors. Licensee MDPI, Basel, Switzerland. This article is an open access article distributed under the terms and conditions of the Creative Commons Attribution (CC BY) license (http://creativecommons.org/licenses/by/4.0/).
Share and Cite
Peterson, L.E.; Kovyrshina, T. DNA Repair Gene Expression Adjusted by the PCNA Metagene Predicts Survival in Multiple Cancers. Cancers 2019, 11, 501. https://doi.org/10.3390/cancers11040501
Peterson LE, Kovyrshina T. DNA Repair Gene Expression Adjusted by the PCNA Metagene Predicts Survival in Multiple Cancers. Cancers. 2019; 11(4):501. https://doi.org/10.3390/cancers11040501
Chicago/Turabian StylePeterson, Leif E., and Tatiana Kovyrshina. 2019. "DNA Repair Gene Expression Adjusted by the PCNA Metagene Predicts Survival in Multiple Cancers" Cancers 11, no. 4: 501. https://doi.org/10.3390/cancers11040501
APA StylePeterson, L. E., & Kovyrshina, T. (2019). DNA Repair Gene Expression Adjusted by the PCNA Metagene Predicts Survival in Multiple Cancers. Cancers, 11(4), 501. https://doi.org/10.3390/cancers11040501