
Radiomic Cancer Hallmarks to Identify High-Risk Patients in Non-Metastatic Colon Cancer

 , , , , , , , , and
Abstract
:Simple Summary
Abstract
1. Introduction
2. Materials and Methods
2.1. Patient Selection
2.2. CT Acquisition Protocol
2.3. CT Scans Segmentation Analysis
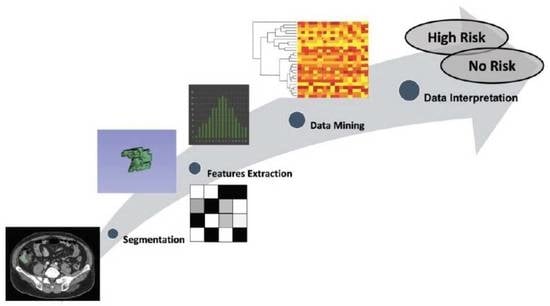
2.4. Radiomics Extraction
2.5. Statistical Analysis
3. Results
3.1. Study Population
3.2. Feature Selection and Radiomic Analysis
3.3. Univariate and Multivariate Analyses
4. Discussion
5. Conclusions
Author Contributions
Funding
Institutional Review Board Statement
Informed Consent Statement
Data Availability Statement
Conflicts of Interest
References
- Sung, H.; Ferlay, J.; Siegel, R.L.; Laversanne, M.; Soerjomataram, I.; Jemal, A.; Bray, F. Global Cancer Statistics 2020: GLOBOCAN Estimates of Incidence and Mortality Worldwide for 36 Cancers in 185 Countries. CA Cancer J. Clin. 2021, 71, 209–249. [Google Scholar] [CrossRef] [PubMed]
- Argilés, G.; Tabernero, J.; Labianca, R.; Hochhauser, D.; Salazar, R.; Iveson, T.; Laurent-Puig, P.; Quirke, P.; Yoshino, T.; Taieb, J.; et al. Localised colon cancer: ESMO Clinical Practice Guidelines for diagnosis, treatment and follow-up. Ann. Oncol. 2020, 31, 1291–1305. [Google Scholar] [CrossRef] [PubMed]
- Weiser, M.R. AJCC 8th Edition: Colorectal Cancer. Ann. Surg. Oncol. 2018, 25, 1454–1455. [Google Scholar] [CrossRef] [PubMed] [Green Version]
- Baxter, N.N.; Kennedy, E.B.; Bergsland, E.; Berlin, J.; George, T.J.; Gill, S.; Gold, P.J.; Hantel, A.; Jones, L.; Lieu, C.; et al. Adjuvant Therapy for Stage II Colon Cancer: ASCO Guideline Update. J. Clin. Oncol. 2022, 40, 892–910. [Google Scholar] [CrossRef]
- Babcock, B.D.; Aljehani, M.A.; Jabo, B.; Choi, A.H.; Morgan, J.W.; Selleck, M.J.; Luca, F.; Raskin, E.; Reeves, M.E.; Garberoglio, C.A.; et al. High-Risk Stage II Colon Cancer: Not All Risks Are Created Equal. Ann. Surg. Oncol. 2018, 25, 1980–1985. [Google Scholar] [CrossRef]
- Caruso, D.; Polici, M.; Zerunian, M.; Pucciarelli, F.; Guido, G.; Polidori, T.; Landolfi, F.; Nicolai, M.; Lucertini, E.; Tarallo, M.; et al. Radiomics in Oncology, Part 1: Technical Principles and Gastrointestinal Application in CT and MRI. Cancers 2021, 13, 2522. [Google Scholar] [CrossRef]
- Lambin, P.; Leijenaar, R.T.H.; Deist, T.M.; Peerlings, J.; de Jong, E.E.C.; van Timmeren, J.; Sanduleanu, S.; Larue, R.T.H.M.; Even, A.J.G.; Jochems, A.; et al. Radiomics: The bridge between medical imaging and personalized medicine. Nat. Rev. Clin. Oncol. 2017, 14, 749–762. [Google Scholar] [CrossRef]
- Caruso, D.; Polici, M.; Zerunian, M.; Pucciarelli, F.; Guido, G.; Polidori, T.; Landolfi, F.; Nicolai, M.; Lucertini, E.; Tarallo, M.; et al. Radiomics in Oncology, Part 2: Thoracic, Genito-Urinary, Breast, Neurological, Hematologic and Musculoskeletal Applications. Cancers 2021, 13, 2681. [Google Scholar] [CrossRef]
- Bourbonne, V.; Fournier, G.; Vallières, M.; Lucia, F.; Doucet, L.; Tissot, V.; Cuvelier, G.; Hue, S.; Le Penn Du, H.; Perdriel, L.; et al. External Validation of an MRI-Derived Radiomics Model to Predict Biochemical Recurrence after Surgery for High-Risk Prostate Cancer. Cancers 2020, 12, 814. [Google Scholar] [CrossRef] [Green Version]
- Botta, F.; Raimondi, S.; Rinaldi, L.; Bellerba, F.; Corso, F.; Bagnardi, V.; Origgi, D.; Minelli, R.; Pitoni, G.; Petrella, F.; et al. Association of a CT-Based Clinical and Radiomics Score of Non-Small Cell Lung Cancer (NSCLC) with Lymph Node Status and Overall Survival. Cancers 2020, 12, 1432. [Google Scholar] [CrossRef]
- Pernicka, J.S.G.; Gagniere, J.; Chakraborty, J.; Yamashita, R.; Nardo, L.; Creasy, J.M.; Petkovska, I.; Do, R.R.K.; Bates, D.D.B.; Paroder, V.; et al. Radiomics-based prediction of microsatellite instability in colorectal cancer at initial computed tomography evaluation. Abdom. Radiol. 2019, 44, 3755–3763. [Google Scholar] [CrossRef] [PubMed]
- Huang, X.; Cheng, Z.; Huang, Y.; Liang, C.; He, L.; Ma, Z.; Chen, X.; Wu, X.; Li, Y.; Liu, Z. CT-based Radiomics Signature to Discriminate High-grade From Low-grade Colorectal Adenocarcinoma. Acad. Radiol. 2018, 25, 1285–1297. [Google Scholar] [CrossRef] [PubMed]
- Eresen, A.; Li, Y.; Yang, J.; Shangguan, J.; Velichko, Y.; Yaghmai, V.; Benson, A.B.; Zhang, Z. Preoperative assessment of lymph node metastasis in Colon Cancer patients using machine learning: A pilot study. Cancer Imaging 2020, 20, 30. [Google Scholar] [CrossRef] [PubMed]
- Caruso, D.; Zerunian, M.; Ciolina, M.; de Santis, D.; Rengo, M.; Soomro, M.H.; Giunta, G.; Conforto, S.; Schmid, M.; Neri, E.; et al. Haralick’s texture features for the prediction of response to therapy in colorectal cancer: A preliminary study. Radiol. Med. 2018, 123, 161–167. [Google Scholar] [CrossRef] [PubMed]
- Coppola, F.; Giannini, V.; Gabelloni, M.; Panic, J.; Defeudis, A.; Lo Monaco, S.; Cattabriga, A.; Cocozza, M.A.; Pastore, L.V.; Polici, M.; et al. Radiomics and Magnetic Resonance Imaging of Rectal Cancer: From Engineering to Clinical Practice. Diagnostics 2021, 11, 756. [Google Scholar] [CrossRef]
- Alvarez-Jimenez, C.; Antunes, J.T.; Talasila, N.; Bera, K.; Brady, J.T.; Gollamudi, J.; Marderstein, E.; Kalady, M.F.; Purysko, A.; Willis, J.E.; et al. Radiomic Texture and Shape Descriptors of the Rectal Environment on Post-Chemoradiation T2-Weighted MRI are Associated with Pathologic Tumor Stage Regression in Rectal Cancers: A Retrospective, Multi-Institution Study. Cancers 2020, 12, 2027. [Google Scholar] [CrossRef]
- Bordron, A.; Rio, E.; Badic, B.; Miranda, O.; Pradier, O.; Hatt, M.; Visvikis, D.; Lucia, F.; Schick, U.; Bourbonne, V. External Validation of a Radiomics Model for the Prediction of Complete Response to Neoadjuvant Chemoradiotherapy in Rectal Cancer. Cancers 2022, 14, 1079. [Google Scholar] [CrossRef]
- Caruso, D.; Santis, D.D.; Rivosecchi, F.; Zerunian, M.; Panvini, N.; Montesano, M.; Biondi, T.; Bellini, D.; Rengo, M.; Laghi, A. Lean Body Weight-Tailored Iodinated Contrast Injection in Obese Patient: Boer versus James Formula. Biomed Res. Int. 2018, 2018, 8521893. [Google Scholar] [CrossRef] [Green Version]
- Caruso, D.; Rosati, E.; Panvini, N.; Rengo, M.; Bellini, D.; Moltoni, G.; Bracci, B.; Lucertini, E.; Zerunian, M.; Polici, M.; et al. Optimization of contrast medium volume for abdominal CT in oncologic patients: Prospective comparison between fixed and lean body weight-adapted dosing protocols. Insights Imaging 2021, 12, 40. [Google Scholar] [CrossRef]
- Griethuysen, J.J.M.v.; Fedorov, A.; Parmar, C.; Hosny, A.; Aucoin, N.; Narayan, V.; Beets-Tan, R.G.H.; Fillion-Robin, J.C.; Pieper, S.; Aerts, H. Computational Radiomics System to Decode the Radiographic Phenotype. Cancer Res. 2017, 77, e104–e107. [Google Scholar] [CrossRef] [Green Version]
- Yang, L.; Dong, D.; Fang, M.; Zhu, Y.; Zang, Y.; Liu, Z.; Zhang, H.; Ying, J.; Zhao, X.; Tian, J. Can CT-based radiomics signature predict KRAS/NRAS/BRAF mutations in colorectal cancer? Eur. Radiol. 2018, 28, 2058–2067. [Google Scholar] [CrossRef] [PubMed]
- Moons, K.G.; Altman, D.G.; Reitsma, J.B.; Ioannidis, J.P.; Macaskill, P.; Steyerberg, E.W.; Vickers, A.J.; Ransohoff, D.F.; Collins, G.S. Transparent Reporting of a multivariable prediction model for Individual Prognosis or Diagnosis (TRIPOD): Explanation and elaboration. Ann. Intern. Med. 2015, 162, W1-73. [Google Scholar] [CrossRef] [PubMed] [Green Version]
- Skancke, M.; Arnott, S.M.; Amdur, R.L.; Siegel, R.S.; Obias, V.J.; Umapathi, B.A. Lymphovascular Invasion and Perineural Invasion Negatively Impact Overall Survival for Stage II Adenocarcinoma of the Colon. Dis. Colon Rectum 2019, 62, 181–188. [Google Scholar] [CrossRef]
- Bodalal, Z.; Trebeschi, S.; Nguyen-Kim, T.D.L.; Schats, W.; Beets-Tan, R. Radiogenomics: Bridging imaging and genomics. Abdom. Radiol. 2019, 44, 1960–1984. [Google Scholar] [CrossRef] [PubMed] [Green Version]
- Filitto, G.; Coppola, F.; Curti, N.; Giampieri, E.; Dall’Olio, D.; Merlotti, A.; Cattabriga, A.; Cocozza, M.A.; Tomassoni, M.T.; Remondini, D.; et al. Automated Prediction of the Response to Neoadjuvant Chemoradiotherapy in Patients Affected by Rectal Cancer. Cancers 2022, 14, 2231. [Google Scholar] [CrossRef] [PubMed]
- Rollvén, E.; Blomqvist, L.; Öistämö, E.; Hjern, F.; Csanaky, G.; Abraham-Nordling, M. Morphological predictors for lymph node metastases on computed tomography in colon cancer. Abdom. Radiol. 2019, 44, 1712–1721. [Google Scholar] [CrossRef] [Green Version]
- Yao, X.; Sun, C.; Xiong, F.; Zhang, X.; Cheng, J.; Wang, C.; Ye, Y.; Hong, N.; Wang, L.; Liu, Z.; et al. Radiomic signature-based nomogram to predict disease-free survival in stage II and III colon cancer. Eur. J. Radiol. 2020, 131, 109205. [Google Scholar] [CrossRef]
- Weiss, J.M.; Schumacher, J.; Allen, G.O.; Neuman, H.; Lange, E.O.; Loconte, N.K.; Greenberg, C.C.; Smith, M.A. Adjuvant chemotherapy for stage II right-sided and left-sided colon cancer: Analysis of SEER-medicare data. Ann. Surg. Oncol. 2014, 21, 1781–1791. [Google Scholar] [CrossRef] [Green Version]
- Casadaban, L.; Rauscher, G.; Aklilu, M.; Villenes, D.; Freels, S.; Maker, A.V. Adjuvant chemotherapy is associated with improved survival in patients with stage II colon cancer. Cancer 2016, 122, 3277–3287. [Google Scholar] [CrossRef]
- Li, M.; Zhang, J.; Dan, Y.; Yao, Y.; Dai, W.; Cai, G.; Yang, G.; Tong, T. A clinical-radiomics nomogram for the preoperative prediction of lymph node metastasis in colorectal cancer. J. Transl. Med. 2020, 18, 46. [Google Scholar] [CrossRef] [Green Version]
- Mohan, H.M.; Ryan, E.; Balasubramanian, I.; Kennelly, R.; Geraghty, R.; Sclafani, F.; Fennelly, D.; McDermott, R.; Ryan, E.J.; O’Donoghue, D.; et al. Microsatellite instability is associated with reduced disease specific survival in stage III colon cancer. Eur. J. Surg. Oncol. 2016, 42, 1680–1686. [Google Scholar] [CrossRef] [PubMed]
- André, T.; Shiu, K.K.; Kim, T.W.; Jensen, B.V.; Jensen, L.H.; Punt, C.; Smith, D.; Garcia-Carbonero, R.; Benavides, M.; Gibbs, P.; et al. Pembrolizumab in Microsatellite-Instability-High Advanced Colorectal Cancer. N. Engl. J. Med. 2020, 383, 2207–2218. [Google Scholar] [CrossRef] [PubMed]
- Caruso, D.; Zerunian, M.; Pucciarelli, F.; Bracci, B.; Polici, M.; D’Arrigo, B.; Polidori, T.; Guido, G.; Barbato, L.; Polverari, D.; et al. Influence of Adaptive Statistical Iterative Reconstructions on CT Radiomic Features in Oncologic Patients. Diagnostics 2021, 11, 1000. [Google Scholar] [CrossRef] [PubMed]


| High Risk (58/108) | N Patients | % | No Risk (50/108) | N Patients | % |
|---|---|---|---|---|---|
| T | T | ||||
| 1 | 1.7 |
| 1 | 2 |
| 3 | 5.2 |
| 8 | 16 |
| 33 | 56.9 |
| 41/50 | 82 |
| 17 | 29.3 |
| 0/50 | 0 |
| 4 | 6.9 |
| 0/50 | 0 |
| LVI | LVI | ||||
| 36/58 | 62 |
| 0/50 | - |
| 22/58 | 38 |
| 50/50 | 100 |
| PNI | PNI | ||||
| 4/58 | 6.9 |
| 0/50 | - |
| 54/58 | 93.1 |
| 50/50 | 100 |
| BUDDING | BUDDING | ||||
| 34/58 | 58.6 |
| 0/50 | - |
| 24/58 | 41.4 |
| 50/50 | 100 |
| Nodes |
| ||||
| 42/58 | 72.5 |
| 50/50 | 100 |
| 4/58 | 6.9 |
| - | - |
| 5/58 | 8.6 |
| - | - |
| 5/58 | 8.6 |
| - | - |
| 2/58 | 3.4 |
| - | - |
| MSI | 6/58 | 10.3 | MSI | 10/50 | 20 |
| Tumor location | Tumor location | ||||
| 29/58 | 50 |
| 24/50 | 48 |
| 3/58 | 5.2 |
| 3/50 | 6 |
| 26/59 | 44.8 |
| 23/50 | 46 |
| Radiomic Features | High Risk | No Risk | ICC | p |
|---|---|---|---|---|
| Mean ± SD | Mean ± SD | |||
| Shape_LeastAxisLength | 23.34 ± 10.43 | 28.38 ± 12.24 | 0.82 | 0.02 |
| Shape_Maximum2DDiameterColumn | 43.20 ± 18.48 | 56.74 ± 23.58 | 0.87 | 0.003 |
| Shape_Maximum2DDiameterSlice | 49.30 ± 19.09 | 58.63 ± 22.76 | 0.90 | 0.02 |
| Shape_MeshVolume | 21,047.06 ± 26,389.25 | 39,659.83 ± 43,204.46 | 0.81 | 0.02 |
| Shape_MinorAxisLength | 31.52 ± 11.29 | 38.45 ± 13.76 | 0.91 | 0.004 |
| Shape_SurfaceArea | 6507.93 ± 4960.29 | 10,070.17 ± 7988.04 | 0.87 | 0.02 |
| Shape_SurfaceVolumeRatio | 0.46 ± 0.19 | 0.38 ± 0.16 | 0.85 | 0.02 |
| Shape_Maximum3DDiameter | 56.72 ± 22.63 | 65.57 ± 24.46 | 0.89 | 0.07 |
| First Order_VoxelVolume | 21,532.50 ± 26,508.12 | 40,253.22 ± 43,386.76 | 0.91 | 0.009 |
| First Order_Energy | 5,272,857.19 ± 6,465,846.03 | 9,614,816.02 ± 10,922,495.83 | 0.90 | 0.03 |
| First Order_TotalEnergy | 142,367,144.12 ± 174,577,842.8 | 259,600,032.54 ± 294,907,387.3 | 0.86 | 0.03 |
| First Order_Maximum | 149.91 ± 30.88 | 147.02 ± 27.59 | 0.82 | 0.61 |
| First Order_Mean | 74.72 ± 15.85 | 72.08 ± 18.64 | 0.88 | 0.81 |
| GLCM_Idmn | 0.98 ± 0.01 | 0.98 ± 0.01 | 0.89 | 0.03 |
| GLCM_Icm2 | 0.29 ± 0.10 | 0.26 ± 0.09 | 0.85 | 0.08 |
| GLCM_SumAverage | 9.55 ± 6.30 | 11.28 ± 7.01 | 0.85 | 0.16 |
| GLDM_DependenceNonUniformity | 39.95 ± 42.32 | 70.22 ± 72.70 | 0.87 | 0.02 |
| GLDM_GrayLevelNonUniformity | 439.23 ± 537.16 | 877.22 ± 985.89 | 0.86 | 0.01 |
| GLDM_LargeDependenceEmphasis | 152.75 ± 71.20 | 185.66 ± 83.91 | 0.88 | 0.02 |
| GLDM_SmallDependenceEmphasis | 0.06 ± 0.03 | 0.05 ± 0.02 | 0.90 | 0.03 |
| GLDM_SmallDependenceLowGrayLevelEmphasis | 0.02 ± 0.01 | 0.01 ± 0.01 | 0.89 | 0.06 |
| GLRLM_GrayLevelNonUniformity | 199.18 ± 202.85 | 342.55 ± 321.67 | 0.88 | 0.02 |
| GLRLM_LongRunEmphasis | 4.34 ± 2.62 | 5.61 ± 3.63 | 0.85 | 0.03 |
| GLRLM_RunLengthNonUniformityNormalized | 0.47 ± 0.09 | 0.43 ± 0.10 | 0.81 | 0.02 |
| GLRLM_RunPercentage | 0.62 ± 0.09 | 0.58 ± 0.11 | 0.82 | 0.04 |
| GLRLM_RunVariance | 1.37 ± 1.10 | 2.04 ± 1.92 | 0.87 | 0.04 |
| GLRLM_ShortRunEmphasis | 0.70 ± 0.07 | 0.67 ± 0.08 | 0.87 | 0.03 |
| GLSZM_ LargeAreaEmphasis | 12,801.55 ± 22,785.03 | 32,877.79 ± 45,848.79 | 0.90 | 0.006 |
| GLSZM_ LargeAreaHighGrayLevelEmphasis | 609,276.79 ± 17,04,878.107 | 1,908,734.67 ± 4,536,097.03 | 0.90 | 0.01 |
| GLSZM_ LargeAreaLowGrayLevelEmphasis | 693.99 ± 1,234.32 | 1714.36 ± 3566.59 | 0.82 | 0.03 |
| GLSZM_SmallAreaEmphasis | 0.58 ± 0.17 | 0.64 ± 0.11 | 0.87 | 0.04 |
| GLSZM_ZonePercentage | 0.07 ± 0.04 | 0.05 ± 0.04 | 0.89 | 0.01 |
| GLSZM_ZoneVariance | 12,224.58 ± 22,231.55 | 31,666.31 ± 44,755.72 | 0.91 | 0.008 |
| GLSZM_ SmallAreaHighGrayLevelEmphasis | 16.35 ± 29.18 | 23.66 ± 31.59 | 0.90 | 0.06 |
| NGTDM_ Coarseness | 0.04 ± 0.06 | 0.02 ± 0.04 | 0.88 | 0.01 |
| Radiomic Variable | Internal Cohort Radiomic Model | External Cohort | ||
|---|---|---|---|---|
| OR (95% CI) | Coefficient | OR (95% CI) | Coefficient | |
| Shape_SurfaceVolumeRatio | 0.79 (7.82 × 10⁻²² to 5.42 × 1030) | −0.24 | 227.1 (6.65 × 10⁻⁵ to 1,771,984,111) | 5.42 |
| GLCM_Idmn | 3,647,282,668 (2.973 × 10⁻¹⁰ to 1.16 × 10+30) | 22.02 | 1.21 × 10+20 (2.07 × 10⁻²⁸ to 1.05 × 10+74) | 46.25 |
| GLRLM_LongRunEmphasis | 0.02 (0.0003 to 1.42) | −3.63 | 58.36 (0.0004 to 183,464,701) | 4.067 |
| GLRLM_RunLengthNonUniformityNormalized | 5.99 × 10+14 (3.38 × 10⁻¹⁵ to 1.37 × 10+44) | 34.03 | 8.20 × 10+38 (9.29 × 10−60 to 5.55 × 10+145) | 89.60 |
| GLRLM_RunPercentage | 4.7 × 10+18 (0.005 to 1.66 × 10+42) | 42.99 | 1.54 × 10−54 (1.33 × 10−131 to 126,781) | −123.9 |
| GLRLM_RunVariance | 1537 (1.24 to 4,121,443) | 7.34 | 1.89 × 10⁻⁵ (1 × 10⁻¹⁷ to 36,401) | −10.87 |
| GLRLM_ShortRunEmphasis | 3.54 × 10−45 (2.35 × 10−88 to 0.0006) | 102.4 | 735,727,550 (1.49 × 10−77 to 1.94 × 10+100) | 20.42 |
| GLSZM_SmallAreaEmphasis | 38.22 (0.49 to 3684) | 3.64 | 0.89 (9.58 × 10⁻⁶ to 64,647) | −0.11 |
| GLSZM_ZonePercentage | 6.87 × 10⁻⁸ (6.04 × 10⁻¹⁹ to 1659) | −16.49 | 42,583,803 (1.39 × 10⁻²² to 1.75 × 10+40) | 17.57 |
| p value | <0.0001 | 0.02 | ||
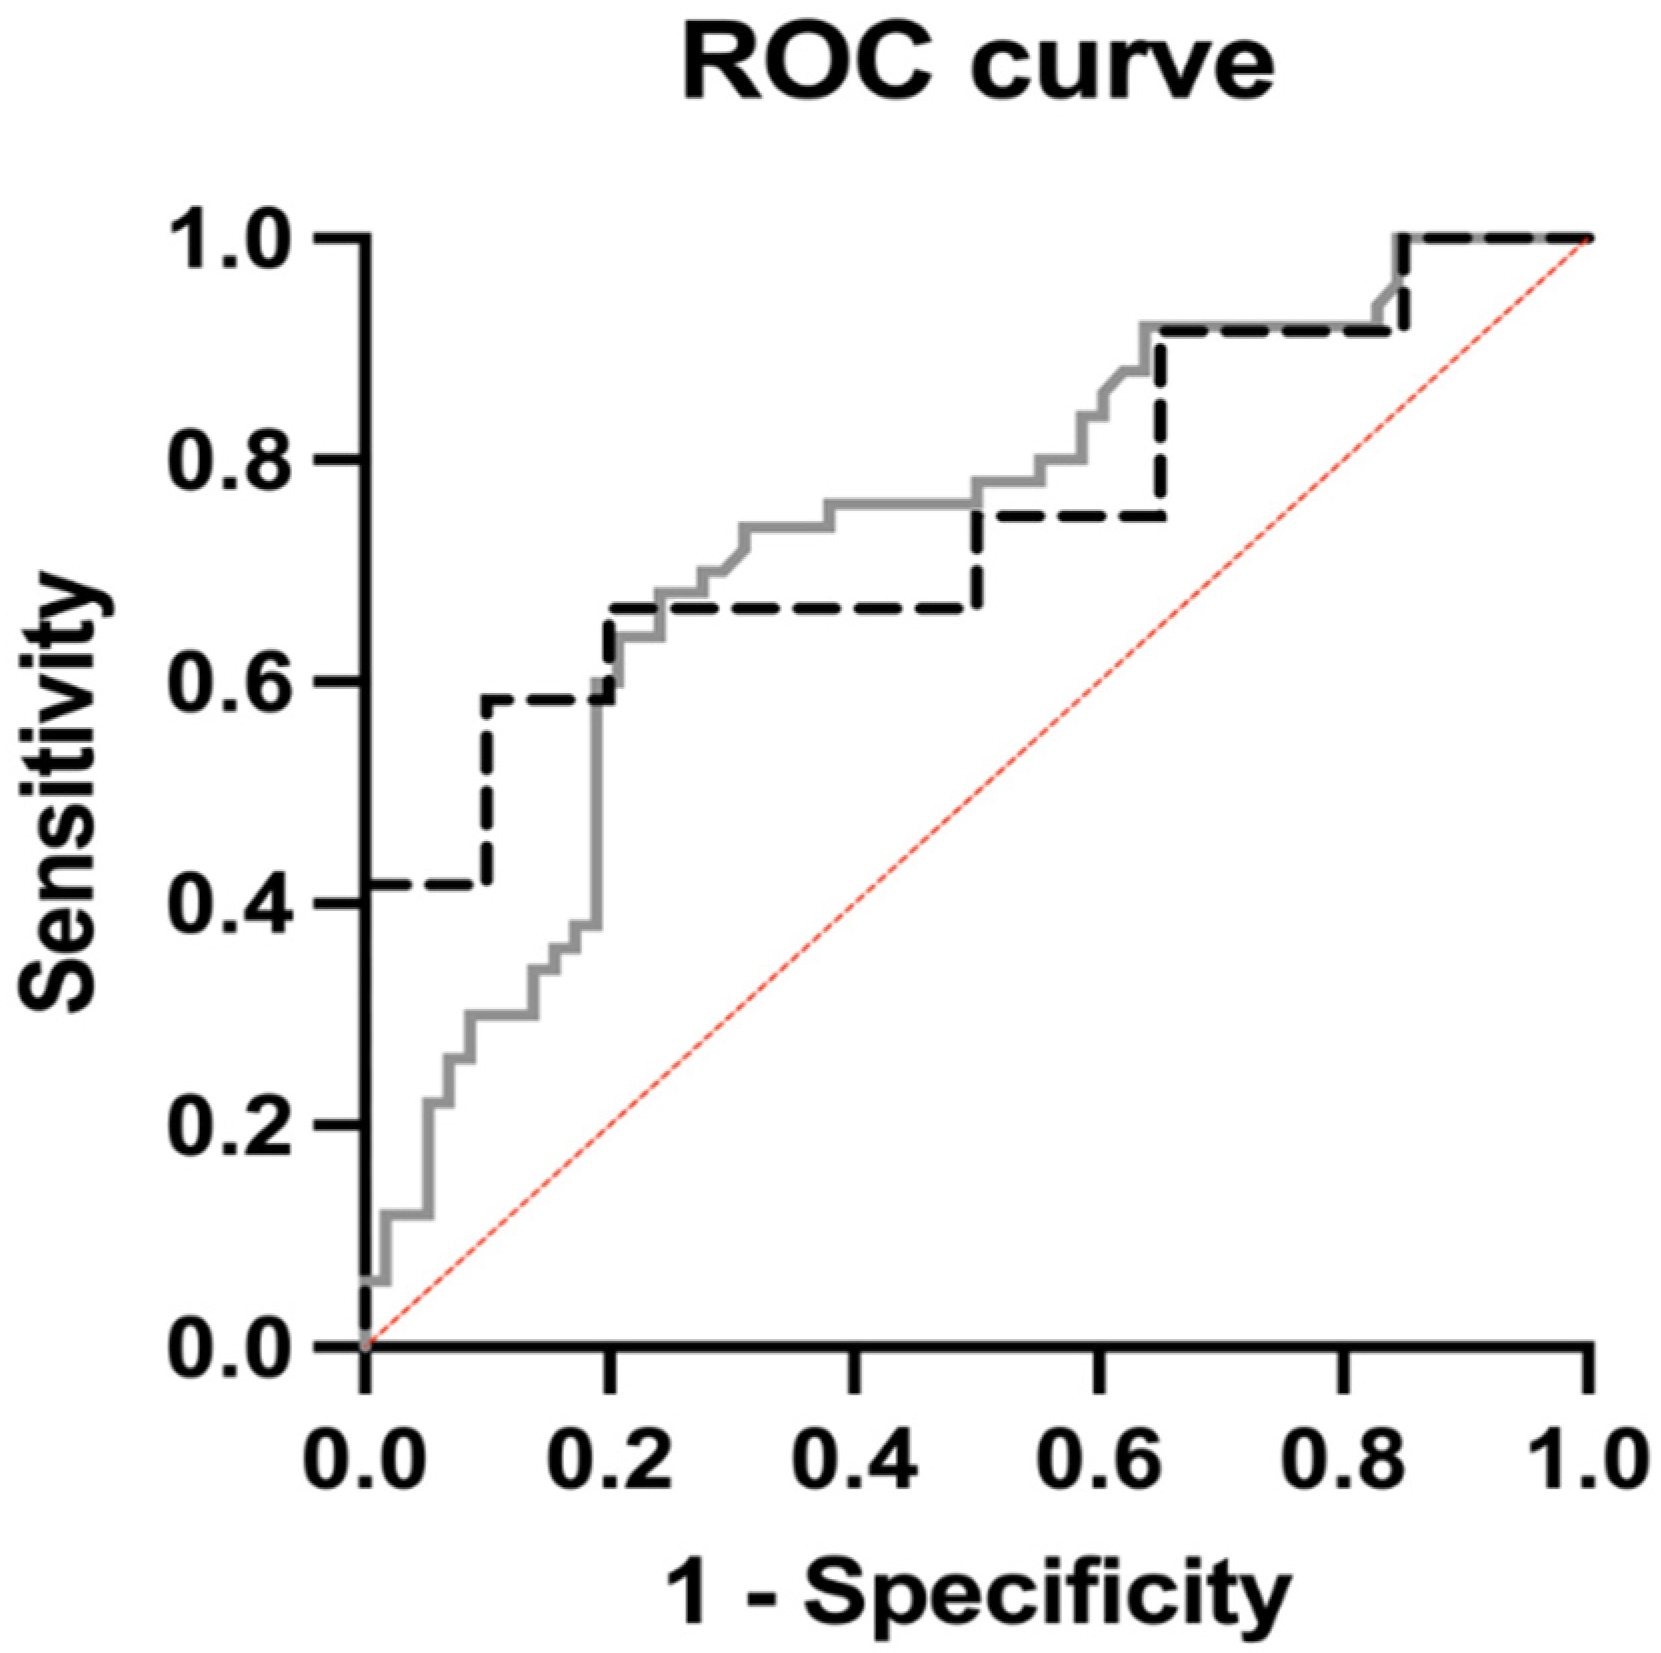
| AUC | 0.73 | 0.75 | ||
| Positive Predictive Power | 71.4% | 70% | ||
| Negative Predictive Power | 69.7% | 77.3% | ||
Publisher’s Note: MDPI stays neutral with regard to jurisdictional claims in published maps and institutional affiliations. |
© 2022 by the authors. Licensee MDPI, Basel, Switzerland. This article is an open access article distributed under the terms and conditions of the Creative Commons Attribution (CC BY) license (https://creativecommons.org/licenses/by/4.0/).
Share and Cite
Caruso, D.; Polici, M.; Zerunian, M.; Del Gaudio, A.; Parri, E.; Giallorenzi, M.A.; De Santis, D.; Tarantino, G.; Tarallo, M.; Dentice di Accadia, F.M.; et al. Radiomic Cancer Hallmarks to Identify High-Risk Patients in Non-Metastatic Colon Cancer. Cancers 2022, 14, 3438. https://doi.org/10.3390/cancers14143438
Caruso D, Polici M, Zerunian M, Del Gaudio A, Parri E, Giallorenzi MA, De Santis D, Tarantino G, Tarallo M, Dentice di Accadia FM, et al. Radiomic Cancer Hallmarks to Identify High-Risk Patients in Non-Metastatic Colon Cancer. Cancers. 2022; 14(14):3438. https://doi.org/10.3390/cancers14143438
Chicago/Turabian StyleCaruso, Damiano, Michela Polici, Marta Zerunian, Antonella Del Gaudio, Emanuela Parri, Maria Agostina Giallorenzi, Domenico De Santis, Giulia Tarantino, Mariarita Tarallo, Filippo Maria Dentice di Accadia, and et al. 2022. "Radiomic Cancer Hallmarks to Identify High-Risk Patients in Non-Metastatic Colon Cancer" Cancers 14, no. 14: 3438. https://doi.org/10.3390/cancers14143438