Article

Multigene Profiling of Circulating Tumor Cells in Esophageal Squamous Cell Carcinoma Identifies Prognostic Cancer Driver Genes Associated with Epithelial-Mesenchymal-Transition Progression and Chemoresistance

1
Department of Clinical Oncology, School of Clinical Medicine, University of Hong Kong, Hong Kong, China
2
Department of Surgery, School of Clinical Medicine, University of Hong Kong, Hong Kong, China
*
Authors to whom correspondence should be addressed.
Cancers 2023, 15(22), 5329; https://doi.org/10.3390/cancers15225329
Submission received: 20 September 2023 / Revised: 15 October 2023 / Accepted: 2 November 2023 / Published: 8 November 2023

Abstract

:

Simple Summary

Esophageal squamous cell carcinoma (ESCC) is a malignancy characterized by high mortality and dismal quality of life. Circulating tumor cells (CTCs), considered precursors of distant metastasis, can be analyzed using a non-invasive liquid biopsy approach to identify patients at risk of cancer progression or recurrence. The current study employed an unbiased size-based CTC enrichment strategy in combination with quantitative reverse transcription polymerase chain reaction (RT-qPCR) to investigate gene transcripts as potential biomarkers in the bloodstream. We categorized 83.6% (46/55) of ESCC patients as CTC-positive, each displaying at least two detected markers. Furthermore, 50.9% (28/55) of ESCC patients were identified as CTC-high, showing at least five detected markers using a 10-gene CTC panel. The presence of specific markers, namely TWIST1, VEGFC, CCND1, and TFRC, was significantly associated with shorter survival of the patients, suggesting their prognostic values as liquid biopsy markers to guide clinical ESCC treatment decisions and enhance treatment efficacy.

Abstract

We investigated the clinical significance of CTCs in cancer progression by detecting multiple cancer driver genes associated with epithelial-to-mesenchymal transition (EMT) at the transcript level. The 10-gene panel, comprising CCND1, ECT2, EpCAM, FSCN1, KRT5, KRT18, MET, TFRC, TWIST1, and VEGFC, was established for characterizing CTCs from mouse ESCC xenograft models and clinical ESCC peripheral blood (PB) samples. Correlations between gene expression in CTCs from PB samples (n = 77) and clinicopathological features in ESCC patients (n = 55) were examined. The presence of CTCs at baseline was significantly correlated with tumor size (p = 0.031). The CTC-high patients were significantly correlated with advanced cancer stages (p = 0.013) and distant metastasis (p = 0.029). High mRNA levels of TWIST1 (Hazard Ratio (HR) = 5.44, p = 0.007), VEGFC (HR = 6.67, p < 0.001), TFRC (HR = 2.63, p = 0.034), and EpCAM (HR = 2.53, p = 0.041) at baseline were significantly associated with a shorter overall survival (OS) in ESCC patients. This study also revealed that TWIST1 facilitates EMT and enhances malignant potential by promoting tumor migration, invasion, and cisplatin chemoresistance through the TWIST1-TGFBI-ZEB1 axis in ESCC, highlighting the prognostic and therapeutic potential of TWIST1 in clinical ESCC treatment.

1. Introduction

Esophageal cancer (EC) ranks as the ninth most prevalent cancer and the sixth leading cause of global cancer deaths [1], with esophageal squamous cell carcinoma (ESCC) being the most predominant pathological subtype and contributing to 85% of all EC cases in 2020 [2].
The ESCC five-year survival rate is far from satisfactory and under 20%, primarily attributed to late presentation and technical challenges for the detection of metastasis and effective treatment options available for metastatic ESCC [3,4]. At diagnosis, approximately 32% of EC patients have regional disease and 50% of patients have evidence of distant metastatic disease, which largely prevents early intervention of ESCC with curative treatments [5]. Currently, a lack of insight regarding the molecular mechanisms contributing to its metastatic progression remains a challenge.
Shedding from primary sites and dissemination into the bloodstream, circulating tumor cells (CTCs) are known to be associated with epithelial–mesenchymal-transition (EMT) and malignant progression of cancer cells [6,7] (Figure 1). These EMT-converted CTCs present in liquid biopsies could provide predictive or prognostic markers for monitoring cancer metastatic progression in cancer patients [8]. Despite numerous studies investigating CTCs in ESCC, the exact molecular mechanisms and intricacies of ESCC metastasis remain incompletely comprehended [9,10]. This is probably attributed to the exceptional scarcity and fragility of CTCs, as well as a deficiency in sensitive and reliable approaches for detection. Hence, innovative combined strategies for discovering and disseminating CTCs have the potential to pave the way for the development of novel therapeutic approaches for ESCC.
Previous CTC detection rates in ESCC using the CellSearch® EpCAM-based selection approach range from 18% in surgically resectable cases to 28–50% in unresectable cases [11,12]. To mitigate potential biases stemming from EpCAM-based enrichment, non-immunomagnetic-based CTC technologies can be used to retrieve a more comprehensive population of CTCs for molecular subtyping [13,14]. The novel ClearCell®FX1 System enriches CTCs from blood samples using a microfluidic chip based on differential cancer cell size and deformability [13]. Based on this unbiased size-based enrichment strategy, various CTC subtypes can be identified, including epithelial, mesenchymal, and hybrid EMT phenotypes. Our previous studies using this platform demonstrated that continuous real-time monitoring of circulating tumor cells over time can offer valuable prognostic and predictive insights into treatment effectiveness, disease recurrence, and survival outcomes in advanced ESCC [15].
In this study, we hypothesized that molecular characterization of CTCs by sensitive qPCR assay with EMT property that facilitates their detachment from the primary tumor was useful to identify prognostic biomarkers for advanced ESCC patients. We successfully established CTC enrichment by size separation with a microfluidic device and a 10-gene panel to molecularly detect CTCs by mRNA profiling. Our longitudinal CTC monitoring findings demonstrated that high CTC phenotypes with high expression of TWIST1, VEGFC, TFRC, and EpCAM at baseline blood are unfavorable prognostic factors for survival in a cohort of 55 patients with locally advanced and metastatic ESCC. Further functional studies of TWIST1 revealed its involvement in EMT progression and cisplatin chemoresistance in ESCC. In conclusion, our findings highlight TWIST1, as a sensitive biomarker for detecting CTCs and as a promising therapeutic target for the treatment of ESCC.

2. Materials and Methods

2.1. Cell Culture

ESCC cell lines, including KYSE-30 (Cellosaurus ID: CVCL_1351), KYSE70 (CVCL_1356), KYSE150 (CVCL_1348), KYSE180 (CVCL_1349), KYSE270 (CVCL_1350), KYSE450 (CVCL_1353), and KYSE510 (CVCL_1354) were cultured in a RPMI 1640 medium, supplemented with 10% fetal bovine serum (FBS), 1% penicillin-streptomycin (Invitrogen, Waltham, MA, USA) at 37 °C with 5% CO2. The cell lines were routinely tested and maintained negative for mycoplasma contamination.

2.2. Spike-in Experiments

The CTC recovery rate in spike-in experiments was routinely monitored using two different-sized ESCC cell lines (KYSE30 and KYSE270) in 7.5 mL of healthy blood, as previously described [10]. The mean recovery rate for each cell line (~200 cells) was 73.43 ± 8% for KYSE30 (average size ~17 μm) and 62 ± 10% for KYSE270 (average size ~15 μm), ensuring reproducibility of the CTC enrichment. With the 10× Chromium Single Cell Gene Expression assay for exploring transcriptomic cellular heterogeneity, a total of 200 KYSE270 cells were identified and spiked into 7.5 mL healthy blood, followed by CTC enrichment with ClearCell®FX1 system (Biolidics, Singapore), library preparation (Chromium Single Cell 3’ v2 Reagent Kit, 10× Genomics®, Pleasanton, CA, USA) and sequencing as previously described [16]. For the RT-qPCR assay, KYSE30 and KYSE270 cells were directly spiked into 50,000 peripheral blood mononuclear cells (PBMCs) at ratios ranging from 1:100 to 1:10,000 without prior enrichment, followed by further RNA extraction.

2.3. Patient and Sample Collection

A total of 55 ESCC patients and 4 colorectal cancer (CRC) patients at Queen Mary Hospital between 2020 and 2023 were studied. The enrolled ESCC patients were categorized into two groups: the palliative treatment group (Palliative CT/CTRT, n = 24) and the curative treatment group (Curative CTRT/upfront surgery/Neoadjuvant CT + surgery, n = 31), based on their clinical treatment history. A total of 81 PB samples (ESCC = 77, CRC = 4) were collected from these 59 patients. The timeline for collecting PB specimens for CTC detection included a baseline time point taken before treatment for each patient [10,15]. For patients, who received palliative treatments, the pre-III time point was captured after two CT cycles. For patients undergoing curative treatments, CTC detection was conducted one month after surgery. Consent for the collection of samples from ESCC patients was obtained following protocols approved by the Institutional Review Board (IRB) of the University of Hong Kong/Hospital Authority Hong Kong West Cluster (HKU/HA HKW IRB). The study was conducted in compliance with the principles of the Declaration of Helsinki.

2.4. CTC Enrichment, RNA Extraction and RT-qPCR

PB samples (7.5 mL) were collected using VACUETTE® EDTA tubes and processed for CTC enrichment using CTChip®FR1 microfluidic chips (ClearCell®FX1 System, Biolidics, Singapore), as previously described [15,17]. Total RNA was isolated using the TRIzolTM Reagent (Invitrogen, Carlsbad, CA, USA) as per the manufacturer’s instructions. Complementary DNA was synthesized from total RNA using SuperScript® IV Reverse Transcriptase (Invitrogen, CA, USA) with oligo-dT (Promega, Madison, WI, USA) under the following conditions: 65 °C for 5 min, 55 °C for 10 min, 80 °C for 10 min, and then held at 4 °C. The transcript level of target genes (n = 44) was determined using a two-step quantitative PCR technique with FastStartTM Universal SYBR Master (Rox) (Roche, Basel, Switzerland) on the LightCycler® 480 System (Roche Diagnostics, Basel, Switzerland), following the manufacturer’s instructions. The 2−ΔΔCt method was used to calculate fold changes normalized to GAPDH, with genes considered positively expressed at fold change values exceeding 2. All primers used in this study for RT-qPCR are listed in Table S1.

2.5. Lentivirus Preparation and Transfection

Clustered Regularly Interspaced Short Palindromic Repeat (CRISPR) systems were used with gene coding sequences (TWIST1, TGFBI, ZEB1) and sgRNA oligos (TWIST1) to generate overexpression and knockdown cell lines, respectively [18]. Lentivirus preparation and infection were performed as described. Primers used for gene cloning and knockdown are listed in Tables S2 and S3.

2.6. RNA Sequencing and Transcriptomic Analysis

Total RNA from GFP- and TWIST1-expressing KYSE450 cells were extracted using the AllPrep® DNA/RNA Micro Kit (Qiagen, Hilden, Germany), following the manufacturer’s instructions. Qualified samples were subjected to ribo-depleted RNA sequencing on the NovaSeq 6000 platform (Illumina, San Diego, CA, USA) at the HKU Centre for PanorOmic Sciences. Transcriptome analysis was conducted using the Partek® Flow® software (Version 11.0.23.1023) (Partek Incorporated, Chesterfield, MO, USA), as previously described [19]. Comprehensive gene set enrichment analysis downstream of TWIST1 was performed using EnrichR and the Molecular Signatures Database (MSigDB) Hallmark 2020.

2.7. Western Blot Analysis

Cell protein lysates of KYSE150 and KYSE450 cells were electrophoresed on 8% SDS-PAGE gels. Proteins were transferred to PVDF membranes (Millipore, Billerica, MA, USA), blocked with 5% bovine serum albumin (BSA), and incubated with primary antibodies, as previously described. Detailed information for the antibodies used in this study is summarized in Table S4.

2.8. Wound Healing Assay

KYSE150 and KYSE450 cells (1 × 10⁶/well) were seeded into 6-well plates to form a confluent monolayer. Wounds were created by gently scratching cells using a 200 μL pipette tip, followed by incubation with fresh culture medium for 24 h. Images were captured using NIS-Elements software (Nikon, Tokyo, Japan) and the closure area was quantitatively assessed with ImageJ (version 1.53 h) (National Institutes of Health, Bethesda, MD, USA).

2.9. Matrigel-Coated Transwell Assay

KYSE150 and KYSE450 cells (2 × 10⁵/well) in a serum-free medium were loaded into the upper well of Matrigel-coated Transwell chambers (Corning Inc., Corning, NY, USA) for 24 h, with the lower well filled with a culture medium as the chemoattractant. Migrated cells in the lower compartments were stained with 1% crystal violet (Sigma-Aldrich, Saint Louis, MO, USA) following the manufacturer’s instructions. Images were captured by the Cytation 5 Cell Imaging Multi-Mode Reader (BioTek, Winooski, VT, USA) and the migrated cells were counted in 5 microscopic fields per well to calculate the average value.

2.10. Colony Formation Assay

KYSE150 and KYSE450 cells (2 × 10³/well) were seeded in 6-well plates for a 14-day culture. Cell colonies were stained with 1 × Giemsa (Sigma Aldrich, Saint Louis, MO, USA), as previously described [18].

2.11. MTT Assay Following Cytotoxic Drug Treatments

KYSE70, KYSE150, and KYSE450 cells (4 × 10³/well) were seeded in 96-well cell culture microplates in triplicate for 24 h to facilitate their exponential growth, followed by incubation with cisplatin (10 or 20 μM) in a fresh culture medium for an additional 24, 48 and 72 h. Cell proliferation and viability were assessed using the 3-(4,5-dimethylthiazol-2-yl)-2,5-diphenyltetrazolium bromide (MTT) assay as previously described [18].

2.12. In Vivo Tumorigenicity and In Vivo Metastasis Assay

Female BALB/c athymic nude mice (6–8 weeks old) were used for both subcutaneous patient-derived organoid xenograft (PDOX) models and in vivo metastasis models and performed as previously described [18]. For PDOX models, 2 × 10⁶ PDO cells/site were subcutaneously transplanted into both sides of each mouse (3 mice per group, with 3 healthy mice as controls). The ESCC PDOs used in this study were established as previously described [20]. For cardiac blood collection of ESCC PDOX models, the retrograde cardiac puncture method was performed in mice one month after tumor inoculation. Prior to cardiac puncture, each mouse was anesthetized, followed by insertion into the left ventricle with a 27G Microfine needle (BD Biosciences, Franklin Lakes, NJ, USA). Cardiac blood was drawn out through the needle using a syringe and then transferred to a VACUETTE® EDTA tube (Greiner Bio-One, Frickenhausen, Germany) for subsequent CTC enrichment. For in vivo metastasis models, 1 × 10⁶ GFP- or TWIST1-overexpressing KYSE150Luc cells were transplanted into each mouse (8 mice per group) via tail-vein injection. Lung metastasis was monitored at 3- and 6-weeks post-injection using the IVIS® LuminaTM X5 Imaging System (PerkinElmer, Waltham, MA, USA). All animal experimentation was conducted in accordance with the protocols endorsed by the Committee on the Use of Live Animals in Teaching and Research of the University of Hong Kong (CULATR NO.6006-22).

2.13. Statistics

The Kolmogorov–Smirnov non-parametric test was used to compare the differences in fold change between CTC markers in the healthy donor (HD) groups and the CTC groups.
Fisher’s exact tests and Pearson chi-square tests were used to assess the association between CTC marker positivity and categorical clinicopathological factors. CTC status was categorized into a CTC-positive group (≥2 detected markers) or CTC-high group (≥5 detected markers) with a threshold determined using a receiver operating characteristic (ROC) curve analysis for assessing progression-free survival (PFS) and OS (Tables S5 and S6). PFS or OS were defined by the period between treatment start to date of clinical progression or date of death, respectively. Patients were censored at the last follow-up (31 May 2023) or death. The median follow-up was 4 months for palliative patients and 10 months for curative patients. CTC samples showing the co-expression of EpCAM and TWIST1 mRNA were classified as hybrid EMT. The Kaplan–Meier analysis was used to compare both PFS and OS with marker positivity or negativity. The Cox regression models with gender, age, and TNM stages as covariates were used to calculate hazard ratios (HRs) for OS. Student’s t-test was used for all statistical analyses of functional studies. A significance level of p-value < 0.05 (two-sided) was used for all analyses. Survival analyses were performed using SPSS (version: 28.0.1.0), and GraphPad PRISM (version: 9.5.1) was used for graphic design and analysis. The EMT schematic illustration was created using Biorender.com, accessed on 13 October 2023.

3. Results

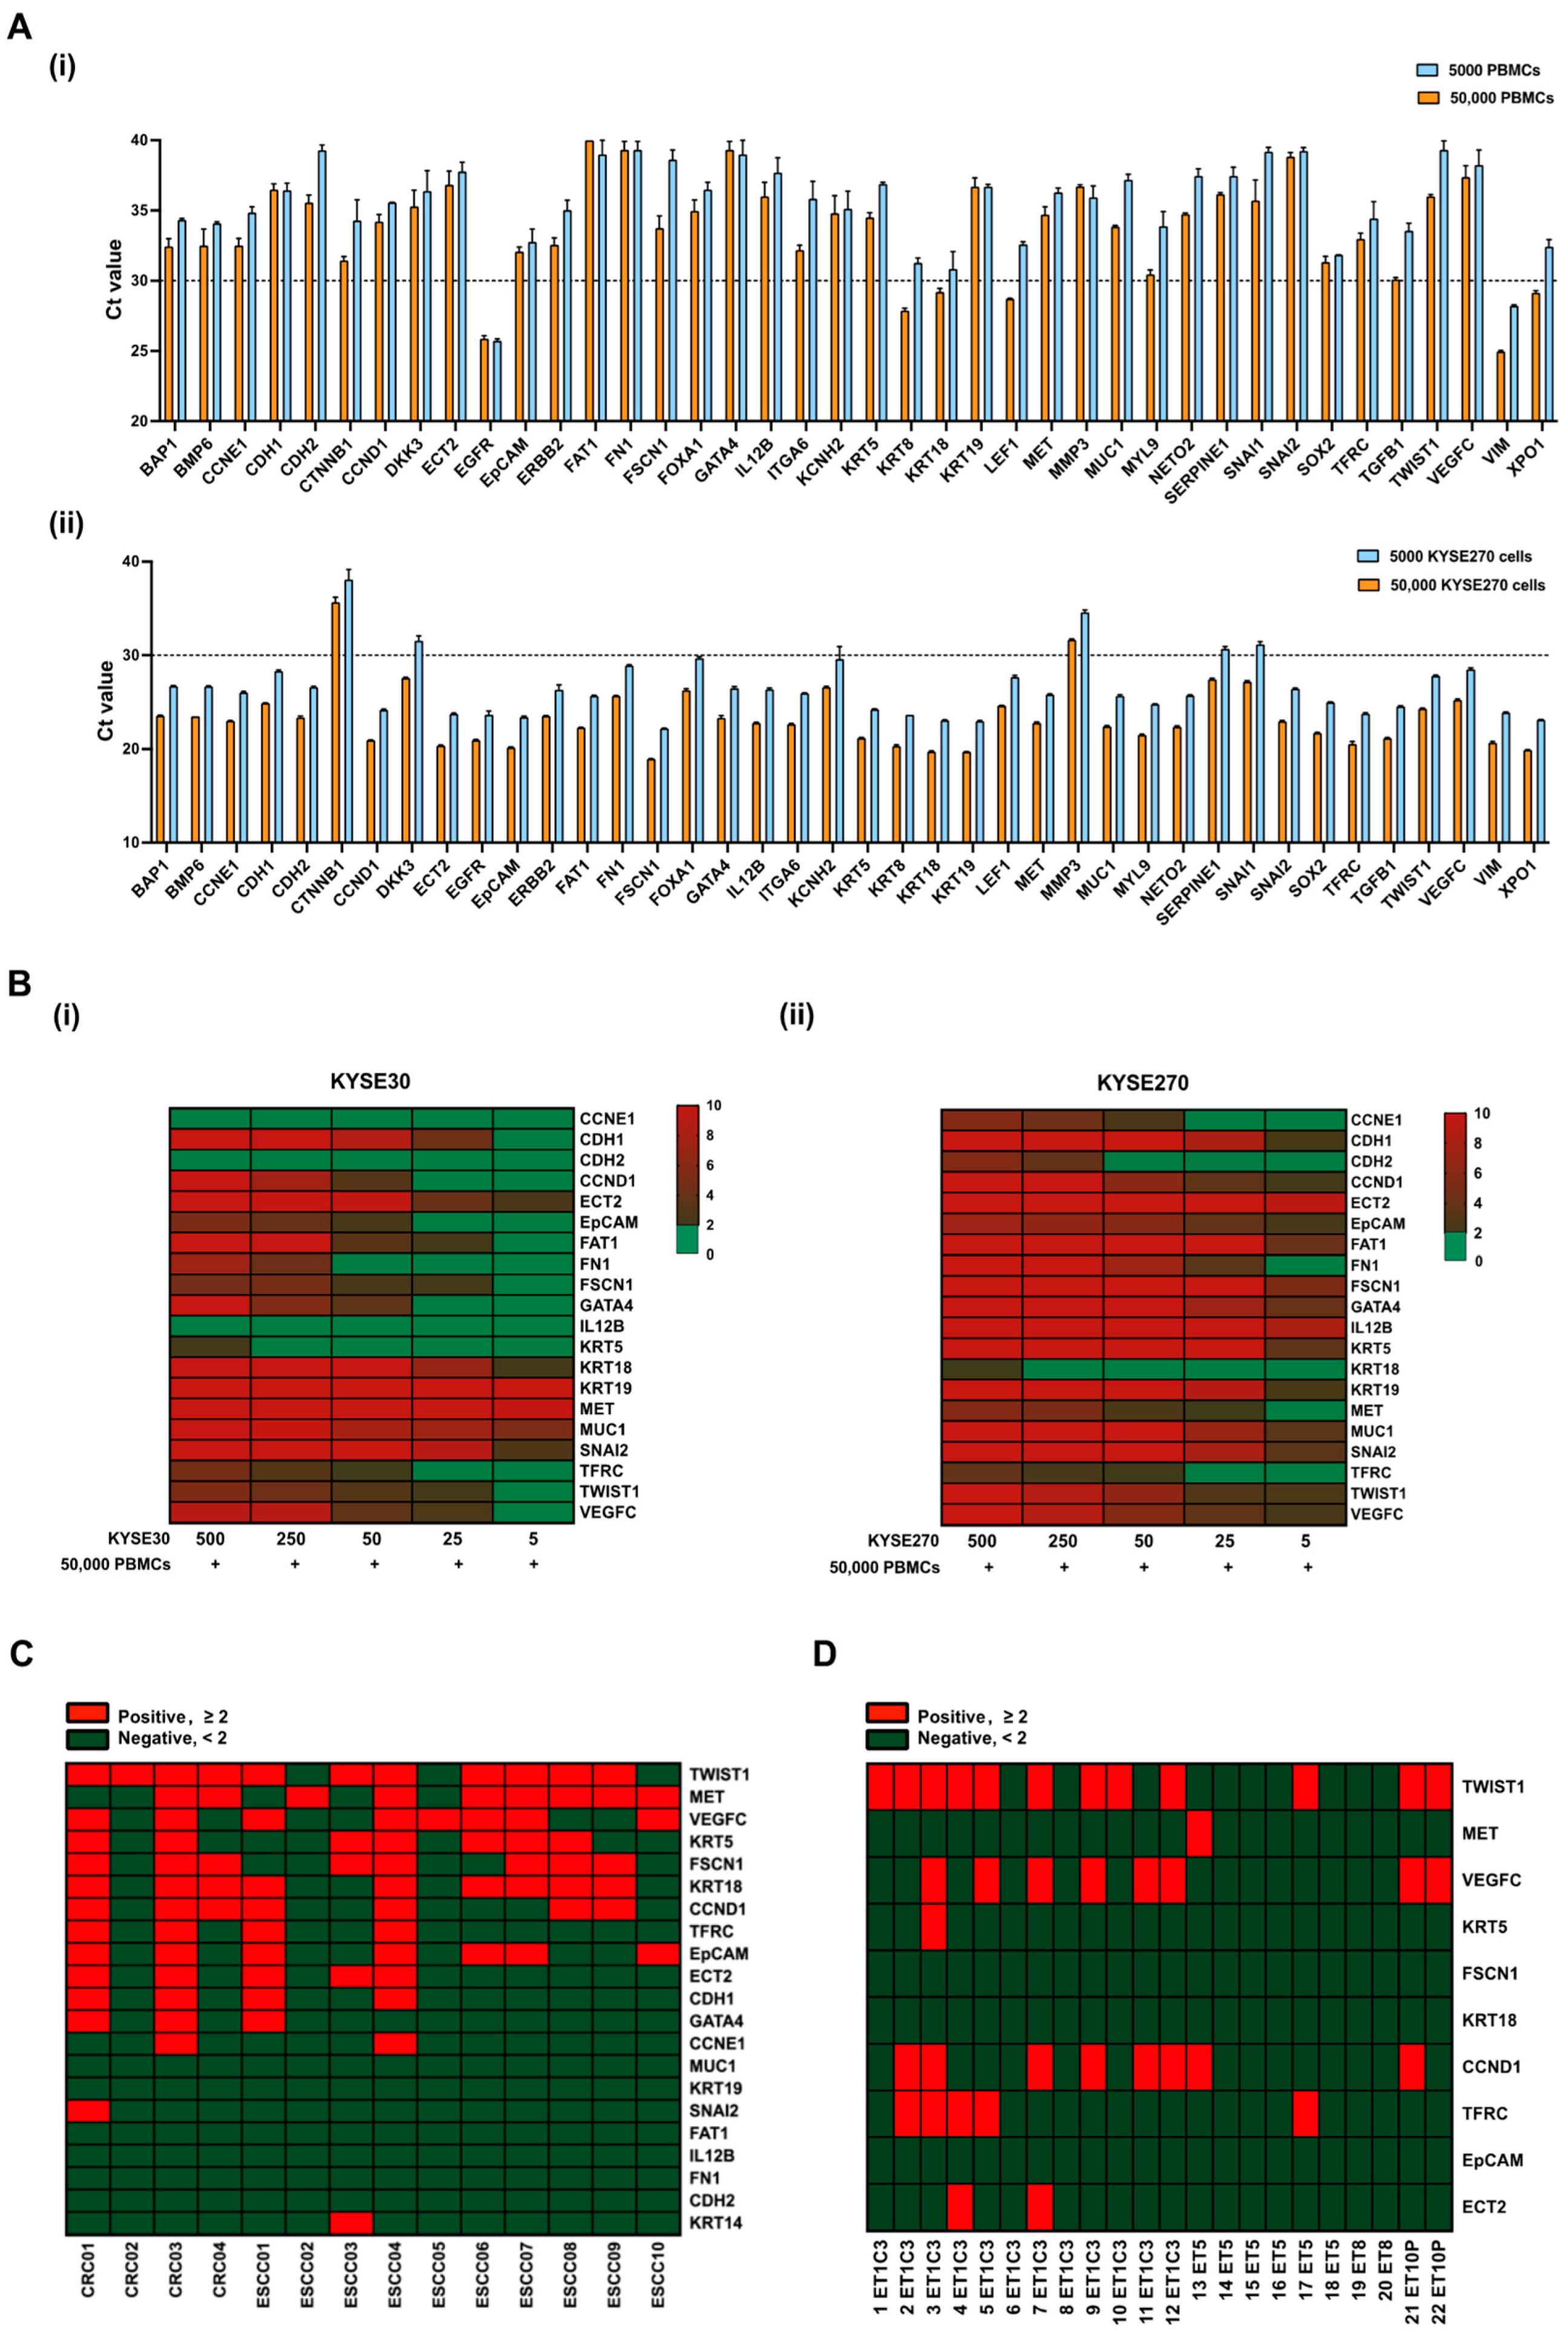
3.1. Establishment of Gene Panels for CTC Detection in ESCC Patients

The isolation and identification of CTCs in ESCC patients are crucial for early cancer diagnosis and prognosis. Liquid biopsy-based CTC detection, involving RT-qPCR analysis of blood samples, provides a feasible approach to identifying metastatic cancer cells prior to clinical detection. Nevertheless, CTCs remain scarce and can potentially retain leukocyte contamination even after enrichment. To minimize background noise, optimal CTC markers should be selectively enriched in cancer cells and not expressed in leukocytes. Initially, a set of 224 genes related to EMT and tumor metastasis were screened using an ESCC cell spike-in assay alongside peripheral blood (PB) samples from a healthy donor (HD) for a 10× Chromium single-cell gene expression analysis (Table S7). Nearly half of the KYSE270 cells (~105) were recovered and identified using the epithelial marker genes, including EpCAM, KRT8, KRT18, and KRT19, from the initial 200 spiked KYSE270 cells in the 10× spike-in assay. Based on bioinformatic analysis of the sequencing data (average reads in peripheral blood mononuclear cells (PBMCs) < 0.10, average reads in KYSE270 > 1.0), 40 CTC marker genes were chosen. Transcript levels of these genes in 50 single KYSE270 cells are shown in a heatmap to reveal intratumor heterogeneity (Figure S1). Further RT-qPCR validation of these genes was conducted in PBMCs and KYSE270 cells (Figure 2A). Genes enriched in PBMCs (Ct value < 30) or lowly expressed in ESCC cells (Ct value > 30) were excluded (n = 12) from subsequent spike-in assays; these include EGFR, KRT8, LEF1, MYL9, TGFB1, VIM, XPO1, CTNNB1, DKK3, MMP3, SERPINE1, and SNAI1. To encompass a broad spectrum of cancer signatures, the high mesenchymal KYSE270 cells and the high epithelial KYSE30 cells were chosen for the subsequent spike-in assay based on scores of generic EMT signatures (Figure S2). A total of 28 genes were enrolled for the RT-qPCR spike-in assay with corresponding ESCC cells and 50,000 PBMCs. Transcripts of 20 genes were positively detected when spiked with 500 ESCC cells (both KYSE30 and KYSE270) (Figure 2B). To further assess the potential of these markers in characterizing clinical CTCs, 20 selected CTC markers from the spike-in assay were employed in a pilot study involving 14 clinical PB samples. Distinct sensitivities of these markers were identified and are shown in the heatmap (Figure 2C). Markers with an overall positivity rate below 30% in the pilot study were excluded from subsequent clinical CTC characterization, including CDH1, GATA4, CCNE1, MUC1, KRT19, SNAI2, FAT1, IL12B, FN1, CDH2 and KRT14. In addition to the pilot study involving clinical PB samples, CTCs were also enriched from the cardiac blood of ESCC PDOX mouse models, including ET1C3, ET5, ET8, and ET10P. Among the 10-gene panel, TWIST1, CCND1, and VEGFC emerged as the most sensitive markers for ESCC PDOX CTC characterization (Figure 2D).

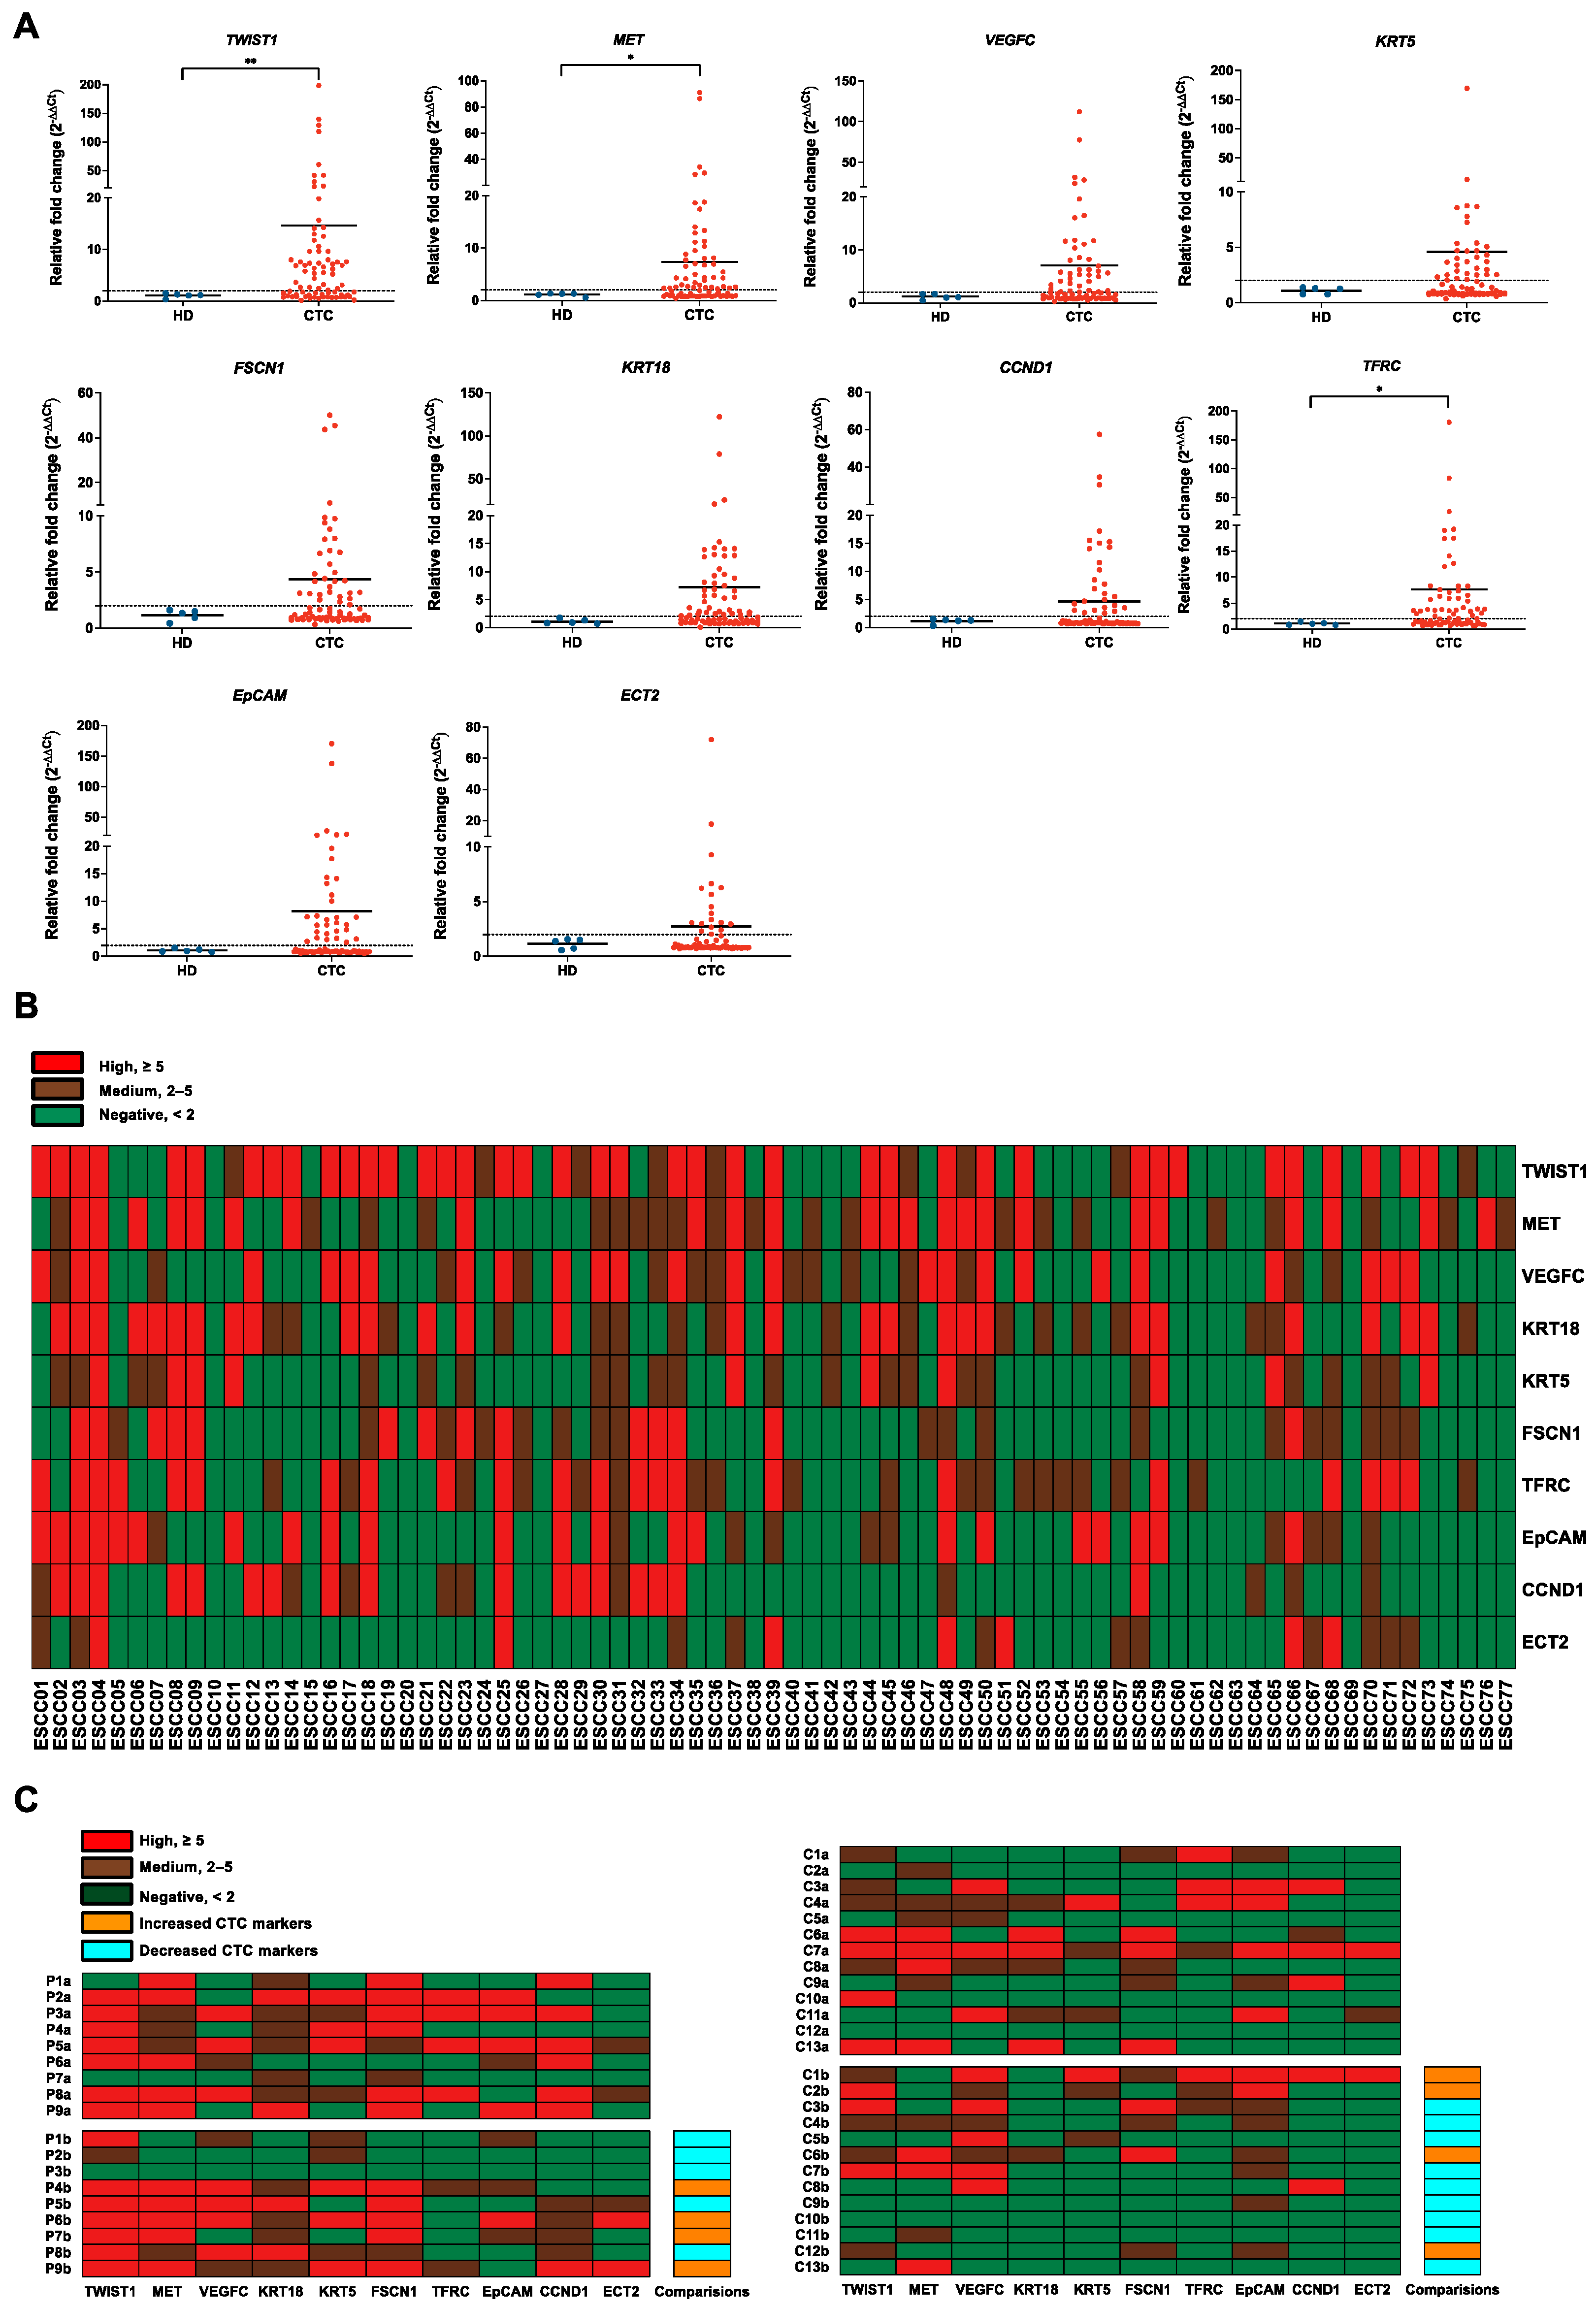
3.2. Evaluation of Gene Panels for Characterizing CTCs in ESCC Patients

To mitigate the influence of contaminating cells, 7.5 mL of PB from HDs (n = 5) was processed for CTC enrichment in the same way as ESCC samples (n = 77) and used as controls. All the target genes were expressed at lower levels in output cell-fraction in HDs, compared with those in ESCC patients (Figure 3A). For better visualization of the gene expression profiling data, a heatmap was generated by categorizing relative fold change values into three levels: negative (<2), positive (≥2), and high (≥5) (Figure 3B). TWIST1, MET, and VEGFC were the top three sensitive marker genes among the panels with high overall positivity in detecting CTCs in ESCC. For dynamic monitoring of the progression of disease (PD) in ESCC patients, 22 pairs of PB samples, including baseline and corresponding pre-III or one-month post-treatment samples, were clustered and presented in the heatmap (Figure 3C). In the palliative cohort (n = 9), a total of 56% (5/9) of patients exhibited a decrease in CTC markers at the pre-III time point. In the curative cohort (n = 13), this percentage was slightly higher, with nearly 70% (9/13) of patients showing decreased CTC markers at the one-month post-treatment time point. While the majority of samples displayed a reduction in the number of detected markers at the one-month post-treatment time point, four cases (C1b, C2b, C6b, and C12b) demonstrated an increase even after curative treatment. Notably, most of these cases experienced PD within 3 months after the later time point. The prognostic value of gene expression in CTCs at the post-treatment time point was further evaluated. The CTC-high status was found to be significantly correlated with PD in the curative cohort (1/8, 12.5% vs. 4/5, 80.0%, Fisher’s exact test, p = 0.032, two-sided). Furthermore, both TWIST1-positive (2/8, 25.0% vs. 5/5, 100.0%, Fisher’s exact test, p = 0.021, two-sided) and TWIST1-high (0/8, 12.5% vs. 3/5, 60.0%, Fisher’s exact test, p = 0.035, two-sided) statuses were found to be significantly correlated with PD in this cohort.

3.3. Correlations of CTC Marker Expression with Clinicopathological Features in ESCC Patients

The correlations between patients’ clinical characteristics and different groups of CTC marker expression are summarized in Table 1. A total of 55 ESCC patients were enrolled. The median progression-free survival (PFS) and overall survival (OS) among palliative patients were 84 days and 119 days, respectively. For curative patients, the median PFS and OS were 243 days and 299 days, respectively. Approximately 84% (46/55) of patients were CTC-positive and this status was significantly correlated with original tumor size (p = 0.031). Regarding the clinicopathological correlation with individual CTC markers, positive expression of TWIST1, KRT5, and KRT18 showed significant correlations with advanced pathological stages (III-IV) (p < 0.001, p = 0.001, and p = 0.026, respectively). Positive expression of MET was significantly linked to larger tumor size (69% vs. 30%, p = 0.033). Furthermore, positive expression of TWIST1, KRT5, and FSCN1 demonstrated significant correlations with both advanced node metastasis (79% vs. 41%, p = 0.006, 68% vs. 22%, p = 0.001, and 57% vs. 26%, p = 0.029) and distant metastasis (93% vs. 49%, p = 0.004, 86% vs. 32%, p < 0.001, and 79% vs. 29%, p = 0.02). However, no correlation was found between the expression of individual CTC markers and the age, gender, or original tumor location of ESCC patients.

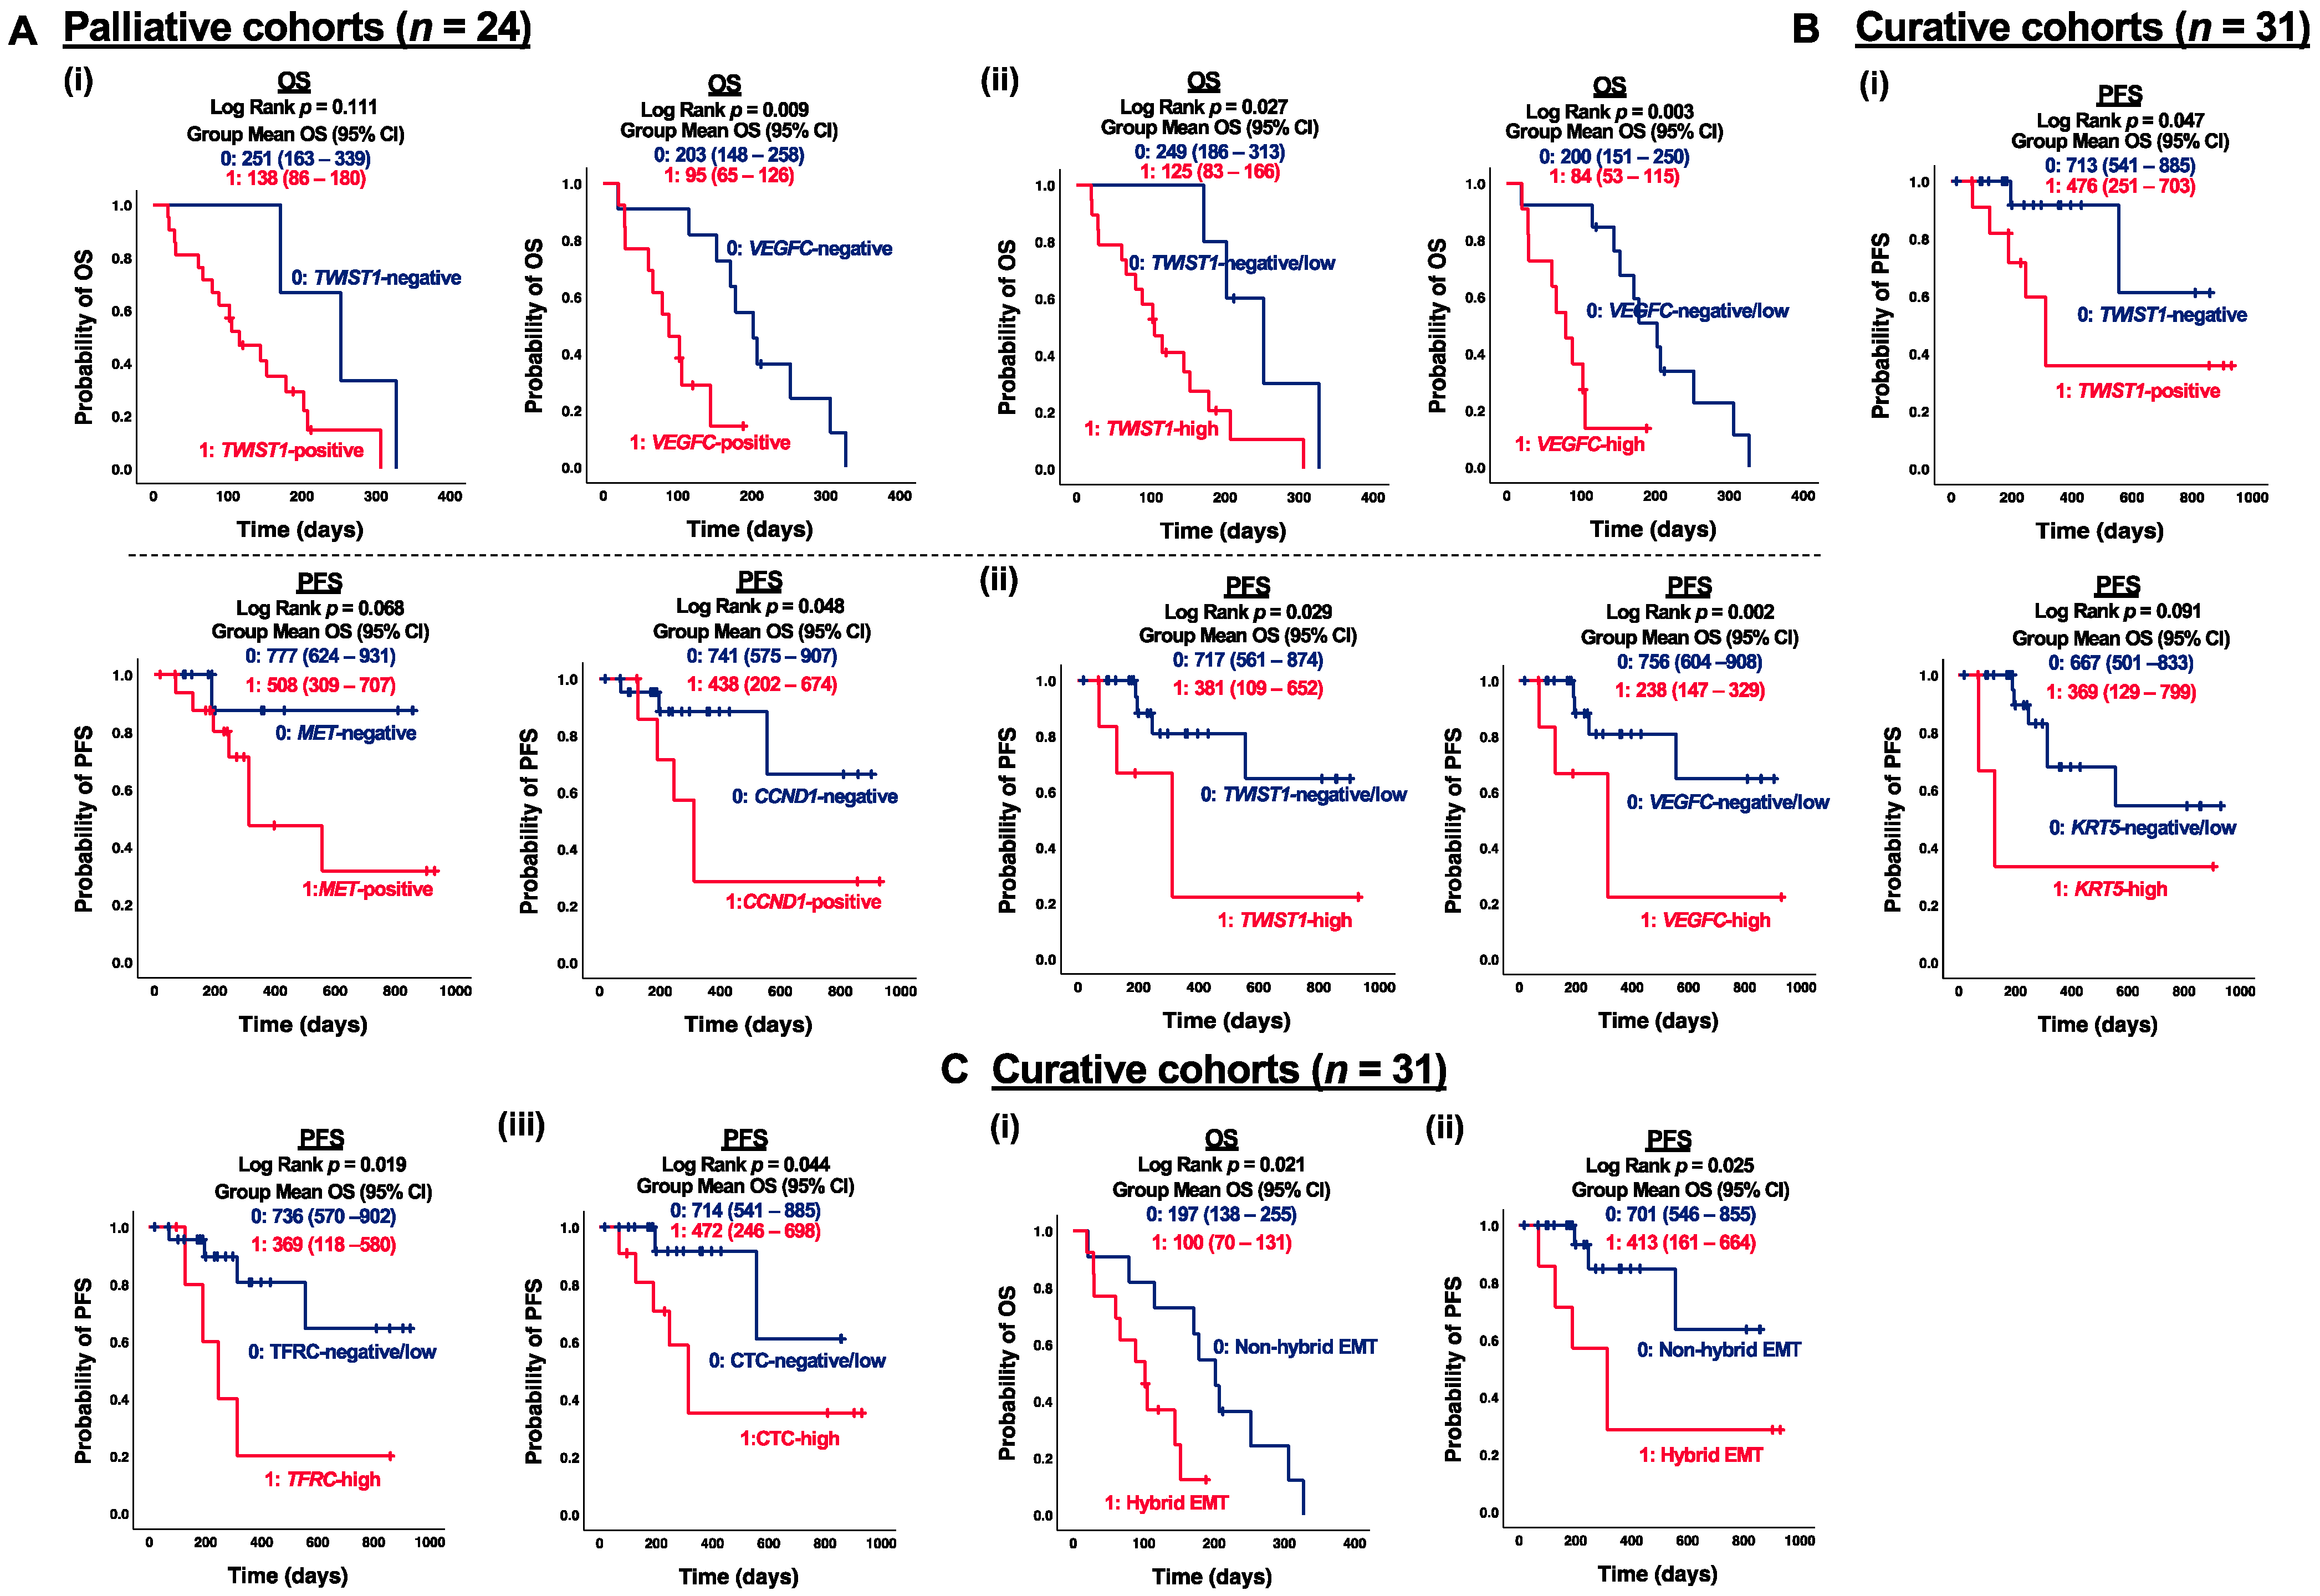
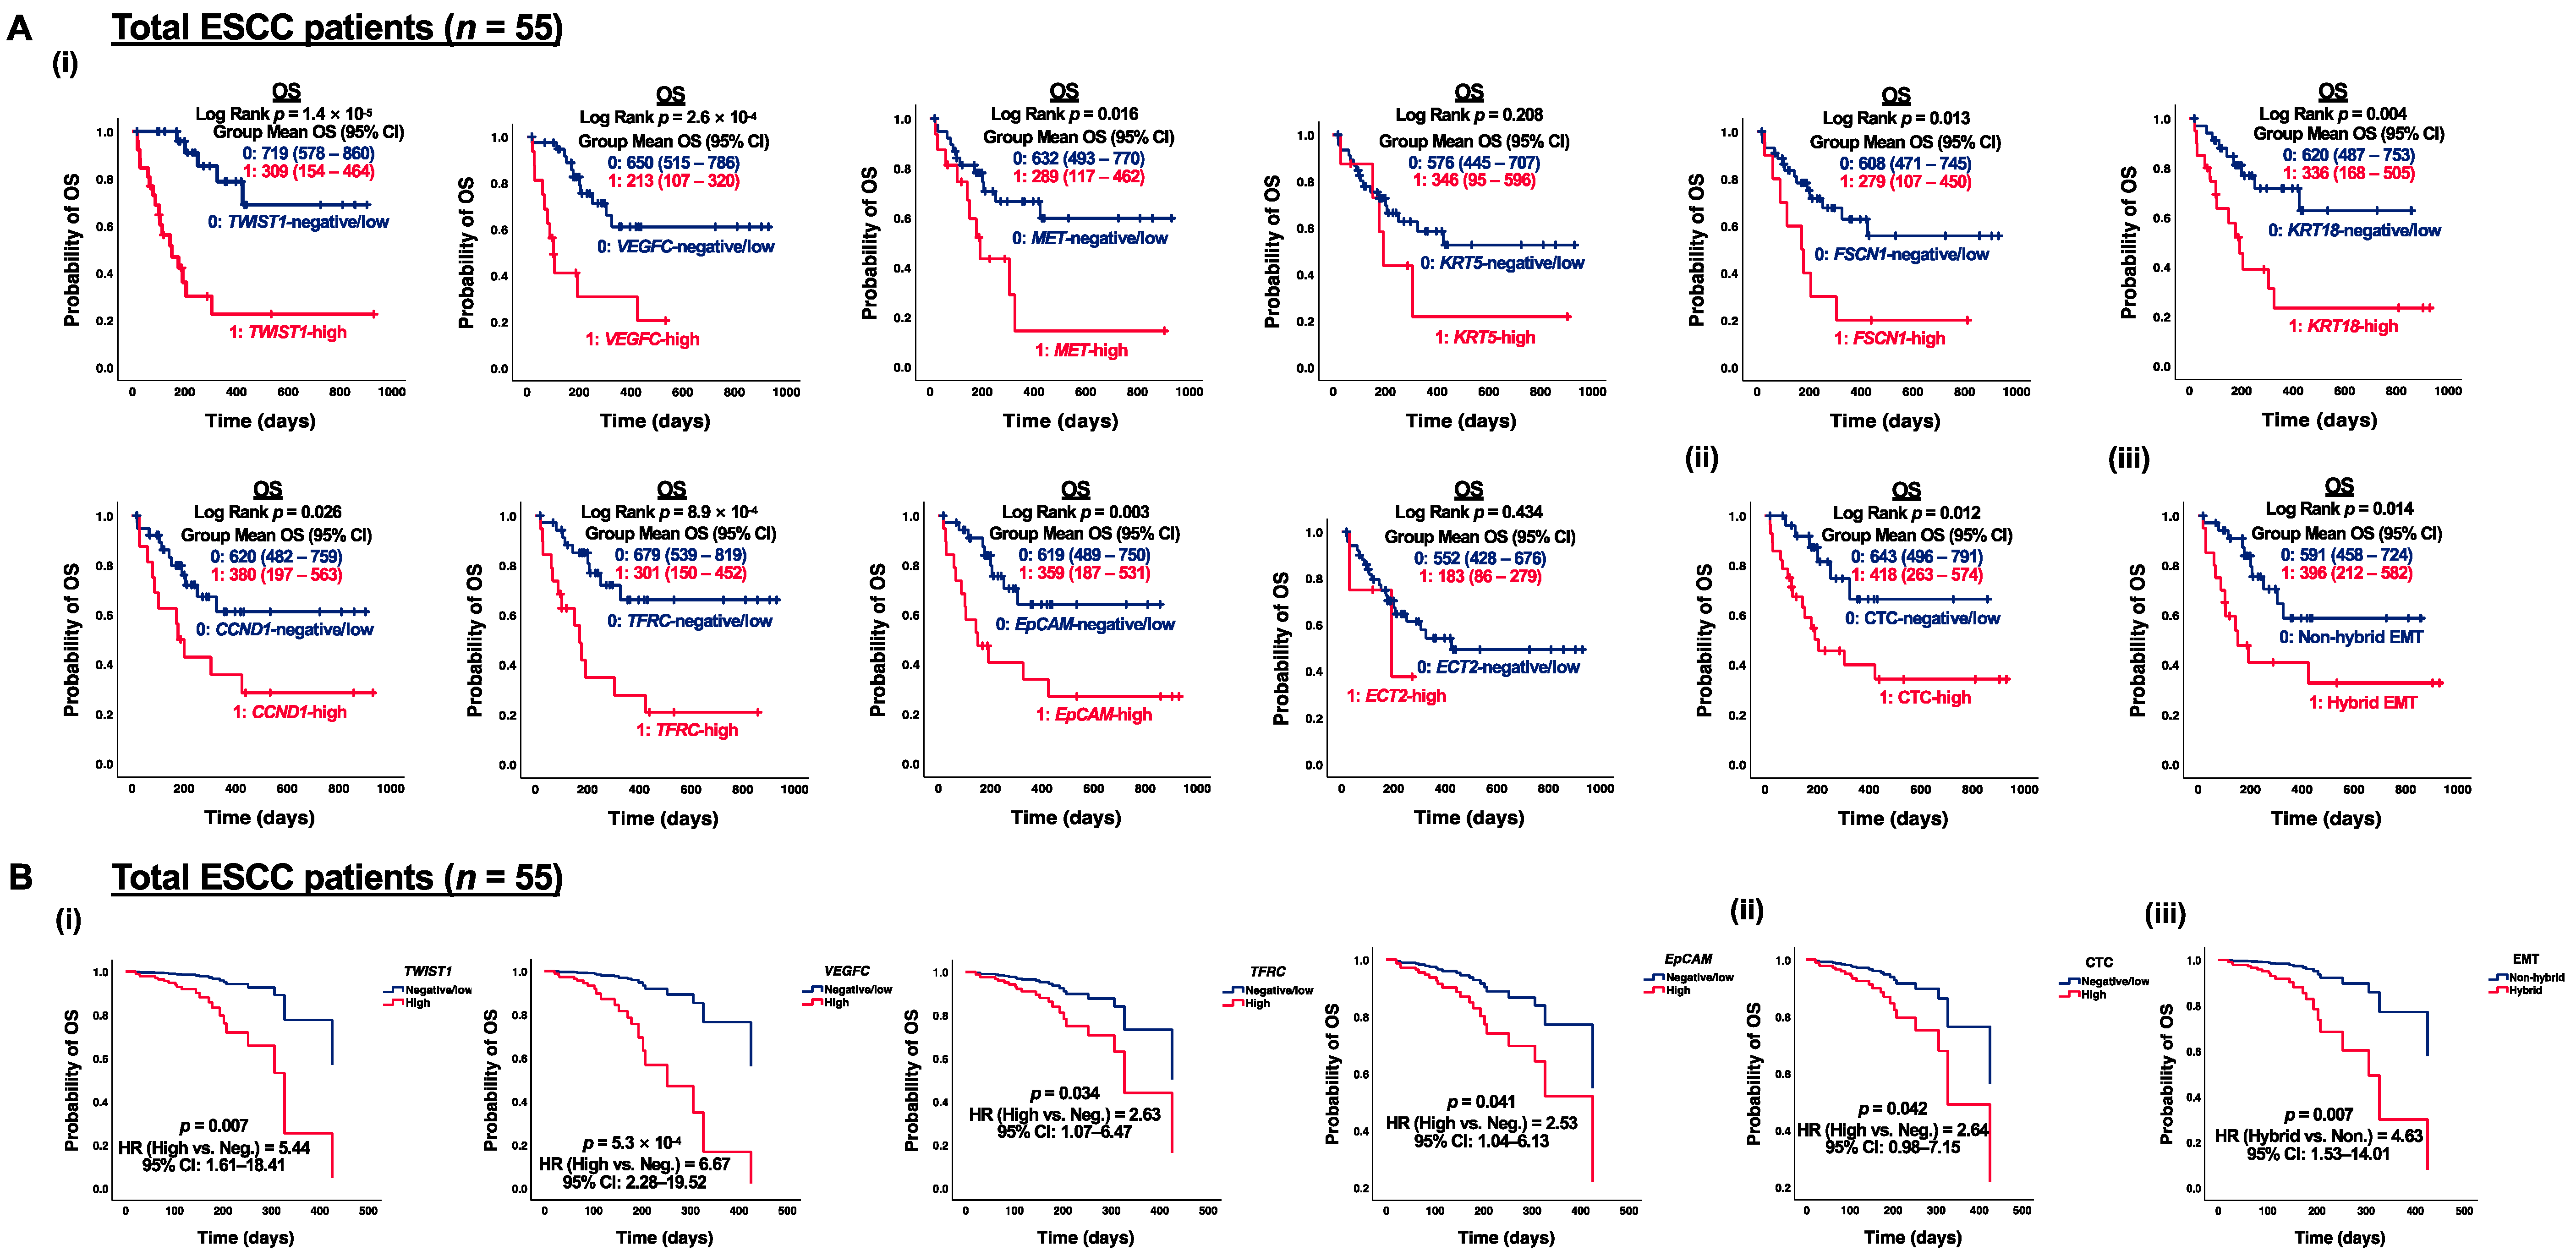
3.4. Correlation of CTC Marker Expression at Baseline with PFS or OS in ESCC Patients

Although limited correlations between CTC marker expression and clinicopathological features were observed within the palliative cohort (n = 24), the prognostic impact of CTC marker expression on OS can still provide insights into risk factors and essential molecular events during ESCC progression. Notably, both TWIST1 and VEGFC were significant prognostic factors for OS in patients receiving palliative care. Specifically, positive expression of VEGFC was significantly correlated with shorter OS in palliative patients (p = 0.009) (Figure 4(Ai)). High expression of TWIST1 and VEGFC were both significantly associated with shorter OS in palliative patients, with p-values of 0.027 and 0.003, respectively (Figure 4(Aii)). For dynamic treatment monitoring, predictive and prognostic markers to evaluate the treatment efficacy are still urgently needed. Among the curative cohorts (n = 31), patients with positive expression of TWIST1 and CCND1 exhibited significantly shorter PFS than those with negative detection (p = 0.047 and p = 0.048, respectively) (Figure 4(Bi)). In terms of individual gene analysis, high expression of CTC markers, defined as fold changes greater than five, demonstrated a stronger correlation with PFS. Specifically, patients with high expression of TWIST1, VEGFC, and TFRC had significantly shorter PFS compared to those with negative/low expression (p = 0.029, p = 0.002, and p = 0.019, respectively) (Figure 4(Bii)). Furthermore, patients with at least five detected CTC markers (CTC-high) exhibited significantly shorter PFS compared to non-CTC-high patients (p = 0.044) (Figure 4(Biii)). Patients with CTCs co-expressing TWIST1 and EpCAM were classified as hybrid EMT. Patients with hybrid EMT CTC phenotype had significantly shorter OS (p = 0.021) and PFS (p = 0.025) in the palliative and curative cohorts, respectively, as compared to the opposites (Figure 4C). Both TWIST1 and VEGFC served as prognostic factors for PFS in curative patients and OS in palliative patients. To further illustrate the clinical significance of CTC markers in ESCC, a univariate Kaplan–Meier survival analysis of OS with CTC gene expression at baseline was conducted prior to multivariate Cox regression analysis. CTC gene expression was stratified into two groups, with 0 indicating negative/low and 1 indicating high gene expression. Patients in the group with high expression of TWIST1, VEGFC, MET, FSCN1, KRT18, CCND1, TFRC, and EpCAM at baseline exhibited significantly shorter OS than the opposite group (Figure 5(Ai)). Patients classified as CTC-high had a markedly shorter OS, compared to the CTC-negative/low group (418 days vs. 643 days, p = 0.012) (Figure 5(Aii)). Similarly, patients grouped into hybrid EMT showed a significantly shorter OS than the non-hybrid group (396 days vs. 591 days, p = 0.014) (Figure 5(Aiii)). Clinicopathological features, including gender, age, TNM stages, and treatment classification, were included as covariates in the CTC multivariate Cox regression models for OS analysis. Multivariate regression model analysis indicated that high expression of TWIST1 (Hazard ratio (HR) for TWIST1-high 5.44, p = 0.007), VEGFC (HR for VEGFC-high 6.67, p < 0.001), TFRC (HR for TFRC-high 2.63, p = 0.034), and EpCAM (HR for EpCAM-high 2.53, p = 0.041) at baseline were significantly associated with a higher OS (Figure 5(Bi)). Furthermore, CTC-high (HR for CTC-high 2.64, p = 0.042) (Figure 5B(ii)) and hybrid EMT (HR for hybrid EMT 4.63, p = 0.007) were identified as unfavorable independent prognosticators in terms of OS in ESCC (Figure 5(Biii)).
TWIST1 was identified as one of the most sensitive marker genes for characterizing mesenchymal CTCs in ESCC, as described in this study. The functional role of TWIST1 in ESCC progression and development was further investigated both in vitro and in vivo using CRISPR systems. To confirm the involvement of EMT progression of TWIST1 in ESCC, we first overexpressed TWIST1 in KYSE150 and KYSE450 cells (Figure S3). The overexpression of TWIST1 significantly increased the cell migration ability, as indicated by the wound healing assay. Compared to the control, the migration rate increased to 189% for KYSE150 cells and 168% for KYSE450 cells upon the TWIST1 overexpression (Figure 6A). The invasion assay revealed that overexpression of TWIST1 drastically increased the ability of cell invasion in ESCC. The relative invasive ability increased to 198% for KYSE150 cells and 174% for KYSE450 cells upon TWIST1 overexpression, as compared with the control (Figure 6B). Furthermore, the clonogenicity ability was significantly enhanced in both KYSE150 cells and KYSE450 cells upon TWIST1 overexpression, as assessed by the colony formation assay (Figure 6C). Additionally, more metastatic formations were detected in Luc-KYSE 150 cells upon TWIST1 overexpression. Higher bioluminescence signal intensity was observed in the TWIST1 overexpression group at both weeks 3 and 6 post-injection, highlighting the in vivo pro-metastatic role of TWIST1 in ESCC (Figure 6D). In addition to the enhanced ability of cell migration, invasion, and clonogenicity, TWIST1-induced chemo-resistance was further investigated in ESCC. TWIST1-knockdown KYSE150 and KYSE450 cells were incubated with varying concentrations of cisplatin, 5-FU, paclitaxel, and docetaxel for 48 h. Notably, TWIST1 was found to be specifically linked to chemo-resistance towards cisplatin in ESCC. Knockdown of TWIST1 significantly sensitized cells to cisplatin treatment (Figure 6(Ei)), while overexpression of TWIST1 significantly escalated the resistance of ESCC cells to cisplatin (Figure 6(Eii)). The differential expression between the overexpression and knockdown groups for TWIST1 in ESCC cell lines is shown in Table S8.

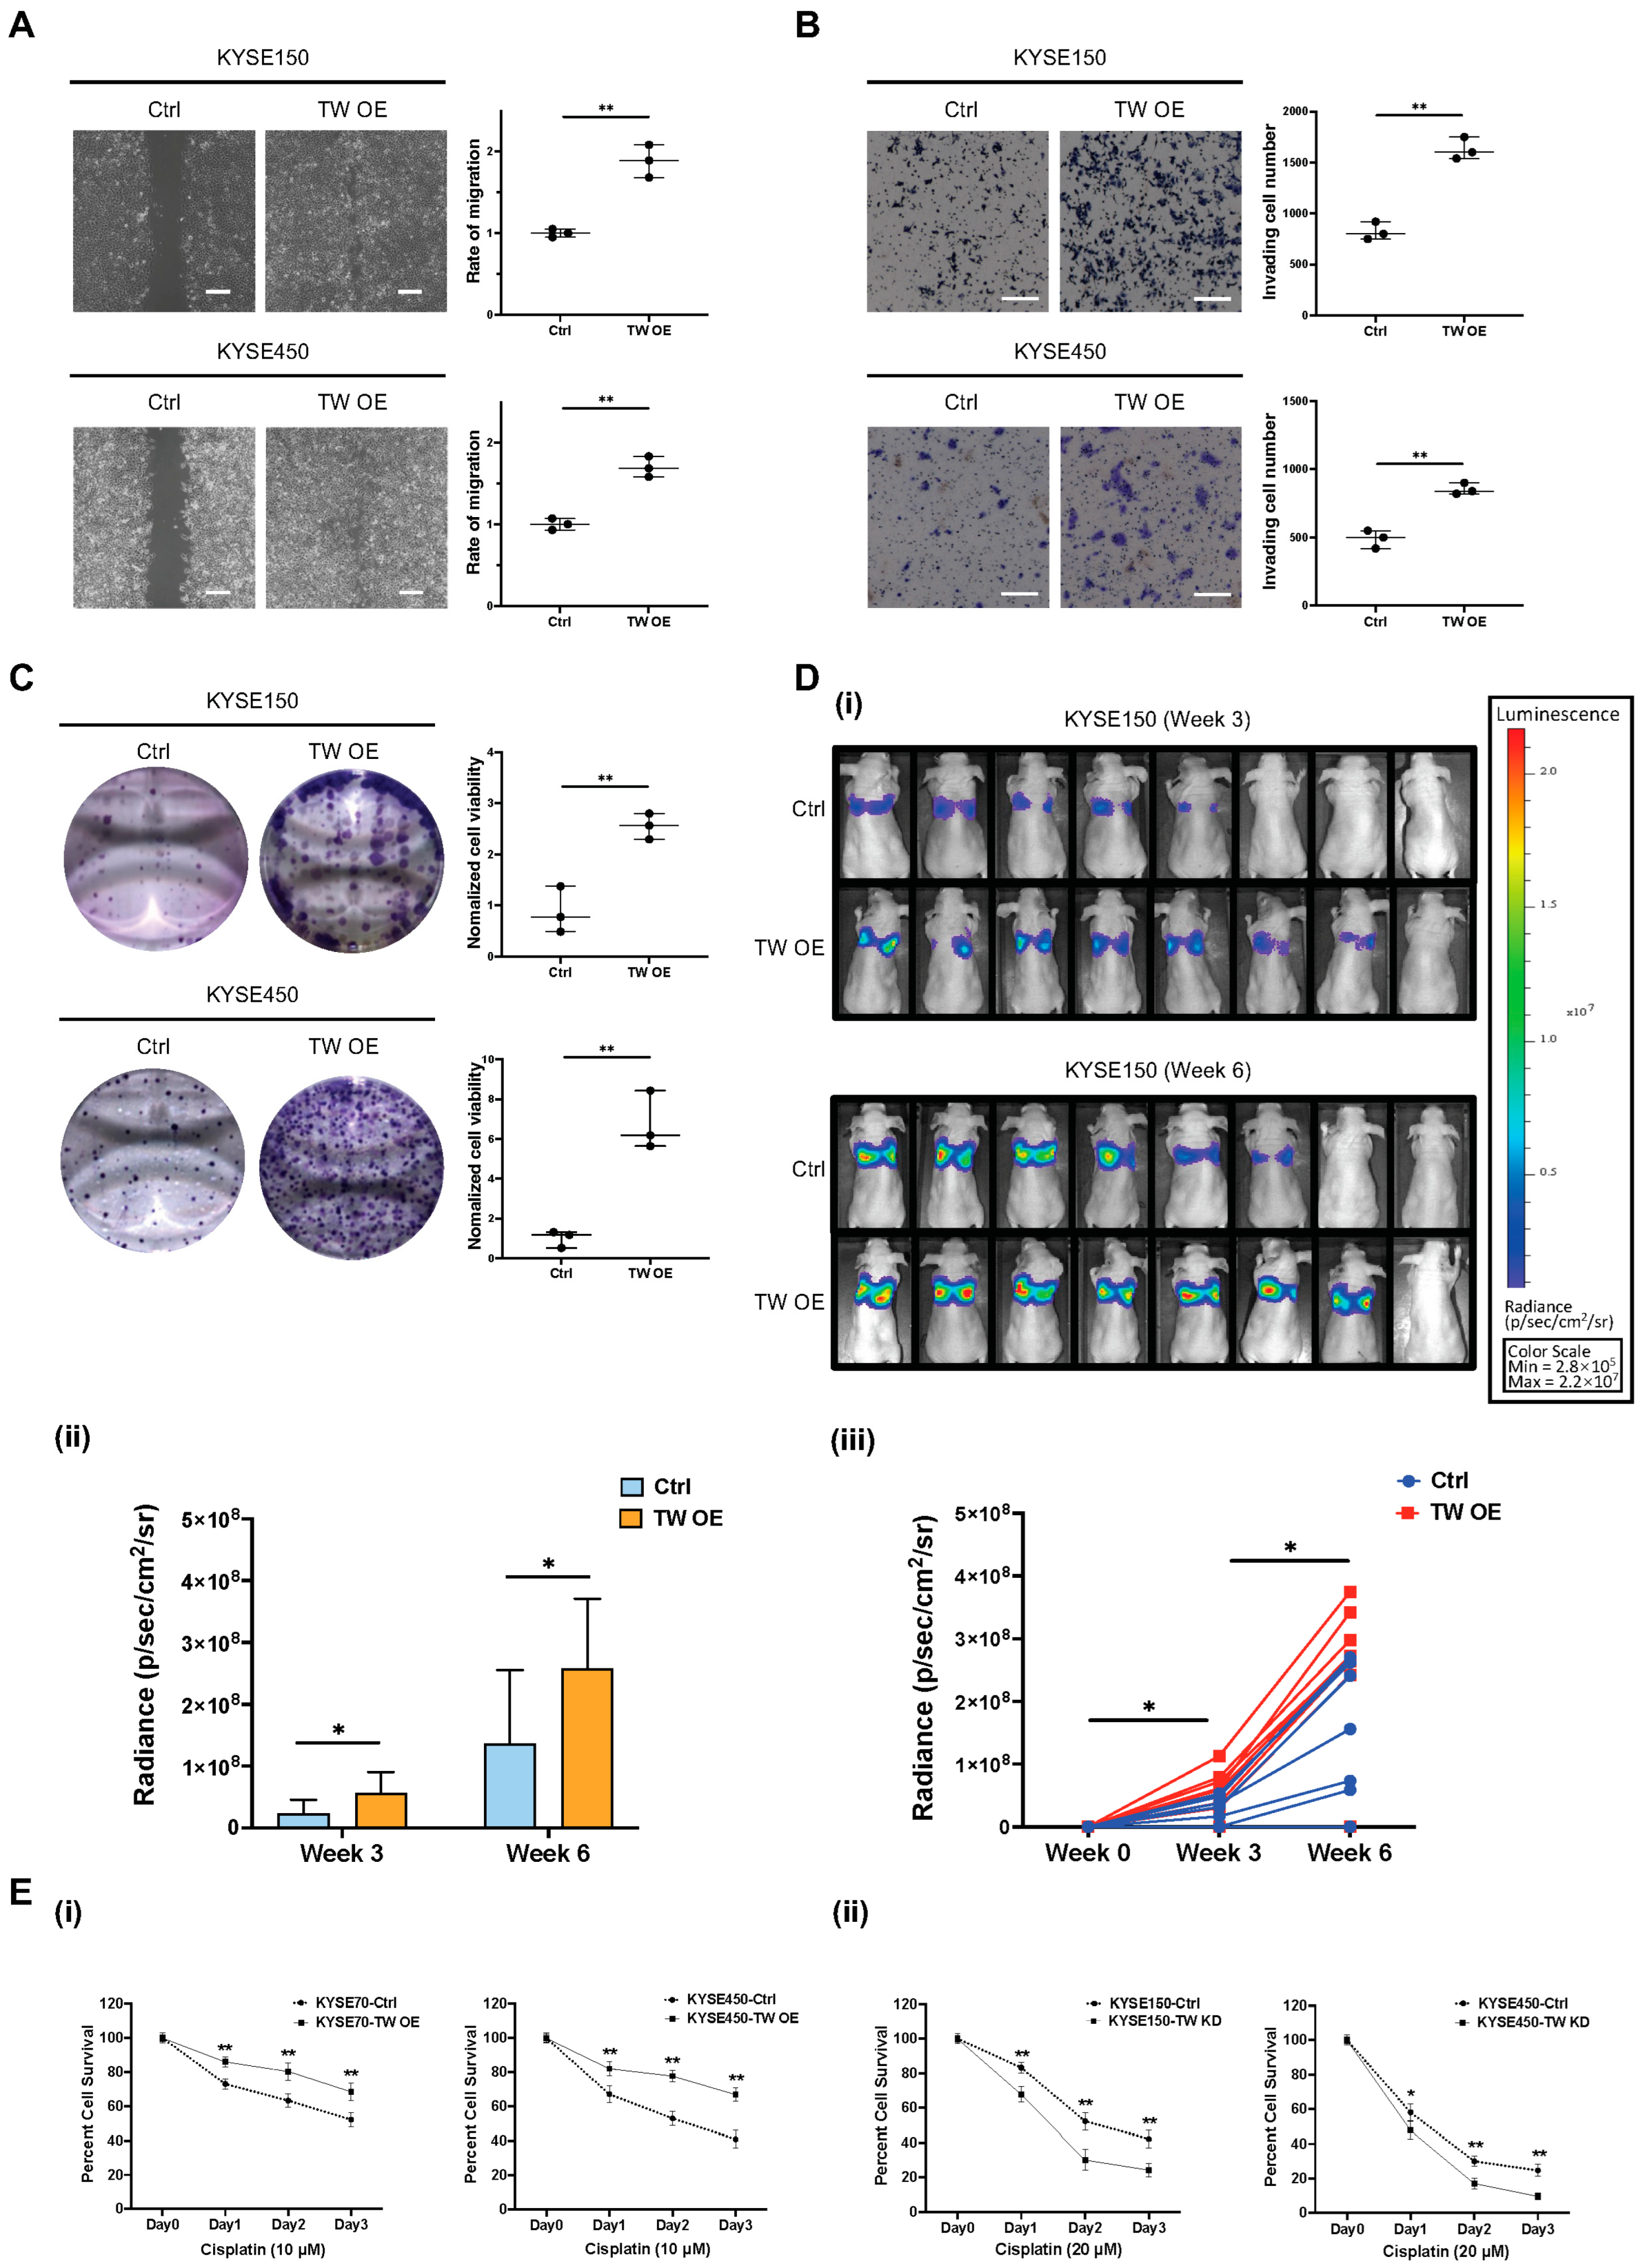
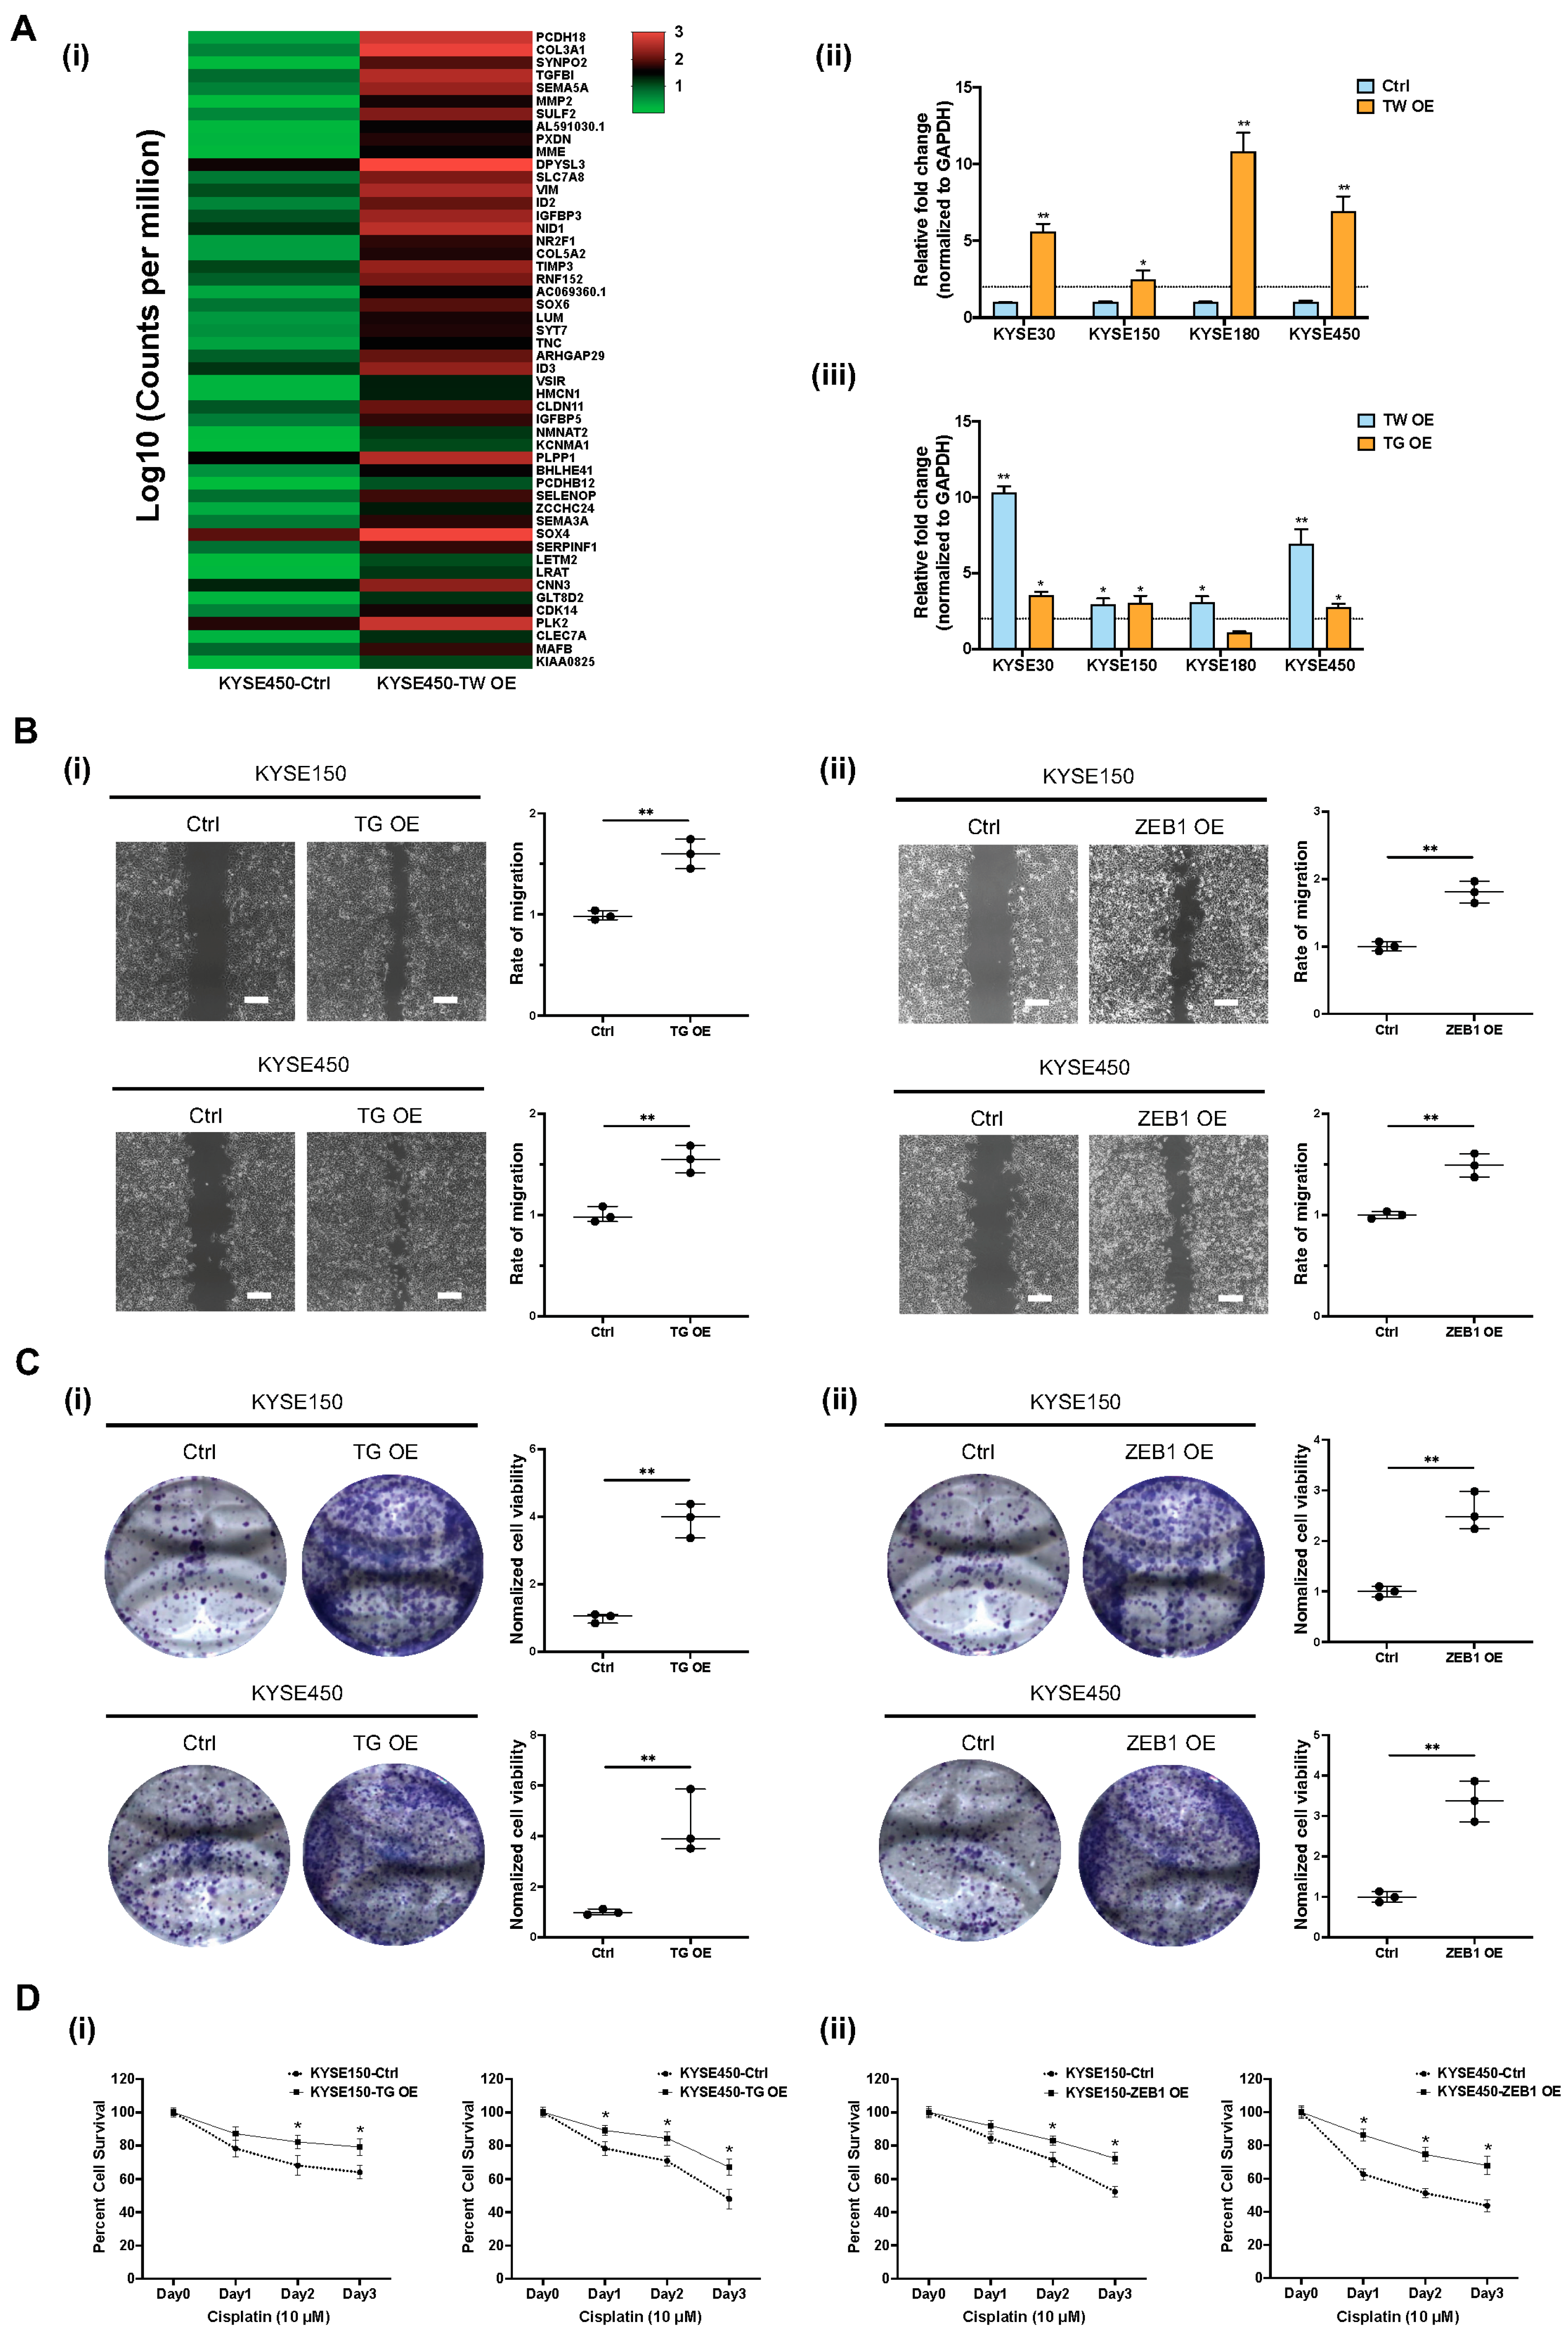
3.5. Functional Role of TWIST1-TGFBI-ZEB1 Signaling in ESCC

To identify downstream signaling pathways regulated by TWIST1, ribo-depleted RNA-sequencing was performed in KYSE450 cells. Based on the transcriptomic analysis, a heatmap of the top 50 upregulated genes was generated according to fold changes upon TWIST1 overexpression (Figure 7(Ai)). The upregulated genes were further subjected to EnrichR pathway analysis and TGFBI was highlighted as one of the most enriched downstream target genes upon TWIST1 overexpression (Figure S4). Interestingly, the TGFBI-ZEB1 axis was previously reported to protect against genetic stress in breast cancer [21]. Therefore, the regulatory relationship between TWIST1 and the TGFBI-ZEB1 axis was further investigated in ESCC. The level of TGFBI mRNA was significantly upregulated upon TWIST1 overexpression in KYSE30, KYSE150, KYSE180, and KYSE450 cells, as verified by the RT-qPCR (Figure 7(Aii)). The overexpression of either TWIST1 or TGFBI significantly increases the transcript level of ZEB1 in various ESCC cell lines (Figure 7(Aiii)). The functional roles of TGFBI and ZEB1 downstream of TWIST1 were studied using lentiviral-mediated CRISPR activation in KYSE150 and KYSE450 cells (Figures S5 and S6). Significant increases in cell migration ability were observed both in TGFBI-overexpressing cells and ZEB1-overexpressing cells when compared with the corresponding controls, as indicated by the wound healing assay (Figure 7B). Overexpression of TGFBI and ZEB1 also drastically enhanced the cell clonogenicity, as indicated by the colony formation assay both in KYSE150 cells and KYSE450 cells (Figure 7C). TWIST1 conferred chemo-resistance to cisplatin treatment in ESCC. We further investigated whether TGFBI-ZEB1 was involved in the TWIST1-induced cisplatin resistance. Cell viability of TGFBI-overexpressing cells and ZEB1-overexpressing cells incubated with cisplatin was determined using the MTT assay (Figure 7D). Compared to the corresponding controls, overexpression of both TGFBI and ZEB1 induced cisplatin resistance in ESCC, and a significant difference in cell viability was observed, when incubated with 10 μM cisplatin for 48 h or longer.

4. Discussion

We evaluated a novel identified panel of 10-gene transcripts present in CTCs of ESCC patients to investigate its clinical significance. As in our previous study, antibodies for Cytokeratin, EpCAM, MUC1, and VIM proteins were used for immunofluorescence enumeration of CTCs in ESCC and confirmed that elevated CTC levels at both pre- and post-treatment stages showed significant and independent prognostic value during the longitudinal monitoring of CTC enumeration [10]. In the present study, CCND1, ECT2, EpCAM, FSCN1, KRT5, KRT18, MET, TFRC, TWIST1, and VEGFC were identified as CTC biomarkers based on NGS bioinformatic analysis, spike-in assays and clinical validation in ESCC CTCs considering sensitivity and specificity. Typically, transcripts of the novel 10-gene panel, with the exception of ECT2, correlate with clinicopathological parameters or patient survival, when present in CTCs enriched from PB samples. The low detection rate and insignificant clinical relevance of ECT2 might be attributed to the discrepancy of endogenous gene expression between ESCC cell lines and clinical CTCs. Compared to the EpCAM-dependent CellSearch® system, the label-free, size-dependent CTC isolation method was found superior in sensitivity for downstream molecular characterization of CTCs in head and neck squamous cell carcinoma (HNSCC) [22]. Centrifugal force in CTChip®FR1 microfluidic chips were used to enrich and separate larger CTCs based on size from PBMCs in 77 PB samples from 55 ESCC patients in this study, resulting in an overall detection rate of 81.8% (63/77) for CTC-positive samples and 50.6% (39/77) for CTC-high samples. Among the 39 CTC-high samples, 59% (23/39) were from palliative patients, while 41% (16/39) were from curative patients. The lower occurrence of CTC-high samples among the curative patients, when compared to palliative patients, can be attributed to insufficient or even absence of CTCs, making their isolation challenging.
Previous studies on ESCC have employed molecular assays to detect CTCs by examining mRNA levels through RT-qPCR, yielding positive detection rates ranging from 14% to 60% [23,24,25,26]. Variations in these detection rates could be attributed to differences in CTC isolation techniques, the characteristics of the isolated CTC population based on the method used, and the CTC markers utilized for characterization. For instance, in spike-in assays, epithelial markers KRT18, KRT19, MET, and MUC1 demonstrated higher sensitivity in KYSE30 cells, while the EMT regulators SNAI2 and TWIST1 exhibited greater sensitivity in KYSE270 cells due to the distinct EMT status between these cell lines (Figure 2B). Besides CTCs that express epithelial antigens, a subset of CTCs possesses an EMT phenotype, which might have existed, but remained undetectable when using detection methods relying exclusively on epithelial markers. EMT markers are particularly prevalent in highly heterogeneous CTCs, which can only be captured using unbiased enrichment strategies. Therefore, focusing on CTC markers associated with EMT could offer novel insights for improved identification and characterization. The overall detection rate of EMT markers is higher than that of epithelial markers, standing at 43.8% (46/105) versus 29.5% (31/105), as evidenced by multiplex gene expression profiling of CTCs in high-risk prostate cancer [27].
Various studies have affirmed the prognostic significance of mesenchymal CTCs for distant metastasis and survival across multiple cancers, including HNSCC, pancreatic ductal adenocarcinoma (PDAC), and breast cancer [22,28,29,30]. In PDAC, the presence of mesenchymal-CTCs, characterized by VIM and TWIST1, was positively correlated with the TNM stage (p < 0.01) and distant metastasis (p < 0.01) [28]. Additionally, the prevalence of mesenchymal markers, including TWIST1 and VIM, was also underscored in breast cancer. Among the 84.9% (920/1083) of cases positive for CTCs, 547 displayed epithelial CTCs, 793 showed hybrid EMT CTCs, and 516 exhibited mesenchymal CTCs, highlighting how EMT imparts a more invasive and metastatic phenotype to CTCs [30]. Furthermore, both biphenotypic and mesenchymal CTCs were associated with distant metastasis, as indicated by ROC curve analysis. Similarly, the results in the present study showed the overall mRNA detection rate of the EMT marker TWIST1 was higher than that of the epithelial marker EpCAM: 62.3% (48/77) vs. 41.6% (32/77). High expression of TWIST1 was detected in nearly half of the patients (26/55) and was more frequently observed in patients at advanced ESCC stages (67% vs. 18%, p < 0.001), as well as in patients with distant metastasis (86% vs. 34%, p = 0.001). The high expression of TWIST1 in CTCs was significantly correlated with shorter OS (p = 0.027) in palliative patients and shorter PFS (p = 0.029) in curative patients.
Characterized as hybrid EMT or biphenotypic, this intermediate state between the epithelial and mesenchymal phenotypes exhibits the highest metastatic potential [31,32]. In ESCC, biphenotypic and mesenchymal CTCs are dominant subtypes, with epithelial markers (EpCAM and CK8/18/19) and mesenchymal markers (TWIST1 and VIM) identifying 58.9% (76/129) biphenotypic CTCs and 32.6% (42/129) mesenchymal CTCs [33]. Our data found 36.4% (20/55) of ESCC patients detected with hybrid EMT CTC at baseline. Importantly, hybrid EMT CTC significantly correlates with shorter OS in palliative patients and shorter PFS in curative patients in the current study. Our CTC multivariate Cox regression models for OS analysis also revealed the prognostic value of hybrid EMT at baseline (HR for Hybrid EMT 4.63, p = 0.007). VEGFC is another CTC marker highlighted in this study for its high sensitivity and significant prognostic value. By activating its receptor VEGFR3 expressed on lymphatic endothelial cells, VEGFC plays a key role in promoting lymphangiogenesis and subsequent regional lymph node metastasis in various human cancers, including ESCC [34]. Our data found both positive expression of VEGFC (p = 0.009) and high expression of VEGFC (p = 0.003) in CTCs were significantly associated with shorter OS in palliative patients. High expression of VEGFC was also an independent prognosticator in terms of OS (HR for VEGFC-high 6.67, p < 0.001), as indicated in CTC multivariate Cox regression models.
In line with prognostic markers observed in clinical PB samples, TWIST1, VEGFC, and CCND1 demonstrated high sensitivity in characterizing CTCs at the transcript level in cardiac blood from PDOX models. These gene expression profiling data in CTCs reinforced the importance of the EMT regulator TWIST1 and the lymphatic metastatic promotor VEGFC in ESCC. Furthermore, the involvement of the CCND1 gene in facilitating cell motility should also be fortified, as previously reported in breast cancer [35].
Distinct morphological, transcriptional, and epigenetic features occur along with EMT progression. Chemoresistance, one of the major obstacles during clinical cancer therapy, can be triggered by EMT, as indicated by increasing molecular and phenotypic evidence [36,37,38]. Including cisplatin and paclitaxel, TWIST1 has also been linked to resistance to platinum-based chemotherapy in several cancer types [37,39,40]. Additionally, the knockdown of TWIST1 has been shown to partially reverse multidrug resistance in breast cancer cells [36]. In the current study, the relationship between TWIST1 and drug resistance to conventional chemotherapy, including cisplatin, 5-FU, paclitaxel, and docetaxel was further investigated. Lentiviral-mediated CRISPR activation and interference were used for direct gene editing of TWIST1, revealing its influence on treatment efficacy in ESCC was observed mainly with cisplatin. Specifically, TWIST1 depletion sensitized cells to cisplatin treatment, whereas TWIST1 overexpression induced cisplatin drug resistance in ESCC. Similar evidence was also observed in epithelial ovarian cancer, where among more mesenchymal differentiated cells, TWIST1 might actually lead to greater resistance to cisplatin [38]. These collective discoveries establish a connection between TWIST1 and the EMT process, demonstrating their dual malignant roles in promoting heightened metastasis and drug resistance, underscoring the attractiveness of TWIST1 as a particularly compelling target for combination therapeutic approaches in aggressive and drug-resistant carcinomas.
To elucidate the underlying molecular mechanism of TWIST1-initiated EMT progression and cisplatin resistance in ESCC, ribo-depleted RNA-sequencing, and EnrichR pathway analysis were conducted. Our bioinformatic analysis of transcriptomic data highlighted TGFBI as one of the most enriched downstream targets of TWIST1, which was further validated by RT-qPCR in four ESCC cell lines. Importantly, TGFBI is one of the direct transcriptional targets of TWIST1, as validated by both ChIP-PCR using mouse embryonic tissues and luciferase assays [41]. Playing a role in preserving mesenchymal cell traits through intracellular signaling and extracellular matrix (ECM) remodeling, TGFBI influences cell adhesion and migration capabilities in a range of cancers, including intestinal cancers, glioma, and melanoma [42]. Necessary for tumor sphere formation and chromosomal stability maintenance, TGFBI-ZEB1 was reported to protect against genetic stress of activated stem-like cells in breast cancer [21]; their involvement downstream of TWIST1 in ESCC was investigated. As indicated by qPCR, both mRNA levels of TGFBI and ZEB1 were upregulated upon TWIST1 overexpression, and overexpression of TGFBI significantly increased the transcript level of ZEB1 in ESCC. Gain-of-function studies of TGFBI and ZEB1 in ESCC highlighted their potential for increasing the cell migration and clonogenicity in ESCC cells upon overexpression, as indicated by wound healing and colony formation assays. Moreover, TGFBI-ZEB1 was involved in the TWIST1-induced cisplatin resistance. Overexpression of either TGFBI or ZEB1 conferred cisplatin resistance to ESCC cells, including KYSE150 and KYSE450 cells.
We now demonstrate that TWIST1 mRNA expression in CTCs is a significant prognostic marker for patient survival, and meanwhile, TWIST1 promotes EMT and confers cisplatin resistance through the TWIST1-TGFBI-ZEB1 signaling pathway in ESCC. Although TWIST1 itself is not directly targetable, targeting the effector proteins of this alternative signaling cascade, such as TGFBI, may offer a promising therapeutic strategy. TGFBI has the potential to be a therapeutic target and could partially explain its clinical benefit in preventing metastatic recurrence and cisplatin resistance. In ovarian cancer, treatment with anti-TGFBI antibodies has been demonstrated to reduce peritoneal tumor size in an orthotopic mouse model [43]. Radiolabeled anti-TGFBI antibodies have demonstrated anti-angiogenic activity in colorectal cancer by selectively targeting metastatic lesions in vivo, highlighting its diagnostic and therapeutic potential [44]. Our study confirms that TGFBI is a therapeutic target downstream of TWIST1 in ESCC, and, importantly, that TGFBI overexpression confers cisplatin resistance in ESCC. Targeting TGFBI in advanced or metastatic ESCC has the potential to simultaneously inhibit metastatic potential and cisplatin resistance, thereby reversing cancer progression and improving the treatment efficacy.
A limitation of this study was the small number of healthy controls and the inadequate follow-up of CTCs for longitudinal analysis. Therefore, future studies with a larger cohort and healthy control groups, as well as a longer-term follow-up will strengthen current findings on the efficacy of these markers. Another limitation was the possible underestimation of total CTCs since the size-based capture platform utilized is biased toward the recovery of larger CTCs. The size-based capture platform is incapable of distinguishing small CTCs that are comparable in size with PBMCs, thus leading to possible underestimation of the total number of CTCs.

5. Conclusions

The present study identified a 10-gene panel for CTC identification in ESCC, namely CCND1, ECT2, EpCAM, FSCN1, KRT5, KRT18, MET, TFRC, TWIST1, and VEGFC. Expression of these CTC markers significantly correlates with clinicopathological features and patient survival. Molecular studies showed that TWIST1-initiated EMT progression and cisplatin resistance can partially be explained by TWIST1-TGFBI-ZEB1 signaling. Additionally, targeting the downstream effector protein TGFBI emerges as an ideal strategy to simultaneously inhibit metastatic potential and reverse cisplatin resistance. These findings collectively provide valuable insights into the understanding of ESCC progression and benefit patients with improved interventions based on these therapeutic targets.

Supplementary Materials

The following supporting information can be downloaded at: https://www.mdpi.com/article/10.3390/cancers15225329/s1, Table S1: List of the primers used for RT-qPCR; Table S2: List of the primers used for gene cloning of TWIST1, TGFBI, and ZEB1; Table S3: List of sgRNA oligos designed for TWIST1 knockdown using Lentiviral-mediated CRISPR interference; Table S4: List of the antibodies used in the study; Table S5: ROC analysis of CTC-positive and ESCC; Table S6: ROC analysis of CTC-high and survival; Table S7: Average reads of putative CTC markers in KYSE270 cells and PBMCs from 10× NGS sequencing; Table S8: Precise expression of TWIST1 between the overexpression and knockdown groups in ESCC cell lines. Figure S1: Gene expression heatmap of 40 putative CTC markers by 10× NGS sequencing; Figure S2: Scores of Generic EMT Signature of 25 esophageal carcinoma cell lines; Figure S3: Validation of Lentiviral-mediated CRISPR activation and interference of TWIST1 by Western blotting; Figure S4: EnrichR pathway analysis of top 100 TWIST1-upregulated genes in KYSE450 cells; Figure S5: Validation of Lentiviral-mediated CRISPR activation of TGFBI by RT-qPCR; Figure S6: Validation of Lentiviral-mediated CRISPR activation of ZEB1 by RT-qPCR; Figures S7 and S8: Uncropped Western blot figures for Figure S3.

Author Contributions

Conceptualization, Z.T., J.M.-Y.K. and M.L.L.; methodology, Z.T., H.-Y.N. and V.Z.Y.; software, Z.T. and V.Z.Y.; validation, Z.T. and H.-Y.N.; formal analysis, Z.T. and J.M.-Y.K.; investigation, J.M.-Y.K.; resources, K.-O.L., D.L.-W.K., I.Y.-H.W., F.S.-Y.C., C.L.-Y.W., K.-K.C., T.-T.L., F.S.-F.C. and S.Y.-K.L.; data curation, Z.T.; writing—original draft preparation, Z.T.; writing—review and editing, J.M.-Y.K. and M.L.L.; visualization, Z.T.; supervision, J.M.-Y.K. and M.L.L.; project administration, M.L.L.; funding acquisition, M.L.L. All authors have read and agreed to the published version of the manuscript.

Funding

This research was funded by the Hong Kong Research Grants Council, Theme-based Research Scheme Grant T12–701/17R to M.L.L.

Institutional Review Board Statement

The study was conducted in accordance with the Declaration of Helsinki and approved by the Institutional Review Board (IRB) of the University of Hong Kong/Hospital Authority Hong Kong West Cluster (HKU/HA HKW IRB) (protocol code: UW17–187, 8 May 2017).

Informed Consent Statement

Informed consent was obtained from all subjects involved in the study.

Data Availability Statement

The data presented in this study are available on request from the corresponding author.

Acknowledgments

We acknowledge the Research Grants Council Theme-based Research Scheme. All clinical blood samples from ESCC patients were collected by the Departments of Surgery and Clinical Oncology of Queen Mary Hospital. We acknowledge Jean-Paul Thiery and the team for computing scores of generic EMT signatures of ESCC cell lines. We gratefully thank all the study participants.

Conflicts of Interest

The authors declare no conflict of interest.

References

  1. Sung, H.; Ferlay, J.; Siegel, R.L.; Laversanne, M.; Soerjomataram, I.; Jemal, A.; Bray, F. Global Cancer Statistics 2020: GLOBOCAN Estimates of Incidence and Mortality Worldwide for 36 Cancers in 185 Countries. CA Cancer J. Clin. 2021, 71, 209–249. [Google Scholar] [CrossRef] [PubMed]
  2. Morgan, E.; Soerjomataram, I.; Rumgay, H.; Coleman, H.G.; Thrift, A.P.; Vignat, J.; Laversanne, M.; Ferlay, J.; Arnold, M. The Global Landscape of Esophageal Squamous Cell Carcinoma and Esophageal Adenocarcinoma Incidence and Mortality in 2020 and Projections to 2040: New Estimates from GLOBOCAN 2020. Gastroenterology 2022, 163, 649–658.e642. [Google Scholar] [CrossRef] [PubMed]
  3. Shah, M.A. Update on metastatic gastric and esophageal cancers. J. Clin. Oncol. 2015, 33, 1760–1769. [Google Scholar] [CrossRef]
  4. Thrumurthy, S.G.; Chaudry, M.A.; Thrumurthy, S.S.D.; Mughal, M. Oesophageal cancer: Risks, prevention, and diagnosis. BMJ 2019, 366, l4373. [Google Scholar] [CrossRef] [PubMed]
  5. Enzinger, P.C.; Mayer, R.J. Esophageal cancer. N. Engl. J. Med. 2003, 349, 2241–2252. [Google Scholar] [CrossRef]
  6. Joosse, S.A.; Gorges, T.M.; Pantel, K. Biology, detection, and clinical implications of circulating tumor cells. EMBO Mol. Med. 2015, 7, 1–11. [Google Scholar] [CrossRef]
  7. Brabletz, S.; Schuhwerk, H.; Brabletz, T.; Stemmler, M.P. Dynamic EMT: A multi-tool for tumor progression. EMBO J. 2021, 40, e108647. [Google Scholar] [CrossRef]
  8. Ilie, M.; Hofman, V.; Long-Mira, E.; Selva, E.; Vignaud, J.M.; Padovani, B.; Mouroux, J.; Marquette, C.H.; Hofman, P. “Sentinel” circulating tumor cells allow early diagnosis of lung cancer in patients with chronic obstructive pulmonary disease. PLoS ONE 2014, 9, e111597. [Google Scholar] [CrossRef]
  9. Ujiie, D.; Matsumoto, T.; Endo, E.; Okayama, H.; Fujita, S.; Kanke, Y.; Watanabe, Y.; Hanayama, H.; Hayase, S.; Saze, Z.; et al. Circulating tumor cells after neoadjuvant chemotherapy are related with recurrence in esophageal squamous cell carcinoma. Esophagus 2021, 18, 566–573. [Google Scholar] [CrossRef]
  10. Ko, J.M.Y.; Lam, K.O.; Kwong, D.L.W.; Wong, I.Y.; Chan, F.S.; Wong, C.L.; Chan, K.K.; Law, T.T.; Chiu, K.W.H.; Lam, C.C.S.; et al. Circulating Tumor Cell Enumeration for Serial Monitoring of Treatment Outcomes for Locally Advanced Esophageal Squamous Cell Carcinoma. Cancers 2023, 15, 832. [Google Scholar] [CrossRef]
  11. Matsushita, D.; Uenosono, Y.; Arigami, T.; Yanagita, S.; Nishizono, Y.; Hagihara, T.; Hirata, M.; Haraguchi, N.; Arima, H.; Kijima, Y.; et al. Clinical Significance of Circulating Tumor Cells in Peripheral Blood of Patients with Esophageal Squamous Cell Carcinoma. Ann. Surg. Oncol. 2015, 22, 3674–3680. [Google Scholar] [CrossRef] [PubMed]
  12. Su, P.J.; Wu, M.H.; Wang, H.M.; Lee, C.L.; Huang, W.K.; Wu, C.E.; Chang, H.K.; Chao, Y.K.; Tseng, C.K.; Chiu, T.K.; et al. Circulating Tumour Cells as an Independent Prognostic Factor in Patients with Advanced Oesophageal Squamous Cell Carcinoma Undergoing Chemoradiotherapy. Sci. Rep. 2016, 6, 31423. [Google Scholar] [CrossRef] [PubMed]
  13. Kim, T.H.; Lim, M.; Park, J.; Oh, J.M.; Kim, H.; Jeong, H.; Lee, S.J.; Park, H.C.; Jung, S.; Kim, B.C.; et al. FAST: Size-Selective, Clog-Free Isolation of Rare Cancer Cells from Whole Blood at a Liquid-Liquid Interface. Anal. Chem. 2017, 89, 1155–1162. [Google Scholar] [CrossRef] [PubMed]
  14. Hofman, V.; Ilie, M.I.; Long, E.; Selva, E.; Bonnetaud, C.; Molina, T.; Venissac, N.; Mouroux, J.; Vielh, P.; Hofman, P. Detection of circulating tumor cells as a prognostic factor in patients undergoing radical surgery for non-small-cell lung carcinoma: Comparison of the efficacy of the CellSearch Assay and the isolation by size of epithelial tumor cell method. Int. J. Cancer 2011, 129, 1651–1660. [Google Scholar] [CrossRef]
  15. Ko, J.M.Y.; Ng, H.Y.; Lam, K.O.; Chiu, K.W.H.; Kwong, D.L.W.; Lo, A.W.I.; Wong, J.C.; Lin, R.C.W.; Fong, H.C.H.; Li, J.Y.K.; et al. Liquid Biopsy Serial Monitoring of Treatment Responses and Relapse in Advanced Esophageal Squamous Cell Carcinoma. Cancers 2020, 12, 1352. [Google Scholar] [CrossRef]
  16. Zhang, X.; Peng, L.; Luo, Y.; Zhang, S.; Pu, Y.; Chen, Y.; Guo, W.; Yao, J.; Shao, M.; Fan, W.; et al. Dissecting esophageal squamous-cell carcinoma ecosystem by single-cell transcriptomic analysis. Nat. Commun. 2021, 12, 5291. [Google Scholar] [CrossRef] [PubMed]
  17. Warkiani, M.E.; Khoo, B.L.; Wu, L.; Tay, A.K.; Bhagat, A.A.; Han, J.; Lim, C.T. Ultra-fast, label-free isolation of circulating tumor cells from blood using spiral microfluidics. Nat. Protoc. 2016, 11, 134–148. [Google Scholar] [CrossRef]
  18. Lei, L.C.; Yu, V.Z.; Ko, J.M.Y.; Ning, L.; Lung, M.L. FANCD2 Confers a Malignant Phenotype in Esophageal Squamous Cell Carcinoma by Regulating Cell Cycle Progression. Cancers 2020, 12, 2545. [Google Scholar] [CrossRef]
  19. Christ, A.; Gunther, P.; Lauterbach, M.A.R.; Duewell, P.; Biswas, D.; Pelka, K.; Scholz, C.J.; Oosting, M.; Haendler, K.; Bassler, K.; et al. Western Diet Triggers NLRP3-Dependent Innate Immune Reprogramming. Cell 2018, 172, 162–175.e114. [Google Scholar] [CrossRef]
  20. Yu, V.Z.; So, S.S.; Lung, B.C.C.; Hou, G.Z.; Wong, C.W.Y.; Chung, M.K.Y.; Wong, Y.H.; Chan, K.K.; Chan, S.Y.; Law, T.T.; et al. ΔNp63-restricted viral mimicry response impedes cancer cell viability and promotes antitumor immunity in esophageal squamous cell carcinoma. 2023; Submitted. [Google Scholar]
  21. Sun, Q.; Wang, Y.; Officer, A.; Pecknold, B.; Lee, G.; Harismendy, O.; Desgrosellier, J.S. Stem-like breast cancer cells in the activated state resist genetic stress via TGFBI-ZEB1. NPJ Breast Cancer 2022, 8, 5. [Google Scholar] [CrossRef]
  22. Zavridou, M.; Mastoraki, S.; Strati, A.; Koutsodontis, G.; Klinakis, A.; Psyrri, A.; Lianidou, E. Direct comparison of size-dependent versus EpCAM-dependent CTC enrichment at the gene expression and DNA methylation level in head and neck squamous cell carcinoma. Sci. Rep. 2020, 10, 6551. [Google Scholar] [CrossRef]
  23. Liu, Z.; Jiang, M.; Zhao, J.; Ju, H. Circulating tumor cells in perioperative esophageal cancer patients: Quantitative assay system and potential clinical utility. Clin. Cancer Res. 2007, 13, 2992–2997. [Google Scholar] [CrossRef] [PubMed]
  24. Cao, M.; Yie, S.M.; Wu, S.M.; Chen, S.; Lou, B.; He, X.; Ye, S.R.; Xie, K.; Rao, L.; Gao, E.; et al. Detection of survivin-expressing circulating cancer cells in the peripheral blood of patients with esophageal squamous cell carcinoma and its clinical significance. Clin. Exp. Metastasis 2009, 26, 751–758. [Google Scholar] [CrossRef] [PubMed]
  25. Tanaka, K.; Yano, M.; Motoori, M.; Kishi, K.; Miyashiro, I.; Shingai, T.; Gotoh, K.; Noura, S.; Takahashi, H.; Ohue, M.; et al. CEA-antigen and SCC-antigen mRNA expression in peripheral blood predict hematogenous recurrence after resection in patients with esophageal cancer. Ann. Surg. Oncol. 2010, 17, 2779–2786. [Google Scholar] [CrossRef] [PubMed]
  26. Yin, X.D.; Yuan, X.; Xue, J.J.; Wang, R.; Zhang, Z.R.; Tong, J.D. Clinical significance of carcinoembryonic antigen-, cytokeratin 19-, or survivin-positive circulating tumor cells in the peripheral blood of esophageal squamous cell carcinoma patients treated with radiotherapy. Dis. Esophagus 2012, 25, 750–756. [Google Scholar] [CrossRef] [PubMed]
  27. Markou, A.; Lazaridou, M.; Paraskevopoulos, P.; Chen, S.; Świerczewska, M.; Budna, J.; Kuske, A.; Gorges, T.M.; Joosse, S.A.; Kroneis, T.; et al. Multiplex Gene Expression Profiling of In Vivo Isolated Circulating Tumor Cells in High-Risk Prostate Cancer Patients. Clin. Chem. 2018, 64, 297–306. [Google Scholar] [CrossRef] [PubMed]
  28. Zhao, X.H.; Wang, Z.R.; Chen, C.L.; Di, L.; Bi, Z.F.; Li, Z.H.; Liu, Y.M. Molecular detection of epithelial-mesenchymal transition markers in circulating tumor cells from pancreatic cancer patients: Potential role in clinical practice. World J. Gastroenterol. 2019, 25, 138–150. [Google Scholar] [CrossRef] [PubMed]
  29. Aktas, B.; Tewes, M.; Fehm, T.; Hauch, S.; Kimmig, R.; Kasimir-Bauer, S. Stem cell and epithelial-mesenchymal transition markers are frequently overexpressed in circulating tumor cells of metastatic breast cancer patients. Breast Cancer Res. 2009, 11, R46. [Google Scholar] [CrossRef]
  30. Zhang, S.; Wu, T.; Peng, X.; Liu, J.; Liu, F.; Wu, S.; Liu, S.; Dong, Y.; Xie, S.; Ma, S. Mesenchymal phenotype of circulating tumor cells is associated with distant metastasis in breast cancer patients. Cancer Manag. Res. 2017, 9, 691–700. [Google Scholar] [CrossRef]
  31. Pastushenko, I.; Blanpain, C. EMT Transition States during Tumor Progression and Metastasis. Trends Cell Biol. 2019, 29, 212–226. [Google Scholar] [CrossRef]
  32. Papadaki, M.A.; Mala, A.; Merodoulaki, A.C.; Vassilakopoulou, M.; Mavroudis, D.; Agelaki, S. Investigating the Role of CTCs with Stem/EMT-like Features in Metastatic Breast Cancer Patients Treated with Eribulin Mesylate. Cancers 2022, 14, 3903. [Google Scholar] [CrossRef] [PubMed]
  33. Han, D.; Chen, K.; Che, J.; Hang, J.; Li, H. Detection of Epithelial-Mesenchymal Transition Status of Circulating Tumor Cells in Patients with Esophageal Squamous Carcinoma. BioMed Res. Int. 2018, 2018, 7610154. [Google Scholar] [CrossRef] [PubMed]
  34. Wang, Y.; Zhang, W.; Liu, W.; Huang, L.; Wang, Y.; Li, D.; Wang, G.; Zhao, Z.; Chi, X.; Xue, Y.; et al. Long Noncoding RNA VESTAR Regulates Lymphangiogenesis and Lymph Node Metastasis of Esophageal Squamous Cell Carcinoma by Enhancing VEGFC mRNA Stability. Cancer Res. 2021, 81, 3187–3199. [Google Scholar] [CrossRef] [PubMed]
  35. Zhong, Z.; Yeow, W.S.; Zou, C.; Wassell, R.; Wang, C.; Pestell, R.G.; Quong, J.N.; Quong, A.A. Cyclin D1/cyclin-dependent kinase 4 interacts with filamin A and affects the migration and invasion potential of breast cancer cells. Cancer Res. 2010, 70, 2105–2114. [Google Scholar] [CrossRef] [PubMed]
  36. Li, Q.Q.; Xu, J.D.; Wang, W.J.; Cao, X.X.; Chen, Q.; Tang, F.; Chen, Z.Q.; Liu, X.P.; Xu, Z.D. Twist1-mediated adriamycin-induced epithelial-mesenchymal transition relates to multidrug resistance and invasive potential in breast cancer cells. Clin. Cancer Res. 2009, 15, 2657–2665. [Google Scholar] [CrossRef] [PubMed]
  37. Cheng, G.Z.; Chan, J.; Wang, Q.; Zhang, W.; Sun, C.D.; Wang, L.H. Twist transcriptionally up-regulates AKT2 in breast cancer cells leading to increased migration, invasion, and resistance to paclitaxel. Cancer Res. 2007, 67, 1979–1987. [Google Scholar] [CrossRef]
  38. Roberts, C.M.; Tran, M.A.; Pitruzzello, M.C.; Wen, W.; Loeza, J.; Dellinger, T.H.; Mor, G.; Glackin, C.A. TWIST1 drives cisplatin resistance and cell survival in an ovarian cancer model, via upregulation of GAS6, L1CAM, and Akt signalling. Sci. Rep. 2016, 6, 37652. [Google Scholar] [CrossRef]
  39. Bahar, E.; Kim, J.Y.; Kim, H.S.; Yoon, H. Establishment of Acquired Cisplatin Resistance in Ovarian Cancer Cell Lines Characterized by Enriched Metastatic Properties with Increased Twist Expression. Int. J. Mol. Sci. 2020, 21, 7613. [Google Scholar] [CrossRef]
  40. Wu, J.; Liao, Q.; He, H.; Zhong, D.; Yin, K. TWIST interacts with β-catenin signaling on osteosarcoma cell survival against cisplatin. Mol. Carcinog. 2014, 53, 440–446. [Google Scholar] [CrossRef]
  41. Bildsoe, H.; Fan, X.; Wilkie, E.E.; Ashoti, A.; Jones, V.J.; Power, M.; Qin, J.; Wang, J.; Tam, P.P.L.; Loebel, D.A.F. Transcriptional targets of TWIST1 in the cranial mesoderm regulate cell-matrix interactions and mesenchyme maintenance. Dev. Biol. 2016, 418, 189–203. [Google Scholar] [CrossRef]
  42. Thapa, N.; Lee, B.H.; Kim, I.S. TGFBIp/betaig-h3 protein: A versatile matrix molecule induced by TGF-beta. Int. J. Biochem. Cell Biol. 2007, 39, 2183–2194. [Google Scholar] [CrossRef] [PubMed]
  43. Lecker, L.S.M.; Berlato, C.; Maniati, E.; Delaine-Smith, R.; Pearce, O.M.T.; Heath, O.; Nichols, S.J.; Trevisan, C.; Novak, M.; McDermott, J.; et al. TGFBI Production by Macrophages Contributes to an Immunosuppressive Microenvironment in Ovarian Cancer. Cancer Res. 2021, 81, 5706–5719. [Google Scholar] [CrossRef] [PubMed]
  44. Chiavarina, B.; Costanza, B.; Ronca, R.; Blomme, A.; Rezzola, S.; Chiodelli, P.; Giguelay, A.; Belthier, G.; Doumont, G.; Van Simaeys, G.; et al. Metastatic colorectal cancer cells maintain the TGFβ program and use TGFBI to fuel angiogenesis. Theranostics 2021, 11, 1626–1640. [Google Scholar] [CrossRef] [PubMed]
Figure 1. Overview of the involvement of EMT in ESCC metastatic cascade. EMT confers migratory and invasive potential to ESCC cells, enabling them to (1) locally invade the basement membrane, (2) intravasate into lymphatics and blood vessels, (3) circulate through lymphatics and blood vessels to distant tissues and organs, and (4) extravasate from lymphatics and blood vessels to (5) form micrometastases and secondary tumors.
Cancers 15 05329 g001
Figure 2. Establishment of gene panels for CTC detection in patients with ESCC. (A) Transcript levels of 40 CTC markers in (i) PBMCs, and (ii) KYSE270 cells were detected by RT-qPCR and indicated with Ct values; error bars represent standard error mean. (B) Spike-in assay with (i) KYSE30/PBMCs, and (ii) KYSE270/PBMCs was performed to determine the sensitivity of 20 CTC markers in ESCC using RT-qPCR. Control, 50,000 PBMCs. (C) Heatmap of transcript levels of 20 CTC markers in CTCs from a pilot study of 14 clinical PB samples by RT-qPCR. Control, HDs. CRC, colorectal cancer. (D) Heatmap of transcript levels of 10 CTC markers in CTCs from cardiac blood of ESCC PDOX mice by RT-qPCR. Control, healthy nude mice.
Cancers 15 05329 g002
Figure 3. Evaluation of gene panels for characterizing CTCs in patients with ESCC. (A) Gene expression correction using RT-qPCR for leukocyte contamination in CTC samples. The data were visualized as a scatter plot with the median, and the line represents the reference normal fold change value. HDs (n = 5), CTC (n = 77). ** p-value < 0.01, * p-value < 0.05. (B) Heatmap of transcript levels of 10 CTC markers in 77 ESCC samples by RT-qPCR. Control, HDs. (C) Heatmap of 10 CTC markers in 22 pairs of ESCC samples between different clinical time points using RT-qPCR. P, palliative treatment, n = 9; C, curative treatment, n = 13; a, baseline; b, pre-III or one-month post-surgery. Control, HDs.
Cancers 15 05329 g003
Figure 4. Correlation of CTC marker expression at baseline with PFS or OS in ESCC subgroups. (A) Kaplan–Meier survival analysis of OS with CTC gene expression at baseline in palliative cohorts (n = 24). Gene stratification into two groups, (i) 0, 1: negative and positive gene expression; (ii) 0, 1: negative/low and high gene expression. (B) Kaplan–Meier survival analysis of PFS with CTC gene expression at baseline in curative cohorts (n = 31). Gene stratification into two groups, (i) 0, 1: negative and positive gene expression; (ii) 0, 1: negative/low and high gene expression; (iii) 0, 1: CTC-negative/low and CTC-high. (C) (i) Kaplan–Meier survival analysis of PFS with hybrid EMT CTC at baseline in palliative cohorts (n = 24), (ii) Kaplan–Meier survival analysis of OS with hybrid EMT CTC at baseline in curative cohorts (n = 31). Gene stratification into two groups 0, 1: non-hybrid and hybrid EMT CTC.
Cancers 15 05329 g004
Figure 5. Correlation of CTC marker expression at baseline with OS in ESCC patients (n = 55). (A) Kaplan–Meier survival analysis of OS with CTC gene expression at baseline in ESCC patients (n = 55). Gene expression stratification into two groups, (i) 0, 1: negative/low and high gene expression; (ii) 0, 1: CTC-negative/low and CTC-high; (iii) 0, 1: non-hybrid and hybrid EMT CTC. (B) Cox regression survival analysis of OS with CTC gene expression at baseline in ESCC patients (n = 55). Gene expression stratification into two groups, (i) 0, 1: negative/low and high gene expression; (ii) 0, 1: CTC-negative/low and CTC-high; (iii) 0, 1: non-hybrid and hybrid EMT CTC.3.5. Functional Role of TWIST1 in ESCC Metastatic Progression.
Cancers 15 05329 g005
Figure 6. Functional role of TWIST1 in ESCC metastatic progression. (A) A wound healing assay was performed to determine the cell migration ability of TWIST1-overexpressing cells. Magnification: 4×. Scale bars: 200 μm. Data show means ± SD of three independent experiments. Ctrl: control; TW OE: TWIST1 overexpression. ** p-value < 0.01. (B) A Matrigel-coated transwell assay was performed to determine the cell invasion ability of TWIST1-overexpressing cells. Magnification: 10×. Scale bars: 200 μm. Data show means ± SD of three independent experiments. ** p-value < 0.01. (C) A colony formation assay was performed to determine the cell clonogenicity of TWIST1-overexpressing cells. Data show means ± SD of three independent experiments. ** p-value < 0.01. (D) Bioluminescence signals were used to evaluate the in vivo metastasis of TWIST1-overexpressing cells. (i) All images were taken under 1 min exposure and adjusted to the same scale. (ii) Metastasis quantification. * p-value < 0.05. (iii) Speed of metastasis of TWIST1-overexpressing cells. * p-value < 0.05. (E) An MTT assay was performed to determine the cell viability of cells treated with (i) 20 μM cisplatin and (ii) 10 μM cisplatin for 24, 48, 72 h. Data show the means ± SD of three independent experiments. TW KD: TWIST1 knockdown. ** p-value < 0.01, * p-value < 0.05.
Cancers 15 05329 g006
Figure 7. Functional role of TWIST1-TGFBI-ZEB1 signaling in ESCC. (A) TGFBI-ZEB1 is regulated by TWIST1 in ESCC, as indicated by RNA-seq and RT-qPCR. (i) RNA-seq heat map of top 50 upregulated genes upon TWIST1 overexpression in KYSE450 cells. (ii) Transcript level of TGFBI downstream of TWIST1 was quantified using RT-qPCR. Error bars represent standard error mean. ** p-value < 0.01, * p-value < 0.05. (iii) overexpression. ** p-value < 0.01, * p-value < 0.05. (B) Wound healing assay was performed to determine the cell migration ability of (i) TGFBI-overexpressing cells and (ii) ZEB1-overexpressing cells. Magnification: 4×. Scale bars: 200 μm. Data show means ± SD of three independent experiments. ** p-value < 0.01. (C) Colony formation assay was performed to determine the cell clonogenicity of (i) TGFBI-overexpressing cells and (ii) ZEB1-overexpressing cells. Data show means ± SD of three independent experiments. ** p-value < 0.01. (D) MTT assay was performed to determine cell viability of (i) TGFBI-overexpressing cells and (ii) ZEB1-overexpressing cells treated with 10 μM cisplatin for 24, 48, 72 h. Data show the means ± SD of three independent experiments. * p-value < 0.05.
Cancers 15 05329 g007
Table 1. Correlations of CTC marker expression with clinicopathological features in patients with ESCC.
Clinical ParametersPatients
(n = 55)
CTC-Positive bTWIST1 cMETVEGFCKRT5FSCN1KRT18CCND1TFRCEpCAMECT2
(within group %)46 (83.6)33 (60.0)34 (61.8)25 (45.5)25 (45.5)23 (41.8)33 (60.0)22 (40.0)29 (52.7)25 (45.5)14 (25.5)
Median age (range)68 ± (33–82)
≤6828 (50.9)24 (85.7)19 (67.9)19(67.9)13 (46.4)16 (57.1)11 (39.3)19 (67.9)15 (53.6)14 (50.0)12 (42.97 (25.0)
>6827 (49.1)22 (81.5)14 (51.9)15 (55.6)12 (44.4)9 (33.3)12 (44.4)14 (51.9)7 (25.9)15 (55.6)13 (48.1)7 (25.9)
Gender
Female6 (10.9)5 (83.3)5 (83.3)4 (66.7)2 (33.3)4 (66.7)3 (50.0)5 (83.3)2 (33.3)3 (50.0)1 (16.7)1 (16.7)
Male49 (89.1)41 (83.7)28 (57.1)30 (61.2)23 (46.9)21 (42.9)20 (40.8)28 (57.1)20 (40.8)26 (53.3)24 (49.0)13 (26.5)
Tumor location
Lower25 (45.5)19 (76.0)15 (60.0)15 (60.0)10 (40.0)13 (52.0)15 (40.0)16 (64.0)8 (32.0)11 (44.0)10 (40.0)4 (16.0)
Upper/Middle30 (54.5)27 (90.0)18 (60.0)19 (63.3)15 (50.0)12 (40.0)13 (43.3)17 (56.7)14 (46.7)18 (60.0)15 (50.0)10 (33.3)
TNM stage a p d < 0.001 p = 0.001 p = 0.026
0–II22 (40.0)17 (81.0)6 (27.3)10 (45.5)9 (40.9)4 (18.2)6 (27.3)9 (40.9)6 (27.3)11 (50.0)9 (40.9)5 (22.7)
III–IV33 (60.0)29 (85.3)27 (81.8)24 (72.7)16 (48.5)21 (63.6)17 (51.5)24 (72.7)16 (48.5)18 (54.5)16 (48.5)9 (27.3)
Tumor size p = 0.031 p = 0.033
T0–T210 (18.2)5 (55.6)3 (30.0)3 (30.0)2 (20.0)4 (40.0)3 (30.0)5 (50.0)2 (20.0)3 (30.0)2 (20.0)0 (0.00)
T3–T445 (81.8)41 (89.1)30 (66.7)31 (68.9)23 (51.1)21 (46.7)20 (44.4)28 (62.2)20 (44.4)26 (57.8)23 (51.1)14 (31.1)
Node stage p = 0.006 p = 0.001p = 0.029
N0–N127 (49.1)22 (84.6)11 (40.7)13 (48.1)11 (40.7)6 (22.2)7 (25.9)14 (51.9)9 (33.3)13 (48.1)13 (48.1)5 (18.5)
N2–N328 (50.9)24 (82.8)22 (78.6)21 (75.0)14 (50.0)19 (67.9)16 (57.1)19 (67.9)13 (46.4)16 (57.1)12 (42.9)19 (32.1)
Distant Metastasis p = 0.004 p < 0.001p = 0.002p = 0.029
NO41 (74.5)32 (78.0)20 (48.8)22 (53.7)18 (43.9)13 (31.7)12 (29.3)21 (51.2)13 (31.7)19 (46.3)16 (39.0)8 (19.5)
YES14 (25.5)14 (100.0)13 (92.9)12 (85.7)7 (50.0)12 (85.7)11 (78.6)12 (85.7)9 (64.3)10 (71.4)9 (64.3)6 (42.9)
a 8th edition of the American Joint Committee on Cancer (AJCC) TNM system for Cancer Staging. b CTC-positive, samples with at least 2 detected markers. c Fold change ≥ 2.0 with the 2−ΔΔCt method. d Fisher exact test, 2-sided. Bold if p-value < 0.05.
Disclaimer/Publisher’s Note: The statements, opinions and data contained in all publications are solely those of the individual author(s) and contributor(s) and not of MDPI and/or the editor(s). MDPI and/or the editor(s) disclaim responsibility for any injury to people or property resulting from any ideas, methods, instructions or products referred to in the content.

