Article

RASSF1A Site-Specific Methylation Hotspots in Cancer and Correlation with RASSF1C and MOAP-1

1
Department of Pediatrics, Faculty of Medicine and Dentistry, University of Alberta, 113 Street 87 Avenue, Edmonton, AB T6G 2E1, Canada
2
Department of Biochemistry, Faculty of Medicine and Dentistry, University of Alberta, 113 Street 87 Avenue, Edmonton, AB T6G 2E1, Canada
3
Department of Experimental Oncology, Faculty of Medicine and Dentistry, University of Alberta, 113 Street 87 Avenue, Edmonton, AB T6G 2E1, Canada
4
Department of Surgical Oncology, Faculty of Medicine and Dentistry, University of Alberta, 113 Street 87 Avenue, Edmonton, AB T6G 2E1, Canada
5
Departments of Surgery, University of Calgary, 1331-29th St NW, Calgary, AB T2N 4N2, Canada
6
Tom Baker Cancer Centre, Department of Oncology, University of Calgary, 1331-29th St NW, Calgary, AB T2N 4N2, Canada
7
Heritage Medical Research Center, Cancer Research Institute of Northern Alberta, University of Alberta, Edmonton, AB T6G 2R7, Canada
8
Women and Children’s Health Research Institute, Edmonton Clinic Health Academy (ECHA), University of Alberta, 4-081 11405 87 Avenue NW Edmonton, AB T6G 1C9, Canada
*
Author to whom correspondence should be addressed.
These authors contributed equally to this work.
Cancers 2016, 8(6), 55; https://doi.org/10.3390/cancers8060055
Submission received: 18 March 2016 / Revised: 22 May 2016 / Accepted: 31 May 2016 / Published: 10 June 2016
(This article belongs to the Special Issue RASSF Signalling in Cancer)

Abstract

:
Epigenetic silencing of RASSF1A is frequently observed in numerous cancers and has been previously reported. The promoter region of RASSF1A is predicted to have 75 CpG sites, and very few studies demonstrate how the methylation of these sites affects expression. In addition, the expression relationship between RASSF1A and its downstream target, modulator of apoptosis 1 (MOAP-1), is poorly understood. In this study, we have explored the mRNA expression of RASSF1A, MOAP-1 and the well-characterized splice variant of RASSF1, RASSF1C, in cancer cell lines and primary tumors. We confirmed that the RASSF1A promoter is robustly methylated within a 32-CpG region in solid tumors and results in lower mRNA expression. The MOAP-1 promoter contains ~110 CpG sites, but was not found to be methylated in cancer cell lines when 19 predicted CpG sites were explored. Interestingly, MOAP-1 mRNA expression positively correlated with RASSF1A expression in numerous cancers, whereas RASSF1C expression remained the same or was increased in cell lines or tissues with epigenetic loss of RASSF1A. We speculate that MOAP-1 and RASSF1A may be more intimately connected than originally thought, and the expression of both are warranted in experimental designs exploring the biology of the RASSF1A/MOAP-1 molecular pathway.

1. Introduction

The RASSF family has varied functions and is composed of 10 family members. The expression of most of these family members is controlled by promoter-specific methylation to varying degrees to suggest a tumor suppressor function and importance in growth control. RASSF1A and RASSF1C originate from the same genomic area on chromosome 3 by alternate splicing using different promoters. RASSF1A promoter methylation gene silencing occurs in several solid cancers, and undetectable or low percent methylation is observed in hematological cancers (with the exception of Hodgkin’s lymphoma) [1]. In addition to direct and inflammation driven epigenetic mechanisms regulating RASSF1A expression, p53-directed DNMT1 methylation of RASSF1A [2], as well as microRNA regulation of RASSF1A have been documented [3]. For some patients with solid cancers, epigenetic changes in RASSF1A can be detected in leukocytes [4], urine [5], nipple aspirates [6] and saliva [7] to support the identification of circulating tumor cells and to highlight non-invasive methods to detect hypermethylation of RASSF1A. Recently, RASSF1A hypermethylation was detected in leukocytes in workers exposed to radiation during the Chernobyl Nuclear Power Plant disaster in Russia in 1986 [8] to suggest a high susceptibility of the RASSF1A promoter to epigenetic modifications.
RASSF1A is a bona fide tumor suppressor protein that can promote death receptor-dependent cell death via TNF-R1, TRAIL or Fas activation [3,9]. It can associate with the microtubule network, regulate the activity of the anaphase-promoting complex/cyclosome (APC/C)-cdc20 complex/degradation of A and B cyclins [10,11,12] and associate with centromeric γ-tubulin to allow sister chromatid segregation. If RASSF1A is absent, improper sister chromatid separation ensues leading to inheritable aneuploidy and malignancy. We have demonstrated that RASSF1A can restrict NFκB activation and prevent uncontrolled inflammation in intestinal cells [13]. These biological functions are lost once epigenetic regulation of RASSF1A occurs.
Current Rassf1a single or double knockout mice generated by various laboratories are viable and fertile. However, by 12–16 months of age, Rassf1a−/− mice have increased tumor incidence (especially in the breast, lung, gastrointestinal tract and immune system, e.g., B-cell-related lymphomas) and develop tumors in response to chemical carcinogens [14,15]. Beyond six months, we have observed the spontaneous colitis-like phenotype in Rassf1a−/− mice that was accompanied with increased cytokine production [16] indicating a possible role for RASSF1A in regulating inflammation. Rassf1a−/−Apc+/Min [17] mice have obstructive polyp formation, and Rassf1a−/−p53−/− reveal decreased survival from >600 days for the Rassf1a−/− single knockout to <136 days for Rassf1−/−p53−/−, mainly getting sick from the malignancies that develop [18].
Aiding in the ability of RASSF1A to promote extrinsic cell death is its downstream effector, MOAP-1. MOAP-1 can also promote intrinsic cell death [9,19], activation of BH3-containig proteins and is regulated in cancer [20] by ubiquitin-dependent degradation. Although the CpG island of MOAP-1 is 954 base pair long containing about 110 CpG sites within the promoter region (as obtained via MethPrimer [21]), it does not appear to be regulated by promotor-specific methylation in cancers [22] [23]. Since RASSF1A is involved in cell death [9], cell cycle control [24,25] and regulation of NFκB [13], the biology of RASSF1A appears to suggest that MOAP-1 and RASSF1A may be more linked than originally thought to suggest an overlap of function. In this study, we wanted to explore detailed CpG methylation of RASSF1A and link it to RASSF1C and MOAP-1 expression.

2. Results

RASSF1A epigenetic silencing has been documented in numerous reports. The frequently-used methylation-specific PCR (MSP) or combined bisulfite modification restriction enzyme analysis (COBRA) techniques can only detect methylation of a few sites, are not quantitative and only give average methylation readout. Here, we developed two pyrosequencing assays covering 32CpGs in the RASSF1A promoter (Figure 1). The methylation at individual CpGs correlated with the average methylation percentage, although there was some variation in the methylation percentage of each CpG (Figure 2 and Figure S1a–d). This observation was consistent in cancer cell lines (Figure 2a) and tumor tissues from breast (Figure 2b), colorectal (Figure 2c) and thyroid cancer (Figure 2d). For colorectal cancer, a methylation hotspot was identified whereby CpG 1–7 contributed to most of the methylation observed in the RASSF1A promoter from this patient population. In contrast, the average promoter methylation value for RASSF1A in either breast or thyroid cancer patients can be obtained from methylation % from any of the CpG sites within the RASSF1A promoter. We defined a hotspot as a region with a relatively high methylation in comparison to its surroundings that is found in most samples analyzed.

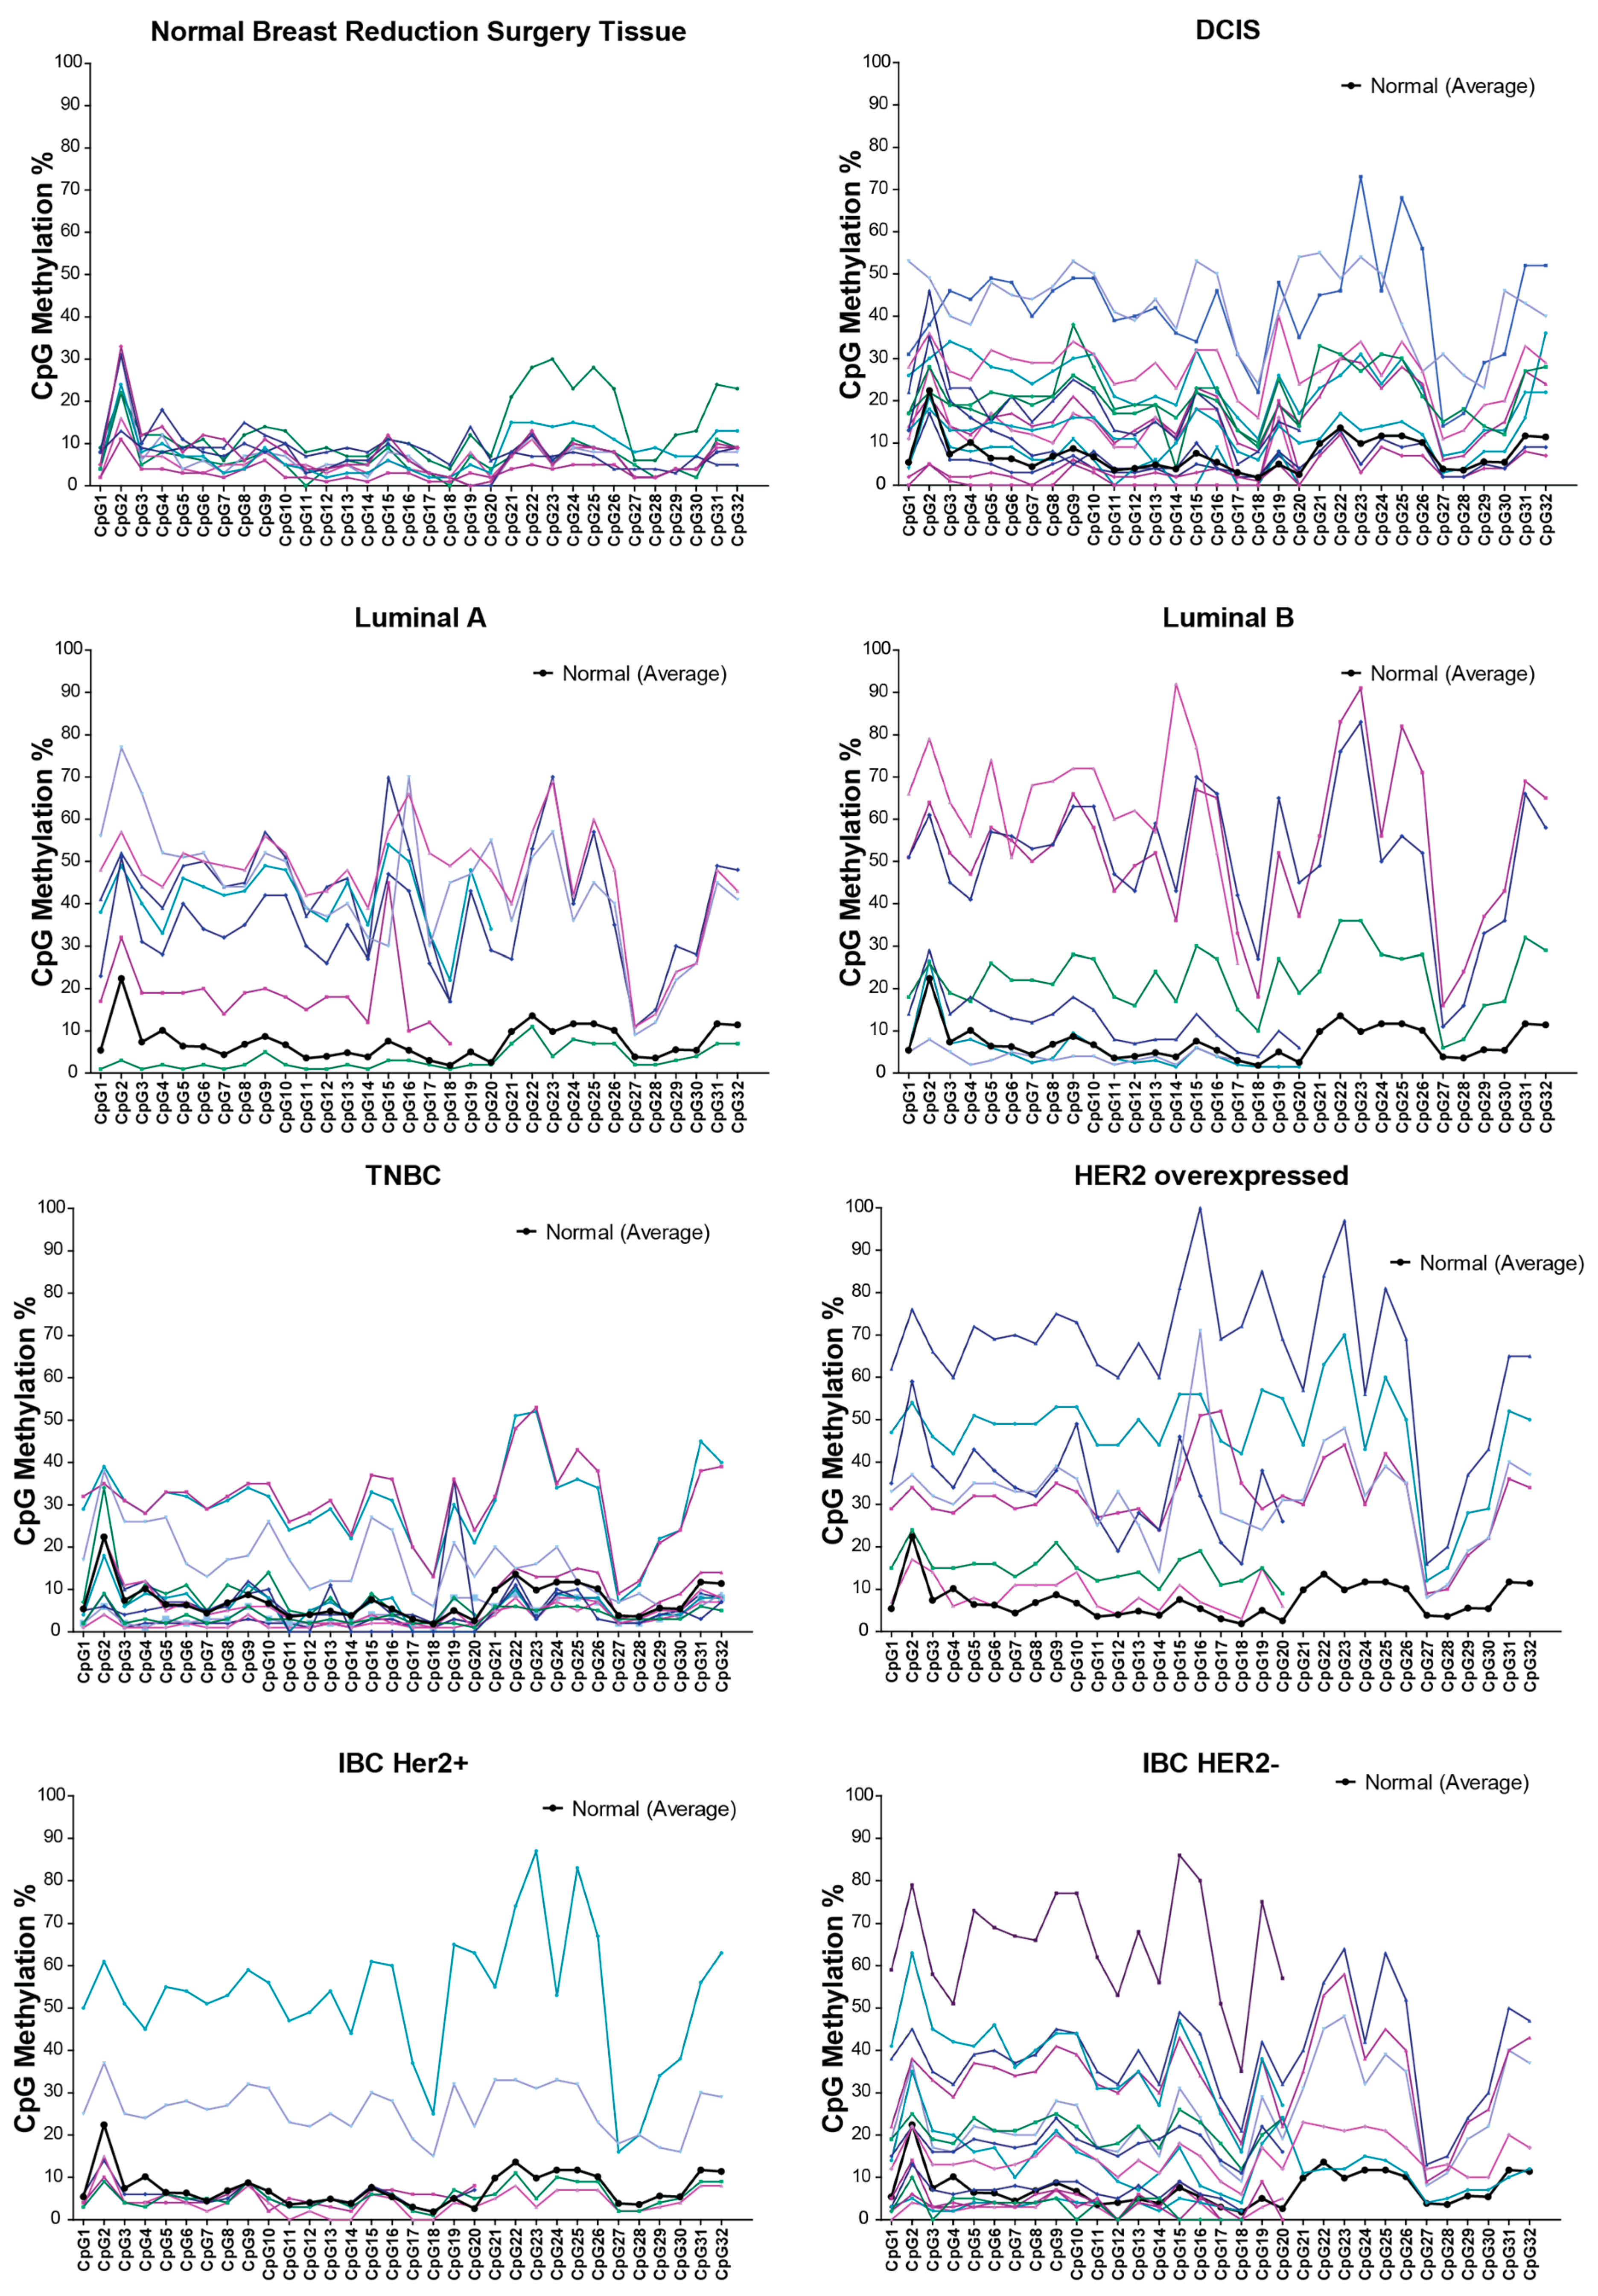
2.1. RASSF1A Promoter Methylation in Cancer Tumor Tissue

We analyzed the RASSF1A methylation status in 69 breast cancer patients and 12 reduction mammoplasty controls from cancer-free women. Breast cancer patients were grouped according to tumor feature, invasive and noninvasive, hormone receptor status as Luminal A (Her2−, ER+, PR+/–), Luminal B (Her2+, ER+, PR+/−), Her2 overexpressed (Her2+, ER−, PR–), triple negative (Her2−, ER−, PR−) and, lastly, according to inflammatory breast cancer (IBC) −/+ Her2/Neu. In normal breast reduction surgery tissue the average RASSF1A methylation was 7% ± 2.5% versus 26% ± 16.6% inbreast cancer tumor tissue. This is close to the average methylation reported in 238 breast cancer patients from Sweden (30.92% ± 17.34 %) [26]. The percentage of hypermethylated samples varied between breast cancer groups. Carcinoma in situ RASSF1A average methylation was 17% ± 12.5% versus invasive breast cancer 27.4% ± 17%, confirming previous reports that RASSF1A methylation may be associated with the degree of cancer invasion and be an early event in breast cancer.
Methylation of RASSF1A showed significant differences between breast cancers when grouped according to hormone receptor status. In Luminal A (Her2−), RASSF1A average methylation was 33% ± 16%, whereas in Luminal B (Her2+), RASSF1A average methylation was 44% ± 22%, which suggested that the Her2/Neu receptor may have a role in the increase seen in RASSF1A methylation. This was also supported by the results of RASSF1A average methylation in Her2/Neu overexpressed tumors (38% ± 17%) and the RASSF1A average methylation seen in triple-negative breast cancer (TNBC) (10% ± 9.5%; please see Figure 3). Similar findings were also seen in tumors from IBC patients with varying receptor status. In IBC, RASSF1A average methylation was higher in the IBC/Her2+ subtypes at 39.3% ± 22% and lower in the IBC/Her2− subtypes at 16% ± 5%. We speculate that averaging RASSF1A methylation of all 32 CpG areas may overlook the areas that are considered to be hot spots for methylation (see Figure 3). For breast cancer, these areas map to CpG2, 9, 13, 14–16, 19, 23–25 and 31, suggesting common susceptible CpGs regardless of the tumor feature, hormone receptor and inflammation status of breast cancer.
In thyroid cancer, RASSF1A methylation has been studied mainly by MSP, and a recent meta-analysis based on 11 studies suggested that it may play a role in papillary thyroid cancer [27]. To our knowledge, this is the first attempt to look at the detailed CpG methylation in thyroid cancer. Analysis of 24 thyroid cancer patient tumors revealed that RASSF1A methylation was higher in primary tumors compared to normal thyroid tissues, and methylation peaks and troughs were similar to breast cancer tumors with peaks at CpG2, 9 and 14–16 and troughs at CpG3, 11–14 and 18 (Figure 4a). Surprisingly, lymph node metastatic tumors from thyroid cancer patients revealed a lower methylation than the primary tumor for unknown reasons (Figure 4b, n = 5 for lymph node metastatic tumors).
RASSF1A methylation in colorectal cancers has been studied extensively with the percentage of patients with hypermethylated RASSF1A ranging from 0% [28] to 81% [29]. Individual CpG methylation analysis of 27 colorectal cancer patients revealed a unique pattern of RASSF1A methylation with a hotspot at CpG 1–7 showing robust methylation >30% (Figure 4c). This is in contrast to what is observed in breast and thyroid cancers, where methylation appears >30% throughout the 32 CpGs (Figure 3 and Figure 4a,b). If RASSF1A methylation analysis design in CRC patients does not include CpG sites 1–7, then average methylation of <30% will be detected in CRC tumor tissues and be misleading. The importance of CpG sites 1–7 is also observed for metastatic lesions in the liver in CRC patients to suggest that the metastatic lesions resemble the primary tumors, in contrast to what we can observed for metastatic sites for thyroid cancer patients (compare Figure 4d to Figure 4b). This surprising hotspot for methylation in CRC is potentially one explanation for the varied reports of RASSF1A methylation in CRC samples. Analysis of more CRC samples is needed to explore why CRC reveals a localized hotspot for the methylation of the RASSF1A promoter. In addition, we are also currently exploring why lymph node metastasis in thyroid cancer patients does not harbor significant levels of RASSF1A promoter-specific methylation (Figure 4b).

2.2. RASSF1A Promoter Methylation in Normal and Cancer Cell Lines

Analysis of 15 breast cancer cell lines revealed significant variations amongst them. MCF10A and hTERT HME (human telomerase reverse transcriptase stably transfected human mammary epithelial cell line) are generally considered and utilized as “normal” cell lines in breast cancer research. However, the average methylation of RASSF1A in both cell lines was found to be significantly higher than the HTB125 normal breast epithelial cell line or methylation found in tissues from breast reduction surgery patients (Figure 5a). We have detected about 4.5% average methylation of RASSF1A in HTB125 normal breast epithelial cells, while MCF10A had >30% and hTERT >50% average methylation of RASSF1A promoter. This result suggests that these cells should not be utilized as normal cells with respect to RASSF1A expression and would most likely have methylation of other highly susceptible genes, such as p16, DAPK and caspase 8, that normally have expression loss when the RASSF1A promoter is methylated [3,30]. Caution is required when exploring RASSF1A function in any of these cell lines due to this inherent variability.
Methylation of RASSF1A demonstrated significant differences between breast cancer cell lines according to hormone receptor status. In Luminal A (Figure 5b, MCF7 and T47D), RASSF1A average methylation is 58% ± 16.9%, whereas in Luminal B (Figure 5b, ZR-75), RASSF1A average methylation is 67% ± 18.9%, which again suggests that the Her2 receptor may have a role in the increase seen in RASSF1A methylation. This was also supported by the results of RASSF1A average methylation in Her2 overexpressed cell lines (Figure 5c; MDA-MB-453, MDA-MB-175, MDA-MB-361 and SKBR-3) at 63% ± 20.6% versus TNBC cells (Figure 5d; Her2−: HTB 126, MDA-MB-468 and BT549) that had RASSF1A average methylation at 46.5% ± 16%. Similarly, IBC RASSF1A average methylation was higher in the IBC/Her2 overexpressed subtypes represented with IBC-3 at 79% ± 14% and lower in the IBC/Her2 triple negative subtype, Sum149, 2.8% ± 1.9% (Figure 5e). This significant difference in RASSF1A average methylation between Her2 positive and negative subtypes suggests that the lack of RASSF1A expression may have a role in the expression status of Her2, thus influencing the biology of the breast cancer cell. Interestingly, similar patterns of CpG RASSF1A promoter methylation hotspots in breast cancer tissue are found in cell lines, including CpG2, 9, 13, 14–16, 19, 23–25 and 31, except for CpG5-7, which was highly methylated only in cell lines. Similar to breast cancer tissues, these methylation hotspots within the RASSF1A promoter in breast cancer cell lines may depend on hormone receptor status and stage of disease.
Similarly, in colorectal cancer cell lines, RASSF1A epigenetic silencing varied with DLD-1 (Dukes’ type C colorectal adenocarcinoma with chromosomal and microsatellite instability and harboring mutations in K-Ras, p53 and PI3KC (P-I3-kinase), while wild-type for BRaf and PTEN [31]) and CaCO-2 having somewhat similar variation in individual CpG methylation. T84 robustly demonstrated methylation of CpG sites 1–7 similar to what is observed in CRC primary tissues (Figure 5f). CaCO-2 had robust methylation of CpG sites 1–3 and 21–27, while DLD-1 had robust methylation of almost all of the CpGs. SW480 only has mutations in K-Ras and p53. HCT116 cells have mutations in K-Ras and PI3KC. HT-29 cells have mutations in K-Ras, BRaf, PI3KC and p53. CaCO-2 cells have mutations in p53. Thus, overall, methylation of RASSF1A on CpG 1–7 and the presence of K-Ras mutations may define an aggressive CRC cell (Figure 4b and Figure 5f). Neuroblastoma cell lines also had robust methylation of almost all of the CpGs (Figure 5g) and can harbor mutations in both K-Ras and B-Raf [32]. These results demonstrate the importance of mapping individual CpGs for different cancers. Average RASSF1A methylation masks the importance of CpG hotspots, as can be observed in Figure 4c for CRC (Figure 4c).
A summary of RASSF1A methylation status versus RASSF1A mRNA expression in numerous cancer cell lines suggests that >10%–20% RASSF1A methylation may result in significant loss of RASSF1A expression (Figure 6a,b). Similarly, a subgroup of colon cancer cells supported the results in Figure 6a,b to suggest that RASSF1A methylation >20%–30% would result in a significant loss of RASSF1A mRNA expression (Figure S3). In addition, we found that higher RASSF1A methylation was found in the context of p53 mutant and p53 null cells (48% ± 4% and 45% ± 4%, respectively) vs. the 31% ± 4% found in p53 wild-type cells (Figure 6b). It is believed that RASSF1A epigenetic loss is an early event during tumorigenesis that may represent an early driver of malignancy. Loss of p53 may follow the loss of RASSF1A in numerous cancers. Although this is a limited number of cells, it does illustrate that the p53 status may be important to document in the context of the loss of RASSF1A.

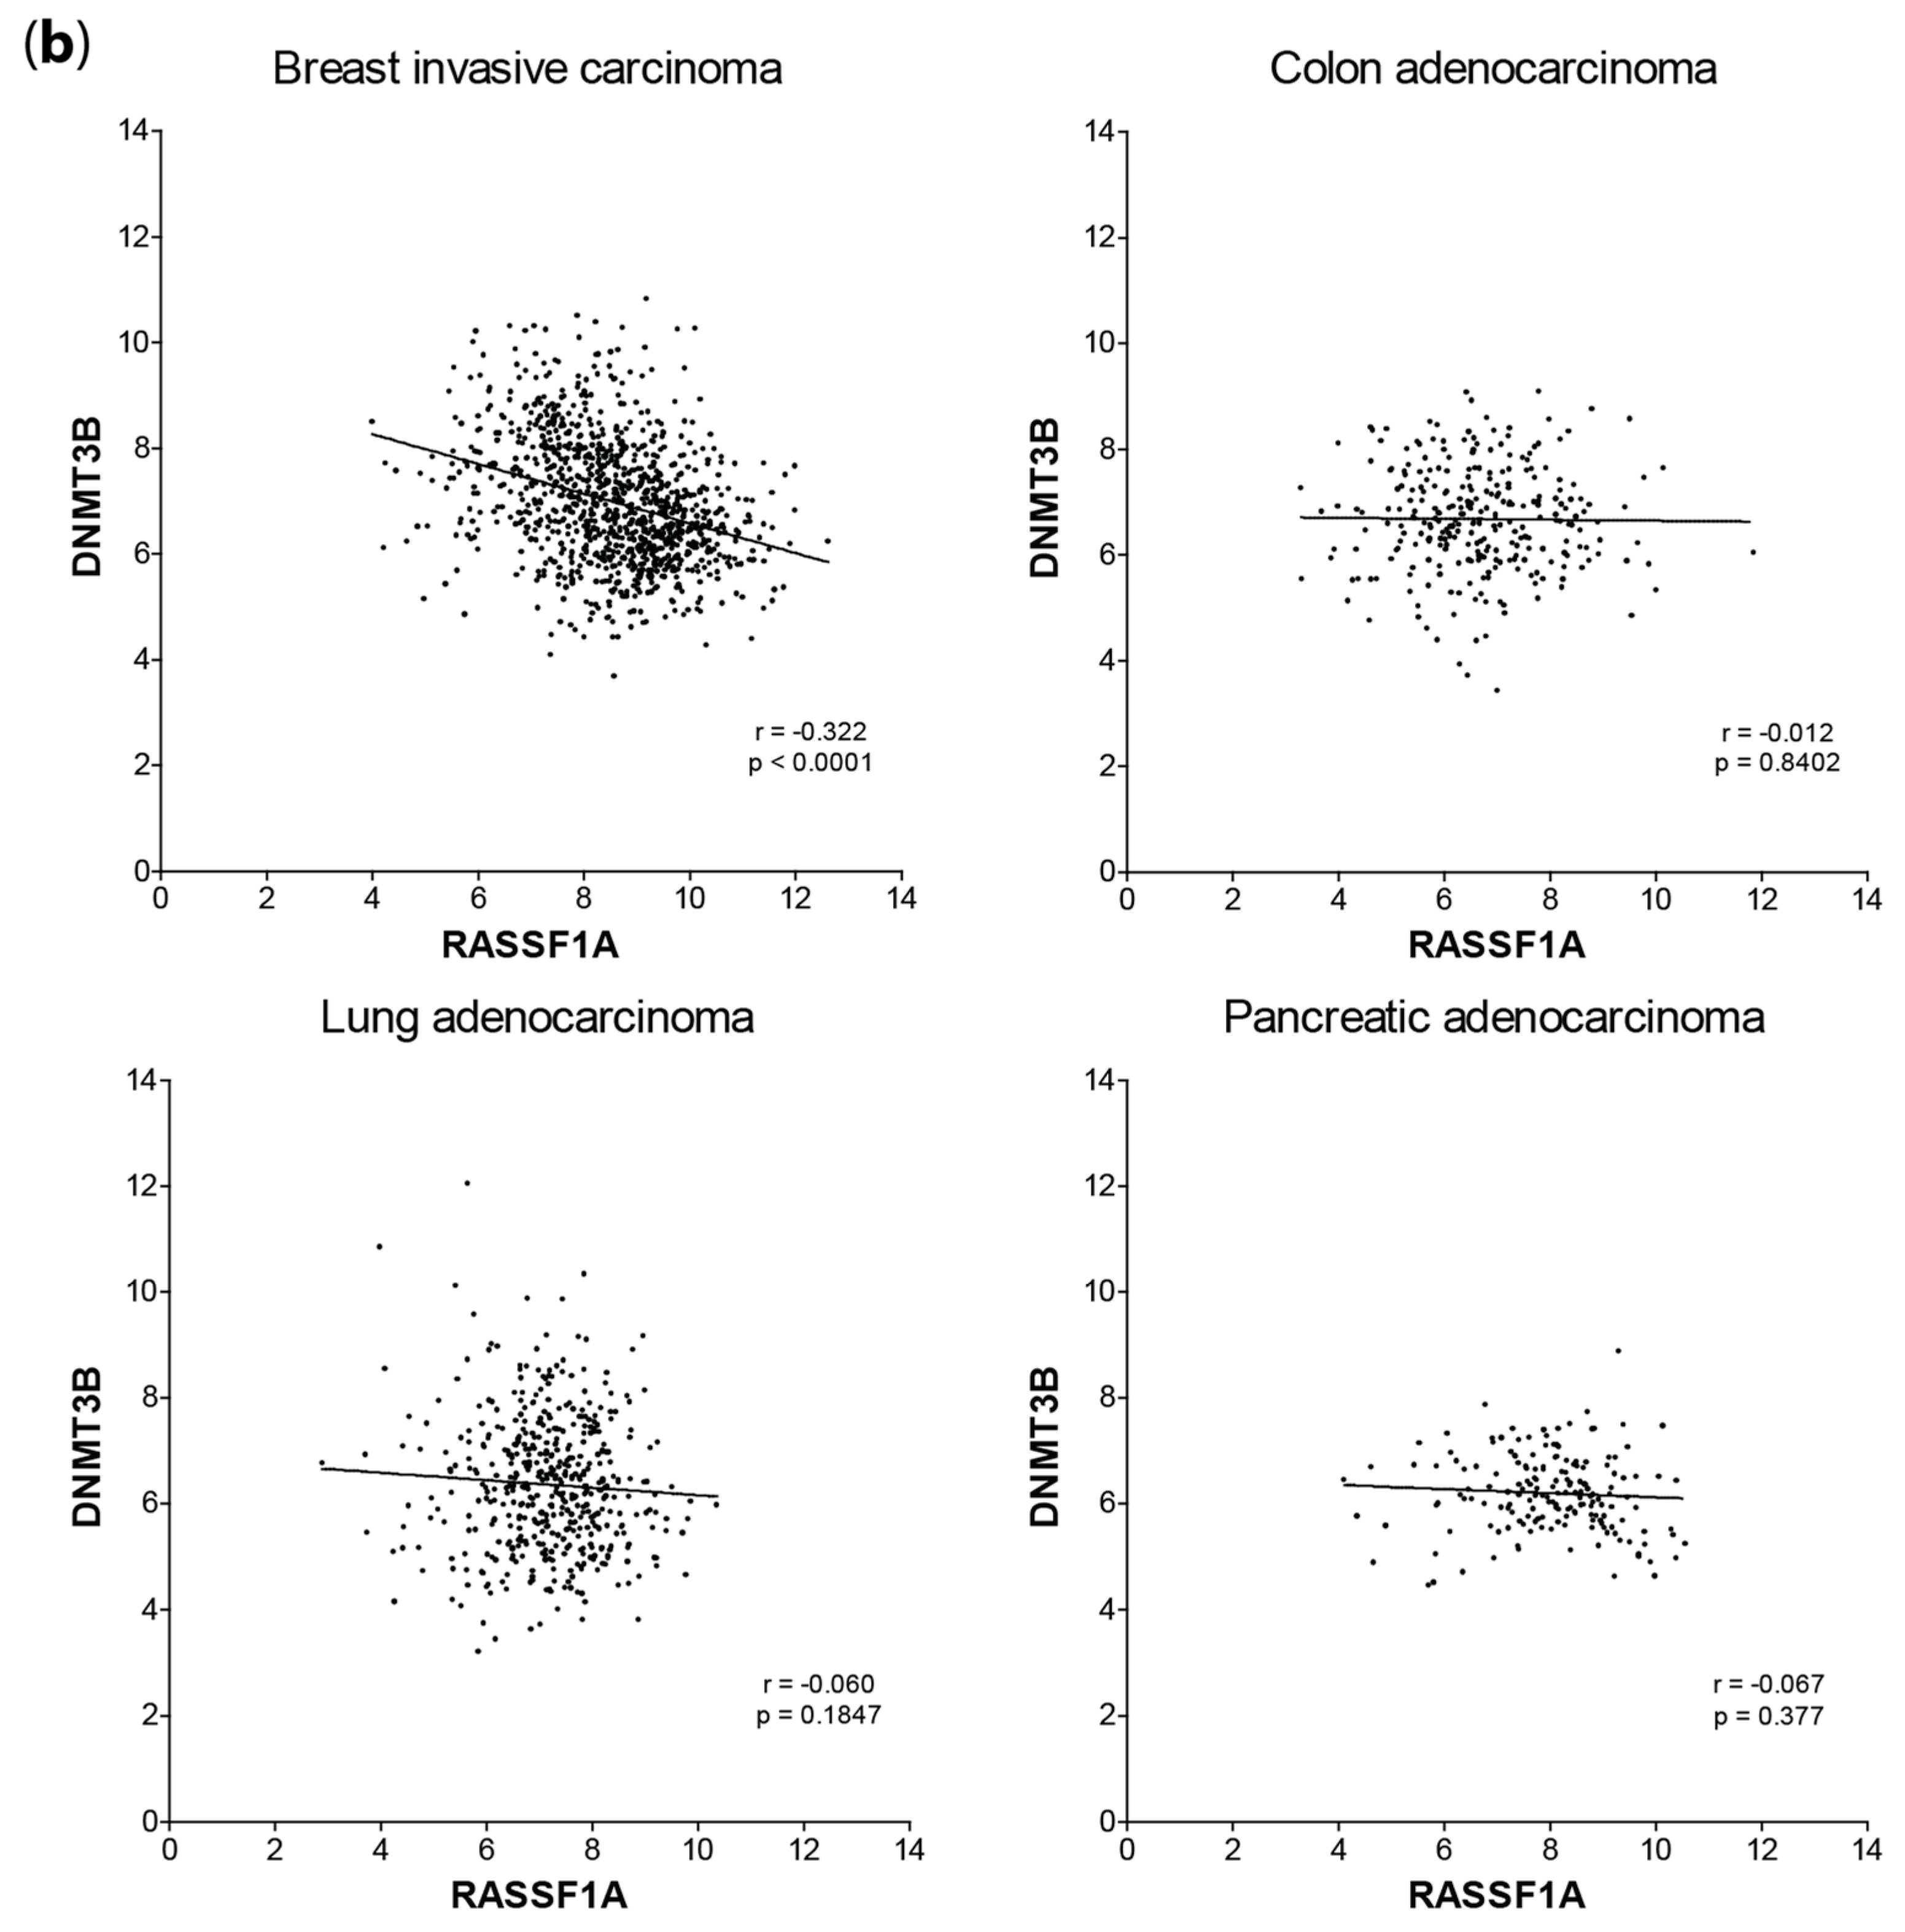
2.3. mRNA Expression Correlation of DNMT1and DNMT3B with RASSF1A

RASSF1A is epigenetically silenced by promoter-specific methylation. There is evidence for the role of DNMT1/3B in regulating the methylation of the RASSF1A promoter [2]. We therefore explored the expression status of DNMT1 and DNMTB versus RASSF1A expression in various cancers utilizing data from The Cancer Genome Atlas (TGCA) (Figure 7). Although Spearman’s r was not high, there appears to be a negative correlation of DNMT1 or DNMT3B mRNA expression with RASSF1A expression only in breast cancer (Figure 7a,b). Although a surprising observation, these data may suggest that in many cancers (apart from breast cancer), the methyltransferase activity changes of DNMT (as opposed to an mRNA changes) may govern its ability to modulate epigenetic changes.

2.4. mRNA Expression Correlation of MOAP-1 with RASSF1A

Recently, we published that the pro-apoptotic protein, MOAP-1, and downstream effector of the RASSF1A pro-apoptotic pathway is a tumor suppressor protein whose expression varies widely in cancers [20]. Analysis of data obtained from TCGA reveals evidence for the reduction of MOAP-1 expression in numerous cancers with the lung, cervical, colorectal, rectal, bladder cancers and glioblastoma (Figure 8, red tagged data points). The majority of those cancers also have epigenetic loss of RASSF1A. This is somewhat surprising considering that there is strong evidence for MOAP-1 expression being controlled by post-translational ubiquitination mechanisms utilizing several E3 ligases with a half-life of <30 min [19,33,34]. That said, the MOAP-1 promoter contains ~120 CpGs that potentially could be methylated (please see Figure S2). Empirical testing of 19 of these sites using the PyroMark technology on colon cancer cells reveals <5% methylation of these sites. Furthermore, these 19 CpG sites can only be methylated to <25% with SssI methyltransferase to suggest a very low susceptibility (or high resistance) to become methylated [22]. In contrast, most of the cells from lung, cervical, colorectal, rectal, bladder cancers and glioblastoma tumors have RASSF1A methylation to >50% [3], and SssI methyltransferase can methylate colon cancer cells to >90% [22] to suggest robust DNA methylation susceptibility mechanisms within the 32 CpG sites on the RASSF1A promoter. Thus, if expression changes in MOAP-1 do occur, it may be through the remaining ~100 CpGs that potentially could be methylated or by non-DNA methylation mechanisms, such as transcriptional regulation by MaFB, NFκB and/or STAT1, as described by Law et al. [19] or by microRNA regulation, as described by Volodko et al. [3].
According to the GeneCards databse [35], 31 microRNAs are predicted to target MOAP-1, including several that target RASSF1A. It has been demonstrated that mir-1228 [36] and mir-25 in lung cancer [37] can regulate the expression levels of MOAP-1. Both p53 and MOAP-1 appear to be targets of mir-25 and mir-1228, facilitating the progression of cancer cells in the cell cycle [36,38]. Transfecting A549 (non-small cell lung cancer) and 95-D (lung carcinoma) cells with a miR-25 inhibitor was shown to favor an apoptotic morphology [37]. The TRAIL death receptor-4 (DR-4) has also been identified as a potential mir-25 target, with reports of mir-25 being upregulated in prostate carcinoma, gastric adenocarcinoma, cholangiocarcinoma and other human cancers [39]. Dysregulation of mir-1228 has also been shown in many tumors, such as lung adenocarcinoma and breast cancer [36]. Interestingly, the anti-tumor drug resveratrol reduces the expression of mir-1228 in human non-small lung cancer [40].
As mentioned earlier, several biological functions of MOAP-1 and RASSF1A appear to overlap, and MOAP-1 is a key effector for RASSF1A biology [20]. We explored the mRNA expression of both RASSF1A and MOAP-1 in cancers. Correlation plots were quite revealing in empirical analysis using qRT-PCR in cancer tissues (Figure 8b). Data analysis from TCGA suggests that changes in MOAP-1 and RASSF1A do not occur in a random fashion in breast, lung and pancreatic cancers that have a p-value of <0.05. However, the correlation coefficients suggest that expression levels of MOAP-1 and RASSF1A may influence each other, but the correlation may not be as simple to interpret as the results from the empirical testing (Figure 8c). Thus, it is quite important to know both the MOAP-1 and RASSF1A status of cell lines/tissues utilized to explore the biology of RASSF1A or any other RASSF family member associated with MOAP-1.

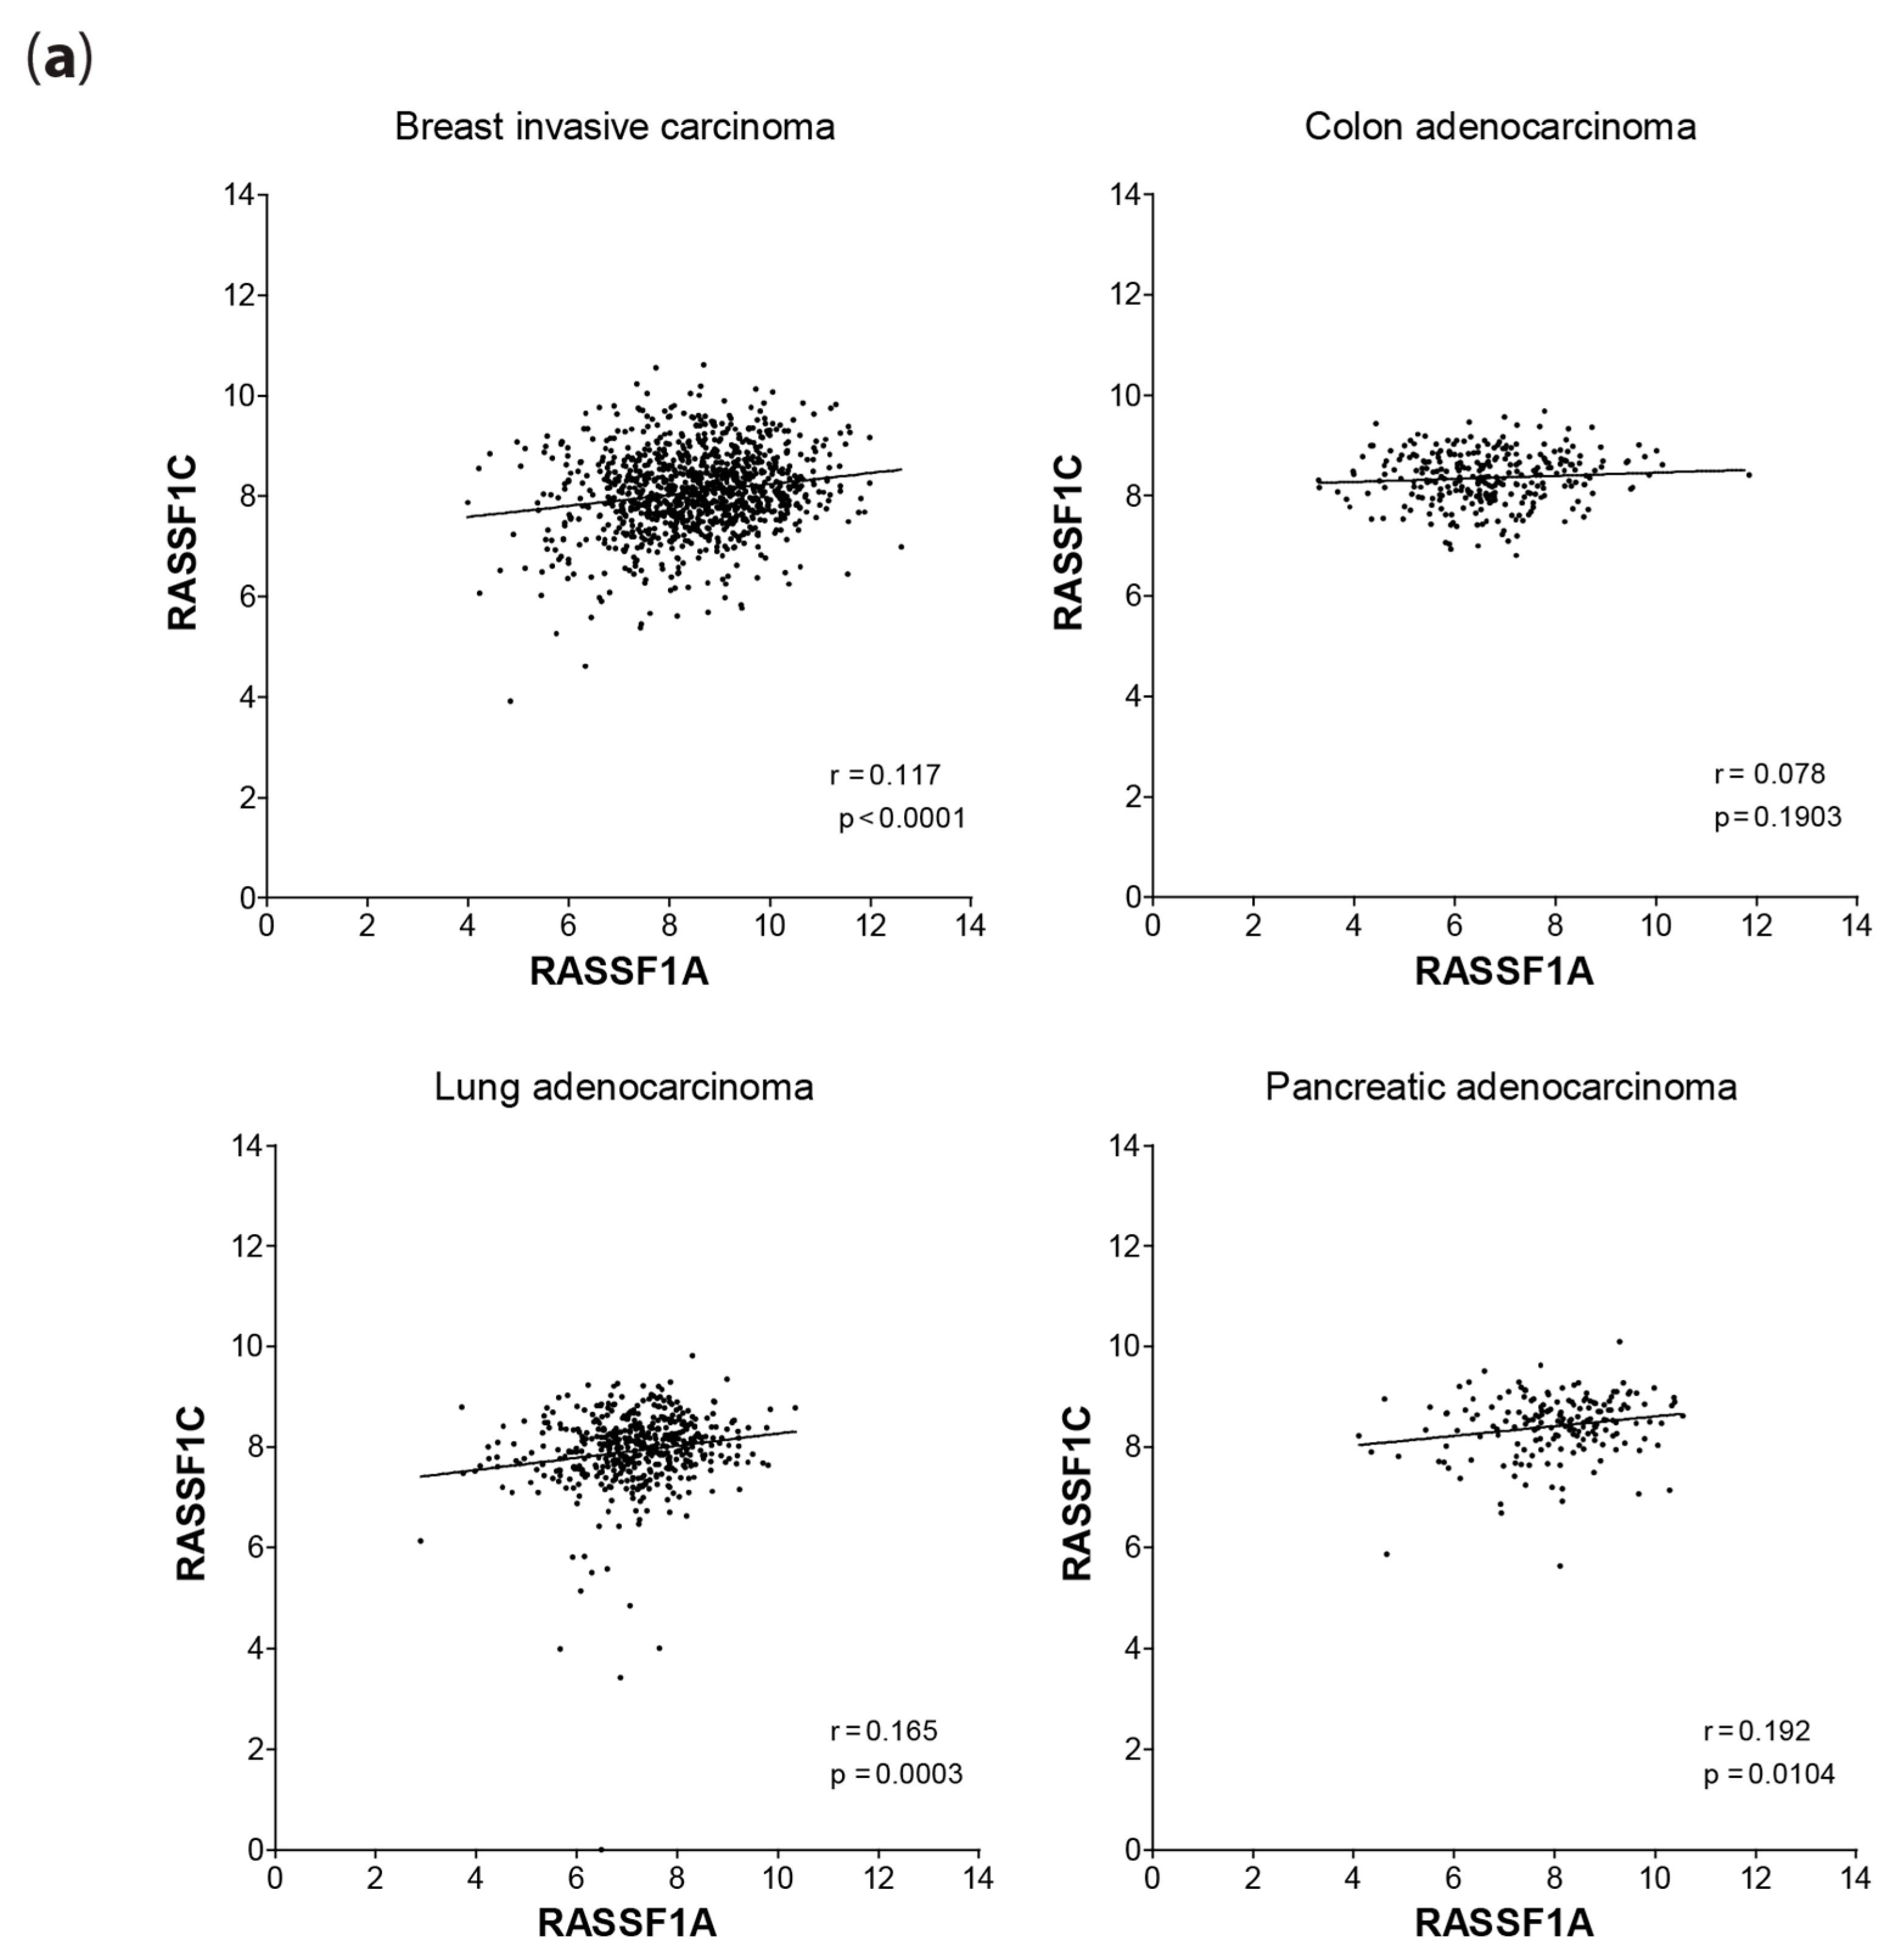
2.5. mRNA Expression Correlation of RASSF1C with RASSF1A

The RASSF1 gene has eight transcripts (A–H) arising from alternative splicing and differential promoter activity [3]. Among the RASSF1 subtypes, RASSF1A and RASSF1C are the most extensively studied members that have been demonstrated to be localized to microtubules and involved in growth control. However, growing evidence suggests a tumor suppressor function for RASSF1A and an oncogenic function for RASSF1C, especially in breast and lung cancer [41,42]. Thus, despite harboring 60% amino acid identity (mainly after amino acid 121 of RASSF1A), RASSF1A and RASSF1C display distinctive biological properties [3]. Many of the RASSF1 family members can homodimerize and heterodimerize with each other, including a RASSF1A/1C complex. Recently, an intriguing mechanism was proposed to suggest that the loss of RASSF1A would trigger either the release of RASSF1C from a RASSF1A/1C complex or promote upregulation of mRNA for RASSF1A. The result of either mechanism would be an increased pool of unbound RASSF1C to result in the activation of Src kinases and transcriptional activation of the YES associated protein (YAP) to modulate proliferation. Vlahov et al. demonstrated that protein-protein interactions of both RASSF1A and RASSF1C revealed binding of both isoforms to the tyrosine kinases c-Src, FYN and YES, but a unique association of RASSF1A to CSK, a SRC inhibitory kinase that phosphorylates SRC kinases at Y527 [43]. The loss of RASSF1A releases CSK and allows RASSF1C-induced activation of SRC kinases [43].
Based on this observation, we explored mRNA expression changes in both RASSF1A and RASSF1C in cancers from TCGA (Figure 9a). Similar to MOAP-1, data analysis from TCGA suggests that changes in RASSF1C and RASSF1A do not occur in a random fashion in breast, lung and pancreatic cancers that have a p-value of < 0.05. However, correlation coefficients reveal poor linear changes in the expression of RASSF1A with RASSF1C. That said, empirical testing of mRNA levels of RASSF1A and RASSF1C by qRT-PCR in breast cancer tumor tissues (Figure 9b) revealed that expression changes of RASSF1C can occur as a result of the loss of RASSF1A. It can be seen that RASSF1A expression decreases and RASSF1C increases in cancers compared to normal. Empirical testing of RASSF1A:RASSF1C mRNA levels in thyroid and colorectal tumor tissues support our observations in breast cancer. Furthermore, the selection pressure towards RASSF1A/RASSF1C changes in cancer is sustained in metastatic sites for CRC (liver), but not for thyroid (lymph node; Figure 9b). We are currently exploring why lymph node metastasis as a result of thyroid cancers does not harbor RASSF1A promoter-specific methylation.
Nevertheless, Figure 9b supports the observation by Vlahov et al. [43] to suggest that RASSF1A/RASSF1C expression levels can be altered in many cancers to result in the activation of Src [43]. These observations add to the need to monitor the expression of both RASSF1A and RASSF1C (and Src activity) when exploring the new and established biology of RASSF1A. Database search results for RASSF1 cannot be equated to RASSF1A unless the methodology has two probes for RASSF1A and RASSF1C (such as RNA-sequencing) to avoid underestimating the expression loss of RASSF1A.

3. Discussion

RASSF1A methylation analysis revealed some interesting aspects of the regulation of RASSF1A in cancers. It has been previously shown by MSP and COBRA that some CpGs in the RASSF1A promoter are more relevant biologically for transcription regulation. In lung cancer, it was found that there are eight CpGs in the promoter area and six in the first exon that transcriptionally are more important than the other CpGs [46]. In breast cancer, it also has been shown that RASSF1A methylation has a progressive nature starting in the first exon and spreading into the promoter and promoter methylation (not exon 1 methylation) correlated with RASSF1A expression silencing [47]. However, the extent of methylation at individual CpG sites remains largely unknown. We utilized pyrosequencing to explore the methylation signature of 32 of 75 potential CpGs in the promoter of the RASSF1A gene in both cell lines and tumor tissues. This analysis revealed CpG methylation hotspots within the RASSF1A promoter in both patient tumor tissues and cancer cell lines. Although, RASSF1A is heavily methylated, hope is there that it can be reversed with the DNA methyltransferase inhibitors, 5-azacytidine or 5-aza-2’-deoxycytidine (Decitabine) [48], or with the adenosine metabolism uncoupler, dipyridamole (DIPY), in combination with a synthetic antifolate activator (3-O-(3,4,5-trimethoxybenzoyl)-(2)-epicatechin; TMECG) [49]. Treatment of cells with both resulted in increased cell death and growth inhibition. Active research into how to efficiently deliver 5-azacytidine or 5-aza-2’-deoxycytidine to tumor sites will enhance the usefulness of this DNA methyltransferase inhibitor.
RASSF1A expression has been demonstrated to be regulated by epigenetic silencing directly by DNMT [31] and indirectly by p53/death-associated protein 6 (DAXX) biology [2]. It was demonstrated that p53 binding to the RASSF1A promoter resulted in the recruitment of DAXX and DNMT1, DNA methylation and inactivation of the RASSF1A promoter. Interestingly, it was the DAXX expression levels (and not the p53 expression levels) that affected the rates of RASSF1A methylation [2]. Our data in Figure 6c may suggest some influence of p53 on the methylation status of RASSF1A, but further population-based analysis may be needed to confirm the influence of p53 mutational status on RASSF1A promoter-specific methylation. In a genome-wide RNAi screen, it was found that homeobox protein HOXB3 is required for RASSF1A promoter hypermethylation [31,50]. It appears that HOXB3 binds to the DMNT3B gene to increase its expression. DNMT3B then is recruited to the RASSF1A locus through interactions with polycomb repressor complex 2 (PRC2) and MYC, where it methylates the RASSF1A promoter [31]. RASSF1A may well be regulated through multiple mechanisms depending on tissue types.
Epigenetic regulation of RASSF1A has also been demonstrated to be modulated by long non-coding RNA (lncRNA). It was shown that non-spliced lncRNA transcribed from the antisense strand of RASSF1A forms an RNA/DNA hybrid at the RASSF1A transcription site and PRC2 to the RASSF1A promoter. This results in increased methylation of histone H3K27 at the RASSF1A promoter and reduction of transcriptional activity [51]. Also, more than likely, the discrepancies between RASSF1A promoter methylation and its mRNA expression level in some samples could be explained by micro-RNA (miRNA) involvement in RASSF1A expression. Computer analysis predicts that RASSF1A mRNA can be targeted by at least fifteen miRNAs (miR-326, -330, -149, -16, -497, -504, -410, -99a, -99b, -100, -124, -193, -193b, -182, -181a,b,c,d) [3]. Recent empirical study proved that miR-181b targets and regulates the expression of RASSF1A in colorectal cancer [52]. mir-602 has also been shown to change RASSF1A mRNA expression in hepatoma cells and hepatocellular carcinoma [53]. Therefore, all of these mechanisms may be in play to regulate RASSF1A and all warrant detailed investigations in cancer and other diseases that have expression loss of RASSF1A.
Interestingly, MOAP-1 expression positively correlated with RASSF1A expression to suggest an intimate connection beyond biological function. Although located on chromosomes 3p and 14q, it will be interesting to explore why there is this connection between these two proteins and genes. Furthermore, since RASSF1C expression and/or function are heightened in the context of the loss of RASSF1A, it will be interesting to see how MOAP-1 biology is affected by the loss of RASSF1A. It is known that death receptor-dependent cell death (or extrinsic cell death) is significantly lost when RASSF1A is epigenetically silenced, but it remains to be determined if intrinsic cell death pathways are lost or MOAP-1 stability and ubiquitination status are affected by increased RASSF1C expression and loss of RASSF1A.
Epigenetic loss of RASSF1A has now been patented by several individuals as a diagnostic test for some cancers [54,55] and represents a target for restoring normal biological function to the cell by reversing DNA methylation [56]. Although several groups have successfully restored RASSF1A expression levels using 5-azacytidine or 5-aza-2’-deoxycytidine, targeting to specific tissues and specificity for RASSF1A are limitations on its clinical applications. Epigenetic regulation by DNA methylation may not be the predominant choice for mRNA regulation in all cancers. Detailed analysis of RASSF1A mRNA expression in each cancer is needed to better understand how it is regulated and how to regain function in that tissue/cancer. As observed in this study, RASSF1A epigenetic silencing is robust and widespread within the RASSF1A promoter in breast, thyroid and neuroblastoma tumor tissues and cell lines, whereas in CRC tumor tissues and cell lines, methylation of RASSF1A is not widespread over the 32 CpGs explored in this study. This may suggest that factors beyond the presence of susceptible CpG sites are likely responsible for the level of epigenetic silencing observed in these and other cancers. This study has begun to uncover the role of each CpG in controlling RASSF1A expression, and more analysis is needed to understand how DNA methylation, microRNA, long noncoding RNA and other mechanisms (such as histone modifications around the chromosome 3p.21) can cooperatively regulate RASSF1A gene expression.

4. Materials and Methods

4.1. Cancer Samples

The breast cancer tissues were obtained from the Alberta Cancer Research BioBank; colorectal cancer samples were obtained from the University of Calgary Gastrointestinal/Hepatobiliary Tumor; and thyroid cancer samples from Todd P.W. McMullen. All tissues were snap frozen within 30 min to preserve the RNA.

4.2. Cell Lines

HCT-116, SW480, T84 and HT29 (Eytan Wine); HemaLP, A2070s, A2780cp, A2058, WM793 (Sujata Persad, University of Alberta, Edmonton, AB, Canada); PNTIA, Hs578, HepG2, Hep3B, DU145, PC3, Hep3B (CRUK, London, UK); SH-SY5Y, SKNAS, Nub7, Be(2)C, A2780cp, LAN-1, ImR-32, GoTo, KAN (Roseline Godbout, University of Alberta, Edmonton, AB, Canada); PANC1, MDAMB-468, SKRB3, HTB26, MCF10A, hTERT HME, MDAMB453, MDAMB361, BT20, ZR75-1, HTB25, T47D (Mary Hitt/David Murray/Bonnie Andrais, University of Alberta, Edmonton, AB, Canada, and Cross Cancer Institute, Edmonton, AB, Canada); OVCAR3, SKOV3, Es-2 2c (YangXin Fu, University of Alberta, AB, Canada); IBC-3 (Wendy Woodward, MD Anderson Cancer Center); and DLD-1. SUM149 was obtained from Sophia Merajver, University of Michigan Medical School and School of Public Health, MI, USA.

4.3. DNA Isolation and Bisulfite Treatment

Extraction of genomic DNA from biopsies and cells was performed using the QIAGEN Allprep DNA/RNA Mini Kit (Qiagen, Hilden, Germany) and quantified with a NanoDrop ND-1000 (PeqLab, Erlangen, Germany). Bisulfite modification of genomic DNA (1 μg), converting all unmethylated, but not methylated cytosines to uracil, was performed using the EZ DNA Methylation-Gold kit (Zymo Research, Irvine, CA, USA) with slight modification of the manufacturer’s protocol (DNA was eluted in 30 μL M-elution buffer instead of the 10 μL recommended). The bisulfite-treated DNA was used for pyrosequencing. The efficiency of the bisulfite conversion was checked by pyrosequencing.

4.4. Methylation Analysis by Pyrosequencing

Pyrosequencing [57] was performed on a PyroMark Q24 system (Qiagen) with 2 sets of primers (sequences are provided in Table 1). The Assay2 covers 11 CpGs in the promoter and 1 CpG in exon 1 of the RASSF1A. Assay1 covers 20 CpGs located right upstream of the 12 CpGs covered by Assay2 (Figure 1). The PCR was performed using PyroMark PCR Kit (Qiagen) in a volume of 25 µL containing 12.5 µL of 2× PyroMark PCR Master Mix, 1.25 µL of each PCR primer (5 µM), 2.5 µL of 10× CoralLoad Concentrate, 6.5 µL high purity water and 1 µL of bisulfite-treated template DNA. The PCR cycling program for both primer sets was composed of an initial Taq activation/DNA denaturation step at 95 °C for 15 min, followed by 50 cycles of denaturation at 95 °C for 30 s, annealing at 58 °C for 30 s and elongation at 72 °C for 30 s. The program was finished by a final elongation step at 72 °C for 10 min. Seven microliters of PCR products were visualized by gel electrophoresis, and 10 µL were subjected to the sample preparation process for pyrosequencing. DNA was mixed with streptavidin-coated sepharose beads, followed by strand separation and washing utilizing the vacuum prep tool (Qiagen). The single-stranded DNA bound to the sepharose beads was mixed with 20 µL of 0.375 µM sequencing primer in annealing buffer and heated to 80 °C for 5 min. For the sequencing reaction PyroMark advanced reagents were used (Qiagen). The sequencing results were analyzed using the Advanced PyroMark software (Qiagen). A control PCR reaction without template DNA (no-template control) was included in the assay. PyroMark assays were carried out 2 times for accuracy.

4.5. Quantitative Real-Time PCR

Total RNA was isolated from biopsies and cells using the QIAGEN Allprep DNA/RNA Mini Kit (Qiagen, Hilden, Germany) and quantified with a NanoDrop ND-1000 (PeqLab, Erlangen, Germany). Two micrograms of RNA were treated with DNAse I (Amplification Grade, Invitrogen) at 37 °C for 30 min to eliminate possible DNA contamination and reverse transcribed by using the High Capacity cDNA Reverse Transcriptase Kit (Applied Biosystems). cDNA was diluted 1:10 with nuclease-free water. Quantitative analysis of specific mRNA expression was performed by real-time PCR on a LightCycler® 96 System (Roche, Laval, PQ, Canada). The 20-µL reaction mix contained 1.5 µL of 5 µM of each primer (please see the table for the primer sequences), 10 µL of SsoAdvanced™ Universal SYBR® Green Supermix (Bio-Rad, Mississauga, ON, Canada), 3 µL of nuclease-free water and 4 µL of diluted cDNA. No-template controls were run on each plate to test for the contamination of any assay reagents. The thermocycling conditions were initial denaturation at 95 °C for 5 min, followed by 45 cycles of denaturation at 95 °C for 10 s, annealing at 58 °C for 15 s and extension at 60 °C for 30 s. Melting curve analysis was performed by the end of each cycle to ascertain the specificity of the primers and the purity of the final PCR product. Assays were run in duplicate. The amount of target was calculated by the formula, 2−(CtGene- Ct-GAPDH) × 1000, in which Ct is the threshold cycle value. All PCR results were carried out 3 times for accuracy. In addition, PPIA (peptidylprolyl isomerase A) was used to normalize our results as an independent normalization besides GAPDH [58].

4.6. Statistical Analysis

Regression and correlation analysis of average methylation percentage versus individual CpG methylation percentage was performed using GraphPad Prizm 5 software.

4.7. TCGA Database Analysis

Level 3 TCGA RNAseqV2 gene expression data were obtained from the TCGA Data Portal [59] in August 2014 for breast cancer (BRCA), colorectal adenocarcinoma (COAD), lung adenocarcinoma (LUAD) and pancreatic adenocarcinoma (PAAD). Correlations were tested between the gene (DNMT1, DNMT3B and MOAP1) and isoform (RASSF1A: uc003dea.1; and RASSF1C: uc003dab.1) expression values (log2 [RSEM normalized values+1]). A value of 1 was added to RSEM normalized values to avoid infinite values in log calculations. We conducted all analyses and visualizations in the RStudio programming environment (v0.98.501). R/Bioconductor packages ggplot2 and plyr were used where appropriate.

5. Conclusions

RASSF1A methylation analysis revealed the importance of investigating individual CpGs as average RASSF1A methylation could obscure the methylation hotspots and underestimate methylation percentage. In addition, we can observe a positive correlation between RASSF1A and MOAP-1 in breast, colorectal and thyroid cancers upon empirical testing by qPCR. Lastly, in breast, thyroid and colorectal cancers, the ratio of RASSF1A to RASSF1C changes in the malignant state to suggest caution when obtaining mRNA expression levels from microarray studies in genomic databases.

Supplementary Materials

The following are available online at https://www.mdpi.com/2072-6694/8/6/55/s1, Figure S1: Correlation analysis of RASSF1A promoter methylation at the individual CpG site with average methylation percentage of 32 CpGs, Figure S2: MOAP1 CpG island map and the pyromark assays, Figure S3: RASSF1A expression and methylation in colorectal cancer cell lines.

Acknowledgments

We would like to thank Monika Dabrowska for her excellent technical help with DNA isolation for these studies. We would also like to thank Kathryn Graham, Adrian Driga and Katia Tonkin for their helpful suggestions in locating the correct breast cancer samples for us. In addition, we would like to thank Rene Jacobs for the use of PyromarkQ24 and Randy Nelson for technical help with it. All authors have read this manuscript and have accepted its submission.

Author Contributions

Natalia Volodko and Mohamed Salla contributed equally to the design and performance of the experiments, data analysis and manuscript editing. Alaa Zare contributed to the data analysis and plotting. and El-Arbi Abulghasem contributed to DNA/RNA isolation from the various tissues. Krista Vincent and Lynne Postovit contributed to the obtaining and plotting of all TCGA data. Mohamed Salla, Todd P.W. McMullen, Matthew G. K. Benesch and Oliver F. Bathe contributed tissue and DNA/RNA for the methylation and qRT-PCR analysis. Shairaz Baksh coordinated this study, drafted and edited this manuscript.

Conflicts of Interest

The authors declare no conflict of interest.

References

  1. Donninger, H.; Vos, M.D.; Clark, G.J. The rassf1a tumor suppressor. J. Cell Sci. 2007, 120, 3163–3172. [Google Scholar] [CrossRef] [PubMed]
  2. Zhang, H.; He, J.; Li, J.; Tian, D.; Gu, L.; Zhou, M. Methylation of rassf1a gene promoter is regulated by p53 and daxx. FASEB J. 2013, 27, 232–242. [Google Scholar] [CrossRef] [PubMed]
  3. Volodko, N.; Gordon, M.; Salla, M.; Ghazaleh, H.A.; Baksh, S. Rassf tumor suppressor gene family: Biological functions and regulation. FEBS Lett. 2014, 588, 2671–2684. [Google Scholar] [CrossRef] [PubMed]
  4. Cho, Y.H.; Yazici, H.; Wu, H.C.; Terry, M.B.; Gonzalez, K.; Qu, M.; Dalay, N.; Santella, R.M. Aberrant promoter hypermethylation and genomic hypomethylation in tumor, adjacent normal tissues and blood from breast cancer patients. Anticancer Res. 2010, 30, 2489–2496. [Google Scholar] [PubMed]
  5. Zhong, X.; Isharwal, S.; Naples, J.M.; Shiff, C.; Veltri, R.W.; Shao, C.; Bosompem, K.M.; Sidransky, D.; Hoque, M.O. Hypermethylation of genes detected in urine from ghanaian adults with bladder pathology associated with schistosoma haematobium infection. PLoS ONE 2013, 8, e59089. [Google Scholar] [CrossRef] [PubMed]
  6. Dammann, R.; Schagdarsurengin, U.; Seidel, C.; Strunnikova, M.; Rastetter, M.; Baier, K.; Pfeifer, G.P. The tumor suppressor rassf1a in human carcinogenesis: An update. Histol. Histopathol. 2005, 20, 645–663. [Google Scholar] [PubMed]
  7. Zhang, C.Y.; Zhao, Y.X.; Xia, R.H.; Han, J.; Wang, B.S.; Tian, Z.; Wang, L.Z.; Hu, Y.H.; Li, J. Rassf1a promoter hypermethylation is a strong biomarker of poor survival in patients with salivary adenoid cystic carcinoma in a chinese population. PLoS ONE 2014, 9, e110159. [Google Scholar] [CrossRef] [PubMed]
  8. Kuzmina, N.S.; Lapteva, N.; Rubanovich, A.V. Hypermethylation of gene promoters in peripheral blood leukocytes in humans long term after radiation exposure. Environ. Res. 2016, 146, 10–17. [Google Scholar] [CrossRef] [PubMed]
  9. Foley, C.J.; Freedman, H.; Choo, S.L.; Onyskiw, C.; Fu, N.Y.; Yu, V.C.; Tuszynski, J.; Pratt, J.C.; Baksh, S. Dynamics of rassf1a/moap-1 association with death receptors. Mol. Cell. Biol. 2008, 28, 4520–4535. [Google Scholar] [CrossRef] [PubMed]
  10. Richter, A.M.; Pfeifer, G.P.; Dammann, R.H. The rassf proteins in cancer; from epigenetic silencing to functional characterization. Biochim. Biophys. Acta 2009, 1796, 114–128. [Google Scholar] [CrossRef] [PubMed]
  11. Moshnikova, A.; Kuznetsov, S.; Khokhlatchev, A.V. Interaction of the growth and tumour suppressor nore1a with microtubules is not required for its growth-suppressive function. BMC Res. Notes 2008, 1. [Google Scholar] [CrossRef] [PubMed]
  12. Song, M.S.; Chang, J.S.; Song, S.J.; Yang, T.H.; Lee, H.; Lim, D.S. The centrosomal protein ras association domain family protein 1a (rassf1a)-binding protein 1 regulates mitotic progression by recruiting rassf1a to spindle poles. J. Biol. Chem. 2005, 280, 3920–3927. [Google Scholar] [CrossRef] [PubMed]
  13. Gordon, M.; El-Kalla, M.; Zhao, Y.; Fiteih, Y.; Law, J.; Volodko, N.; Mohamed, A.; El-Kadi, A.O.; Liu, L.; Odenbach, J.; et al. The tumor suppressor gene, rassf1a, is essential for protection against inflammation—Induced injury. PLoS ONE 2013, 8, e75483. [Google Scholar] [CrossRef] [PubMed]
  14. Tommasi, S.; Dammann, R.; Zhang, Z.; Wang, Y.; Liu, L.; Tsark, W.M.; Wilczynski, S.P.; Li, J.; You, M.; Pfeifer, G.P. Tumor susceptibility of rassf1a knockout mice. Cancer Res. 2005, 65, 92–98. [Google Scholar] [PubMed]
  15. Van der Weyden, L.; Tachibana, K.K.; Gonzalez, M.A.; Adams, D.J.; Ng, B.L.; Petty, R.; Venkitaraman, A.R.; Arends, M.J.; Bradley, A. The rassf1a isoform of rassf1 promotes microtubule stability and suppresses tumorigenesis. Mol. Cell. Biol. 2005, 25, 8356–8367. [Google Scholar] [CrossRef] [PubMed]
  16. Said, A.; Salla, M.; Gordon, M.; El-Kalla, M.; Baksh, S. Spontaneous and Age-related Inflammation in the Rassf1a−/− Mice; Departments of Pediatrics and Biochemistry, University of Alberta: Edmonton, AB, Canada, Canada Unpublished Observations; 2016. [Google Scholar]
  17. Van der Weyden, L.; Arends, M.J.; Dovey, O.M.; Harrison, H.L.; Lefebvre, G.; Conte, N.; Gergely, F.V.; Bradley, A.; Adams, D.J. Loss of rassf1a cooperates with apc(min) to accelerate intestinal tumourigenesis. Oncogene 2008, 27, 4503–4508. [Google Scholar] [CrossRef] [PubMed]
  18. Tommasi, S.; Besaratinia, A.; Wilczynski, S.P.; Pfeifer, G.P. Loss of rassf1a enhances p53-mediated tumor predisposition and accelerates progression to aneuploidy. Oncogene 2010, 30, 690–700. [Google Scholar] [CrossRef] [PubMed]
  19. Law, J.; Yu, V.C.; Baksh, S. Modulator of apoptosis 1: A highly regulated rassf1a-interacting bh3-like protein. Mol. Biol. Int. 2012, 2012. [Google Scholar] [CrossRef] [PubMed]
  20. Law, J.; Salla, M.; Zare, A.; Wong, Y.; Luong, L.; Volodko, N.; Svystun, O.; Flood, K.; Lim, J.; Sung, M.; et al. Modulator of apoptosis 1 (moap-1) is a tumor suppressor protein linked to the rassf1a protein. J. Biol. Chem. 2015, 290, 24100–24118. [Google Scholar] [CrossRef] [PubMed]
  21. Li, L.C.; Dahiya, R. Methprimer: Designing primers for methylation pcrs. Bioinformatics 2002, 18, 1427–1431. [Google Scholar] [CrossRef] [PubMed]
  22. Volodko, N.; Baksh, S. Analysis of Moap-1 Promoter-Specific Methylation in Cancer; Department of Pediatrics, University of Alberta: Edmonton, AB, Canada, Canada Unpublished Observations; 2016. [Google Scholar]
  23. Koch, A.; De Meyer, T.; Jeschke, J.; Van Criekinge, W. Mexpress: Visualizing expression, DNA methylation and clinical tcga data. BMC Genomics 2015, 16. [Google Scholar] [CrossRef] [PubMed] [Green Version]
  24. Donninger, H.; Clark, J.A.; Monaghan, M.K.; Schmidt, M.L.; Vos, M.; Clark, G.J. Cell cycle restriction is more important than apoptosis induction for rassf1a protein tumor suppression. J. Biol. Chem. 2014, 289, 31287–31295. [Google Scholar] [CrossRef] [PubMed]
  25. Jiang, L.; Rong, R.; Sheikh, M.S.; Huang, Y. Cullin-4a.DNA damage-binding protein 1 e3 ligase complex targets tumor suppressor rassf1a for degradation during mitosis. J. Biol. Chem. 2010, 286, 6971–6978. [Google Scholar] [CrossRef] [PubMed]
  26. Dhiab, M.B.; Ziadi, S.; Mestiri, S.; Gacem, R.B.; Ksiaa, F.; Trimeche, M. DNA methylation patterns in ebv-positive and ebv-negative hodgkin lymphomas. Cell. Oncol. 2015, 38, 453–462. [Google Scholar] [CrossRef] [PubMed]
  27. Jiang, J.L.; Tian, G.L.; Chen, S.J.; Xu, L.I.; Wang, H.Q. Promoter methylation of p16 and rassf1a genes may contribute to the risk of papillary thyroid cancer: A meta-analysis. Exp. Ther. Med. 2015, 10, 1549–1555. [Google Scholar] [CrossRef] [PubMed]
  28. Gonzalo, V.; Lozano, J.J.; Munoz, J.; Balaguer, F.; Pellise, M.; Rodriguez de Miguel, C.; Andreu, M.; Jover, R.; Llor, X.; Giraldez, M.D.; et al. Aberrant gene promoter methylation associated with sporadic multiple colorectal cancer. PloS ONE 2010, 5, e8777. [Google Scholar] [CrossRef] [PubMed]
  29. Sakamoto, N.; Terai, T.; Ajioka, Y.; Abe, S.; Kobayasi, O.; Hirai, S.; Hino, O.; Watanabe, H.; Sato, N.; Shimoda, T.; et al. Frequent hypermethylation of rassf1a in early flat-type colorectal tumors. Oncogene 2004, 23, 8900–8907. [Google Scholar] [CrossRef] [PubMed]
  30. Michalowski, M.B.; de Fraipont, F.; Plantaz, D.; Michelland, S.; Combaret, V.; Favrot, M.C. Methylation of tumor-suppressor genes in neuroblastoma: The rassf1a gene is almost always methylated in primary tumors. Pediatr. Blood Cancer 2008, 50, 29–32. [Google Scholar] [CrossRef] [PubMed]
  31. Palakurthy, R.K.; Wajapeyee, N.; Santra, M.K.; Gazin, C.; Lin, L.; Gobeil, S.; Green, M.R. Epigenetic silencing of the rassf1a tumor suppressor gene through hoxb3-mediated induction of dnmt3b expression. Mol. Cell 2009, 36, 219–230. [Google Scholar] [CrossRef] [PubMed]
  32. Shukla, N.; Ameur, N.; Yilmaz, I.; Nafa, K.; Lau, C.Y.; Marchetti, A.; Borsu, L.; Barr, F.G.; Ladanyi, M. Oncogene mutation profiling of pediatric solid tumors reveals significant subsets of embryonal rhabdomyosarcoma and neuroblastoma with mutated genes in growth signaling pathways. Clin. Cancer Res. 2012, 18, 748–757. [Google Scholar] [CrossRef] [PubMed]
  33. Lee, S.S.; Fu, N.Y.; Sukumaran, S.K.; Wan, K.F.; Wan, Q.; Yu, V.C. Trim39 is a moap-1-binding protein that stabilizes moap-1 through inhibition of its poly-ubiquitination process. Exp. Cell Res. 2009, 315, 1313–1325. [Google Scholar] [CrossRef] [PubMed]
  34. Huang, N.J.; Zhang, L.; Tang, W.; Chen, C.; Yang, C.S.; Kornbluth, S. The trim39 ubiquitin ligase inhibits apc/ccdh1-mediated degradation of the bax activator moap-1. J. Cell. Biol. 2012, 197, 361–367. [Google Scholar] [CrossRef] [PubMed]
  35. Rebhan, M.; Chalifa-Caspi, V.; Prilusky, J.; Lancet, D. Genecards: Integrating information about genes, proteins and diseases. Trends Genet. 1997, 13. [Google Scholar] [CrossRef]
  36. Yan, B.; Zhao, J.L. Mir-1228 prevents cellular apoptosis through targeting of moap1 protein. Apoptosis 2012, 17, 717–724. [Google Scholar] [CrossRef] [PubMed]
  37. Wu, T.; Chen, W.; Kong, D.; Li, X.; Lu, H.; Liu, S.; Wang, J.; Du, L.; Kong, Q.; Huang, X.; et al. Mir-25 targets the modulator of apoptosis 1 gene in lung cancer. Carcinogenesis 2015, 36, 925–935. [Google Scholar] [CrossRef] [PubMed]
  38. Zhang, Y.; Dai, J.; Deng, H.; Wan, H.; Liu, M.; Wang, J.; Li, S.; Li, X.; Tang, H. Mir-1228 promotes the proliferation and metastasis of hepatoma cells through a p53 forward feedback loop. Br. J. Cancer 2015, 112, 365–374. [Google Scholar] [CrossRef] [PubMed]
  39. Razumilava, N.; Bronk, S.F.; Smoot, R.L.; Fingas, C.D.; Werneburg, N.W.; Roberts, L.R.; Mott, J.L. Mir-25 targets tnf-related apoptosis inducing ligand (trail) death receptor-4 and promotes apoptosis resistance in cholangiocarcinoma. Hepatology 2012, 55, 465–475. [Google Scholar] [CrossRef] [PubMed]
  40. Bae, S.; Lee, E.M.; Cha, H.J.; Kim, K.; Yoon, Y.; Lee, H.; Kim, J.; Kim, Y.J.; Lee, H.G.; Jeung, H.K.; et al. Resveratrol alters microrna expression profiles in a549 human non-small cell lung cancer cells. Mol. Cells 2011, 32, 243–249. [Google Scholar] [CrossRef] [PubMed]
  41. Reeves, M.E.; Firek, M.; Chen, S.T.; Amaar, Y. The rassf1 gene and the opposing effects of the rassf1a and rassf1c isoforms on cell proliferation and apoptosis. Mol. Biol. Int. 2013, 2013. [Google Scholar] [CrossRef] [PubMed]
  42. Zhou, X.; Li, T.T.; Feng, X.; Hsiang, E.; Xiong, Y.; Guan, K.L.; Lei, Q.Y. Targeted polyubiquitylation of rassf1c by the mule and scfbeta-trcp ligases in response to DNA damage. Biochem. J. 2010, 441, 227–236. [Google Scholar] [CrossRef] [PubMed]
  43. Vlahov, N.; Scrace, S.; Soto, M.S.; Grawenda, A.M.; Bradley, L.; Pankova, D.; Papaspyropoulos, A.; Yee, K.S.; Buffa, F.; Goding, C.R.; et al. Alternate rassf1 transcripts control src activity, e-cadherin contacts, and yap-mediated invasion. Curr. Biol. 2015, 25, 3019–3034. [Google Scholar] [CrossRef] [PubMed]
  44. The Protein Atlas. Available online: http://www.Proteinatlas.Org/ensg00000068028-rassf1/tissue (accessed on 1 June 2016).
  45. The Genecards. Available online: http://www.Genecards.Org/cgi-bin/carddisp.Pl?Gene=rassf1 (accessed on 1 June 2016).
  46. Chang, J.W.; Hsu, H.S.; Ni, H.J.; Chuang, C.T.; Hsiung, C.H.; Huang, T.H.; Wang, Y.C. Distinct epigenetic domains separated by a ctcf bound insulator between the tandem genes, blu and rassf1a. PLoS ONE 2010, 5, e12847. [Google Scholar] [CrossRef] [PubMed]
  47. Zare-Abdollahi, D.; Safari, S.; Movafagh, A.; Ghadiani, M.; Riazi-Isfahani, S.; Omrani, M.D. Intact expression status of rassf1a in acute myeloid leukemia. Med. Oncol. 2014, 31. [Google Scholar] [CrossRef] [PubMed]
  48. Liu, R.; Zhang, X.H.; Zhang, K.; Li, W.; Wang, W.J.; Luo, D.X.; Gao, L. 5-aza-2″-deoxycytidine inhibits retinoblastoma cell by reactivating epigenetically silenced rassf1a gene. Int. J. Ophthalmol. 2014, 7, 51–56. [Google Scholar] [PubMed]
  49. Montenegro, M.F.; Saez-Ayala, M.; Pinero-Madrona, A.; Cabezas-Herrera, J.; Rodriguez-Lopez, J.N. Reactivation of the tumour suppressor rassf1a in breast cancer by simultaneous targeting of DNA and e2f1 methylation. PLoS ONE 2012, 7, e52231. [Google Scholar] [CrossRef] [PubMed]
  50. Li, Q.; Zhu, F.; Chen, P. Mir-7 and mir-218 epigenetically control tumor suppressor genes rassf1a and claudin-6 by targeting hoxb3 in breast cancer. Biochem. Biophys. Res. Commun. 2012, 424, 28–33. [Google Scholar] [CrossRef] [PubMed]
  51. Beckedorff, F.C.; Ayupe, A.C.; Crocci-Souza, R.; Amaral, M.S.; Nakaya, H.I.; Soltys, D.T.; Menck, C.F.; Reis, E.M.; Verjovski-Almeida, S. The intronic long noncoding rna anrassf1 recruits prc2 to the rassf1a promoter, reducing the expression of rassf1a and increasing cell proliferation. PLoS Genet. 2013, 9, e1003705. [Google Scholar] [CrossRef] [PubMed] [Green Version]
  52. Zhao, L.D.; Zheng, W.W.; Wang, G.X.; Kang, X.C.; Qin, L.; Ji, J.J.; Hao, S. Epigenetic silencing of mir-181b contributes to tumorigenicity in colorectal cancer by targeting rassf1a. Int. J. Oncol. 2016, 48, 1977–1984. [Google Scholar] [CrossRef] [PubMed]
  53. Steinmann, K.; Sandner, A.; Schagdarsurengin, U.; Dammann, R.H. Frequent promoter hypermethylation of tumor-related genes in head and neck squamous cell carcinoma. Oncol. Rep. 2009, 22, 1519–1526. [Google Scholar] [PubMed]
  54. Google Patents. Available online: http://www.Google.Com/patents/us20110152339 (accessed on 1 June 2016).
  55. Google Patents. Available online: http://www.Google.Fm/patents/cn101512014b?Cl=fr (accessed on 1 June 2016).
  56. Biometrx. Available online: http://www.Biometrxllc.Com/our-products (accessed on 1 June 2016).
  57. Delaney, C.; Garg, S.K.; Yung, R. Analysis of DNA methylation by pyrosequencing. Methods Mol. Biol. 2015, 1343, 249–264. [Google Scholar] [PubMed]
  58. Radonic, A.; Thulke, S.; Mackay, I.M.; Landt, O.; Siegert, W.; Nitsche, A. Guideline to reference gene selection for quantitative real-time pcr. Biochem. Biophys. Res. Commun. 2004, 313, 856–862. [Google Scholar] [CrossRef] [PubMed]
  59. The Cancer Genome Atlas. Available online: http://cancergenome.Nih.Gov/ (accessed on 20 August 2014).
Figure 1. RASSF1A CpG island map and the PyroMark assays. (a) Part of the RASSF1A CpG island, as predicted by MethPrimer [21]. CpG sites are indicated by red strikes. Pyrosequencing assay coverage is shown as black lines. The start codon is indicated by an arrow. (b) RASSF1A bisulfite-modified DNA sequence with the studied CpGs and primer locations. The start codon is indicated by a black rectangle. Twenty CpGs interrogated by Assay 1 are highlighted in green; the 12 CpG of Assay 2 are highlighted in orange.
Cancers 08 00055 g001
Figure 2. Correlation analysis of RASSF1A promoter methylation at the individual CpG site with the average methylation percentage of 32 CpGs in cell lines; n = 34 for CpG1, 10 and 18; n = 125 for CpG26 and 28 (a), breast cancer, n = 73 (b), colorectal cancer, n = 31 (c) and thyroid cancer, n = 24 (d) patients. The x-axis indicates the average methylation of 32 CpGs in samples. The y-axis indicates the individual CpG methylation percentage measured by pyrosequencing. Methylation of all CpGs correlated well with average methylation (r2 values ranged between 0.7926 for CpG28 and 0.9939 for CpG9 for cell lines; and between 0.5777 for CpG27 and 0.9886 for Cpg7; all p-values are <0.0001). For other CpGs, please see Figure S1a–d.
Cancers 08 00055 g002
Figure 3. RASSF1A promoter methylation percentage of individual CpGs sites in breast cancer patients, n = 73. The individual CpG methylation percentage indicates what percentage of DNA molecules is methylated at this site in the sample. Although the methylation pattern is different in different types of breast cancer, CpG2, 9, 13–14, 16, 19, 26 and 31 are the methylation hotspots in all types of breast cancer, suggesting a conserved methylation mechanism. IBC, inflammatory breast cancer; DCIS, ductal carcinoma in situ; TNBC, triple-negative breast cancer.
Cancers 08 00055 g003
Figure 4. The methylation percentage of the individual CpGs in the RASSF1A promoter in thyroid cancer patients, n = 24 (ac) colorectal cancer patients, n = 26; (d) colorectal cancer liver metastasis, n = 5. The individual CpG methylation percentage indicates what percentage of DNA molecules are methylated at this site in the sample.
Cancers 08 00055 g004
Figure 5. RASSF1A promoter methylation percentage of individual CpGs sites in cell lines. (a) Breast epithelial cell lines considered as normal. (b) Luminal A and Luminal B breast cancer. (c) Her2 overexpressed breast cancer. (d) Triple-negative breast cancer (TNBC). (e) Inflammatory breast cancer (IBC). (f) Colorectal cancer. (g) Neuroblastoma. The individual CpG methylation percentage indicates what percentage of DNA molecules is methylated at this site in the sample.
Cancers 08 00055 g005
Figure 6. RASSF1A expression and methylation in cell lines. (a,b) RASSF1A methylation results in its mRNA expression silencing in cell lines. GAPDH mRNA expression (a) was used to normalize RASSF1A expression, and similar results are obtained if using peptidylprolyl isomerase A as a reference gene (b). (c) p53 status and RASSF1A methylation in cell lines (n = 20 for all except for p53Null cells, where n = 4). Cell lines were separated into groups according to their p53 status and average RASSF1A methylation plotted.
Cancers 08 00055 g006
Figure 7. Correlation of RASSF1A expression with DNMT1 and DNMT3B expression in patient tumors from different cancers. Scatterplot of the expression values (log2[RSEM+1]) of RASSF1A (horizontal) and (a) DNMT1 or (b) DNMT3B (vertical) for primary tumors from TCGA (The Cancer Genome Atlas) breast cancer (n = 1062), colorectal adenocarcinoma (n = 286), lung adenocarcinoma (n = 488) and pancreatic adenocarcinoma (n = 178) patient samples. Lines indicate linear regression; Spearman’s correlation coefficients and associated p-values are displayed in the bottom right corners.
Cancers 08 00055 g007aCancers 08 00055 g007b
Figure 8. MOAP-1 expression and its correlation with RASSF1A expression in different cancers. (a) MOAP-1 expression in different cancers (red) compared to normal (blue). TPB, TATA-binding protein. (b) Scatterplot of the expression values (normalized to GAPDH) of RASSF1A and MOAP-1 for thyroid (n = 55), breast (n = 77) and colorectal cancer (n = 31) patients. (c) Scatterplot of the expression values (log2[RSEM+1]) of RASSF1A (horizontal) and MOAP-1 (vertical) for primary tumors from TCGA breast cancer (n = 1062), colorectal adenocarcinoma (n = 286), lung adenocarcinoma (n = 488) and pancreatic adenocarcinoma (n = 178), patient samples. In (b,c), lines indicate linear regression; Spearman’s correlation coefficients and associated p-values are displayed in the bottom right corners.
Cancers 08 00055 g008aCancers 08 00055 g008b
Figure 9. Correlation of RASSF1A expression with RASSF1C expression in cancers. (a) Scatterplot of the expression values (log2[RSEM+1]) of RASSF1A and RASSF1C for primary tumors from TCGA breast cancer (n = 1062), colorectal adenocarcinoma (n = 286), lung adenocarcinoma (n = 488) and pancreatic adenocarcinoma (n = 178) patient samples. Lines indicate linear regression; Spearman’s correlation coefficients and associated p-values are displayed in the bottom right corners. (b) In breast, thyroid and colon cancer patients, RASSF1A and RASSF1C expressions were summed and the percentage of RASSF1A and RASSF1C expression calculated for each patient. Mean ± SD percentages are presented. For most breast cancers subtypes, n = 11–21; for thyroid cancer subtypes, n = 8–13; for colorectal cancers subtypes, CRC, n = 26; and liver metastasis, n = 5. Normal epithelial tissue was obtained from breast reduction surgery patients (n = 13) and used as normal tissue values for all three cancers. Expression of 1A has been shown on The Protein Atlas [44] and Genecards [45] databases to be comparable in these three tissue types.
Cancers 08 00055 g009aCancers 08 00055 g009b
Table 1. Primer sequences for the pyrosequencing and qRT-PCR.
Assay Primer Sequence 5’-3’
Pyrosequencing
Assay 1 (20 CpGs)ForwardGGATGTGGGGATTTTTTTTTTTTAGTATAG
ReverseBiotin-ACTTCAACCCCTCCCCCAAAA
Sequencing TTTTTTAGTATAGTAAAGTTGGT
Assay 2 (12 CpGs) ForwardTTTCGGGTTTTATAGTTTTTGTATTTAGGT
ReverseBiotin-ACTCCCGCAACTCAATAAACTCAAACTC
Sequencing TTTAGTAGTTTAGTTTGGATTTTGG
MOAP1 ForwardGAGTGTTAGTTAGAGTTTAGGGGAGTTT
ReverseBiotin-CTCACCCCTCCCAACCCT
Sequencing AGGGGAGTTTGTTTT
qRT-PCR
GAPDH ForwardCATGACAACTTTGGTATCGTG
ReverseGTGTCGCTGTTGAAGTCAGA
RASSF1aForwardCCTCTGTGGCGACTTCATCTG
ReverseCAACAGTCCAGGCAGACGAG
MOAP-1ForwardCTCAATTGCTCCTCTCTGTACC
ReverseCATGACAACTTTGGTATCGTG
RASSF1cForwardGCTACTGCAGCCAAGAGGAC
ReverseAGGTGTCTCCCACTCCACAG
PPIAForwardGCCGAGGAAAACCGTGTACT
ReverseTGTCTGCAAACAGCTCAAAGG

